Embed Size (px)
Citation preview

UNITED STATESSECURITIES AND EXCHANGE COMMISSION
WASHINGTON, DC 20549
FORM 8-KCURRENT REPORT PURSUANT TO
SECTION 13 OR 15(d) OF THESECURITIES EXCHANGE ACT OF 1934
Date of report (Date of earliest event reported): October 24, 2017
McDONALD’S CORPORATION(Exact Name of Registrant as Specified in Charter)
Delaware 1-5231 36-2361282(State or Other Jurisdiction
of Incorporation) (CommissionFile Number)
(IRS EmployerIdentification No.)
One McDonald’s PlazaOak Brook, Illinois
(Address of Principal Executive Offices)
60523(Zip Code)
(630) 623-3000(Registrant’s telephone number, including area code)
Not Applicable(Former Name or Former Address, if Changed Since Last Report)
Check the appropriate box below if the Form 8-K filing is intended to simultaneously satisfy the filing obligation of the registrant under any of the followingprovisions ( see General Instruction A.2. below):
o Written communications pursuant to Rule 425 under the Securities Act (17 CFR 230.425)
o Soliciting material pursuant to Rule 14a-12 under the Exchange Act (17 CFR 240.14a-12)
o Pre-commencement communications pursuant to Rule 14d-2(b) under the Exchange Act (17 CFR 240.14d-2(b))
o Pre-commencement communications pursuant to Rule 13e-4(c) under the Exchange Act (17 CFR 240.13e-4(c))
Indicate by check mark whether the registrant is an emerging growth company as defined in Rule 405 of the Securities Act of 1933 (§230.405 of this chapter) orRule 12b-2 of the Securities Exchange Act of 1934 (§240.12b-2 of this chapter).
Emerging growth company o
If an emerging growth company, indicate by check mark if the registrant has elected not to use the extended transition period for complying with anynew or revised financial accounting standards provided pursuant to Section 13(a) of the Exchange Act.
o

Item 2.02. Results of Operations and Financial Condition.On October 24, 2017 , McDonald’s Corporation (the “Company”) issued an investor release reporting the Company’s results for the third quarter and nine
months ended September 30, 2017 . A copy of the related investor release is being filed as Exhibit 99.1 to this Form 8-K and is incorporated by reference in itsentirety. Also filed herewith and incorporated by reference as Exhibit 99.2 is supplemental information for the quarter and nine months ended September 30, 2017 .The information under this Item 2.02, including such Exhibits, shall be deemed to be “filed” for purposes of the Securities Exchange Act of 1934, as amended.
Item 9.01. Financial Statements and Exhibits.
(d) Exhibits .
99.1 Investor Release of McDonald's Corporation issued October 24, 2017: McDonald's Reports Third Quarter 2017 Results
99.2 McDonald's Corporation: Supplemental Information (Unaudited), Quarter and Nine Months Ended September 30, 2017

SIGNATURES
Pursuant to the requirements of the Securities Exchange Act of 1934, the registrant has duly caused this report to be signed on its behalf by the undersignedhereunto duly authorized.
McDONALD’S CORPORATION (Registrant)Date: October 24, 2017 By: /s/ Catherine Hoovel Catherine Hoovel Corporate Vice President - Chief Accounting Officer
Exhibit 99.1
FOR IMMEDIATE RELEASE FOR MORE INFORMATION CONTACT:10/24/2017 Investors: Mike Flores, 630-623-3519
Media: Terri Hickey, 630-623-5593
McDONALD'S REPORTS THIRD QUARTER 2017 RESULTS
OAK BROOK, IL - McDonald's Corporation today announced results for the third quarter ended September 30, 2017 .“We are serving more customers, more often by offering great tasting food at a good value with the quick service and friendly hospitality they expect from
McDonald’s,” said McDonald’s President and Chief Executive Officer Steve Easterbrook. “Our positive comparable sales and guest counts across all of ouroperating segments during the third quarter demonstrate broad-based momentum throughout our business that builds upon our strong first half of 2017.”Third quarter highlights:
• Global comparable sales increased 6.0% , reflecting positive guest counts in all segments• Due to the impact of the Company's strategic refranchising initiative, consolidated revenues decreased 10% ( 12% in constant currencies)• Systemwide sales increased 7% in constant currencies, due to strong comparable sales performance and restaurant expansion• Consolidated operating income increased 44% ( 42% in constant currencies), which benefited from a gain of approximately $850 million on the sale of
the Company's businesses in China and Hong Kong. Excluding the impact of the gain, as well as unrelated strategic charges, consisting of currentquarter and prior year restructuring and non-cash impairment charges in connection with the Company's global G&A and refranchising initiatives,consolidated operating income increased 5% (3% in constant currencies), primarily due to strong comparable sales performance across all segments
• Diluted earnings per share of $2.32 increased 55% ( 53% in constant currencies). Excluding the impact of the current year gain and these unrelatedstrategic charges, which total $0.56 per share, diluted earnings per share was $1.76. Excluding these 2017 items as well as the $0.12 per share of prioryear strategic charges, the Company's diluted earnings per share increased 9% (7% in constant currencies)
• Returned $2.9 billion to shareholders through share repurchases and dividends. In addition, the Company announced a 7% increase in its quarterlydividend to $1.01 beginning in the fourth quarter, demonstrating management's continued confidence in the Company's performance
In the U.S., third quarter comparable sales increased 4.1%, reflecting the national beverage and McPick 2 value promotions, along with the continued successof the Signature Crafted premium sandwich platform. Operating income for the quarter increased 6%, reflecting higher sales-driven franchised margin dollars andG&A savings.
Comparable sales for the International Lead segment increased 5.7% for the quarter, led by continued momentum in the U.K. and Canada, as well as positiveresults across all other markets. The segment’s operating income increased 21% (17% in constant currencies), fueled by sales-driven improvements in franchisedmargin dollars.
In the High Growth segment, third quarter comparable sales increased 6.2%, led by strong performance in China and positive results across the majority ofthe segment. The segment’s operating income for the quarter included a gain of approximately $850 million related to the refranchising of China and Hong Kong,partly offset by unrelated non-cash impairment charges. Excluding these items, the segment's operating income for the quarter increased 7% (3% in constantcurrencies), reflecting higher sales-driven margin dollars.
In the Foundational markets, third quarter comparable sales rose 10.2%, reflecting positive sales performance across all geographic regions. For the segment,operating income decreased due to the Company's refranchising initiatives and higher restaurant technology spending, partly offset by the benefit from comparisonto the prior year's strategic charges.
“During the quarter, we refranchised our businesses in China and Hong Kong, reaching our target to refranchise 4,000 restaurants more than a year ahead ofschedule,” said McDonald’s Chief Financial Officer, Kevin Ozan. “Completing this transaction brings us closer to the customers and communities we serve inthese markets and creates a better opportunity to unlock their full growth potential. Our
1

more heavily franchised structure will continue to drive shareholder value by providing a more stable revenue and income stream with higher returns on investedcapital.”
Steve Easterbrook concluded, “Our Velocity Growth Plan is the right strategy for McDonald’s to achieve long-term, profitable growth and we are on track tosucceed with our commitment and focus on execution. We’ve made progress in many areas of our business already, including optimizing our restaurant ownershipmix and running better restaurants. At the same time, we also are making strides with initiatives such as delivery, mobile order and pay, as well as the Experienceof the Future transformation of our restaurants that will make the experience more convenient, personalized and enjoyable for our customers.”
2

KEY HIGHLIGHTS - CONSOLIDATEDDollars in millions, except per share data
Quarters Ended September 30, Nine Months Ended September 30,
2017 2016 Inc/ (Dec)
Inc/ (Dec)ExcludingCurrency
Translation 2017 2016 Inc/ (Dec)
Inc/ (Dec)ExcludingCurrency
Translation
Revenues $ 5,754.6 $ 6,424.1 (10)% (12)% $ 17,480.2 $ 18,593.0 (6)% (6)%Operating income 3,079.4 2,137.3 44 42 7,408.5 5,775.5 28 29Net income 1,883.7 1,275.4 48 47 4,493.6 3,493.1 29 30Earnings per share-diluted $ 2.32 $ 1.50 55 % 53 % $ 5.48 $ 4.01 37 % 38 %
Results for the quarter and nine months reflected stronger operating performance and G&A savings. The nine months also benefited from lower depreciationexpense, primarily in China and Hong Kong, that in accordance with Held for Sale accounting rules ceased recording depreciation, and improved performance inJapan.
In addition, results for both periods benefited from the Company's sale of its businesses in China and Hong Kong, which closed on July 31, 2017. TheCompany recorded a pre-tax gain of approximately $850 million related to this sale. For the quarter, this gain was partially offset by $111 million of unrelated pre-tax non-cash impairment charges. Results for 2016 included pre-tax strategic charges of $128 million for the quarter and $357 million for the nine months,consisting primarily of charges related to the Company's global G&A and refranchising initiatives. Excluding the impact of these current year and prior year items,diluted earnings per share increased 9% (7% in constant currencies) for the quarter, and 15% (16% in constant currencies) for the nine months.
Foreign currency translation had a positive impact of $0.02 on diluted earnings per share for the quarter and a negative impact of $0.04 for the nine months .
THE FOLLOWING DEFINITIONS APPLY TO THESE TERMS AS USED THROUGHOUT THIS RELEASEComparable sales represent sales at all restaurants and comparable guest counts represent the number of transactions at all restaurants, whether operated by
the Company or by franchisees, in operation at least thirteen months including those temporarily closed. Some of the reasons restaurants may be temporarily closedinclude reimaging or remodeling, rebuilding, road construction and natural disasters. Comparable sales exclude the impact of currency translation. Comparablesales are driven by changes in guest counts and average check, which is affected by changes in pricing and product mix. Typically, pricing has a greater impact onaverage check than product mix. Management reviews the increase or decrease in comparable sales and comparable guest counts compared with the same period inthe prior year to assess business trends.
Systemwide sales include sales at all restaurants, whether operated by the Company or by franchisees. While franchised sales are not recorded as revenues bythe Company, management believes the information is important in understanding the Company's financial performance, because these sales are the basis on whichthe Company calculates and records franchised revenues and are indicative of the financial health of the franchisee base.
Information in constant currency is calculated by translating current year results at prior year average exchange rates. Management reviews and analyzesbusiness results excluding the effect of foreign currency translation and bases incentive compensation plans on these results because they believe this betterrepresents the Company's underlying business trends.RELATED COMMUNICATIONS
This press release should be read in conjunction with Exhibit 99.2 in the Company's Form 8-K filing for supplemental information related to the Company'sresults for the quarter and nine months ended September 30, 2017 .
McDonald’s Corporation will broadcast its investor earnings conference call live over the Internet at 10:00 a.m. (Central Time) on October 24, 2017 . A linkto the live webcast will be available at www.investor.mcdonalds.com . There will also be an archived webcast available for a limited time thereafter.
Kevin Ozan, McDonald's Chief Financial Officer, will participate in the Morgan Stanley Global Consumer & Retail Conference at 8:00 a.m. (Eastern Time)on November 15, 2017. This presentation will be webcast live and available for replay for a limited time thereafter at www.investor.mcdonalds.com .
McDonald’s plans to release fourth quarter results before the market opens on January 30, 2018 and will host an investor webcast. This webcast will bebroadcast live and available for replay for a limited time thereafter at www.investor.mcdonalds.com .ABOUT McDONALD’S
McDonald’s is the world’s leading global foodservice retailer with approximately 37,000 locations in over 100 countries. Over 90% of McDonald’srestaurants worldwide are owned and operated by independent local business men and women.
3

FORWARD-LOOKING STATEMENTSThis release contains certain forward-looking statements, which reflect management's expectations regarding future events and operating performance and
speak only as of the date hereof. These forward-looking statements involve a number of risks and uncertainties. The factors that could cause actual results to differmaterially from our expectations are detailed in the Company’s filings with the Securities and Exchange Commission, including the risk factors discussed inExhibit 99.2 in the Company’s Form 8-K filing on October 24, 2017 . The Company undertakes no obligation to update such forward-looking statements, except asmay otherwise be required by law.
4

McDONALD'S CORPORATIONCONDENSED CONSOLIDATED STATEMENT OF INCOME (UNAUDITED)
Dollars and shares in millions, except per share data
Quarters Ended September 30, 2017 2016 Inc/ (Dec)
Revenues Sales by Company-operated restaurants $ 3,064.3 $ 3,972.1 $ (907.8) (23)%Revenues from franchised restaurants 2,690.3 2,452.0 238.3 10 TOTAL REVENUES 5,754.6 6,424.1 (669.5) (10) Operating costs and expenses Company-operated restaurant expenses 2,479.8 3,239.5 (759.7) (23)Franchised restaurants-occupancy expenses 457.3 437.6 19.7 4Selling, general & administrative expenses 567.0 582.9 (15.9) (3)Other operating (income) expense, net (828.9) 26.8 (855.7) n/mTotal operating costs and expenses 2,675.2 4,286.8 (1,611.6) (38) OPERATING INCOME 3,079.4 2,137.3 942.1 44 Interest expense 236.7 221.4 15.3 7Nonoperating (income) expense, net 23.2 11.4 11.8 n/m Income before provision for income taxes 2,819.5 1,904.5 915.0 48Provision for income taxes 935.8 629.1 306.7 49 NET INCOME $ 1,883.7 $ 1,275.4 $ 608.3 48 % EARNINGS PER SHARE-DILUTED $ 2.32 $ 1.50 $ 0.82 55 % Weighted average shares outstanding-diluted 813.5 847.7 (34.2) (4)%
n/m Not meaningful
5

McDONALD'S CORPORATIONCONDENSED CONSOLIDATED STATEMENT OF INCOME (UNAUDITED)
Dollars and shares in millions, except per share data
Nine Months Ended September 30, 2017 2016 Inc/ (Dec)
Revenues Sales by Company-operated restaurants $ 10,045.8 $ 11,642.2 $ (1,596.4) (14)%Revenues from franchised restaurants 7,434.4 6,950.8 483.6 7 TOTAL REVENUES 17,480.2 18,593.0 (1,112.8) (6) Operating costs and expenses Company-operated restaurant expenses 8,199.5 9,662.9 (1,463.4) (15)Franchised restaurants-occupancy expenses 1,325.4 1,283.6 41.8 3Selling, general & administrative expenses 1,613.7 1,757.0 (143.3) (8)Other operating (income) expense, net (1,066.9) 114.0 (1,180.9) n/mTotal operating costs and expenses 10,071.7 12,817.5 (2,745.8) (21) OPERATING INCOME 7,408.5 5,775.5 1,633.0 28 Interest expense 686.2 663.6 22.6 3Nonoperating (income) expense, net 33.9 (19.2) 53.1 n/m Income before provision for income taxes 6,688.4 5,131.1 1,557.3 30Provision for income taxes 2,194.8 1,638.0 556.8 34 NET INCOME $ 4,493.6 $ 3,493.1 $ 1,000.5 29 % EARNINGS PER SHARE-DILUTED $ 5.48 $ 4.01 $ 1.47 37 % Weighted average shares outstanding-diluted 819.4 871.8 (52.4) (6)%
n/m Not meaningful
6

Exhibit 99.2
McDonald's CorporationSupplemental Information (Unaudited)
Quarter and Nine Months Ended September 30, 2017
Impact of Foreign Currency Translation 1 Sale of McDonald's Businesses in China and Hong Kong 1 Net Income and Diluted Earnings per Share 1 Revenues 2 Comparable Sales and Guest Counts 3 Systemwide Sales and Franchised Sales 4 Restaurant Margins 5 Selling, General & Administrative Expenses 6 Other Operating (Income) Expense, Net 6 Operating Income 7 Interest Expense 7 Nonoperating (Income) Expense, Net 8 Income Taxes 8 Outlook 8 Restaurant Information 9 Risk Factors and Cautionary Statement Regarding Forward-Looking Statements 11

SUPPLEMENTAL INFORMATIONThe purpose of this exhibit is to provide additional information related to the results of McDonald's Corporation (the “Company”) for the quarter and nine
months ended September 30, 2017 . This exhibit should be read in conjunction with Exhibit 99.1 .Management reviews and analyzes business results excluding the effect of foreign currency translation, as well as impairment and other strategic charges and
gains, and bases incentive compensation plans on these results, because the Company believes this better represents underlying business trends.
Impact of Foreign Currency TranslationWhile changes in foreign currency exchange rates affect reported results, McDonald's mitigates exposures, where practical, by purchasing goods and services
in local currencies, financing in local currencies and hedging certain foreign-denominated cash flows. Results excluding the effect of foreign currency translation(also referred to as constant currency) are calculated by translating current year results at prior year average exchange rates.
IMPACT OF FOREIGN CURRENCY TRANSLATIONDollars in millions, except per share data
Currency
TranslationBenefit/ (Cost)
Quarters Ended September 30, 2017 2016 2017 Revenues $ 5,754.6 $ 6,424.1 $ 114.1Company-operated margins 584.5 732.6 15.7Franchised margins 2,233.0 2,014.4 29.9Selling, general & administrative expenses 567.0 582.9 (6.5)Operating income 3,079.4 2,137.3 36.3Net income 1,883.7 1,275.4 13.6Earnings per share-diluted $ 2.32 $ 1.50 $ 0.02
Currency
TranslationBenefit/ (Cost)
Nine Months Ended September 30, 2017 2016 2017 Revenues $ 17,480.2 $ 18,593.0 $ (4.4)Company-operated margins 1,846.3 1,979.3 (3.5)Franchised margins 6,109.0 5,667.2 (29.5)Selling, general & administrative expenses 1,613.7 1,757.0 1.7Operating income 7,408.5 5,775.5 (38.1)Net income 4,493.6 3,493.1 (30.0)Earnings per share-diluted $ 5.48 $ 4.01 $ (0.04)
The positive impact of foreign currency translation on consolidated operating results for the quarter primarily reflected the stronger Euro. The negativeimpact for the nine months primarily reflected the weaker British Pound.
Sale of McDonald's Businesses in China and Hong KongAs previously announced, the Company completed the sale of its businesses in China and Hong Kong on July 31, 2017, comprising over 2,700 restaurants.
The Company recorded a pre-tax gain of approximately $850 million reflecting the difference between $1.6 billion of cash proceeds and the net book value of thebusinesses. The gain also includes an increase to fair value of the retained 20% ownership in the entity that owns the businesses.
Subsequent to the transaction, the Company is realizing its proportionate share of the entity's income. In addition, revenues have shifted from a combinationof sales by Company-operated restaurants and franchised rent and royalty to franchised royalty only. The Company is now reporting the results for China andHong Kong, as well as classifying related sales and restaurants, as affiliated.
Net Income and Diluted Earnings per ShareFor the quarter, net income increased 48% ( 47% in constant currencies) to $1,883.7 million , and diluted earnings per share increased 55% ( 53% in constant
currencies) to $2.32 . Foreign currency translation had a positive impact of $0.02 on diluted earnings per share.
1

For the nine months , net income increased 29% ( 30% in constant currencies) to $4,493.6 million , and diluted earnings per share increased 37% ( 38% inconstant currencies) to $5.48 . Foreign currency translation had a negative impact of $0.04 on diluted earnings per share.
Results for the quarter and nine months reflected stronger operating performance and G&A savings. The nine months also benefited from lower depreciationexpense, primarily in China and Hong Kong, that in accordance with Held for Sale accounting rules ceased recording depreciation, and improved performance inJapan.
In addition, results for both periods benefited from the Company's sale of its businesses in China and Hong Kong, which closed on July 31, 2017. TheCompany recorded a pre-tax gain of approximately $850 million related to this sale. For the quarter, this gain was partially offset by $111 million of unrelated pre-tax non-cash impairment charges. Results for 2016 included pre-tax strategic charges of $128 million for the quarter and $357 million for the nine months,consisting primarily of charges related to the Company's global G&A and refranchising initiatives. Excluding the impact of these current year and prior year items,diluted earnings per share increased 9% (7% in constant currencies) for the quarter, and 15% (16% in constant currencies) for the nine months.
Diluted earnings per share for both periods benefited from a decrease in diluted weighted average shares outstanding due to share repurchases. During thequarter, the Company repurchased 13.8 million shares of stock for $2.2 billion , bringing total purchases for the nine months to 27.3 million shares or $4.0 billion .In addition, the Company paid a quarterly dividend of $0.94 per share, or $755.3 million , bringing the total dividends paid for the nine months to $2.3 billion .
RevenuesRevenues consist of sales by Company-operated restaurants and fees from restaurants operated by franchisees. Revenues from conventional franchised
restaurants include rent and royalties based on a percent of sales with minimum rent payments, and initial fees. Revenues from franchised restaurants that arelicensed to affiliates and developmental licensees include a royalty based on a percent of sales and generally include initial fees.
The Company accelerated the pace of refranchising to optimize its restaurant ownership mix, generate more stable and predictable revenue and cash flowstreams, and operate with a less resource-intensive structure. The shift to a greater percentage of franchised restaurants negatively impacts consolidated revenues asCompany-operated sales are replaced by franchised revenues, where the Company receives rent and/or royalty revenue based on a percentage of sales.
REVENUESDollars in millions
Quarters Ended September 30, 2017 2016 Inc/ (Dec)
Inc/ (Dec)ExcludingCurrency
Translation
Company-operated sales
U.S. $ 798.7 $ 910.3 (12)% (12)%International Lead Markets 1,076.3 1,098.8 (2) (5)High Growth Markets 1,054.9 1,441.5 (27) (30)Foundational Markets & Corporate 134.4 521.5 (74) (75)
Total $ 3,064.3 $ 3,972.1 (23)% (25)%
Franchised revenues
U.S. $ 1,224.6 $ 1,162.2 5 % 5 %International Lead Markets 894.2 782.4 14 10High Growth Markets 267.2 209.8 27 23Foundational Markets & Corporate 304.3 297.6 2 3
Total $ 2,690.3 $ 2,452.0 10 % 8 %
Total revenues
U.S. $ 2,023.3 $ 2,072.5 (2)% (2)%International Lead Markets 1,970.5 1,881.2 5 1High Growth Markets 1,322.1 1,651.3 (20) (23)Foundational Markets & Corporate 438.7 819.1 (46) (47)
Total $ 5,754.6 $ 6,424.1 (10)% (12)%
2

Nine Months Ended September 30, 2017 2016 Inc/ (Dec)
Inc/ (Dec)ExcludingCurrency
Translation
Company-operated sales
U.S. $ 2,483.8 $ 2,852.0 (13)% (13)%International Lead Markets 3,038.9 3,250.7 (7) (4)High Growth Markets 3,859.5 4,063.5 (5) (7)Foundational Markets & Corporate 663.6 1,476.0 (55) (56)
Total $ 10,045.8 $ 11,642.2 (14)% (14)%
Franchised revenues
U.S. $ 3,516.9 $ 3,363.2 5 % 5 %International Lead Markets 2,388.3 2,201.8 8 9High Growth Markets 679.0 580.6 17 17Foundational Markets & Corporate 850.2 805.2 6 8
Total $ 7,434.4 $ 6,950.8 7 % 7 %
Total revenues
U.S. $ 6,000.7 $ 6,215.2 (3)% (3)%International Lead Markets 5,427.2 5,452.5 0 1High Growth Markets 4,538.5 4,644.1 (2) (4)Foundational Markets & Corporate 1,513.8 2,281.2 (34) (34)
Total $ 17,480.2 $ 18,593.0 (6)% (6)% • Revenues:Revenues decreased 10% ( 12% in constant currencies) for the quarter and decreased 6% ( 6% in constant currencies) for the nine months .
• U.S.:Revenues decreased for both periods as positive comparable sales were more than offset by the impact of refranchising.• InternationalLeadMarkets:Revenues increased for the quarter due to positive comparable sales across all markets, partly offset by the impact of
refranchising. For the nine months, revenues were flat as the benefit from positive comparable sales was offset by foreign currency translation and theimpact of refranchising.
• HighGrowthMarkets:Revenues decreased for both periods as positive comparable sales across most markets were more than offset by the impact ofrefranchising businesses in China and Hong Kong.
Comparable Sales and Guest Counts
Comparable sales is a key performance indicator used within the retail industry and is reviewed by management to assess business trends. Increases ordecreases in comparable sales represent the percent change in constant currency sales from the same period in the prior year for all restaurants, whether operated bythe Company or by franchisees, in operation at least thirteen months, including those temporarily closed. Comparable sales are driven by changes in guest countsand average check, which is affected by changes in pricing and product mix. Typically, pricing has a greater impact on average check than product mix.
COMPARABLE SALES
Increase/(Decrease)
Quarters Ended Nine Months Ended
September 30, September 30,
2017 2016 2017 2016
U.S. 4.1% 1.3% 3.3% 2.7%International Lead Markets 5.7 3.3 5.0 3.6High Growth Markets 6.2 1.5 5.7 2.2Foundational Markets & Corporate 10.2 10.1 11.3 9.6
Total 6.0% 3.5% 5.6% 4.2%
On a consolidated basis, comparable guest counts (the number of transactions at all restaurants, whether operated by the Company or by franchisees, inoperation at least thirteen months, including those temporarily closed) increased 2.1% and decreased 0.1% for the nine months ended 2017 and 2016 , respectively.
3

Systemwide Sales and Franchised Sales
The following tables present Systemwide sales growth rates and franchised sales. Systemwide sales include sales at all restaurants, whether operated by theCompany or by franchisees. While franchised sales are not recorded as revenues by the Company, management believes the information is important inunderstanding the Company's financial performance, because these sales are the basis on which the Company calculates and records franchised revenues and areindicative of the financial health of the franchisee base.
SYSTEMWIDE SALES
Quarter Ended Nine Months Ended
September 30, 2017 September 30, 2017
Inc/ (Dec)
Inc/ (Dec) Excluding Currency
Translation Inc/ (Dec)
Inc/ (Dec) Excluding Currency
Translation
U.S. 4% 4% 3% 3%International Lead Markets 11 7 5 6High Growth Markets 14 11 11 10Foundational Markets & Corporate 8 12 10 13
Total 8% 7% 6% 7%
FRANCHISED SALESDollars in millions
Quarters Ended September 30, 2017 2016 Inc/ (Dec)
Inc/ (Dec)ExcludingCurrency
Translation
U.S. $ 8,869.2 $ 8,391.0 6% 6%International Lead Markets 5,175.7 4,534.1 14 10High Growth Markets 2,083.6 1,305.4 60 55Foundational Markets & Corporate 4,876.1 4,126.0 18 23
Total $ 21,004.6 $ 18,356.5 14% 14%
Ownership type Conventional franchised $ 15,611.2 $ 14,650.9 7% 5%Developmental licensed 3,436.5 2,432.8 41% 46%Foreign affiliated 1,956.9 1,272.8 54% 61%
Total $ 21,004.6 $ 18,356.5 14% 14%
Nine Months Ended September 30, 2017 2016 Inc/ (Dec)
Inc/ (Dec)ExcludingCurrency
Translation
U.S. $ 25,574.8 $ 24,356.4 5% 5%International Lead Markets 13,787.1 12,760.8 8 9High Growth Markets 4,709.3 3,636.0 30 29Foundational Markets & Corporate 13,227.8 11,117.8 19 22
Total $ 57,299.0 $ 51,871.0 10% 11% Ownership type Conventional franchised $ 43,856.6 $ 41,881.0 5% 5%Developmental licensed 9,111.2 6,612.4 38% 41%Foreign affiliated 4,331.2 3,377.6 28% 32%
Total $ 57,299.0 $ 51,871.0 10% 11%
4

Restaurant MarginsFRANCHISED AND COMPANY-OPERATED RESTAURANT MARGINSDollars in millions
Percent Amount Inc/ (Dec)ExcludingCurrency
TranslationQuarters Ended September 30, 2017 2016 2017 2016 Inc/ (Dec)
Franchised
U.S. 82.9% 82.7% $ 1,014.9 $ 961.4 6 % 6 %International Lead Markets 81.6 81.2 729.5 635.4 15 11High Growth Markets 76.0 71.6 203.1 150.1 35 30Foundational Markets & Corporate 93.8 89.8 285.5 267.5 7 8
Total 83.0% 82.1% $ 2,233.0 $ 2,014.4 11 % 9 %Company-operated
U.S. 15.5% 16.9% $ 124.2 $ 153.9 (19)% (19)%International Lead Markets 21.9 21.6 235.5 237.9 (1) (4)High Growth Markets 18.5 17.0 195.5 245.2 (20) (24)Foundational Markets & Corporate 21.8 18.4 29.3 95.6 (69) (70)
Total 19.1% 18.4% $ 584.5 $ 732.6 (20)% (22)% Percent Amount
Inc/ (Dec)ExcludingCurrency
TranslationNine Months Ended September 30, 2017 2016 2017 2016 Inc/ (Dec)
Franchised
U.S. 82.4% 82.7% $ 2,898.9 $ 2,779.7 4 % 4 %International Lead Markets 80.7 80.2 1,927.5 1,765.8 9 10High Growth Markets 72.8 69.9 494.4 406.0 22 22Foundational Markets & Corporate 92.7 88.9 788.2 715.7 10 12
Total 82.2% 81.5% $ 6,109.0 $ 5,667.2 8 % 8 %Company-operated
U.S. 15.8% 15.9% $ 392.3 $ 454.4 (14)% (14)%International Lead Markets 21.2 20.7 643.2 673.2 (4) (2)High Growth Markets 17.9 15.3 689.6 623.4 11 9Foundational Markets & Corporate 18.3 15.5 121.2 228.3 (47) (48)
Total 18.4% 17.0% $ 1,846.3 $ 1,979.3 (7)% (7)%
• Franchised:Franchised margin dollars increased $218.6 million or 11% ( 9% in constant currencies) for the quarter and increased $441.8 million or 8% (8% in constant currencies) for the nine months . Both periods benefited from expansion and the impact of refranchising, as well as positive comparable salesperformance across all segments.• U.S.:The franchised margin percent increased for the quarter and decreased for the nine months. Positive comparable sales contributed to both periods,
but for the nine months was more than offset by higher occupancy costs.• InternationalLeadMarkets:The increase in the franchised margin percent for the quarter and nine months primarily reflected the benefit from strong
comparable sales performance, partly offset by the impact of refranchising.• HighGrowthMarkets:The increase in the franchised margin percent for the quarter and nine months was due to the impact of refranchising, largely
related to the China and Hong Kong transaction, and strong comparable sales performance.• Company-operated:Company-operated margin dollars decreased $148.1 million or 20% ( 22% in constant currencies) for the quarter and decreased $133.0
million or 7% ( 7% in constant currencies) for the nine months , reflecting the impact of refranchising. The quarter and nine months benefited byapproximately $12 million and $94 million, respectively, due to ceasing depreciation on assets considered Held for Sale, primarily in China and Hong Kong.• U.S.:The Company-operated margin percent decreased for the quarter and nine months . Both periods reflected strong comparable sales and higher
labor costs, while the quarter also reflected higher commodity costs.• InternationalLeadMarkets:The increase in the Company-operated margin percent for the quarter and nine months was primarily due to strong
comparable sales, partly offset by higher labor costs, occupancy costs and commodity costs.• HighGrowthMarkets:The increase in the Company-operated margin percent for the quarter and nine months was largely due to strong comparable
sales and the benefit from the lower depreciation in China and Hong Kong. This increase was partly offset by the impact of refranchising.
5
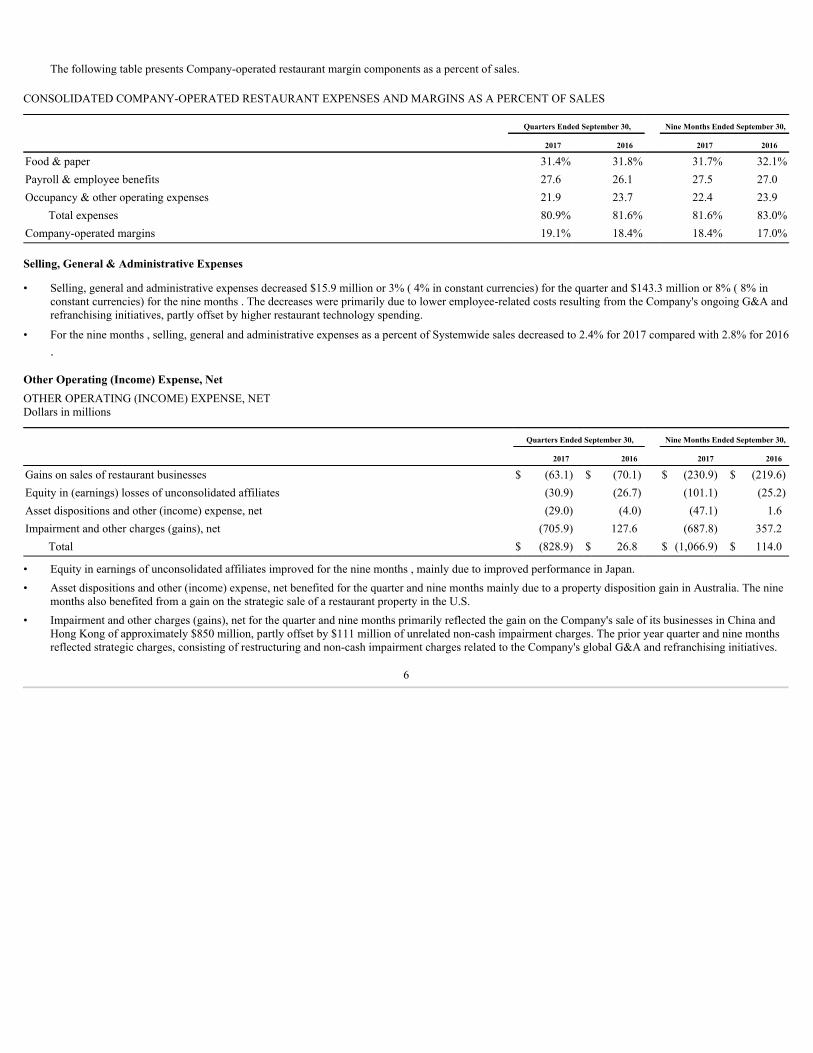
The following table presents Company-operated restaurant margin components as a percent of sales.
CONSOLIDATED COMPANY-OPERATED RESTAURANT EXPENSES AND MARGINS AS A PERCENT OF SALES
Quarters Ended September 30, Nine Months Ended September 30,
2017 2016 2017 2016
Food & paper 31.4% 31.8% 31.7% 32.1%Payroll & employee benefits 27.6 26.1 27.5 27.0Occupancy & other operating expenses 21.9 23.7 22.4 23.9
Total expenses 80.9% 81.6% 81.6% 83.0%Company-operated margins 19.1% 18.4% 18.4% 17.0%
Selling, General & Administrative Expenses
• Selling, general and administrative expenses decreased $15.9 million or 3% ( 4% in constant currencies) for the quarter and $143.3 million or 8% ( 8% inconstant currencies) for the nine months . The decreases were primarily due to lower employee-related costs resulting from the Company's ongoing G&A andrefranchising initiatives, partly offset by higher restaurant technology spending.
• For the nine months , selling, general and administrative expenses as a percent of Systemwide sales decreased to 2.4% for 2017 compared with 2.8% for 2016.
Other Operating (Income) Expense, NetOTHER OPERATING (INCOME) EXPENSE, NETDollars in millions
Quarters Ended September 30, Nine Months Ended September 30,
2017 2016 2017 2016
Gains on sales of restaurant businesses $ (63.1) $ (70.1) $ (230.9) $ (219.6)Equity in (earnings) losses of unconsolidated affiliates (30.9) (26.7) (101.1) (25.2)Asset dispositions and other (income) expense, net (29.0) (4.0) (47.1) 1.6Impairment and other charges (gains), net (705.9) 127.6 (687.8) 357.2
Total $ (828.9) $ 26.8 $ (1,066.9) $ 114.0
• Equity in earnings of unconsolidated affiliates improved for the nine months , mainly due to improved performance in Japan.• Asset dispositions and other (income) expense, net benefited for the quarter and nine months mainly due to a property disposition gain in Australia. The nine
months also benefited from a gain on the strategic sale of a restaurant property in the U.S.• Impairment and other charges (gains), net for the quarter and nine months primarily reflected the gain on the Company's sale of its businesses in China and
Hong Kong of approximately $850 million, partly offset by $111 million of unrelated non-cash impairment charges. The prior year quarter and nine monthsreflected strategic charges, consisting of restructuring and non-cash impairment charges related to the Company's global G&A and refranchising initiatives.
6
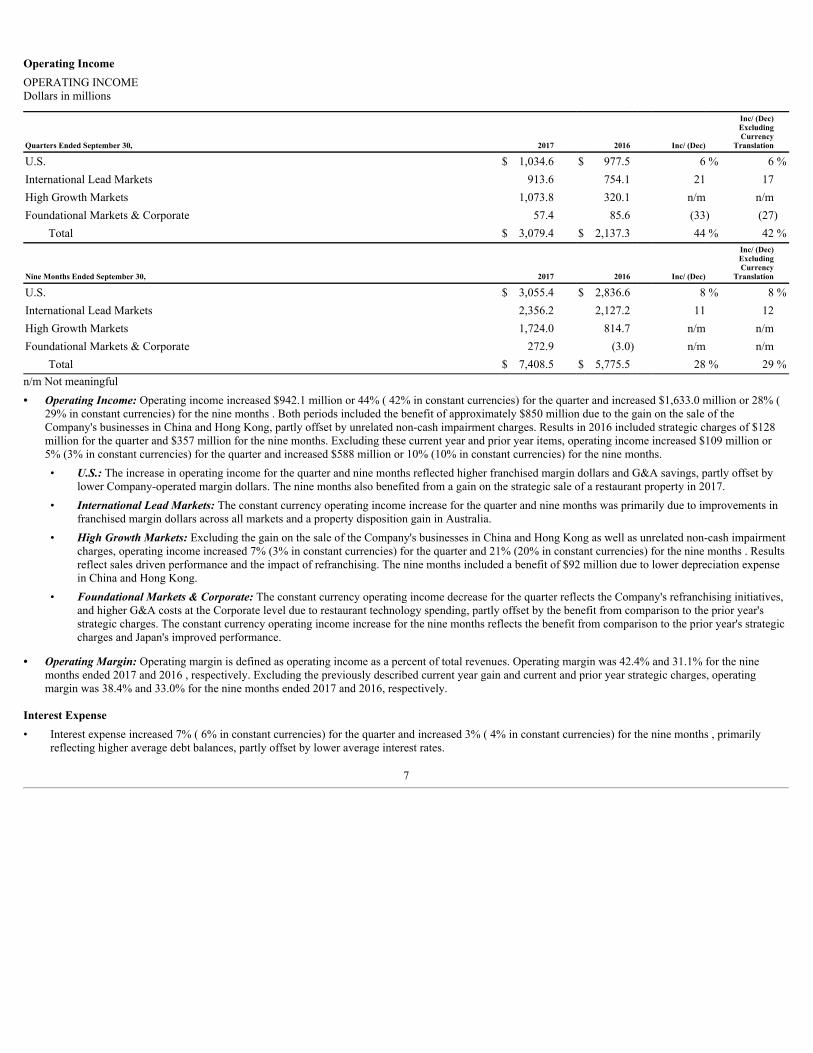
Operating IncomeOPERATING INCOMEDollars in millions
Quarters Ended September 30, 2017 2016 Inc/ (Dec)
Inc/ (Dec)ExcludingCurrency
Translation
U.S. $ 1,034.6 $ 977.5 6 % 6 %International Lead Markets 913.6 754.1 21 17High Growth Markets 1,073.8 320.1 n/m n/mFoundational Markets & Corporate 57.4 85.6 (33) (27)
Total $ 3,079.4 $ 2,137.3 44 % 42 %
Nine Months Ended September 30, 2017 2016 Inc/ (Dec)
Inc/ (Dec)ExcludingCurrency
Translation
U.S. $ 3,055.4 $ 2,836.6 8 % 8 %International Lead Markets 2,356.2 2,127.2 11 12High Growth Markets 1,724.0 814.7 n/m n/mFoundational Markets & Corporate 272.9 (3.0) n/m n/m
Total $ 7,408.5 $ 5,775.5 28 % 29 %n/m Not meaningful• OperatingIncome:Operating income increased $942.1 million or 44% ( 42% in constant currencies) for the quarter and increased $1,633.0 million or 28% (
29% in constant currencies) for the nine months . Both periods included the benefit of approximately $850 million due to the gain on the sale of theCompany's businesses in China and Hong Kong, partly offset by unrelated non-cash impairment charges. Results in 2016 included strategic charges of $128million for the quarter and $357 million for the nine months. Excluding these current year and prior year items, operating income increased $109 million or5% (3% in constant currencies) for the quarter and increased $588 million or 10% (10% in constant currencies) for the nine months.• U.S.:The increase in operating income for the quarter and nine months reflected higher franchised margin dollars and G&A savings, partly offset by
lower Company-operated margin dollars. The nine months also benefited from a gain on the strategic sale of a restaurant property in 2017.• InternationalLeadMarkets:The constant currency operating income increase for the quarter and nine months was primarily due to improvements in
franchised margin dollars across all markets and a property disposition gain in Australia.• HighGrowthMarkets:Excluding the gain on the sale of the Company's businesses in China and Hong Kong as well as unrelated non-cash impairment
charges, operating income increased 7% (3% in constant currencies) for the quarter and 21% (20% in constant currencies) for the nine months . Resultsreflect sales driven performance and the impact of refranchising. The nine months included a benefit of $92 million due to lower depreciation expensein China and Hong Kong.
• FoundationalMarkets&Corporate:The constant currency operating income decrease for the quarter reflects the Company's refranchising initiatives,and higher G&A costs at the Corporate level due to restaurant technology spending, partly offset by the benefit from comparison to the prior year'sstrategic charges. The constant currency operating income increase for the nine months reflects the benefit from comparison to the prior year's strategiccharges and Japan's improved performance.
• OperatingMargin:Operating margin is defined as operating income as a percent of total revenues. Operating margin was 42.4% and 31.1% for the ninemonths ended 2017 and 2016 , respectively. Excluding the previously described current year gain and current and prior year strategic charges, operatingmargin was 38.4% and 33.0% for the nine months ended 2017 and 2016, respectively.
Interest Expense• Interest expense increased 7% ( 6% in constant currencies) for the quarter and increased 3% ( 4% in constant currencies) for the nine months , primarily
reflecting higher average debt balances, partly offset by lower average interest rates.
7

Nonoperating (Income) Expense, NetNONOPERATING (INCOME) EXPENSE, NETDollars in millions
Quarters Ended September 30, Nine Months Ended September30,
2017 2016 2017 2016
Interest income $ (6.5) $ 0.8 $ (6.4) $ (6.0)Foreign currency and hedging activity 15.4 4.5 11.1 (23.2)Other (income) expense, net 14.3 6.1 29.2 10.0
Total $ 23.2 $ 11.4 $ 33.9 $ (19.2)
Income Taxes• The effective income tax rate was 33.2% and 33.0% for the quarters ended 2017 and 2016 , respectively, and 32.8% and 31.9% for the nine months ended
2017 and 2016, respectively.
OutlookThe following information is provided to assist in forecasting the Company’s future results.
• Changes in Systemwide sales are driven by comparable sales and net restaurant unit expansion. The Company expects net restaurant additions to addapproximately 1 percentage point to 2017 Systemwide sales growth (in constant currencies).
• The Company does not generally provide specific guidance on changes in comparable sales. However, as a perspective, assuming no change in coststructure, a 1 percentage point change in comparable sales for either the U.S. or the International Lead segment would change annual diluted earningsper share by about 4 to 5 cents.
• With about 75% of McDonald's grocery bill comprised of 10 different commodities, a basket of goods approach is the most comprehensive way tolook at the Company's commodity costs. For the full-year 2017, costs for the total basket of goods are expected to increase about 1% in the U.S. andincrease about 2% in the International Lead segment.
• The Company expects full-year 2017 selling, general and administrative expenses to decrease about 7% in constant currencies.• Based on current interest and foreign currency exchange rates, the Company expects interest expense for the full-year 2017 to increase about 5%
compared with 2016 due to higher average debt balances.• A significant part of the Company's operating income is generated outside the U.S., and about 35% of its total debt is denominated in foreign
currencies. Accordingly, earnings are affected by changes in foreign currency exchange rates, particularly the Euro, British Pound, Australian Dollarand Canadian Dollar. Collectively, these currencies represent approximately 70% of the Company's operating income outside the U.S. If all four ofthese currencies moved by 10% in the same direction, the Company's annual diluted earnings per share would change by about 25 cents.
• The Company expects the effective income tax rate for the full-year 2017 to be in the 32-33% range.• The Company expects capital expenditures for 2017 to be approximately $1.7 billion, about one-third of which will be used to open new restaurants.
The Company expects to open about 900 restaurants, including about 500 restaurants in affiliated and developmental licensee markets where theCompany generally does not fund any capital expenditures. The remaining two-thirds of capital will be used to reinvest in existing locations, includingabout 650 reimages in the U.S. When combined with previously modernized restaurants that will be updated with Experience of the Future ("EOTF")elements in 2017, we expect to have about 2,500 EOTF restaurants in the U.S. by the end of 2017.
In addition, the Company has other long-term targets that are detailed in its Form 10-K for the year ended December 31, 2016.
8
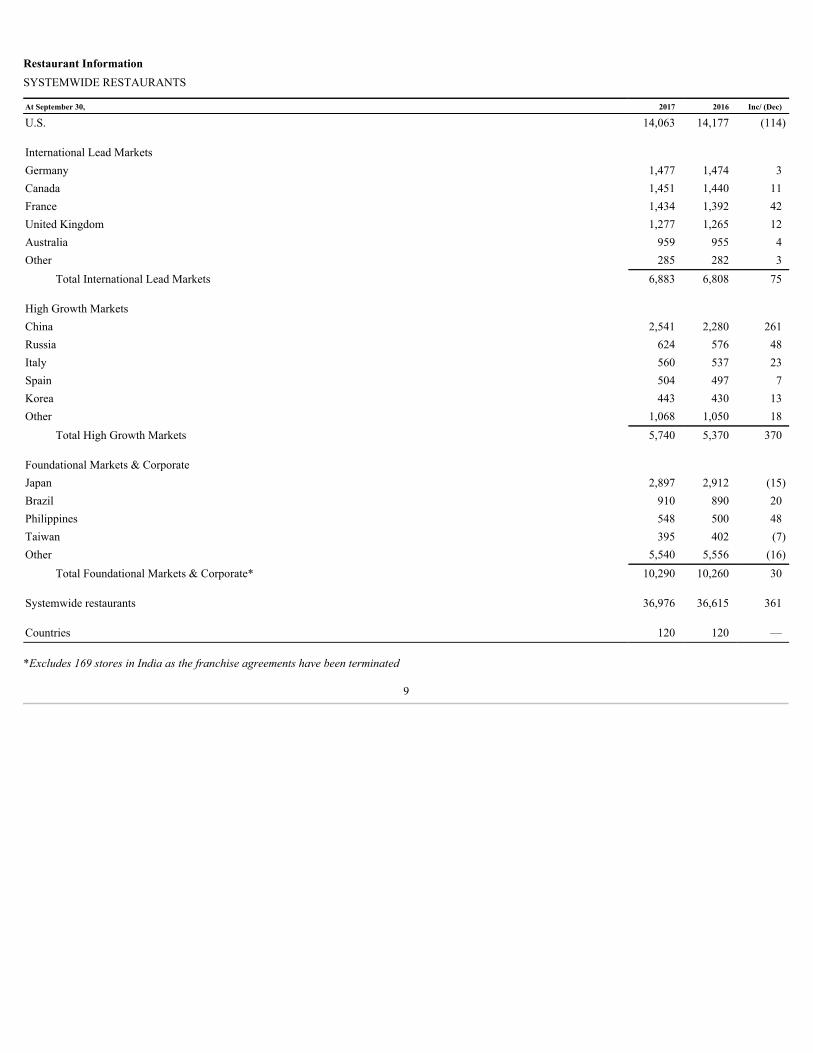
Restaurant InformationSYSTEMWIDE RESTAURANTS
At September 30, 2017 2016 Inc/ (Dec)
U.S. 14,063 14,177 (114) International Lead Markets
Germany 1,477 1,474 3Canada 1,451 1,440 11France 1,434 1,392 42United Kingdom 1,277 1,265 12Australia 959 955 4Other 285 282 3
Total International Lead Markets 6,883 6,808 75 High Growth Markets
China 2,541 2,280 261Russia 624 576 48Italy 560 537 23Spain 504 497 7Korea 443 430 13Other 1,068 1,050 18
Total High Growth Markets 5,740 5,370 370 Foundational Markets & Corporate
Japan 2,897 2,912 (15)Brazil 910 890 20Philippines 548 500 48Taiwan 395 402 (7)Other 5,540 5,556 (16)
Total Foundational Markets & Corporate* 10,290 10,260 30 Systemwide restaurants 36,976 36,615 361 Countries 120 120 —
*Excludes 169 stores in India as the franchise agreements have been terminated
9

SYSTEMWIDE RESTAURANTS BY TYPE
At September 30, 2017 2016 Inc/ (Dec)
U.S.
Conventional franchised 13,131 13,047 84Company-operated 932 1,130 (198)
Total U.S. 14,063 14,177 (114) International Lead Markets
Conventional franchised 5,890 5,685 205Developmental licensed 31 18 13
Total Franchised 5,921 5,703 218Company-operated 962 1,105 (143)
Total International Lead Markets 6,883 6,808 75 High Growth Markets
Conventional franchised 1,651 1,711 (60)Developmental licensed 130 496 (366)Foreign affiliated* 2,811 281 2,530
Total Franchised 4,592 2,488 2,104Company-operated 1,148 2,882 (1,734)
Total High Growth Markets 5,740 5,370 370 Foundational Markets & Corporate
Conventional franchised 542 1,013 (471)Developmental licensed 6,663 5,228 1,435Foreign affiliated** 2,897 3,080 (183)
Total Franchised 10,102 9,321 781Company-operated 188 939 (751)
Total Foundational Markets & Corporate 10,290 10,260 30 Systemwide
Conventional franchised 21,214 21,456 (242)Developmental licensed 6,824 5,742 1,082Foreign affiliated 5,708 3,361 2,347
Total Franchised 33,746 30,559 3,187Company-operated 3,230 6,056 (2,826)
Total Systemwide 36,976 36,615 361
* China and Hong Kong included in affiliated restaurants as of July 31, 2017** Excludes 169 stores in India as the franchise agreements have been terminated
10

Risk Factors and Cautionary Statement Regarding Forward-Looking StatementsThe information in this report includes forward-looking statements about future events and circumstances and their effects upon revenues, expenses and
business opportunities. Generally speaking, any statement in this report not based upon historical fact is a forward-looking statement. Forward-looking statementscan also be identified by the use of forward-looking words, such as “may,” “will,” “expect,” “believe,” “anticipate” and “plan” or similar expressions. In particular,statements regarding our plans, strategies, prospects and expectations regarding our business and industry, including those under "Outlook", are forward-lookingstatements. They reflect our expectations, are not guarantees of performance and speak only as of the date of this report. Except as required by law, we do notundertake to update them. Our expectations (or the underlying assumptions) may change or not be realized, and you should not rely unduly on forward-lookingstatements. Our business results are subject to a variety of risks, including those that are reflected in the following considerations and factors, as well as elsewherein our filings with the SEC. If any of these considerations or risks materialize, our expectations may change and our performance may be adversely affected.If we do not successfully evolve and execute against our business strategies, we may not be able to increase operating income.
To drive future results, our business strategies must be effective in delivering increased guest counts to drive operating income growth. Whether thesestrategies are successful depends mainly on our System’s ability to:
• Continue to innovate and differentiate the McDonald’s experience by preparing and serving our food in a way that balances value and convenience to ourcustomers with profitability;
• Capitalize on our global scale, iconic brand and local market presence to enhance our ability to retain, regain and convert key customer groups;• Utilize our more adaptive organizational structure to execute against our initiatives at an accelerated pace;• Strengthen customer appeal and augment our digital initiatives, including mobile ordering and delivery, along with EOTF, particularly in the U.S.;• Identify and develop restaurant sites consistent with our plans for net growth of Systemwide restaurants; and• Operate restaurants with high service levels and optimal capacity while managing the increasing complexity of our restaurant operations.
If we are delayed or unsuccessful in executing our strategies, or if our strategies do not yield the desired results, our business, financial condition and resultsof operations may suffer.Our investments to enhance the customer experience, including through technology, may not generate the expected returns.
We will continue to build upon our investments in EOTF, which focus on restaurant modernization and technology and digital engagement in order totransform the restaurant experience. As we accelerate our pace of converting restaurants to EOTF, we are placing renewed emphasis on improving our servicemodel and strengthening relationships with customers, in part through digital channels and loyalty initiatives, as well as mobile ordering and payment systems. Wealso continue to build on delivery initiatives, which may not generate expected returns. We may not fully realize the intended benefits of these significantinvestments, or these initiatives may not be well executed, and therefore our business results may suffer.If we do not anticipate and address evolving consumer preferences, our business could suffer.
Our continued success depends on our System’s ability to anticipate and respond effectively to continuously shifting consumer demographics, and trends infood sourcing, food preparation, food offerings and consumer preferences in the “informal eating out” (IEO) segment. In order to deliver a relevant experience forour customers amidst a highly competitive, value-driven operating environment, we must implement initiatives to adapt at an aggressive pace. There is noassurance that these initiatives will be successful and, if they are not, our financial results could be adversely impacted.Activities relating to our refranchising and cost savings initiatives remain ongoing and entail various risks.
Our previously announced refranchising and cost saving initiatives remain ongoing. As we continue on those initiatives, the existing risks we face in ourbusiness may be intensified. Our efforts to reduce costs and capital expenditures depend, in part, upon our refranchising efforts, which, in turn, depend upon ourselection of capable third parties. Our cost savings initiatives also depend upon a variety of factors, including our ability to achieve efficiencies through theconsolidation of global, back-office functions. If these various initiatives are not successful, take longer to complete than initially projected, or are not wellexecuted, or if our cost reduction efforts adversely impact our effectiveness, our business operations, financial results and results of operations could be adverselyaffected.If pricing, promotional and marketing plans are not effective, our results may be negatively impacted.
Our results depend on the impact of pricing, promotional and marketing plans across the System, and the ability to adjust these plans to respond quickly andeffectively to evolving customer preferences, as well as shifting economic and competitive conditions. Existing or future pricing strategies, and the valueproposition they represent, are expected to continue to be important components of
11

our business strategy; however, they may not be successful and could negatively impact sales and margins. Further, the promotion of menu offerings may yieldresults below the desired levels.
Additionally, we operate in a complex and costly advertising environment. Our marketing and advertising programs may not be successful, and we may failto attract and retain customers. Our success depends in part on whether the allocation of our advertising and marketing resources across different channels allowsus to reach our customers effectively. If the advertising and marketing programs are not successful, or are not as successful as those of our competitors, our sales,guest counts and market share could decrease.Failure to preserve the value and relevance of our brand could have an adverse impact on our financial results.
To be successful in the future, we believe we must preserve, enhance and leverage the value of our brand. Brand value is based in part on consumerperceptions. Those perceptions are affected by a variety of factors, including the nutritional content and preparation of our food, the ingredients we use, ourbusiness practices and the manner in which we source the commodities we use. Consumer acceptance of our offerings is subject to change for a variety of reasons,and some changes can occur rapidly. For example, nutritional, health and other scientific studies and conclusions, which constantly evolve and may havecontradictory implications, drive popular opinion, litigation and regulation (including initiatives intended to drive consumer behavior) in ways that affect the IEOsegment or perceptions of our brand generally or relative to available alternatives. Consumer perceptions may also be affected by third parties presenting orpromoting adverse commentary or portrayals of the quick-service category of the IEO segment, our brand and/or our operations, our suppliers or our franchisees. Ifwe are unsuccessful in addressing such adverse commentary or portrayals, our brand and our financial results may suffer.
Additionally, the ongoing relevance of our brand may depend on the success of our sustainability initiatives, which require System- wide coordination andalignment. If we are not effective in addressing social responsibility matters or achieving relevant sustainability goals, consumer trust in our brand may suffer. Inparticular, business incidents or practices that erode consumer trust or confidence, particularly if such incidents or practices receive considerable publicity or resultin litigation, can significantly reduce brand value and have a negative impact on our financial results.We face intense competition in our markets, which could hurt our business.
We compete primarily in the IEO segment, which is highly competitive. We also face sustained, intense competition from traditional, fast casual and othercompetitors, which may include many non-traditional market participants such as convenience stores, grocery stores and coffee shops. We expect our environmentto continue to be highly competitive, and our results in any particular reporting period may be impacted by new or continuing actions of our competitors, whichmay have a short- or long-term impact on our results.
We compete on the basis of product choice, quality, affordability, service and location. In particular, we believe our ability to compete successfully in thecurrent market environment depends on our ability to improve existing products, develop new products, price our products appropriately, deliver a relevantcustomer experience, manage the complexity of our restaurant operations and respond effectively to our competitors’ actions or disruptive actions from otherswhich we do not foresee. Recognizing these dependencies, we have intensified our focus in recent periods on strategies to achieve these goals, and we will likelycontinue to modify our strategies and implement new strategies in the future. There can be no assurance these strategies will be effective, and some strategies maybe effective at improving some metrics while adversely affecting other metrics.Unfavorable general economic conditions could adversely affect our business and financial results.
Our results of operations are substantially affected by economic conditions, which can vary significantly by market and can impact consumer disposableincome levels and spending habits. Economic conditions can also be impacted by a variety of factors including hostilities, epidemics and actions taken bygovernments to manage national and international economic matters, whether through austerity or stimulus measures or trade measures, and initiatives intended tocontrol wages, unemployment, credit availability, inflation, taxation and other economic drivers. Continued adverse economic conditions or adverse changes ineconomic conditions in our markets could pressure our operating performance, and our business and financial results may suffer.
Our results of operations are also affected by fluctuations in currency exchange rates, which may adversely affect reported earnings.Supply chain interruptions may increase costs or reduce revenues.
We depend on the effectiveness of our supply chain management to assure reliable and sufficient product supply, including on favorable terms. Althoughmany of the products we sell are sourced from a wide variety of suppliers in countries around the world, certain products have limited suppliers, which mayincrease our reliance on those suppliers. Supply chain interruptions, including shortages and transportation issues, and price increases can adversely affect us aswell as our suppliers and franchisees whose performance may have a significant impact on our results. Such shortages or disruptions could be caused by factorsbeyond the control of our suppliers, franchisees or us. If we experience interruptions in our System’s supply chain, our costs could increase and it could limit theavailability of products critical to our System’s operations.
12
Food safety concerns may have an adverse effect on our business.Our ability to increase sales and profits depends on our System’s ability to meet expectations for safe food and on our ability to manage the potential impact
on McDonald’s of food-borne illnesses and food or product safety issues that may arise in the future. Food safety is a top priority, and we dedicate substantialresources to ensure that our customers enjoy safe food products, including as our menu and service model evolve. However, food safety events, including instancesof food-borne illness, have occurred in the food industry in the past, and could occur in the future. Instances of food tampering, food contamination or food-borneillness, whether actual or perceived, could adversely affect our brand and reputation as well as our revenues and profits.Our franchise business model presents a number of risks.
Our success increasingly relies on the financial success and cooperation of our franchisees, including our developmental licensees and affiliates, yet we havelimited influence over their operations. Our restaurant margins arise from two sources: fees from franchised restaurants (e.g., rent and royalties based on apercentage of sales) and, to a lesser degree, sales from Company-operated restaurants. Our franchisees manage their businesses independently, and therefore areresponsible for the day-to-day operation of their restaurants. The revenues we realize from franchised restaurants are largely dependent on the ability of ourfranchisees to grow their sales. If our franchisees do not experience sales growth, our revenues and margins could be negatively affected as a result. Also, if salestrends worsen for franchisees, their financial results may deteriorate, which could result in, among other things, restaurant closures, or delayed or reducedpayments to us. Our refranchising effort will increase that dependence and the effect of those factors.
Our success also increasingly depends on the willingness and ability of our independent franchisees and affiliates to implement major initiatives, which mayinclude financial investment, and to remain aligned with us on operating, promotional and capital-intensive reinvestment plans. Franchisees’ ability to contribute tothe achievement of our plans is dependent in large part on the availability to them of funding at reasonable interest rates and may be negatively impacted by thefinancial markets in general or by the creditworthiness of our franchisees or the Company. Our operating performance could also be negatively affected if ourfranchisees experience food safety or other operational problems or project an image inconsistent with our brand and values, particularly if our contractual andother rights and remedies are limited, costly to exercise or subjected to litigation. If franchisees do not successfully operate restaurants in a manner consistent withour required standards, the brand’s image and reputation could be harmed, which in turn could hurt our business and operating results.
Our ownership mix also affects our results and financial condition. The decision to own restaurants or to operate under franchise or license agreements isdriven by many factors whose interrelationship is complex and changing. Our ability to achieve the benefits of our refranchising strategy, which involves a greaterpercentage of franchised restaurants, including an increased number of restaurants run by developmental licensees and affiliates, depends on various factors. Thosefactors include whether we have effectively selected franchisees, licensees and/or affiliates that meet our rigorous standards, and whether their performance and theresulting ownership mix supports our brand and financial objectives.Challenges with respect to talent management could harm our business.
Effective succession planning is important to our long-term success. Failure to effectively identify, develop and retain key personnel, recruit high-qualitycandidates and ensure smooth management and personnel transitions could disrupt our business and adversely affect our results.
Our success depends in part on our System’s ability to recruit, motivate and retain a qualified workforce to work in our restaurants in an intenselycompetitive environment. Increased costs associated with recruiting, motivating and retaining qualified employees to work in our Company-operated restaurantscould have a negative impact on our Company-operated margins. Similar concerns apply to our franchisees.
We are also impacted by the costs and other effects of compliance with U.S. and international regulations affecting our workforce, which includes our staffand employees working in our Company-operated restaurants. These regulations are increasingly focused on employment issues, including wage and hour,healthcare, immigration, retirement and other employee benefits and workplace practices. Our potential exposure to reputational and other harm regarding ourworkplace practices or conditions or those of our independent franchisees or suppliers (or perceptions thereof) could have a negative impact on consumerperceptions of us and our business. Additionally, economic action, such as boycotts, protests, work stoppages or campaigns by labor organizations, could adverselyaffect us (including our ability to recruit and retain talent) or the franchisees and suppliers that are also part of the McDonald's System and whose performance mayhave a material impact on our results.Information technology system failures or interruptions, or breaches of network security, may interrupt our operations.
We are increasingly reliant on technological systems, such as point-of-sale and other in-store systems or platforms, technologies supporting McDonald’sdelivery and digital solutions, as well as technologies that facilitate communication and collaboration internally, with affiliated entities, customers or independentthird parties to conduct our business, including technology-enabled systems provided to us by third parties. Any failure of these systems could significantly impactour operations and customer experience and perceptions.
13

Despite the implementation of security measures, those technology systems and solutions could become vulnerable to damage, disability or failures due totheft, fire, power loss, telecommunications failure or other catastrophic events. The third party systems also present the risks faced by the third party’s business,including the credit risk of those parties. If those systems were to fail or otherwise be unavailable, and we were unable to recover in a timely way, we couldexperience an interruption in our operations.
Furthermore, security breaches have from time to time occurred and may in the future occur involving our systems, the systems of the parties wecommunicate or collaborate with (including franchisees), or those of third party providers. These may include such things as unauthorized access, denial of service,computer viruses, introduction of malware or ransomware and other disruptive problems caused by hackers. Our information technology systems contain personal,financial and other information that is entrusted to us by our customers, our employees and other third parties, as well as financial, proprietary and otherconfidential information related to our business. An actual or alleged security breach could result in disruptions, shutdowns, theft or unauthorized disclosure ofpersonal, financial, proprietary or other confidential information. The occurrence of any of these incidents could result in reputational damage, adverse publicity,loss of consumer confidence, reduced sales and profits, complications in executing our growth initiatives and criminal penalties or civil liabilities.The global scope of our business subjects us to risks that could negatively affect our business.
We encounter differing cultural, regulatory and economic environments within and among the more than 100 countries where McDonald’s restaurantsoperate, and our ability to achieve our business objectives depends on the System's success in these environments. Meeting customer expectations is complicatedby the risks inherent in our global operating environment, and our global success is partially dependent on our System’s ability to leverage operating successesacross markets. Planned initiatives may not have appeal across multiple markets with McDonald's customers and could drive unanticipated changes in customerperceptions and guest counts.
Disruptions in operations or price volatility in a market can also result from governmental actions, such as price, foreign exchange or changes in trade-relatedtariffs or controls, government-mandated closure of our, our franchisees' or our suppliers’ operations, and asset seizures. The cost and disruption of responding togovernmental investigations or inquiries, whether or not they have merit, may impact our results and could cause reputational or other harm. Our internationalsuccess depends in part on the effectiveness of our strategies and brand-building initiatives to reduce our exposure to such governmental investigations or inquiries.
Additionally, challenges and uncertainties are associated with operating in developing markets, which may entail a relatively higher risk of politicalinstability, economic volatility, crime, corruption and social and ethnic unrest. Such challenges may be exacerbated in many cases by a lack of an independent andexperienced judiciary and uncertainties in how local law is applied and enforced, including in areas most relevant to commercial transactions and foreigninvestment. An inability to manage effectively the risks associated with our international operations could have a material adverse effect on our business andfinancial condition.
We may also face challenges and uncertainties in developed markets. For example, as a result of the U.K.'s decision to leave the European Union through anegotiated exit over a period of time, including its recent formal commencement of exit proceedings, it is possible that there will be increased regulatorycomplexities, as well as potential referenda in the U.K. and/or other European countries, that could cause uncertainty in European or worldwide economicconditions. In the short term, the decision created volatility in certain foreign currency exchange rates, and the resulting depression in those exchange rates maycontinue. Any of these effects, and others we cannot anticipate, could adversely affect our business, results of operations, financial condition and cash flows.Changes in tax laws and unanticipated tax liabilities could adversely affect the taxes we pay and our profitability.
We are subject to income and other taxes in the United States and foreign jurisdictions, and our operations, plans and results are affected by tax and otherinitiatives around the world. In particular, we are affected by the impact of changes to tax laws or policy or related authoritative interpretations, including changesresulting from proposals for comprehensive or corporate tax reforms that may become a key component of budgetary initiatives in the United States or elsewhere.We are also impacted by settlements of pending or any future adjustments proposed by taxing authorities inside and outside of the U.S. in connection with our taxaudits, all of which will depend on their timing, nature and scope. Any increases in income tax rates, changes in income tax laws or unfavorable resolution of taxmatters could have a material adverse impact on our financial results.Changes in commodity and other operating costs could adversely affect our results of operations.
The profitability of our Company-operated restaurants depends in part on our ability to anticipate and react to changes in commodity costs, including food,paper, supplies, fuel, utilities and distribution, and other operating costs, including labor. Any volatility in certain commodity prices could adversely affect ouroperating results by impacting restaurant profitability. The commodity markets for some of the ingredients we use, such as beef and chicken, are particularlyvolatile due to factors such as seasonal shifts, climate conditions, industry demand, international commodity markets, food safety concerns, product recalls andgovernment regulation, all of which are beyond our control and, in many instances, unpredictable. We can only partially address future price risk through hedgingand other activities, and therefore increases in commodity costs could have an adverse impact on our profitability.
14

Increasing regulatory complexity may adversely affect restaurant operations and our financial results.Our regulatory environment worldwide exposes us to complex compliance and similar risks that could affect our operations and results in material ways. In
many of our markets, we are subject to increasing regulation, which has increased our cost of doing business. We are affected by the cost, compliance and otherrisks associated with the often conflicting and highly prescriptive regulations we face, including where inconsistent standards imposed by multiple governmentalauthorities can adversely affect our business and increase our exposure to litigation or governmental investigations or proceedings.
Our success depends in part on our ability to manage the impact of new, potential or changing regulations that can affect our business plans and operations.These regulations include product packaging, marketing, the nutritional content and safety of our food and other products, labeling and other disclosure practices.Compliance efforts with those regulations may be affected by ordinary variations in food preparation among our own restaurants and the need to rely on theaccuracy and completeness of information from third-party suppliers (particularly given varying requirements and practices for testing and disclosure).
Additionally, we are working to manage the risks and costs to us, our franchisees and our supply chain of the effects of climate change, greenhouse gases,and diminishing energy and water resources. These risks include the increased public focus, including by governmental and nongovernmental organizations, onthese and other environmental sustainability matters, such as packaging and waste, animal health and welfare, deforestation and land use. These risks also includethe increased pressure to make commitments, set targets or establish additional goals and take actions to meet them. These risks could expose us to market,operational and execution costs or risks. If we are unable to effectively manage the risks associated with our complex regulatory environment, it could have amaterial adverse effect on our business and financial condition.We are subject to increasing legal complexity and could be party to litigation that could adversely affect us.
Increasing legal complexity will continue to affect our operations and results in material ways. We could be subject to legal proceedings that may adverselyaffect our business, including class actions, administrative proceedings, government investigations, employment and personal injury claims, landlord/tenantdisputes, disputes with current or former suppliers, claims by current or former franchisees and intellectual property claims (including claims that we infringedanother party’s trademarks, copyrights or patents).
Inconsistent standards imposed by governmental authorities can adversely affect our business and increase our exposure to regulatory proceedings orlitigation.
Litigation involving our relationship with franchisees and the legal distinction between our franchisees and us for employment law purposes, if determinedadversely, could increase costs, negatively impact the business prospects of our franchisees and subject us to incremental liability for their actions. Similarly,although our commercial relationships with our suppliers remain independent, there may be attempts to challenge that independence, which, if determinedadversely, could also increase costs, negatively impact the business prospects of our suppliers, and subject us to incremental liability for their actions. We are alsosubject to legal and compliance risks and associated liability, such as in the areas of privacy and data collection, protection and management, as it relates toinformation we collect and share when we provide optional technology-related services and platforms to third parties.
Our operating results could also be affected by the following:• The relative level of our defense costs, which vary from period to period depending on the number, nature and procedural status of pending proceedings;• The cost and other effects of settlements, judgments or consent decrees, which may require us to make disclosures or take other actions that may affect
perceptions of our brand and products;• Adverse results of pending or future litigation, including litigation challenging the composition and preparation of our products, or the appropriateness or
accuracy of our marketing or other communication practices; and• The scope and terms of insurance or indemnification protections that we may have.• A judgment significantly in excess of any applicable insurance coverage or third party indemnity could materially adversely affect our financial condition or
results of operations. Further, adverse publicity resulting from these claims may hurt our business.We may not be able to adequately protect our intellectual property or adequately ensure that we are not infringing the intellectual property of others,which could harm the value of the McDonald’s brand and our business.
The success of our business depends on our continued ability to use our existing trademarks and service marks in order to increase brand awareness andfurther develop our branded products in both domestic and international markets. We rely on a combination of trademarks, copyrights, service marks, trade secrets,patents and other intellectual property rights to protect our brand and branded products.
We have registered certain trademarks and have other trademark registrations pending in the United States and certain foreign jurisdictions. The trademarksthat we currently use have not been registered in all of the countries outside of the United States in which we do business or may do business in the future and maynever be registered in all of these countries. The steps we have taken to protect our intellectual property in the United States and foreign countries may not beadequate. In addition, the steps we have taken may not
15

adequately ensure that we do not infringe the intellectual property of others, and third parties may claim infringement by us in the future. In particular, we may beinvolved in intellectual property claims, including often aggressive or opportunistic attempts to enforce patents used in information technology systems, whichmight affect our operations and results. Any claim of infringement, whether or not it has merit, could be time-consuming, result in costly litigation and harm ourbusiness.
We cannot ensure that franchisees and other third parties who hold licenses to our intellectual property will not take actions that hurt the value of ourintellectual property.Changes in accounting standards or the recognition of impairment or other charges may adversely affect our future operations and results.
New accounting standards or changes in financial reporting requirements, accounting principles or practices, including with respect to our critical accountingestimates, could adversely affect our future results. We may also be affected by the nature and timing of decisions about underperforming markets or assets,including decisions that result in impairment or other charges that reduce our earnings. In assessing the recoverability of our long-lived assets, we consider changesin economic conditions and make assumptions regarding estimated future cash flows and other factors. These estimates are highly subjective and can besignificantly impacted by many factors such as global and local business and economic conditions, operating costs, inflation, competition, consumer anddemographic trends, and our restructuring activities. If our estimates or underlying assumptions change in the future, we may be required to record impairmentcharges. If we experience any such changes, they could have a significant adverse effect on our reported results for the affected periods.A decrease in our credit ratings or an increase in our funding costs could adversely affect our profitability.
Our credit ratings may be negatively affected by our results of operations or changes in our debt levels. As a result, our interest expense, the availability ofacceptable counterparties, our ability to obtain funding on favorable terms, collateral requirements and our operating or financial flexibility could all be negativelyaffected, especially if lenders impose new operating or financial covenants.
Our operations may also be impacted by regulations affecting capital flows, financial markets or financial institutions, which can limit our ability to manageand deploy our liquidity or increase our funding costs. If any of these events were to occur, they could have a material adverse effect on our business and financialcondition.Trading volatility and price of our common stock may be adversely affected by many factors.
Many factors affect the volatility and price of our common stock in addition to our operating results and prospects. The most important of these factors, someof which are outside our control, are the following:
• The continuing unpredictable global economic and market conditions;• Governmental action or inaction in light of key indicators of economic activity or events that can significantly influence financial markets, particularly in
the United States, which is the principal trading market for our common stock, and media reports and commentary about economic or other matters, evenwhen the matter in question does not directly relate to our business;
• Trading activity in our common stock or trading activity in derivative instruments with respect to our common stock or debt securities, which can beaffected by market commentary (including commentary that may be unreliable or incomplete); unauthorized disclosures about our performance, plans orexpectations about our business; our actual performance and creditworthiness; investor confidence, driven in part by expectations about our performance;actions by shareholders and others seeking to influence our business strategies; portfolio transactions in our stock by significant shareholders; or tradingactivity that results from the ordinary course rebalancing of stock indices in which McDonald’s may be included, such as the S&P 500 Index and the DowJones Industrial Average;
• The impact of our stock repurchase program or dividend rate; and• The impact on our results of corporate actions and market and third-party perceptions and assessments of such actions, such as those we may take from time
to time as we implement our strategies in light of changing business, legal and tax considerations and evolve our corporate structure.Events such as severe weather conditions, natural disasters, hostilities and social unrest, among others, can adversely affect our results and prospects.
Severe weather conditions, natural disasters, hostilities and social unrest, terrorist activities, health epidemics or pandemics (or expectations about them) canadversely affect consumer spending and confidence levels and supply availability and costs, as well as the local operations in impacted markets, all of which canaffect our results and prospects. Our receipt of proceeds under any insurance we maintain with respect to some of these risks may be delayed or the proceeds maybe insufficient to cover our losses fully.
16