Embed Size (px)
Citation preview

University of Mississippi University of Mississippi
eGrove eGrove
Electronic Theses and Dissertations Graduate School
2018
Mcdonald’s Users’ Perceptions Of Health And Nutrition, Quality, Mcdonald’s Users’ Perceptions Of Health And Nutrition, Quality,
And Value On Visit Frequency And Value On Visit Frequency
Claire Adams University of Mississippi
Follow this and additional works at: https://egrove.olemiss.edu/etd
Part of the Nutrition Commons
Recommended Citation Recommended Citation Adams, Claire, "Mcdonald’s Users’ Perceptions Of Health And Nutrition, Quality, And Value On Visit Frequency" (2018). Electronic Theses and Dissertations. 594. https://egrove.olemiss.edu/etd/594
This Thesis is brought to you for free and open access by the Graduate School at eGrove. It has been accepted for inclusion in Electronic Theses and Dissertations by an authorized administrator of eGrove. For more information, please contact [email protected].

MCDONALD’S USERS’ PERCEPTIONS OF HEALTH AND NUTRITION, QUALITY, AND
VALUE ON VISIT FREQUENCY
A Thesis presented in fulfillment of requirements for the degree of Master of Science in the
Department of Nutrition and Hospitality Management
The University of Mississippi
By
CLAIRE V. A. ADAMS
May 2018

Copyright © 2018 by Claire Adams ALL RIGHTS RESERVED
ii
ABSTRACT
With the vast amount of quick service restaurants (QSRs) that are available to consumers
in the United States (U.S.), the hospitality industry has become an integral part of Americans’
diet and lifestyle. This study examines how McDonald’s customers’ perceptions of health and
nutrition, quality, and value vary demographically (gender, age, ethnicity, educational level, and
body mass index [BMI]) by McDonald’s visit frequency.
An online survey was employed to collect data of participants who were 18 years of age
and older, McDonald’s customers, and a resident of the U.S. Of the 843 respondents who filled
out the survey, 607 (72%) surveys were usable. The survey consisted of 17 statements regarding
McDonald’s menu items, along with demographic questions, and questions regarding
McDonald’s visit frequency. The data were compiled and analyzed using SPSS version 24.
Frequencies of participants’ demographics were computed and multiple regression analyses were
employed to investigate the relationship of McDonald’s visit frequency among the following:
demographics, perceptions of health and nutrition, quality, and value, and the 17 statements.
Findings regarding demographics only show that individuals most likely to visit
McDonald’s are obese and between the ages of 35-44, whereas individuals aged 55 and older are
least likely to visit. When examining demographics with the three perception categories, there is
a difference in significance regarding age and visit frequency: those aged 35-44 are no longer
iii
significant, and individuals least likely to visit McDonald’s are now 45 years and older;
additionally, those who obese are still more likely to visit McDonald’s than their BMI
counterparts.
Customers who visit McDonald’s most often had significantly higher perceptions of
health and nutrition and quality of McDonald’s food than they did of value perceptions. Lastly,
results show that customers appear to frequent McDonald’s for factors such as taste and the
availability of healthy options, but adequate helpings, controlled product quality, and the
availability of low-calorie meals are negatively associated with visit frequency to McDonald’s.
iv
LIST OF ABBREVIATIONS
ACA Affordable Care Act
BMI Body mass index
CDC Center for Disease Control and Prevention
FAFH Food away from home
IRB Institutional Review Board
MTurk Amazon Mechanical Turk
QSR Quick service restaurant
U.S. United States
v
ACKNOWLEDGMENTS
The following report has been vastly improved upon thanks to the time donated
and the thoughtful comments from various contributors, particularly my thesis committee. Above
all, I give special thanks to Dr. Roseman, my thesis chair, for whom I have the utmost admiration
and respect as a researcher and professional. I am also indebted to my committee members, Dr.
Cindy Choi and Dr. Lambert, each of whom has provided steady support, guidance, and direction
throughout the duration this research process. Without a doubt, my committee’s time,
consideration, and leadership have left an unforgettable mark on my success at the University of
Mississippi as a student and as a future professional, and for that, I am forever grateful. Further, I
recognize my family and friends for their unwavering support of my goals and dreams.
vi
TABLE OF CONTENTS
ABSTRACT …………………………………………………………………………………….. ii
LIST OF ABBREVIATIONS…………………..……………………………………………….. iv
ACKNOWLEDGMENTS……………………………………………………………………..... v
LIST OF TABLES…………………………………………………………………………….... vii
INTRODUCTION………………………………………………………………………………. 1
REVIEW OF LITERATURE………………………………………………………………….... 4
MATERIALS AND METHODS……………………………………………………………….. 12
RESULTS………………………………………………………………………………………. 17
DISCUSSION…………………………………………………………………………………... 28
LIST OF REFERENCES……………………………………………………………………….. 40
APPENDIX A…………………………………………………………………………………... 49
VITA……………………………………………………………………………………………. 52
vii
LIST OF TABLES
1. Frequencies of Demographic Profile of the Sample (N=607)……………………………. 19
2. Relationship between Demographics and McDonald’s Visit Frequency………………… 21
3. Relationship between Statements about McDonald’s and Visit Frequency……………… 23
4. Relationship Between Perception of Health and Nutrition, Quality, Value Categories and Visit Frequency……………………………………………………………………………………. 25 5. Relationship between Demographics and 3 Categories, and McDonald’s Visit Frequency…………………………………………………………………………………….. 27
6. Appendix A. Factors and measurement items for McDonald’s User Perceptions………… 49
1
CHAPTER I
INTRODUCTION
In the United States (U.S.) the fast food industry, also known as quick service restaurants
(QSRs), has become an integral part of the American diet and lifestyle throughout the decades
(Jang, 2015). Fast food, as defined by society, is food away from home (FAFH) that is purchased
in eating establishments without wait staff, and generally offers convenience that saves the
consumer time in terms of food preparation (French, Story, Neumark-Sztainer, Fulkerson, &
Hannan, 2001). QSRs are also appealing to a consumer in regards to the meal items offered, such
as tasty options, general healthiness, value, and overall quality (Qin, Prybutok, & Zhao, 2010).
The wide availability of fast food among Americans has contributed to the increase in the overall
percentage of an individual’s food budget (Hamrick & Okrent, 2014) with approximately one-
third of the U.S. food dollar being spent on eating out at QSRs (Morrison, 2013). Among the
many reasons for the popularity of fast food in the U.S. is the widespread availability of QSRs,
making visitation an easy option for many Americans (Namkung & Jang, 2007).
To put the term “wide availability of QSRs” into perspective, in 2016 there were 186,977
QSRs in the U.S. (NCES, 2017), and the revenue of all U.S. QSRs totaled roughly 234 billion
dollars (Oches, 2017). Of the most well-known brand names in the world, McDonald's was the
highest ranked QSR brand in terms of sales in 2016 with a brand value of approximately 36.4
billion dollars among its 14,155 total worldwide establishments (Oches, 2017).
In a national effort to aid in decreasing consumer caloric intake at QSRs, national
2
restaurant menu labeling was mandated in the 2010 Affordable Care Act (ACA). This policy, if
implemented as written in the law, will ultimately require large chain restaurants (with more than
20 locations) to provide caloric information of menu items on the actual menu that is viewed by
the consumer (U.S. Food & Drug Administration, 2014). With the aim of decreasing caloric
intake, major support of this policy lies under the fundamental umbrella of transparency (Bleich,
Wolfson, & Jarlenski, 2015). That is, openly providing the nutritional value of menu items so
consumers have the tools to make more informed fast food purchasing decisions and to, as a
result, possibly reduce their consumption of hypercaloric (Bleich et al., 2015), obesity-related
foods (Breck, Cantor, Martinez, & Elbel, 2014). However, as QSRs make public the caloric
information on their menu items, there is conflicting evidence as to whether or not they really
make an impact on consumer purchasing behavior (Brown, 2013). The menuboard postings of
caloric information takes on the assumption that consumers actually read and understand the
values (Breck et al., 2014). These conflicting findings support the need for gaining a better
understanding of the motivation behind fast food trends considering how much QSRs contribute
to the overall food expenditures in the U.S.
Having a better understanding of the benefits of nutritious meal items in QSRs will
provide ways to improve the overall quality of the American diet and may encourage the QSR
industry to develop lower calorie and nutrient dense meals that are just as convenient as less
nutrient dense counterparts. While the literature is comprehensive in major reasons why
consumers consume QSR food, there has been little scientific research performed that examines
consumers' perceptions of health- and nutrition-, combined with quality- and, value-related
perceptions of QSRs. Since perception influences consumption, having a larger understanding of
how QSR consumers perceive the food they consume will contribute to public and private health
3
efforts to better interpret current dietary practices among Americans. Therefore, the main
research objective of this study is to understand whether perceived health and nutrition, quality,
and value of McDonald’s menu items significantly affect a customers’ visit frequency at
McDonald’s. This study will examine the following research question: How do McDonald’s
customers’ perceptions vary by frequency of purchasing food based on perceived health and
nutrition, perceived quality, and perceived value? Particularly:
Question 1: Is there a relationship between McDonald’s customer demographics (including BMI) and visit frequency to McDonald’s?
Question 2: How do customer perceptions of health and nutrition of McDonald’s food influence visit frequency to McDonald’s?
Question 3: How do customer perceptions of quality of McDonald’s food affect visit frequency to McDonald’s?
Question 4: How do customer perceptions of value of McDonald’s food influence visit frequency to McDonald’s?
4
CHAPTER II
REVIEW OF LITERATURE
With the expansive popularity of QSRs comes extreme competition among fast food
establishments to maintain satisfaction of varying preferences among its consumers (Namkung &
Jang, 2007). There are several factors that influence a consumer’s dietary choices such as food
quality, taste, convenience, healthiness, and price/value when determining where to eat (Jang,
Kim, & Bonn, 2011). All of the aforementioned factors appear to contribute to a consumer’s
ultimate attitude or perception, (dis)satisfaction, and likeliness to return to a fast food
establishment. To better understand the main research objective of this study, perceived health
and nutrition, quality, and value of McDonald’s menu items will be individually discussed
regarding their effect on customers’ visit frequency at McDonald’s.
Visit Frequency of QSRs
In the highly competitive QSR industry, satisfying consumers is a primary objective for a
business that wishes to build visit frequency with its consumers (Soriano, 2002). Consumer
satisfaction at a fast food establishment is often a predictor of loyalty and return patronage
(Bowen & Chen 2001), and while there is no guarantee of a satisfied consumer’s repeat visit, it is
fairly evident that a dissatisfied consumer will not return (Harrington et al., 2013). Because food
is a fundamental component of the QSR experience, there can be no doubt that the food itself
has, and will continue to have, a major impact on consumer satisfaction and return patronage
5
(Jang, 2015).
One of the most prominent trends in Americans’ dietary behaviors throughout the past 40
years has been the increase in consumption of FAFH (Lin & Guthrie, 2012). According to Jang
(2015), this trend has been evident in both the number of times an individual eats at a QSR and
the amount of foods and beverages consumed during these occasions. In addition, the increased
marketing, availability, and affordability of fast food, coupled with households earning higher
incomes, have prompted Americans to increasingly consume fast food (Garza, Ding, Owensby,
& Zizza, 2016).
Frequency of QSRs is significantly associated with the perceived convenience and
availability of QSR food (Dave, An, Jeffery, & Ahluwalia, 2009). In addition, Dave et al. (2009)
explained that for individuals, the immediate rewards of a QSR meal or snack outweigh any
long-term consequences they may find both financially or health-related. For instance,
consumers may opt for the immediate smaller reward (i.e. taste and convenience) of an unhealthy
snack over the delayed larger reward of a healthier snack not typically found at a fast food
establishment of great convenience or availability (Dave et al., 2009).
A factor that influences consumer visit frequency is price, something that is a generally
very important consideration among Americans (Yohn, 2012). Some consumers may believe that
the prices at a QSR are not justified for common FAFH regular meals, but rather for an
occasional treat; should a QSR establishment have product prices that are higher than its QSR
competitors, it may drive away consumers and decrease overall visit frequency (Yohn, 2012).
Yohn (2012) further mentioned that having a range of price points may be the best solution for a
QSR to increase its visit frequency as to meet varying consumer budgets.
QSRs are meant to save time and increase convenience in a society that has come to
6
value efficiency and immediate gratification. Impulsivity is also associated with frequency of
consumption at QSRs (Garza et al., 2016). The very nature of fast food implies greater
convenience, which leads to a greater consumption in individuals who value accessibility, such
as those who have a tendency toward immediate gratification. In this way, certain characteristics
of fast food may be very attractive to individuals who are impulsive (Garza et al., 2016). Behind
impulsivity, however, is the need for food that is tasty and food that can be purchased quickly
(Rydell et al., 2008).
Since there is a multitude of reasons for visit frequency among Americans to QSRs, it is
extremely important to understand the many factors that influence visit frequency, and why.
Hence, one would surmise that the factors to be investigated in this study- health and nutrition,
quality, and value- play an important role in determining a consumer’s perception of their QSR
experience and their resulting visit frequency.
Perceived Health and Nutrition of QSRs
Generally speaking, American QSR consumers who are more health conscious and have
a higher visit frequency to QSRs are more critical when evaluating their fast food meals than
their counterparts (Hwang, 2011). Americans have become increasingly more health conscious
and in turn have increased their interest regarding nutrition in foods (U.S. Department of
Agriculture, 2014), and in fast food as well. Since Americans are becoming more conscious of
healthy food options at QSRs, it is important for such establishments to consider increasing the
number of healthy options available to their consumers (Harrington et al., 2013).
Due to consumer demand, adding healthier, or more nutrient dense options to a menu is
important for a QSR considering that copious amounts of Americans consume fast food for a
7
meal, snack and/or beverage (Mancino, Todd, Guthrie, & Lin, 2010). Considering the increased
consumption of FAFH among American consumers (Kumcu & Okrent, 2014), QSRs have been
under extreme scrutiny for contributing to obesity and related health problems (Dave et al.,
2009), because FAFH typically consists of higher caloric intake and poorer quality food and poor
diet quality (Hamrick & Okrent, 2014; Kumcu & Okrent, 2014; Mancino et al., 2010).
Particularly, QSRs commonly serve large portion sizes of energy-dense foods that are also low in
fiber and micronutrients, causing many consumers to exceed daily caloric requirements and not
fulfill other nutrient requirements (Dave et al., 2009).
Regarding the relationship between FAFH and rise in obesity among consumers, there is
a significant positive relationship between individuals who frequent QSR once a week or more
and body mass index, or BMI (Dave et al., 2009). Although it is possible to incorporate a healthy
or nutritious diet into FAFH, for the average adult one additional meal eaten away from home
increases daily intake by about 134 calories and translates to roughly two extra pounds each year
(Todd, Mancino, & Lin, 2010). However, despite abundant research and media reports about the
unhealthy nature of fast food, Americans still frequent such establishments (Hwang & Cranage,
2010). Interestingly, research shows that up to half of American consumers consider QSRs to be
a fundamental part of their everyday lives (National Restaurant Association, 2016).
Generally speaking, consumers without prior exposure to or knowledge of caloric
information are likely to rely on their own personal perceptions of healthfulness of QSR menu
items (Wei & Miao, 2013). Chandon and Wansink (2007) explained with the health halo effect
that consumers usually underestimate caloric content of fast food menu items when the QSR
itself claims to be healthy as compared to when an establishment does not claim to be healthy.
For example, when customers were asked to estimate the caloric content of menu items of both
8
Subway and McDonald’s, the customers were more likely to underestimate the caloric content of
Subway’s items as opposed to McDonald’s menu items despite the calories of both menu items
being the same. Ideally when nutrition information is not available on a menu board, consumers
use their own reasoning to estimate caloric content, and this is usually prompted by cues such as
the brand’s perception by consumers of healthiness (Hwang, 2011).
The intention of the 2010 ACA menu labeling policy was to ultimately address the link
between overweight/obesity in Americans who frequently eat FAFH (Swartz, Braxton, & Viera,
2011) the link being that consumers will hopefully choose healthier fast food items (Hwang,
2011). In response, large QSR chains have introduced new menu items that are lower in calories.
However, the general caloric content of QSR meals continues to remain high (Bleich et al.,
2015). Menu board calorie labeling takes on the assumption that consumers have enough
knowledge of what a calorie is and also assumes that consumers read and subsequently use that
information in their purchasing decision (Green, Brown, & Ohri-Vachaspati, 2015). The reality
is that the general consumer might not understand the meaning or use the calorie labels (Sinclair,
Cooper, & Mansfield, 2014). A systematic review of studies focusing on menu labeling in QSRs
show that the calorie labeling has generally little or no effect on what consumers order and
consume (Swartz et al., 2011). In fact, the calorie content or healthfulness of food items in QSRs
does not appear to be a top reason for return patronage among the general population (Dave et
al., 2009). More often than not, food from QSRs is generally regarded as a treat, and this may not
fit with consumers’ perception of a healthy meal (Lassen et al., 2016; Wei & Miao, 2013). Most
consumers believe fast food to be harmful to health to some degree; yet such consumers continue
to consume fast food, thus indicating that QSR menu labeling does not necessarily affect
consumption or visit frequency (Musaiger, 2014). As little as eight percent of consumers are
9
likely to make healthy fast food choices as a result of a QSR’s current calorie labeling (Breck et
al., 2014).
Perceived Food Quality of QSRs
Reported as one of the most important attributes among consumers at QSRs, perceived
food quality is repeatedly an influential factor of satisfaction and return patronage (Namkung &
Jang, 2007; Ponnam & Balaji, 2014; Qin et al., 2010; Soriano, 2002). Perceived quality can be
defined as a consumer’s perception of the overall superiority or worth of a product (or service)
with respect to its anticipated purpose (Kwun, 2011). Namkung & Jang (2007) revealed that the
term food quality encompasses a multitude of factors that ultimately influence visit frequency to
any given fast food establishment. Such food quality factors include presentation (how
attractively the food is presented), menu variety (the assortment of different menu items), healthy
options (offering healthy and nutritious food), taste, freshness, and temperature (influencing
sensory attributes like smell, sight, and taste) (Namkung & Jang, 2007). Critical to the success of
a QSR, perceived food quality is a direct link between satisfaction and return patronage (Qin et
al., 2010).
Since perceptions of food quality are so crucial for a QSR, Kwun (2011) explained that
full service restaurants and QSRs are changing their menus to provide a more diverse variety of
food to maintain consumers varying needs; most noticeable menu trends in QSRs include healthy
and new and varied menu items. Offering quality fast food that is appealing to consumers and
also superior to their competitors is a major challenge that faces many QSRs today; hence,
offering quality food is vital to boosting the success of a QSR (Harrington et al., 2013). While
dining out has become such a fundamental part of American’s lifestyles, experienced consumers
10
now raise their expectations with regard to quality while seeking a better value for their money
(Soriano, 2002).
Perceived Value of QSRs
Perceptions of value encompass a consumer’s overall assessment of both monetary and
non-monetary considerations about a fast food product (or service), on the basis of an exchange
between the relative benefits and the costs required to obtain such benefits (Jang, 2015). For a
consumer, the price to be paid for a fast food item determines the level of quality to be demanded
(Soriano, 2002). Because of this, price is another key deciding factor affecting fast food choice
and QSR visit frequency (Lassen et al., 2016). Enhanced product quality and menu have
advantageous effects on perceived value, satisfaction and, ultimately, on consumer attitude
towards QSRs. Perceived value influences consumer satisfaction because it is ultimately what
influences patronage (Kwun, 2011; Qin et al., 2010).
Perceived value, in regards to monetary price, significantly affects a consumer’s purchase
intention and is a major consideration factor for a consumer’s meal choice (Harrington et al,
2013). The idea of perceived value has become a popular marketing topic as it is considered
another primary factor that influences consumer satisfaction and ultimately visit frequency (Jang,
2015). For a QSR to have a competitive advantage in the restaurant industry, it is important that
it offers food items that consumers associate with a positive perceived value and satisfaction
because consumers are only going to purchase the products or services they value (Soriano,
2002). Therefore, consumer satisfaction, which translates into the more practical consideration of
whether or not consumers will return to a company or recommend it to others, is essential to the
success of business (Namkung & Jang, 2007). Ultimately maximizing a consumer’s perceived
11
value is a successful strategy of a company in terms of long-term business success (Jang, 2015).
Hence, one would surmise from the literature that health and nutrition, quality, and value
play an important role in determining a consumer’s perception of their FAFH experience.
Therefore, it is crucial to delve deeper into consumers’ perceptions of fast food attributes to
better understand why they frequent QSR establishments. Particularly, the main objective of this
study is to investigate whether or not perceived health and nutrition, quality, and value influence
customers’ visit frequency at McDonald’s.
12
CHAPTER III
MATERIALS AND METHODS
Overview of Study Design
This was a convenience study using participants across the U.S. that sought to obtain
McDonald’s customers’ perception regarding perceived health and nutrition, perceived quality,
and perceived value of McDonald’s menu and their effect on visit frequency. The study was
approved by the Institutional Review Board (IRB) of the University of Mississippi.
Participants and Sampling Technique
Participants were recruited to participate in an online survey through Amazon
Mechanical Turk (MTurk). MTurk is an online crowd-sourcing tool in which researchers are able
to post surveys or other experiments and easily recruit large numbers of participants from broad
demographic groups (Enochson & Culbertson, 2015). The researcher can set respondent
restrictions, such as age or even residential region (Crump, McDonnell, & Gureckis, 2013).
Research has lately demonstrated that MTurk is a validated tool for conducting many types of
research, particularly survey research (Crump et al., 2013). MTurk is becoming a commonly
used tool for research where numerous surveys consistently replicate findings from prior
research (Boynton & Richman, 2014). Additionally, MTurk has been shown to be a reliable
source for data gathering that lessens the potential for non-response error in online survey
research (Crump et al., 2013).
13
Through MTurk, this study utilized a non-probability sampling. Selected participants
completed screening questions that required them to be 18 years of age or older, a McDonald’s
customer, and a resident of the U.S. In addition, survey participants were prompted with
informed consent along with contact information of the University of Mississippi’s IRB prior to
advancing to the survey (Appendix A). The MTurk-fielded survey provided a compensation of
$0.25 to participants upon completion. Data was collected on July 31, 2016, of which 843
participants who were McDonald’s users, 18 years of age or older, and residents of the U.S.
participated in the study.
Procedures
Prior to making available the survey to the public through MTurk, a pilot run of the
survey was distributed to approximately 20 students in a Nutrition and Hospitality Management
undergraduate class at the University of Mississippi. In addition, another pilot survey was
distributed to roughly 30 professionals at the Institute of Child Nutrition at the University of
Mississippi. The pilot helped determine an average completion time of two minutes, and
consistency among answers to signify participant understanding of the statements. From the
pilot, it was decided that respondents who completed the MTurk-fielded survey in less than two
minutes were not usable for the data collection, along with participants who left blank or
provided straight-line responses, resulting in a total of 607 (72.0%) usable surveys.
Appendix A provides the survey questions that were used in the study from previous
research conducted in Italy, which has been replicated in several other European countries
(Brindal, Wilson, Mohr, & Wittert, 2014; Hu, Leong, Kim, Ryan, & Warde, 2008; Lassen et al.,
2016; Lee & McCleary, 2013). After reviewing the original statements for appropriateness, two
14
of the statements were removed from the final survey by the researchers. The two statements
removed were “I am a happy customer” and “I am willing to pay more for healthy menu items”
due to the researchers’ opinion that the two statements did not relate to the health and nutrition,
quality, or value of the McDonald’s menu. The questionnaire consisted of three major categories:
a) the 17 attribute statements using a 7-point Likert-type scale from 1 (completely disagree) to 7
(completely agree), b) demographic information (i.e. gender, age, educational level, work status,
ethnicity, and self-reported height and weight), and c) frequency of purchasing food at a
McDonald’s establishment.
Study Variables
The researchers then divided the 17 statements into three categories: perceived health and
nutrition, perceived quality, and perceived value of McDonald’s. These three categories were
present in the original study from Italy, so the researchers kept the three categories as they fit the
present study.
Perceived Health and Nutrition
This section consisted of 10 statements to measure participants’ perceived health and
nutrition of McDonald’s, specifically: “The restaurant offers nutritious products”; “The
restaurant offers healthy products”; “The restaurant offers fresh food”; “The restaurant offers
locally produced products”; “There is an availability of organic food”; “The restaurant offers
products of controlled quality”; “There is an availability of low-calorie meals”; “There is an
availability of small or half-size portions”; “The food offered is safe and sanitary”; and “The
restaurant offers calorie information on the menuboard.”

15
Perceived Quality
The perception of quality of McDonald’s among participants was obtained using seven
statements: “The food presentation is attractive”; “The restaurant serves tasty food”; “The
restaurant’s menu offers a wide range of choices”; “Food presentation is appropriate”; “The food
is satiating (filling)”; “The restaurant is convenient”; and “The restaurant offers innovative menu
items”.
Perceived Value
The last of the three categories, perceived value of McDonald’s food, was attained using
four statements in the survey: “The price of food is a good value for my money”; “I am prepared
to wait for my food”; “The prices are very reasonable”; and “The helpings are adequate”.
Demographics
At the end of the survey, participants were prompted with self-reported demographic
questions regarding their gender, age, educational level, work status, ethnicity, self-reported
height and weight, as well as visit frequency.
Visit Frequency
Participant frequency was obtained in two parts: (1) “This is the first time I have visited
this (a McDonald’s) restaurant” to which the individual checked “yes” or “no”, and (2) “how
often do you purchase food here? Choose one answer that best fits you,” followed by seven
choices: (1) less than once per month, (2) once a month, (3) a few times per month, (4) once per
16
week, (5) a few times per week, (6) every day, and (7) more than once per day.
Analysis
The data was compiled and analyzed using SPSS version 24. Using self-reported height
and weight of each participant, body mass index (BMI) was determined using the formula
(weight x 703) ÷ (height2). After participant’s BMI was calculated, it was categorized into
appropriate BMI classifications based on the Centers for Disease Control and Prevention (CDC)
standards (underweight, normal, or overweight, or obese) (Centers for Disease Control and
Prevention [CDC], 2017).
Descriptive statistics were computed on participant demographics, including their BMI,
and user frequency. Then the demographics were transformed into dummy variables to use for
the remaining analysis utilizing multiple regression. The first multiple regression was employed
to determine the relationship between participant demographics, including their BMI, and
McDonald’s visit frequency. Second, a multiple regression was used to measure the relationship
between the three categories and McDonald’s visit frequency. Similarly, multiple regression was
used to also measure the relationship between the 17 statements and visit frequency. Lastly,
multiple regression was employed to investigate the relationship between participant
demographics, including their BMI, the three categories, and visit frequency.
17
CHAPTER IV
RESULTS
Table 1 provides the frequencies of the participants’ demographics. The sample was
composed of more female participants (55.8%) than male participants (43.8%). The majority of
participants were between the ages of 24-34 (34.4%), with participants 35-44 years of age being
the next largest age range (24.5%). Participants 45-54 years of age were among the next largest
age group (15.0%), followed by those 55 years of age or older (13.0%). Lastly, the youngest age
group, 18-24 years old, was the least represented (12.9%).
Ethnicity was grouped into two categories during the analysis: White and non-White. The
majority of participants were White/Caucasian (76.1%), with the remaining participants being
“non-white” (23.7%). The ethnicities combined in the “non-white” category consisted of
Hispanic/Latino, Black/African American, Asian/Pacific Islander, or Native American/American
Indian/Other with each ethnicity not representing a large enough sample to be a single category.
Regarding the participants level of education, the two most represented groups were
those with a “Bachelor’s degree” (33.9%) and those with “some college or 2-year college
degree” (33.8%). “Master’s degree or higher” was the third largest group (19.8%) to be
represented, with “high school diploma (or GED) or less” as the smallest group (11.7%). The
largest participation group to a McDonald’s establishment was “less than once per month”
(38.6%). The next largest participant frequency included 172 participants (28.3%) who visited a
McDonald’s establishment a “few times per month”, and 103 participants (17.0%) who visited
18
“once a month”. The lowest visit frequency to McDonald’s (15.7%) was “one or more times per
week, or every day or more than once per day.”
Based on participant’s self-reported height and weight, the “underweight” category (those
with a BMI less than 18.5) was combined with the “normal/healthy” category (BMI of 18.5-
24.9) and were 43.5% of the respondents. The “overweight” category (BMI of 25.0-29.9)
consisted of 30.6% of respondents, and the “obese” category (BMI of 30.0 or greater) consisted
of 23.9% of the respondents.

19
Table 1. Frequencies of Demographic Profile of the Sample (N=607)
Characteristics Category N % Gender Male 266 43.8
Female 339 55.8
Age 18-24 78 12.9 25-34 209 34.4 35-44 149 24.5 45-54 91 15.0 55 and older 79 13.0
Ethnicity White or Caucasian 462 76.1 Other 144 23.7 Education High school diploma (or GED) or less 71 11.7 Some college or 2-year college degree 205 33.8 Bachelor’s degree 206 33.9 Master’s degree or higher
120 19.8
Visit Frequency Less than once per month 234 38.6 Once a month 103 17.0 A few times per month 172 28.3 Once or more per day/one-few times per
week
95 15.7
BMI Status Underweight/Normal 264 43.5 Overweight 186 30.6 Obese 145 23.9
BMI status scores: underweight (<18.5) (n=16), normal (18.5-24.9) (n=248)
20
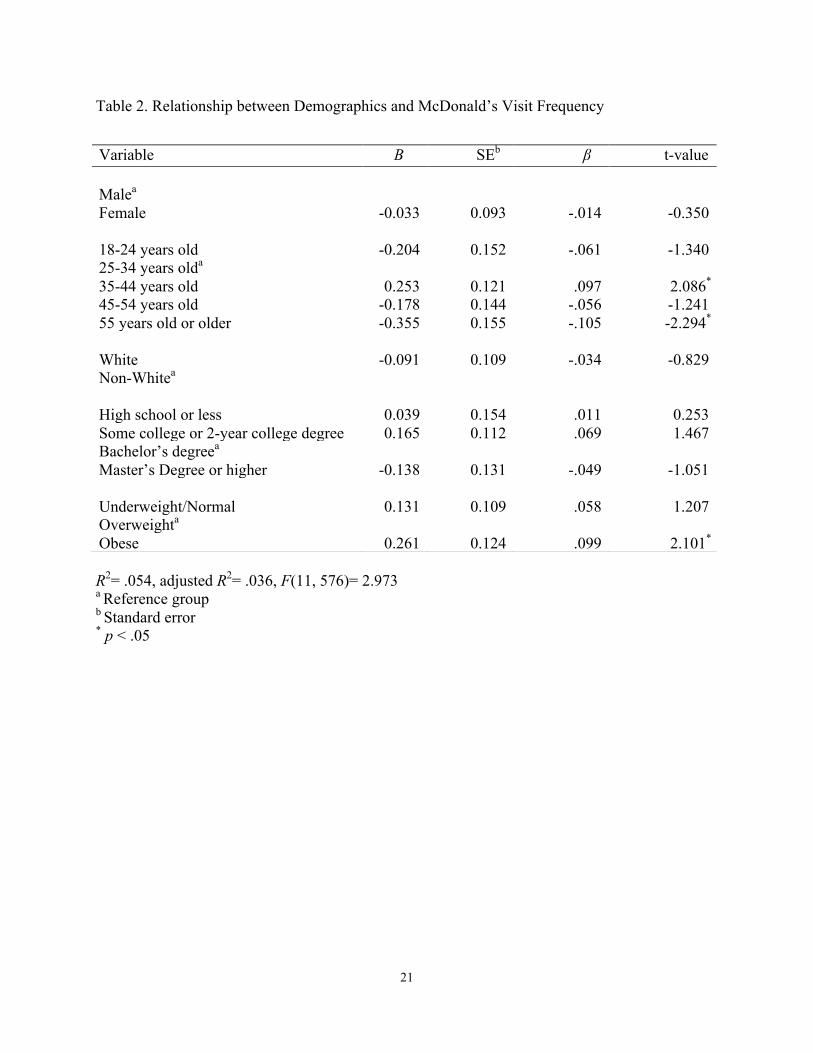
A multiple regression was conducted to compare the relationship between participants’
demographics and visit frequency to McDonald’s. As represented in Table 2, a significant
relationship was found (F(11, 576)= 2.973, p < .05) with an R2 of .054 between frequency and
participants' demographics.
The individual predictors were further examined and indicated three significant
demographic characteristics associated with visit frequency to a McDonald’s establishment.
Participants between the ages of 35 to 44 years old frequented McDonald’s more than the other
age groups (t= 2.086, p < .05). Whereas, visit frequency to McDonald’s was significantly
negative among participants aged 55 and older (t= -2.294, p < .05). Lastly, obese participants
visited McDonald’s more than their other BMI counterparts (t= 2.101, p < .05).
21
Table 2. Relationship between Demographics and McDonald’s Visit Frequency
R2= .054, adjusted R2= .036, F(11, 576)= 2.973 a Reference group b Standard error * p < .05
Variable B SEb β t-value Malea Female -0.033 0.093 -.014 -0.350 18-24 years old -0.204 0.152 -.061 -1.340 25-34 years olda 35-44 years old 0.253 0.121 .097 2.086* 45-54 years old -0.178 0.144 -.056 -1.241 55 years old or older -0.355 0.155 -.105 -2.294* White -0.091 0.109 -.034 -0.829 Non-Whitea High school or less 0.039 0.154 .011 0.253 Some college or 2-year college degree 0.165 0.112 .069 1.467 Bachelor’s degreea Master’s Degree or higher -0.138 0.131 -.049 -1.051 Underweight/Normal 0.131 0.109 .058 1.207 Overweighta Obese 0.261 0.124 .099 2.101*
22
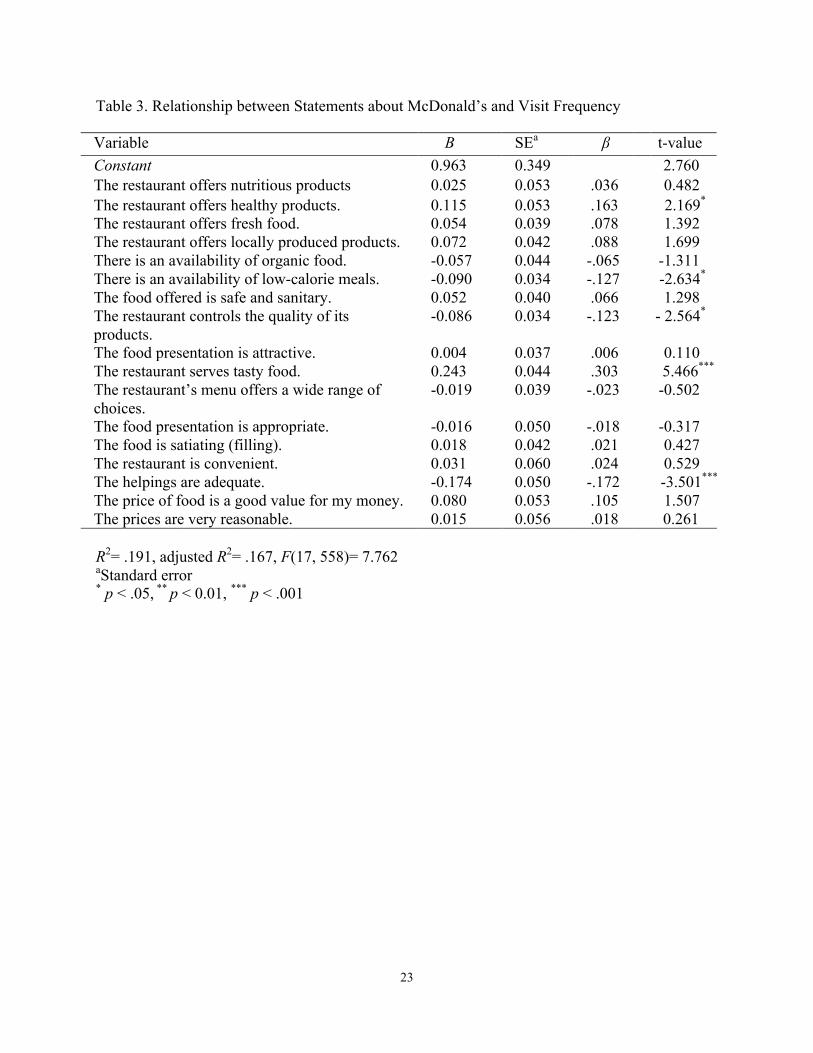
The relationship between the 17 statements about perceptions to McDonald’s food and
visit frequency was analyzed. The results of the multiple regression are shown in Table 3. A
significant association was found (F(17, 558)= 7.762, p < .001), with an R2 of .191. The
regression results indicated that among the 17 statements, two were positively associated with
visit frequency and three were negatively associated with frequency. The two statements
positively associated with visit frequency were: “the restaurant offers healthy products” (t=2.169,
p < .05) and “the restaurant serves tasty food” (t=5.466, p < .001). Three statements were
negatively associated with visit frequency: “there is an availability of low-calorie meals” (t=-
2.634, p < .05), “the restaurant controls the quality of its products” (t=-2.564, p < .05), and “the
helpings are adequate” (t=-3.501, p < .001). The remaining twelve statements did not
demonstrate a significant association with visit frequency.
23
Table 3. Relationship between Statements about McDonald’s and Visit Frequency
R2= .191, adjusted R2= .167, F(17, 558)= 7.762 aStandard error * p < .05, ** p < 0.01, *** p < .001
Variable B SEa β t-value Constant 0.963 0.349 2.760 The restaurant offers nutritious products 0.025 0.053 .036 0.482
The restaurant offers healthy products. 0.115 0.053 .163 2.169* The restaurant offers fresh food. 0.054 0.039 .078 1.392 The restaurant offers locally produced products. 0.072 0.042 .088 1.699 There is an availability of organic food. -0.057 0.044 -.065 -1.311 There is an availability of low-calorie meals. -0.090 0.034 -.127 -2.634* The food offered is safe and sanitary. 0.052 0.040 .066 1.298 The restaurant controls the quality of its products.
-0.086 0.034 -.123 - 2.564*
The food presentation is attractive. 0.004 0.037 .006 0.110 The restaurant serves tasty food. 0.243 0.044 .303 5.466*** The restaurant’s menu offers a wide range of choices.
-0.019 0.039 -.023 -0.502
The food presentation is appropriate. -0.016 0.050 -.018 -0.317 The food is satiating (filling). 0.018 0.042 .021 0.427 The restaurant is convenient. 0.031 0.060 .024 0.529 The helpings are adequate. -0.174 0.050 -.172 -3.501*** The price of food is a good value for my money. 0.080 0.053 .105 1.507 The prices are very reasonable. 0.015 0.056 .018 0.261
24
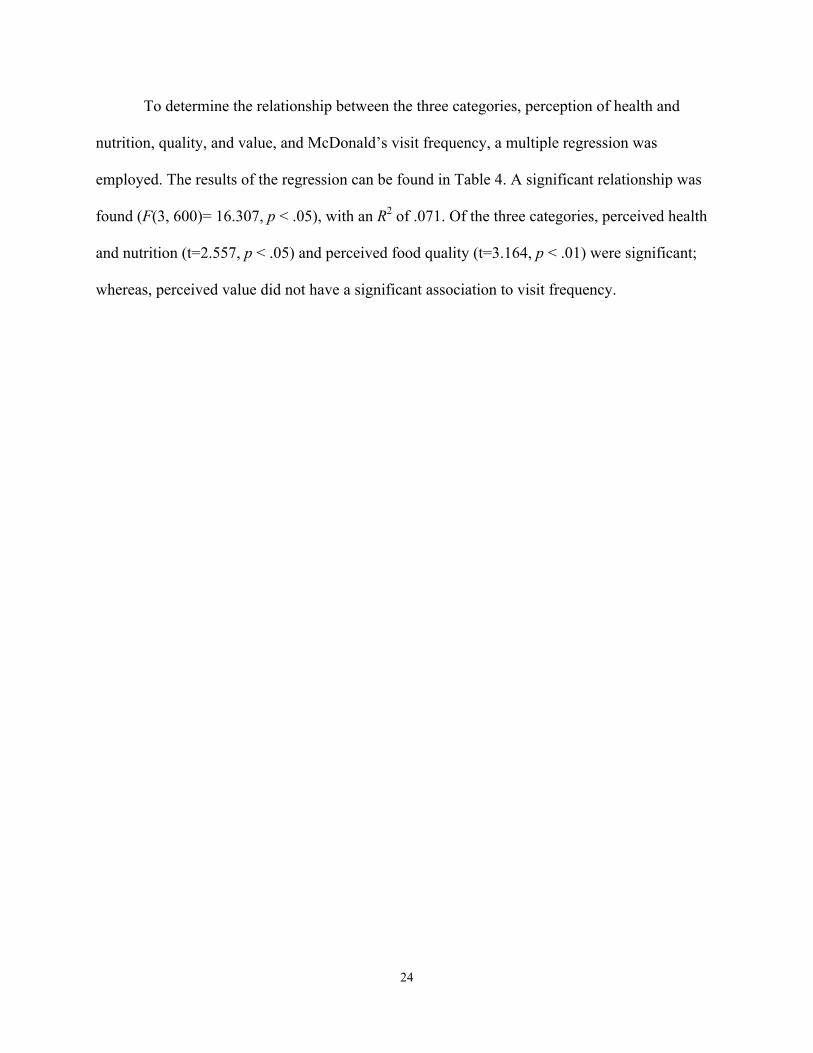
To determine the relationship between the three categories, perception of health and
nutrition, quality, and value, and McDonald’s visit frequency, a multiple regression was
employed. The results of the regression can be found in Table 4. A significant relationship was
found (F(3, 600)= 16.307, p < .05), with an R2 of .071. Of the three categories, perceived health
and nutrition (t=2.557, p < .05) and perceived food quality (t=3.164, p < .01) were significant;
whereas, perceived value did not have a significant association to visit frequency.
25
Table 4. Relationship Between Perception of Health and Nutrition, Quality, and Value Categories and Visit Frequency
R2= .075, adjusted R2= .071, F(3, 600)= 16.307 a Standard error. * p < .05, ** p < .01
Variable B SEa β t-value Constant 0.711 0.239 2.971 Mean Health and Nutrition 0.121 0.047 .119 2.557*
Mean Quality 0.176 0.056 .168 3.164**
Mean Value 0.036 0.048 .036 0.749
26
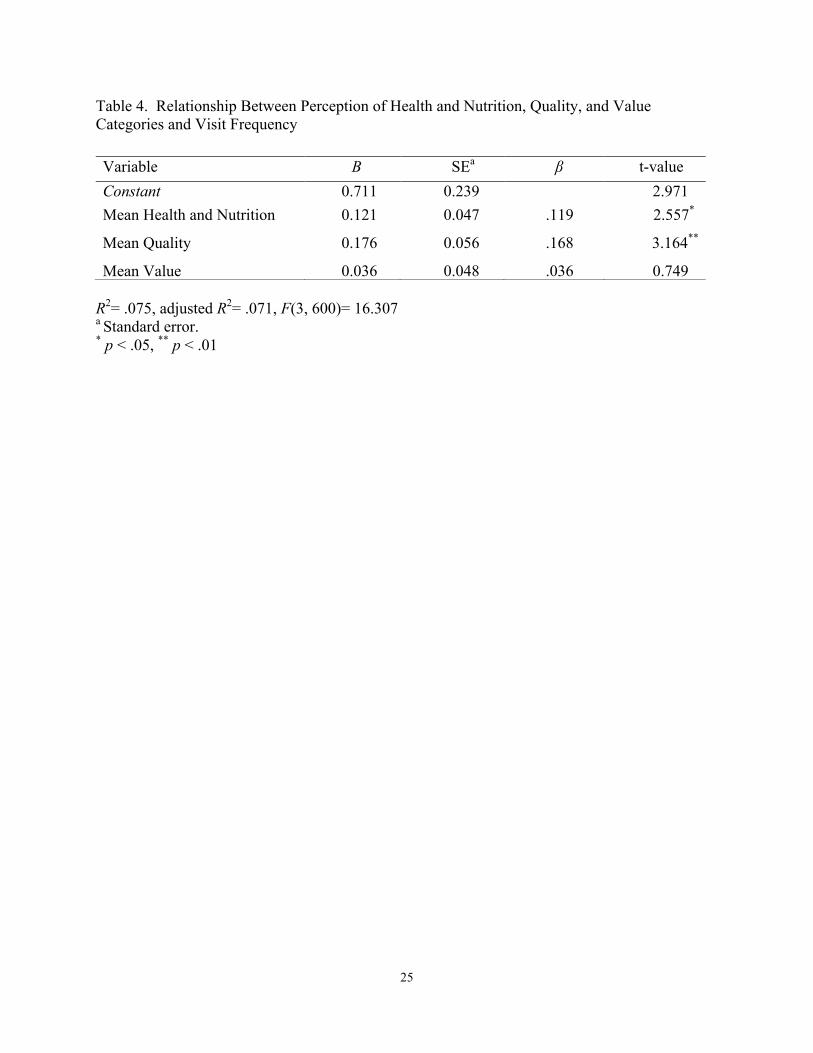
Dummy variables were used to determine if there were relationships between the
demographic variables and the three perception categories, and McDonald’s visit frequency. A
multiple regression was employed; the results are represented in Table 5. A significant regression
was found (F(14, 573)= 7.649, p < .001) with an R2 of .157.
The results of this analysis yielded significant associations between participants’
demographics and the three perception categories related to McDonald’s visit frequency. Two of
the perception categories had a significant positive relationship with visit frequency. “Perceived
health and nutrition” (t=3.910, p < .001) and “perceived quality” (t= 3.538, p < .001) showed a
positive relationship as opposed to perceived value, which was not significant. Regarding
demographics, the participants who were considered obese by their calculated BMI (t= 2.217, p
< 0.05) were positively associated with visit frequency to McDonald’s. A negative association to
visit frequency was found among two age groups. Those between the ages of 45 to 54 years old
(t= -2.392, p < .05), and those 55 years of age and older (t= -4.103, p < 0.001) were significantly
less likely to visit McDonald’s. The other demographics did not reveal any significant
associations regarding their perceptions of McDonald’s and visit frequency.
27
Table 5. Relationship between Demographics and 3 Perception Categories, and McDonald’s Visit Frequency
R2= .157, adjusted R2= .137, F(14, 573)= 7.649 Reference group is in parentheses. aStandard error. * p < .05, *** p < .001
Variable B SEa β t-value Perception Categories
Perceived Health and Nutrition 0.189 0.048 .186 3.910***
Perceived Quality 0.195 0.055 .186 3.538***
Perceived Value 0.018 0.048 .018 0.374 Demographic Characteristics
Female (male) 0.049 0.089 .022 0.547 Age 18-24 y (age 25-34 y) -0.153 0.144 -.046 -1.064 Age 35-44 y (age 25-34 y) 0.199 0.115 .076 1.720 Age 45-54 y (age 25-34 y) -0.333 0.139 -.105 -2.392*
Age 55 y and older (age 25-34 y) -0.622 0.152 -.185 -4.103*** White (non-white) -0.078 0.103 -.030 -0.757 High school or less (Bachelor’s degree) -0.016 0.146 -.004 -0.106
Some college or 2-year college degree (Bachelor’s degree)
0.151 0.107 .064 1.418
Master’s Degree or higher (Bachelor’s degree) -0.153 0.124 -.054 -1.232 Underweight/Normal (overweight) 0.118 0.103 .052 1.144 Obese (overweight) 0.261 0.118 .099 2.217*
28
CHAPTER V
DISCUSSION AND CONCLUSION
The purpose of this study was to gain a better understanding of McDonald’s customer’s
perceptions of its meal item attributes of health and nutrition, quality, and value to better
understand their impact on frequency to McDonald’s. Literature has demonstrated that the
aforementioned perceptions- particularly nutrition, taste, and price- play an important role in
determining a consumer’s FAFH experience (Jang et al., 2011). The findings of the current study
provide important implications for future QSR operations and consumer marketing utilizing fast
food consumer’s preferences and perceptions related to visit frequency to McDonald’s.
Study’s Participants and Visit Frequency
The majority of participants in this study of McDonald’s customers were White females,
25-44 years of age, with some college/2-year degree or a Bachelor’s degree, overweight or
obese, and frequenting McDonald’s less than once per month to a few times per month. Gender
differences have been identified as one of the more important personal characteristics in
understanding consumer behavior (Kwun, 2011). It is interesting that in this study the majority of
participants were female customers, which lies contrary to studies that have established that
males consume fast food more often than females (Dave et al., 2009; Garza, et al., 2016; Nguyen
& Powell, 2014). However, females tend to pay more attention to and have more concern about
food choices (Kwun, 2011). Females are more likely to attach a greater importance to healthy
29
eating (Wardle et al., 2004) and are more apt to evaluate more foodservice attributes, such as
quality and dietary attributes (Harrington et al., 2010), to form perceptions of value and
satisfaction than their male counterparts (Kwun, 2011). Similar to the current study, women tend
to be more likely to eat fast food due to family or friend influences (Rydell et al., 2008).
According to the most recent U.S. Census Bureau, the average family consists of three to four
people (U.S. Census Bureau, 2017). Since over half of the participants in the present study were
between the ages of 25 and 44 years old, most likely many are parents of children. The females
within that age group may be the primary food purchaser for their families, or may often be the
parent who escorts their children to and from school and after-school activities than the male
head of the household, resulting in higher visit of McDonald’s than their male counterparts. The
larger percentage of female fast food customers in this study could also signify a shift in previous
fast food trends/norms of men being the primary fast food consumers, thus contributing new fast
food consumer demographic data to current literature.
A consumer’s educational background appears to be another important social variable
that explains differences in dietary habits among individuals (Le at al., 2013). The present study
demonstrated that individuals with higher education (above a Bachelor’s degree) reported to
have lower fast food consumption, similar to findings from Paeratakul et al. (2003). This can
possibly be explained by individuals with a higher education tend to have more positive attitudes
toward eating healthy than those who are less educated (Lassen et al., 2016). Increased education
may likewise increase awareness of health and nutrition, and ultimately create a self-imposed
healthier diet (Le at al., 2013), as they may view fast food as being unhealthful (Dave et al.,
2009). On the opposite end of the educational spectrum however, this study revealed that
individuals with a high school diploma or less are less likely to consume fast food, which is
30
contrary to findings from Garza et al. (2016). It is possible that individuals with lower levels of
education may earn an income that greatly appreciates the value of fast food meals, as evidenced
by Oexie et al. (2015), who reported that fast food frequency is associated with consumption
among low income individuals.
Despite income, calorie labels tend to be less visible to those with high school or lower
education and may attribute to their greater frequency of fast food. Those who read and
understand calorie labels appear to be more educated (Elbel et al., 2013). Generally speaking,
those with lower educational levels tend to have a lesser understanding of caloric content of fast
food meals (Dunn, Sharkey, & Horel, 2012). It can be inferred that due to the poorer
understanding of caloric content in fast food meals, those with lower educational levels are less
likely to read calorie labels and be health-conscious out of mere lack of understanding of
nutrition-related knowledge.
Regarding ethnicity, the findings from this study lie contrary to typical QSR
characteristics that suggest that non-White individuals consume more fast food meals than those
who are White, and this may be due to greater access to fast food establishments (Dunn et al.,
2012) versus other types of restaurants, like casual dining. Likewise, Black individuals tend to
frequent fast food more often (Nguyen & Powell, 2014) per week than their racial counterparts
(Elbel et al., 2013). The frequency of visiting fast food among non-White individuals may be due
to differences in socioeconomic status, fast food access, or attention to personal nutrition (Boek
Bianco-Simeral, Chan, & Goto, 2012).
The significance of high visit frequency among obese McDonald’s customers in this
study aligns with findings from previous research; BMI and fast food consumption are positively
correlated (Bowman & Vinyard, 2004; Dunn et al., 2012), particularly due to greater impulsivity
31
(Garza et al., 2016). Impulsivity for a food reward has been shown to be linearly correlated to
BMI (Schiff et al., 2016). With the conveniences of today’s lifestyles, the consumption of fast
food for family meals is contributing to the increasing prevalence of obesity in adults and
adolescents (Boutelle et al., 2007). The present study found that individuals within a
normal/healthy BMI range consume fast food significantly less often than those in the
overweight or obese category. Based on numbers alone, one-third of the respondents in this study
are classified as overweight and one-quarter are classified as obese. The individuals in these
weight categories are most likely to visit McDonald’s, which supports previous studies that BMI
is positively correlated to fast food consumption (Bowman & Vinyard, 2004; Dunn et al., 2012).
Furthermore, this study revealed that customers most likely to frequent McDonald’s are
those between the ages of 25 and 44 years old. Consumption of fast food tends to be more
frequent for younger people (Nguyen & Powell, 2014) and decreases as people age (Dave et al.,
2009). This is similar to Elbel et al. (2013) who demonstrated that younger populations,
particularly 25-39 years old, are likely to consume more fast food per week, with older
consumers more likely to be on a specialized diet that may result in less fast food consumption.
However, this study found that the youngest age group, 18-24 years of age, had a frequency level
comparable to those aged 55 and older, possibly because customers aged 16 to 24 are more likely
to eat fast food because their friends or family like it, but are less likely to eat fast food because
of a food establishment’s nutritious offerings (Rydell et al., 2008). This may suggest that
younger ages frequent fast food for reasons related to family or social reasons. Williams and
Page (2011) found that Generation Y (those born between the years of 1977-1994) have a greater
need to fit in and connect with their peers and enjoy social networking. Not surprising is that
consumers who are older than 55 years old tend to be more health conscious when choosing
32
where or what to eat (Dave et al., 2009). It appears that as people age they are more concerned
about their own health. Therefore, older individuals with health problems may be more likely to
consider where and what to eat.
Menu Perceptions of Health and Nutrition, Quality, and Value and Visit Frequency
Two menu statements that showed advantageous associations to McDonald’s frequency
were “the restaurant offers healthy products” and “the restaurant serves tasty food”. Three
statements (“there is an availability of low-calorie meals”, “the restaurant controls the quality of
its products”, and “the helpings are adequate”) showed negative significance on visit frequency.
In 2012, McDonald’s began to voluntarily post calories on their menu boards (Strom, 2012) due
to increased interest by consumers (Nielsen, 2015) and the restaurant’s efforts to be more
transparent about menu items (Failla, 2015). With increased consumer interest, and consumers
relying on their own perceptions of healthfulness of QSR menu items (Wei & Miao, 2013), it
appears from this study that McDonald’s is receiving a positive impact on visit frequency for its
healthy product offerings, such as yogurt parfaits, oatmeal, salads, and apple slices, among other
menu items. However, due to their self-imposed menu labeling, consumers now view the actual
amount of calories, which appears to be causing a negative perception of low-calorie meals,
resulting in a negative effect to visit frequency. One sees that while McDonald’s customers are
giving McDonald’s significant visit frequency for having healthy products, while they are not
frequenting McDonald’s when considering the calories in their menu items, possibly due to the
posted calorie information. This may be encouraging consumers to choose other restaurants
instead for lower calorie foods.
Competing QSRs may be perceived as providing better lower calorie menu options (like
33
Subway’s under 500-calorie menu items). Above most QSRs, Subway has a “health halo” and is
perceived as healthier than McDonald’s. For example, consumers of Subway estimated 20% and
25% lower calorie content in meal options than in those served at McDonald’s (Block et al.,
2013). It appears that competition from other QSRs menus that are perceived as having low
calorie foods is out-competing McDonald’s low calorie menu items. This finding suggests that
people eat at QSRs for healthy. tasty, and low-calorie products.
The lack of positive correlation with visit frequency to McDonald’s product quality could
be possibly due to multiple incidences of negative publicity. One such incident occurred in 2012
when McDonald’s reached out to Twitter, a social media engine, for customers to share positive
thoughts or stories about their experiences at the large chain restaurant. Within two hours,
McDonald’s took down the question because it did the opposite; it exposed a massive amount of
negative comments from Twitter users (Pfeffer, Zorbach, & Carley, 2014). Another form of
negative publicity for McDonald’s regarded the quality of their meal items, particularly the
chicken nuggets and hamburger meat, as being made from food additives that were genetically
modified in the form of “pink slime”, something that McDonald’s did not address and change
until 2012 (Madinabeitia & Gournelos, 2014). Despite the negative nature surrounding
McDonald’s and some of its products, customers continue to order and eat at McDonald’s for
reasons possibly identified in this study, like tasty and healthy menu items.
A surprising finding of the present study was the negative correlation between adequate
helpings and visit frequency considering that the size of U.S. QSR menu items have increased
over the years through larger products (Vermeer, Steenhuis, & Poelman, 2014). Considering the
high consumption of FAFH and rise in obesity among Americans, larger portions may increase
consumer perceptions of normal intake standards (Fisher & Kral, 2008). It could be expected that
34
consumers who prefer larger portion sizes are more prone to visiting establishments that offer
large helping sizes. A consumer may also feel like larger portions are a better value for their
money, as supported by Choi & Zhao (2014) who revealed that portion size of food is a critical
attribute to younger age groups because they tend to consider price more than other ages.
However, after the release of the documentary about McDonald’s called Supersize Me (by
Spurlock in 2004, a study presented results that nearly half of its respondents thought that large
amounts of fast food generally contributed to obesity due to the high amount of calories and fat
in meal items (Binkley, 2006). This may cause some consumers to visit less frequently QSRs as
a whole, or establishments in which they personally believe provide larger portions than they
want to consume.
Similarly, according to prior research, food items with a variety of tastes are significantly
important to consumers (Roseman, Joung, Choi, & Kim, 2017), with most menu trends in QSRs
including healthy and new/varied menu items (Kwun, 2011), which is supported by this present
study. Not only is taste an important factor, but it is commonly an important predictor for regular
fast food consumer frequency (Boek et al., 2012; Garza et al., 2016; Lassen et al., 2016; Rydell
et al., 2008). Taste is a valuable tool for measuring consumer acceptance of food because it is
also an important factor when choosing healthy food choices at an establishment (Choi & Zhao,
2014), thus supporting this study’s findings that healthy and tasty menu items are important
predictors of McDonald’s customers’ frequency.
Menu Perception Categories and Visit Frequency
Interestingly, when examining customer demographics with the three perception
categories (health and nutrition, quality, and value) and the effect on visit frequency, there is a
35
difference in demographics regarding individuals who frequent McDonald’s, particularly with
those aged 35-44, as their demographic relationship to frequency is no longer significant. The
high visit frequency of these customers, which is the second highest age group of study
participants, may be due to the fact that they are working parents of younger children. Around
30% of children aged 4-19 years old consume fast food on a typical day in the U.S. because
working parents typically have less time to prepare food for their families (Das, 2015) due to
time constraints or busy schedules of the parents and/or children (Boutelle et al., 2007).
Similarly, fast food establishments are common among families with children because of their
convenience and low prices (Kraak, Gootman, & McGinnis, 2006). However, underneath the
notion of convenience lies the marketing of fast food that both influences the preferences and
consumption of fast food by children and prompts children to demand such foods from their
parents (Sonntag et al., 2015). Children may be thinking of advertisements they see on television,
and parents may be thinking of immediate rewards of frequenting McDonald’s, such as placating
or feeding their children, or the ease of obtaining meals for the family, as opposed to being
swayed by their personal perceptions of its food items.
Furthermore, results from this study show that customers least likely to frequent
McDonald’s are those aged 45 years and older. Again this may continue to be supported by the
idea that as people age, they tend to be more health conscious, thus affecting where or what they
eat (Dave et al., 2009). Lastly, results are consistent within weight categories in the present
study, as those who are obese are still more likely to visit McDonald’s than their counterparts,
even when factoring in their perceptions of McDonald’s menu items. This may demonstrate that
individuals who are obese may have a greater need or temptation for the immediate reward and
gratification of fast food (Schiff et al., 2016).
36
Ultimately, the menu perception categories of health and nutrition and food quality
showed a significantly positive association with McDonald’s frequency. Namkung and Jang
(2007) reveal that food quality encompasses many factors that ultimately influence visit
frequency including presentation, menu variety, and taste. Fast food consumers tend to view such
food as tempting due to its appetizing nature (Lassen et al., 2016) with a greater impulsivity
associated with the purchase of such food (Schiff et al, 2016). This study shows that customers
appear to frequent McDonald’s for factors such as taste and the availability of healthy options,
but adequate helpings, controlled product quality, and the availability of low-calorie meals may
be creating a negative association between visit frequency and perceptions of McDonald’s.
Finally, it seems that customers, when considering McDonald’s low-calorie menu items, do not
visit McDonald’s as frequently as they do for other attributes. This may suggest that while
customers give McDonald’s credit for having some healthy menu items, their visits are also
influenced by other attributes, some of which may not have been asked in this study, or they may
simply choose to eat at McDonald’s for reasons such as impulsivity or temptation. Possibly these
customers avoid McDonald’s so they are not tempted to purchase their higher calorie menu
items.
Limitations and Suggestions for Future Research
The limitations of this study relate mainly to the reliance that each participant was in fact
a McDonald’s customer at the time of the study survey, and that they were truthfully conveying
their perceptions of McDonald’s meal items. Some critics of MTurk contend that because of the
generally low financial reward for participants, they may pay little attention to questions they are
answering. Also, utilizing only MTurk users is a limitation, as it may not be entirely
37
representative of the average McDonald’s population, or even the U.S. population.
However, a strength of this study is that research has shown that MTurk participants
versus non-MTurk survey participants do not differ in terms of attentiveness (Bartneck, Duenser,
Moltchanova, & Zawieska, 2015). Yet another strength of this study was that the sample size
was large and enabled the researchers to assess food choices and perceptions in each gender, age,
ethnicity, education level, and BMI separately.
Another limitation of this study is that only one fast food establishment was investigated.
Future studies could use the same variables and include other QSRs, possibly including ones that
may be labeled as “healthy” such as Subway to compare to McDonald’s or other QSRs.
Customers in the current study based their answers on perceptions from memory, such as taste
and availability of low-calorie items. The results have the potential to be different if the survey
was distributed in person in a McDonald’s while customers are eating or making a food
selection.
Conclusion
A significant and unique aspect of this study is the effect of perceived health and
nutrition and quality on McDonald’s visit frequency. To the knowledge of the researchers of this
study, this is the first one to analyze McDonald’s customer demographics and perceptions of
health and nutrition, quality, and value as they relate to visit frequency of a McDonald’s
establishments. The participants who visited McDonald’s more often had significantly higher
perceptions of health and nutrition and quality of McDonald’s food. As a large stakeholder in the
global QSR network, the results provided by this study can provide McDonald’s additional
insight on key determinants of customer frequency based on their menu, or lack thereof, to
38
improve upon or maintain the establishment’s already existing success. Because fast food
accounts for a large share of U.S. food expenditures and calorie consumption, and considering
that perceived health and nutrition and quality are such crucial motivating factors behind a
consumer’s acceptance of fast food, it is imperative for public health efforts to influence QSR
marketing standards to incorporate a variety of quality, healthy, and nutritious foods into their
menus. The need for healthier and higher quality foods requires QSRs to understand and meet
the needs of their consumers, including health-conscious individuals. Meeting the needs of
consumers ensures more business for an establishment; however, on a deeper level, developing
and marketing healthy menu items to consumers may prompt Americans to eat healthier while
dining out, thus lowering obesity rates and chronic diseases in the U.S., resulting in improving
society as a whole.
Based on this study’s results, one could speculate whether posted nutrition information
on menu boards has in fact increased customers’ awareness of the amount of calories consumed
when eating at McDonald’s. Such information may be encouraging customers, when looking for
lower calories menu items, to choose restaurants other than McDonald’s when eating out.
Americans' level of attention to nutritional information in restaurants may increase as the
practice of posting such information becomes more common, and as awareness of calories in
food increases. Whereas, there may be a certain portion of the population that simply ignores or
disregards the health and/or nutrition information of food when deciding what to eat, and places
more of an importance on other aspects of the food, such as taste, or the temptation for such
food. From a policy standpoint, with the continued rising rates of obesity in the U.S., the issue
can be partially tackled on a basic level of educating Americans what calories are, how much an
individual needs and how to interpret them when eating out. While there is still more data that

39
needs to be collected to more accurately grasp consumer perceptions of QSRs, the end goal of
this study is for the findings to contribute useful knowledge to the literature in the field of
restaurant industry and nutrition research, which may help individuals eat more healthy and
possible lower the rates of obesity in the U.S.

40
REFERENCES
41
Binkley, J. K. (2006). The effect of demographic, economic, and nutrition factors on the
frequency of food away from home. Journal of Consumer Affairs, 40(2), 372-391.
Bleich, S., Wolfson, J., & Jarlenski, M. (2015). Calorie changes in chain restaurant
menu items: Implications for obesity and evaluations of menu labeling. American Journal
of Preventive Medicine, 48(1), 70-75.
Boynton, M. & Richman, L. (2014). An online daily diary study of alcohol use using
Amazon's Mechanical Turk. Drug and Alcohol Review, 33(4), 456-461.
Breck, A., Cantor, J., Martinez, O., & Elbel, B. (2014). Who reports noticing and using calorie
information posted on fast food restaurant menus? Appetite, 81, 30-36.
Brindal, E., Wilson, C., Mohr, P., & Wittert, G. (2014). Nutritional consequences of a fast food
eating occasion are associated with choice of quick-service restaurant chain. Nutrition &
Dietetics, 71(3), 184-192.
Brown, A. (2013). In U.S., Less Than Half Look at Restaurant Nutrition Facts. Gallup News.
Retrieved from http://www.gallup.com/poll/163904/less-half-look-restaurant-nutrition-
facts.aspx
Centers for Disease Control and Prevention. (2017). About adult obesity. Retrieved from
https://www.cdc.gov/obesity/data/childhood.html
Chandon, P., &Wansink, B. (2007). The biasing health halos of fast-food restaurant health
claims: lower calorie estimates and higher side-dish consumption 242 intention. Journal
of Consumer Research, 34, 301-314.
Crump, M., McDonnell, J., & Gureckis, T. (2013). Evaluating Amazon's Mechanical
Turk as a tool for experimental behavioral research. PloS One, 8(3), e57410.
Dave, J. An, L., Jeffery, R., & Ahluwalia, J. (2009). Relationship of attitudes
42
toward fast food and frequency of fast-food intake in adults. Obesity, 17(6), 1164-
1170.doi: 10.1038/oby.2009.26.
De Nisco, A., & Warnaby, G. (2014). Urban design and tenant variety influences on consumers'
emotions and approach behavior. Journal of Business Research, 67(2), 211-217.
Enochson, K., & Culbertson, J. (2015). Collecting psycholinguistic response time data using
amazon mechanical turk. PloS One, 10(3), e0116946.
Fisher, J. O., & Kral, T. V. (2008). Super-size me: Portion size effects on young children's
eating. Physiology & Behavior, 94(1), 39-47.
French, S., Story, M., Neumark-Sztainer, D., Fulkerson, J., & Hannan, P. (2001). Fast food
restaurant use among adolescents: Associations with nutrient intake, food choices and
behavioral and psychosocial variables. International Journal of Obesity & Related
Metabolic Disorders, 25(12), 1823-1833.
Garza, K., Ding, M., Owensby, J, & Zizza, C. (2016). Impulsivity and fast-food
consumption: A cross-sectional study among working adults. Journal of the Academy of
Nutrition and Dietetics, 116(1), 61-68.
Green, J., Brown, A., & Ohri-Vachaspati, P. (2015). Sociodemographic disparities among
fast-food restaurant customers who notice and use calorie menu labels. Journal of the
Academy of Nutrition and Dietetics, 115(7), 1093-1101.
Hamrick, K., & Okrent, A. (2014). The Role of Time in Fast-Food Purchasing Behavior in the
United States, ERR-178, U.S. Department of Agriculture, Economic Research Service.
Harrington, R., Ottenbacher, M., & Way, K. (2013). QSR choice: Key restaurant
attributes and the roles of gender, age and dining frequency. Journal of Quality
Assurance in Hospitality & Tourism, 14(1), 81-100.
43
Hu, S., Leong, J., Kim, W., Ryan, B., & Warde, W. (2008). Senior citizens'
perceived service levels in three restaurant sectors. Journal of Foodservice Business
Research, 11(2), 202-219.
Hwang, J. (2011). The impacts of nutrition information on consumers evaluations toward fast
food meals. ProQuest Dissertations & Theses Global. Retrieved from
http://ezproxy.library.arizona.edu/login?url=https://search-proquest-
com.ezproxy1.library.arizona.edu/docview/1468420335?accountid=8360
Hwang, J., & Cranage, D. (2010). Customer health perceptions of selected fast-food restaurants
according to their nutritional knowledge and health consciousness. Journal of
Foodservice Business Research, 13(2), 68-84.
Jang, Y. (2015). Perceived value of fast-food restaurant franchises in the USA. FIU Electronic
Theses and Dissertations. Retrieved from http://digitalcommons.fiu.edu/etd/1823.
Jang, Y., Kim, W., & Bonn, A. (2011). Generation Y consumers’ selection attributes
and behavioral intentions concerning green restaurants. International Journal of
Hospitality Management, 30(4), 803-811.
Jang, S., & Namkung, Y. (2009). Perceived quality, emotions, and behavioral intentions:
Application of an extended Mehrabian–Russell model to restaurants. Journal of Business
Research, 62(4), 451-460.
Kumcu, A., & Okrent, A. (2014). Methodology for the Quarterly Food-Away-from-Home Prices
Data, TB-1938, U.S. Department of Agriculture, Economic Research Service.
Kwun, D. (2011). Effects of campus foodservice attributes on perceived value, satisfaction,
and consumer attitude: A gender-difference approach. International Journal of
Hospitality Management, 30(2), 252-261.
44
Lassen, Lehmann, Andersen, Werther, Thorsen, Trolle, E., ... & Tetens, I. (2016). Gender
differences in purchase intentions and reasons for meal selection among fast food
customers–Opportunities for healthier and more sustainable fast food. Food Quality and
Preference, 47, 123-129.
Lee, S., & McCleary, K. (2013). The relationship between perceived health, health attitude, and
healthy offerings for seniors at family restaurants. Cornell Hospitality Quarterly, 54(3),
262-273.
Lee, M., & Ulgado, F. M. (1997). Consumer evaluations of fast-food services: A cross-national
comparison. Journal of Services Marketing, 11(1), 39-52.
Lin, B-H., & Guthrie, J. (2012). Nutritional Quality of Food Prepared at Home and Away from
Home 1977-2008, EIB-105, USDA, Economic Research Service. Retrieved from
http://www.ers.usda.gov/publications/eib-economic-information-bulletin/eib105.aspx.
Madinabeitia, V., & Gournelos, T. (2014). McDonalds’ Pink Slime Crisis: A Failed Campaign.
Retrieved from http://scholar.googleusercontent.com/scholar?q=cache:B8lI5heTX-
cJ:scholar.google.com/+mcdonalds+fake+meat&hl=en&as_sdt=0,25
Mancino L., Todd J.E., Guthrie J., & Lin B-H. (2010). How Food Away From Home Affects
Children’s Diet Quality. ERR-104. U.S. Dept. of Agriculture, Economic Research
Service
Morrison, R. M. (2013). USDA Economic Research Service-Food Prices and Spending.
Retrieved from http://www.ers.usda.gov/data-products/ag-and-food-statistics-charting-
the-essentials/food-prices-and-spending.aspx.
Musaiger, A. O. (2014). Consumption, health attitudes and perception toward fast food among
Arab consumers in Kuwait: Gender differences. Global Journal of Health Science, 6(6),
45
136.
National Restaurant Association. (2016). 2016 Restaurant Industry Forecast. Retrieved from
http://www.restaurant.org/Home/old_files/2016-Restaurant-Industry-Forecast.
Namkung, Y., & Jang, S. (2007). Does food quality really matter in restaurants? Its impact on
customer satisfaction and behavioral intentions. Journal of Hospitality & Tourism
Research, 31(3), 387-409.
Namkung, Y., & Jang, S. (2008). Are highly satisfied restaurant customers really different? A
quality perception perspective. International Journal of Contemporary Hospitality
Management, 20(2), 142-155.
NCES. (2017). Number of restaurants in the United States from 2011 to 2016. Statista.
Retrieved from https://www.statista.com/statistics/244616/number-of-qsr-fsr-chain-
independent-restaurants-in-the-us/
Nguyen, B. T., & Powell, L. M. (2014). The impact of restaurant consumption among US adults:
Effects on energy and nutrient intakes. Public Health Nutrition, 17(11), 2445-2452.
Oches, S. (2017). The QSR 50. QSR Magazine. Retrieved from
https://www.qsrmagazine.com/reports/2017-qsr-50.
Oliver, R. (1997). A Behavioral Perspective on the consumer. New York: Irwin-McGraw—
Hill.
Pfeffer, J., Zorbach, T., & Carley, K. M. (2014). Understanding online firestorms: Negative
word-of-mouth dynamics in social media networks. Journal of Marketing
Communications, 20(1-2), 117-128.
Ponnam, A., & Balaji, M. (2014). Matching visitation-motives and restaurant attributes in
casual dining restaurants. International Journal of Hospitality Management, 37, 47-57.
46
Qin, H., Prybutok, V. R., & Zhao, Q. (2010). Perceived service quality in fast-food restaurants:
Empirical evidence from China. International Journal of Quality & Reliability
Management, 27(4), 424-437.
Roseman, M., Joung, H., Choi, E., & Kim, H. (2017). The effects of restaurant
nutrition menu labelling on college students’ healthy eating behaviors. Public Health
Nutrition, 20(5), 797-804.
Rydell, S. A., Harnack, L. J., Oakes, J. M., Story, M., Jeffery, R. W., & French, S. A. (2008).
Why eat at fast-food restaurants: reported reasons among frequent consumers. Journal of
the American Dietetic Association, 108(12), 2066-2070.
Schiff, S., Amodio, P., Testa, G., Nardi, M., Montagnese, S., Caregaro, L., ... & Sellitto, M.
(2016). Impulsivity toward food reward is related to BMI: Evidence from intertemporal
choice in obese and normal-weight individuals. Brain and cognition, 110, 112-119.
Sinclair, S., Cooper, M., & Mansfield, E. (2014). The influence of menu labeling on
calories selected or consumed: A systematic review and meta-analysis. Journal of the
Academy of Nutrition and Dietetics, 114(9), 1375-1388.
Soriano, D. (2002). Customers' expectations factors in restaurants: The situation in
Spain. International Journal of Quality & Reliability Management, 19(8/9), 1055-1067.
Spurlock, M., & Con (Firm). (2004). Super Size Me. New York, N.Y: Hart Sharp Video. Strom, S. (2012). McDonald’s menu to post calorie data. The New York Times. Swartz, J., Braxton, D., & Viera, A. (2011). Calorie menu labeling on quick-service
restaurant menus: An updated systematic review of the literature. International Journal of
Behavioral Nutrition and Physical Activity, 8(1), 135.
Tam, J. (2004). Customer satisfaction, service quality and perceived value: An integrative
47
model. Journal of Marketing Management, 20(7-8), 897-917.
Todd, J., Mancino, L., & Lin, B-H. (2010). The Impact of Food Away From Home on Adult
Diet Quality, ERR-90, U.S. Department of Agriculture, Economic Research Service.
U.S. Department of Agriculture. (2014). American adults are choosing healthier foods,
consuming healthier diets. Washington, DC: USDA Office of Communications.
U.S. Food & Drug Administration. (2014). Food labeling: Nutrition labeling of standard menu
items in restaurants and similar retail food establishments. Washington, DC: Author.
Vermeer, W. M., Steenhuis, I. H., & Poelman, M. P. (2014). Small, medium, large or supersize?
The development and evaluation of interventions targeted at portion size. International
Journal of Obesity, 38(S1), S13.
Wei, W., & Miao, L. (2013). Effects of calorie information disclosure on consumers’ food
choices at restaurants. International Journal of Hospitality Management, 33, 106-117.
Williams, K. C., & Page, R. A. (2011). Marketing to the generations. Journal of Behavioral
Studies in Business, 3, 1.
Yohn, D. (2012). How to keep ‘em coming back. QSR Magazine. Retrieved from
https://www.qsrmagazine.com/denise-lee-yohn/how-keep-em-coming-back

48
APPENDIX

49
APPENDIX A: FACTORS AND MEASUREMENT ITEMS FOR MCDONALD’S USER
PERCEPTIONS

50
Factors Items Operationalization Health and Nutrition
The restaurant offers nutritious products1 Completely disagree (1)- completely agree (7) Completely disagree (1)- completely agree (7) Completely disagree (1)- completely agree (7)
The restaurant offers healthy products1 The restaurant offers fresh food4 The restaurant offers locally produced products1
There is an availability of organic food4 There is an availability of low-calorie meals4
Quality
The food offered is safe and sanitary1
The restaurant controls the quality of its products1
The food presentation is attractive1 The restaurant serves tasty food1 The restaurant’s menu offers a wide range of
choices1 The food presentation is appropriate1 The food is satiating (filling)3 The restaurant is convenient2 The helpings are adequate1 Value The price of food is a good value for my money1
The prices are very reasonable1
51
1References from Italy study:
De Nisco, A., & Warnaby, G. (2014). Urban design and tenant variety influences on consumers' emotions and approach behavior. Journal of Business Research, 67(2), 211-217.
Jang, S., Namkung, Y. (2009). Perceived quality, emotions, and behavioral intentions:
Application of an extended Mehrabian–Russell model to restaurants. Journal of Business Research, 62(4), 451-460.
Lee, M., & Ulgado, F. M. (1997). Consumer evaluations of fast-food services: a cross-
national comparison. Journal of Services Marketing, 11(1), 39-52. Namkung, Y., & Jang, S. (2008). Are highly satisfied restaurant customers really
different? A quality perception perspective. International Journal of Contemporary Hospitality Management, 20(2), 142-155.
Oliver, R. (1997). A Behavioral Perspective on the consumer new, yew. NY: Irwin-
McGraw—Hill. Tam, J. (2004). Customer satisfaction, service quality and perceived value: an integrative
model. Journal of marketing management, 20(7-8), 897-917. 2 Brindal, E., Wilson, C., Mohr, P., & Wittert, G. (2014). Nutritional consequences of a fast food
eating occasion are associated with choice of quick-service restaurant chain. Nutrition & Dietetics, 71(3), 184-192
3 Lassen, A. D., Lehmann, C., Andersen, E. W., Werther, M. N., Thorsen, A. V., Trolle, E., ... & Tetens, I. (2016). Gender differences in purchase intentions and reasons for meal selection among fast food customers–Opportunities for healthier and more sustainable fast food. Food Quality and Preference, 47, 123-129.
4 Lee, S., & McCleary, K. (2013). The relationship between perceived health, health attitude, and
healthy offerings for seniors at family restaurants. Cornell Hospitality Quarterly, 54(3), 262-273.
52
VITA
CLAIRE ADAMS
EDUCATION
B.S., Psychology, University of Arizona, August 2011
Minor: Spanish
Coordinated Program Intern, University of Mississippi, May 2017-2018
M.S., Nutrition and Hospitality Management, University of Mississippi, May 2018
GPA: 4.00
ACADEMIC EXPERIENCE
Graduate Assistant, 2016-2017
The Institute of Child Nutrition
Graduate Assistant, 2016
University of Mississippi Nutrition Department AWARDS
Mississippi Academy of Nutrition and Dietetics Outstanding Dietetics Student of the
Year in a Coordinated Program, 2018

53
Outstanding Abstract for presentation of thesis at the Food and Nutrition Conference and
Expo (FNCE) in Chicago, IL., 2017
RESEARCH and PRESENTATIONS
Standing presentation on current thesis at the 22nd Annual Graduate Conference in
Hospitality and Tourism in Houston, TX, 2017
McDonald’s Users Perceptions of Health and Nutrition, Quality, and Value
Claire Adams, MS Graduate Student, Mary Roseman, PhD, RD, LD, CHE, Eun
Kyong (Cindy) Choi, PhD, CHE
Presented Research at Food and Nutrition Conference and Expo (FNCE) in Chicago, IL.,
2017
The Impact of Customers’ Perception of Nutrition-Related Components on
McDonald’s Users’ Visit Frequency
M.G. Roseman, E.C. Choi, C. Adams
Standing presentation on current thesis at the 23rd Annual Graduate Conference in
Hospitality and Tourism in Dallas, TX, 2018
Relationship between McDonald’s Users Perceptions of Restaurant
Attributes and Usage Frequency
Claire Adams, MS Graduate Student, Ellen Mitchell, MS Graduate
Student, Mary Roseman, PhD, RD, LD, CHE, Eun Kyong (Cindy) Choi,
PhD, CHE