Embed Size (px)
Citation preview
McGraw-Hill/Irwin Copyright ©2008 The McGraw-Hill Companies, Inc. All rights reserved.
Fundamentals of Variance Analysis
Chapter 16
McGraw-Hill/Irwin Copyright ©2008 The McGraw-Hill Companies, Inc. All rights reserved.
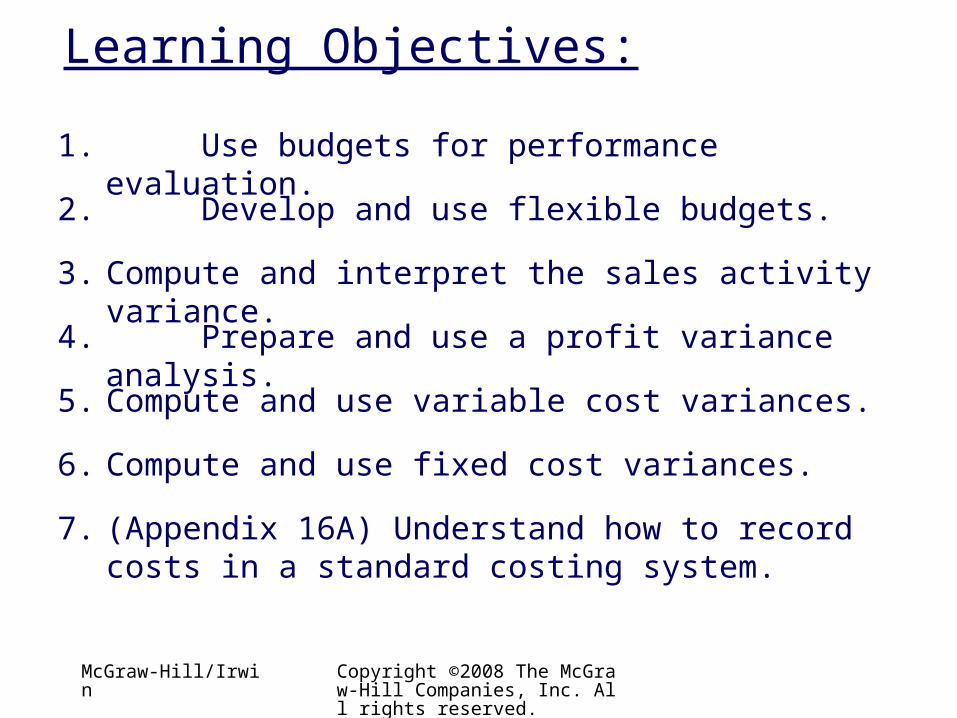
Learning Objectives:
1. Use budgets for performance evaluation.
2. Develop and use flexible budgets.
3. Compute and interpret the sales activity variance.
4. Prepare and use a profit variance analysis.
5. Compute and use variable cost variances.
6. Compute and use fixed cost variances.
7. (Appendix 16A) Understand how to record costs in a standard costing system.
McGraw-Hill/Irwin Copyright ©2008 The McGraw-Hill Companies, Inc. All rights reserved.
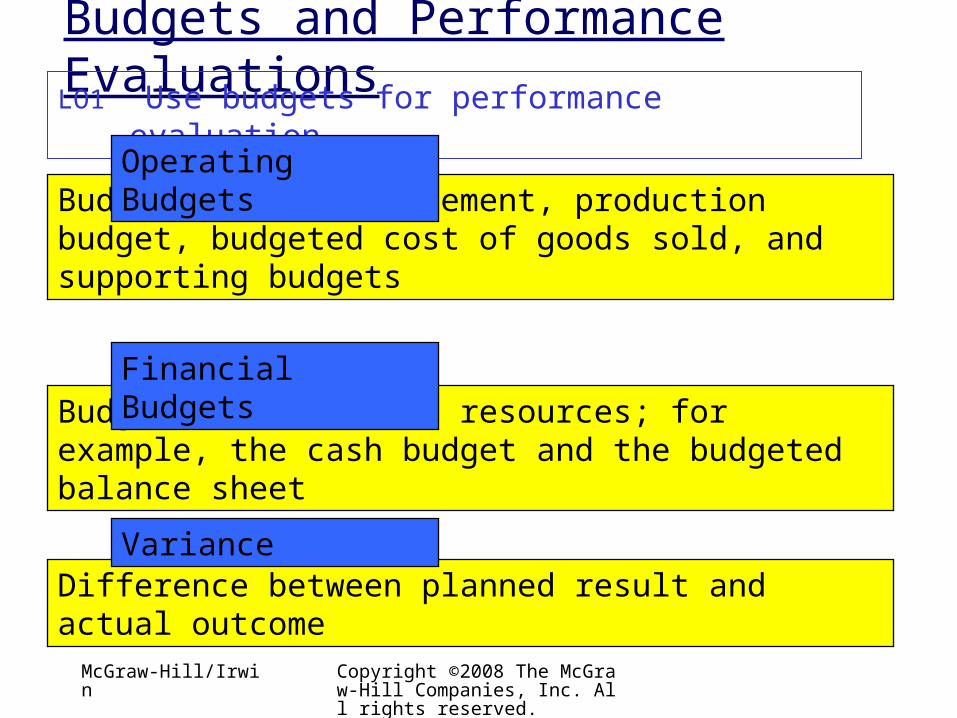
Budgets and Performance EvaluationsLO1 Use budgets for performance evaluation.
Budgeted income statement, production budget, budgeted cost of goods sold, and supporting budgets
Operating Budgets
Budgets of financial resources; for example, the cash budget and the budgeted balance sheet
Financial Budgets
Difference between planned result and actual outcome
Variance
McGraw-Hill/Irwin Copyright ©2008 The McGraw-Hill Companies, Inc. All rights reserved.
Profit Variances
Variance that, taken alone, increases operating profit
Favorable Variance
Variance that, taken alone, reduces operating profit
Unfavorable Variance
McGraw-Hill/Irwin Copyright ©2008 The McGraw-Hill Companies, Inc. All rights reserved.
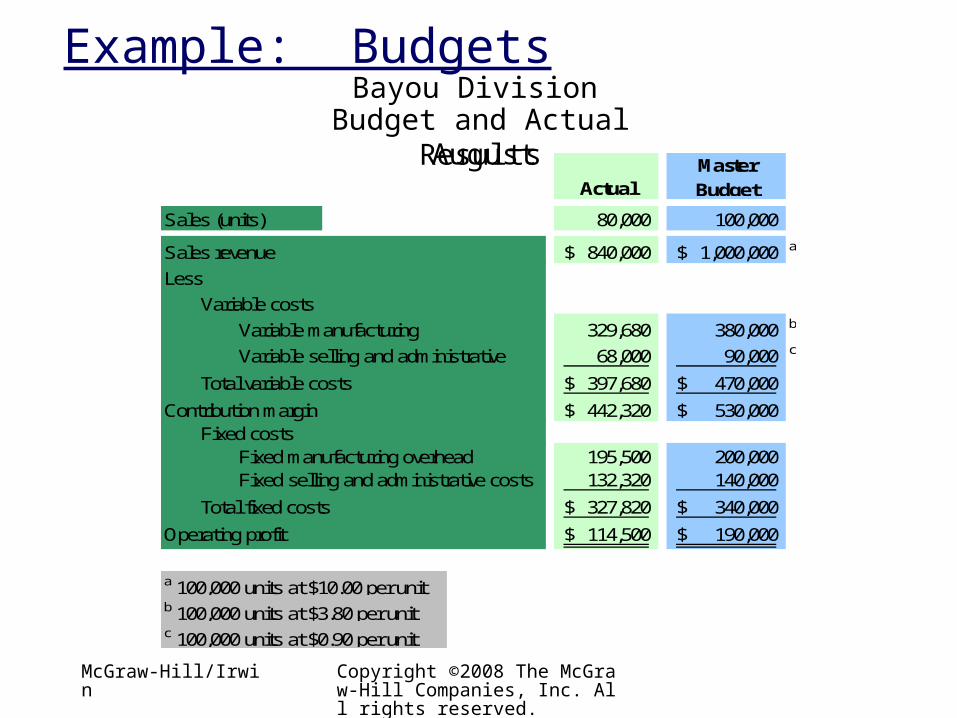
Example: Budgets
ActualMaster Budget
Sales (units) 80,000 100,000
Sales revenue 840,000$ 1,000,000$ a
Less
Variable costs
Variable manufacturing 329,680 380,000 b
Variable selling and administrative 68,000 90,000 c
Total variable costs 397,680$ 470,000$
Contribution margin 442,320$ 530,000$ Fixed costs
Fixed manufacturing overhead 195,500 200,000 Fixed selling and administrative costs 132,320 140,000
Total fixed costs 327,820$ 340,000$
Operating profit 114,500$ 190,000$
a 100,000 units at $10.00 per unitb 100,000 units at $3.80 per unitc 100,000 units at $0.90 per unit
Bayou DivisionBudget and Actual Results
August
McGraw-Hill/Irwin Copyright ©2008 The McGraw-Hill Companies, Inc. All rights reserved.
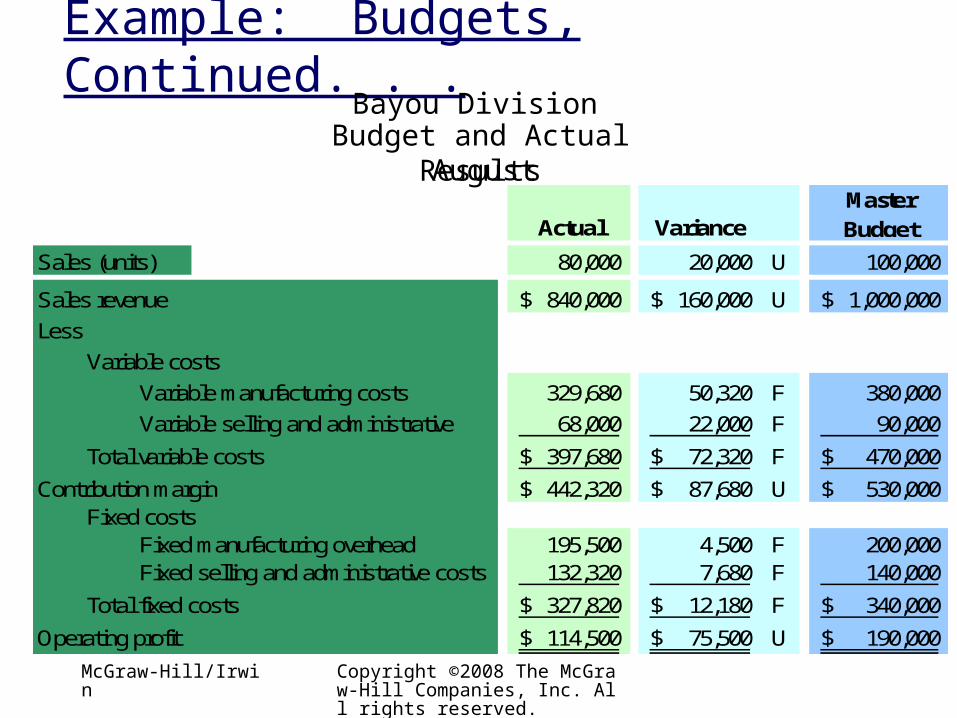
Example: Budgets, Continued. . .
Actual VarianceMaster Budget
Sales (units) 80,000 20,000 U 100,000
Sales revenue 840,000$ 160,000$ U 1,000,000$
Less
Variable costs
Variable manufacturing costs 329,680 50,320 F 380,000
Variable selling and administrative 68,000 22,000 F 90,000
Total variable costs 397,680$ 72,320$ F 470,000$
Contribution margin 442,320$ 87,680$ U 530,000$ Fixed costs
Fixed manufacturing overhead 195,500 4,500 F 200,000 Fixed selling and administrative costs 132,320 7,680 F 140,000
Total fixed costs 327,820$ 12,180$ F 340,000$
Operating profit 114,500$ 75,500$ U 190,000$
Bayou DivisionBudget and Actual Results
August
McGraw-Hill/Irwin Copyright ©2008 The McGraw-Hill Companies, Inc. All rights reserved.
Flexible BudgetingLO2 Develop and use flexible budgets.
Budget for a single activity level; usually the master budget
Static Budget
Budget that indicates revenues, costs, and profits for different levels of activity
Flexible Budget
McGraw-Hill/Irwin Copyright ©2008 The McGraw-Hill Companies, Inc. All rights reserved.
Sales Activity VarianceLO3 Compute and interpret the sales activity variance.
The difference between operating profit in the master budget and operating profit in the flexible budget that arises because the actual number of units sold is different from the budgeted number.
Sales volume variance:
McGraw-Hill/Irwin Copyright ©2008 The McGraw-Hill Companies, Inc. All rights reserved.
Profit VarianceLO4 Prepare and use a profit variance analysis.
Analysis of the causes of differences between budgeted profits and the actual profits earned.
Profit Variance Analysis
Sales price variance
Variable production cost variances
Marketing and administrative cost variances
Fixed production cost variances
McGraw-Hill/Irwin Copyright ©2008 The McGraw-Hill Companies, Inc. All rights reserved.
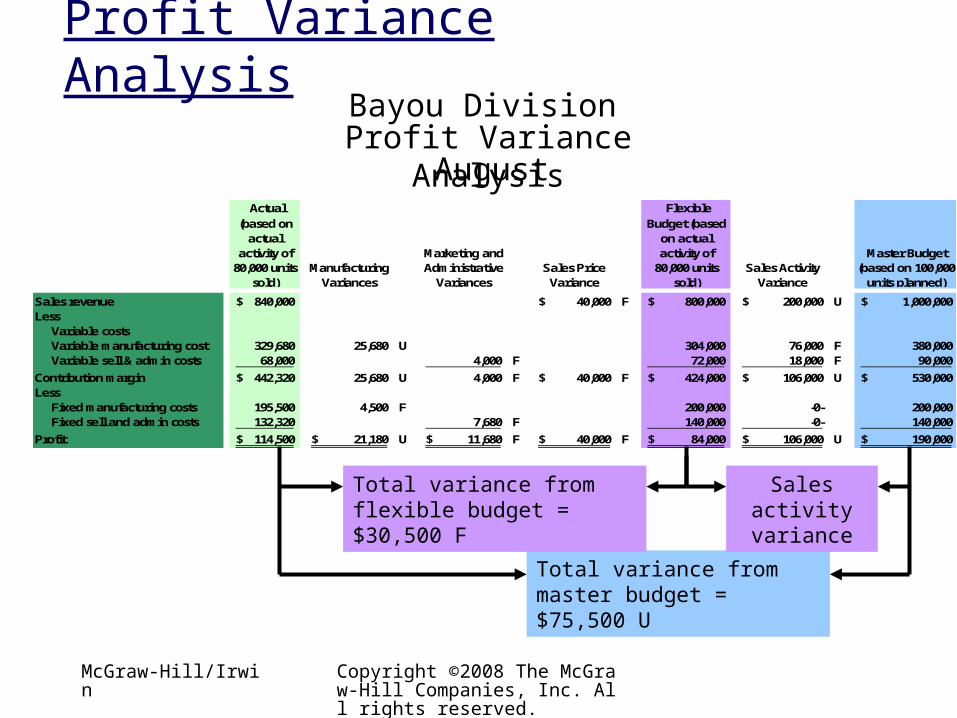
Profit Variance AnalysisBayou Division
Profit Variance AnalysisAugust
Actual (based on
actual activity of
80,000 units sold)
Manufacturing
Variances
Marketing and Administrative
Variances
Sales Price Variance
FlexibleBudget (based
on actual activity of
80,000 units sold)
Sales Activity
Variance
Master Budget
(based on 100,000 units planned)
Sales revenue 840,000$ 40,000$ F 800,000$ 200,000$ U 1,000,000$ Less
Variable costsVariable manufacturing cost 329,680 25,680 U 304,000 76,000 F 380,000 Variable sell & admin costs 68,000 4,000 F 72,000 18,000 F 90,000
Contribution margin 442,320$ 25,680 U 4,000 F 40,000$ F 424,000$ 106,000$ U 530,000$ Less
Fixed manufacturing costs 195,500 4,500 F 200,000 -0- 200,000 Fixed sell and admin costs 132,320 7,680 F 140,000 -0- 140,000
Profit 114,500$ 21,180$ U 11,680$ F 40,000$ F 84,000$ 106,000$ U 190,000$
Total variance from master budget = $75,500 U
Total variance from flexible budget = $30,500 F
Sales activity variance
McGraw-Hill/Irwin Copyright ©2008 The McGraw-Hill Companies, Inc. All rights reserved.
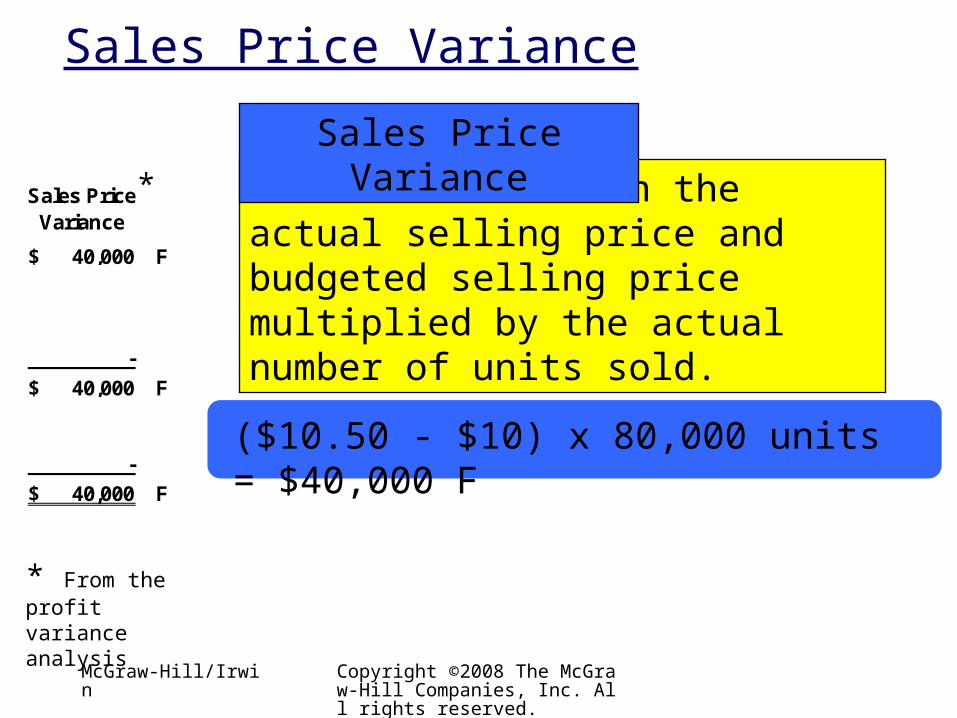
Sales Price Variance
Sales Price Variance
40,000$ F
-
40,000$ F
-
40,000$ F
($10.50 - $10) x 80,000 units = $40,000 F
*
* From the profit variance analysis
Difference between the actual selling price and budgeted selling price multiplied by the actual number of units sold.
Sales Price Variance
McGraw-Hill/Irwin Copyright ©2008 The McGraw-Hill Companies, Inc. All rights reserved.
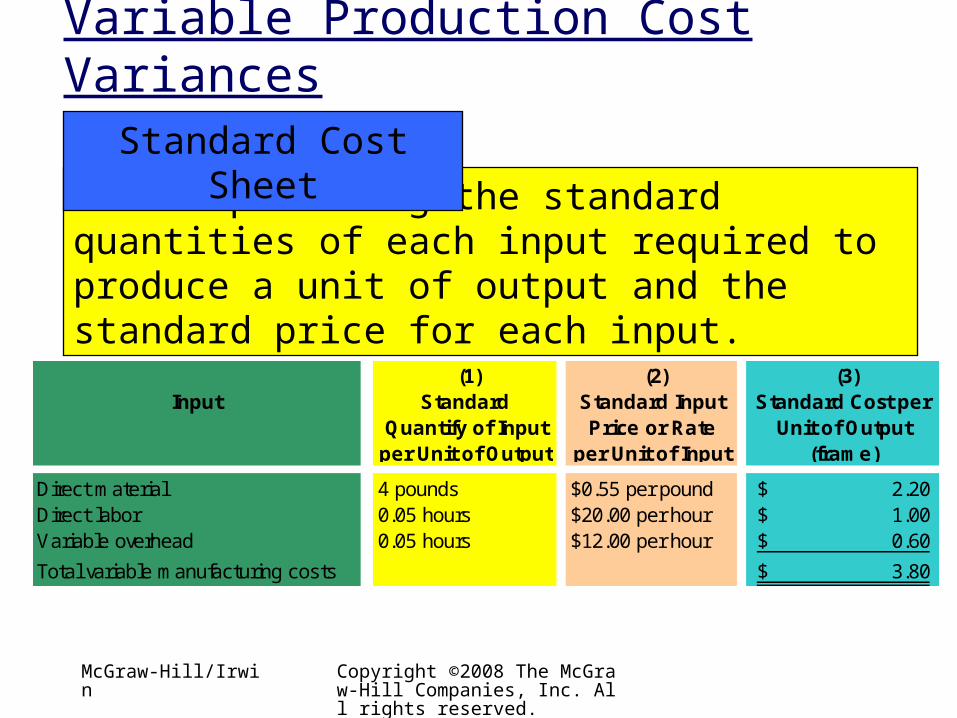
Variable Production Cost Variances
A form providing the standard quantities of each input required to produce a unit of output and the standard price for each input.
Standard Cost Sheet
(1)Standard
Quantify of Input per Unit of Output
(2)Standard Input Price or Rate
per Unit of Input
(3) Standard Cost per
Unit of Output (frame)
Direct material 4 pounds $0.55 per pound 2.20$ Direct labor 0.05 hours $20.00 per hour 1.00$ Variable overhead 0.05 hours $12.00 per hour 0.60$
Total variable manufacturing costs 3.80$
Input
McGraw-Hill/Irwin Copyright ©2008 The McGraw-Hill Companies, Inc. All rights reserved.
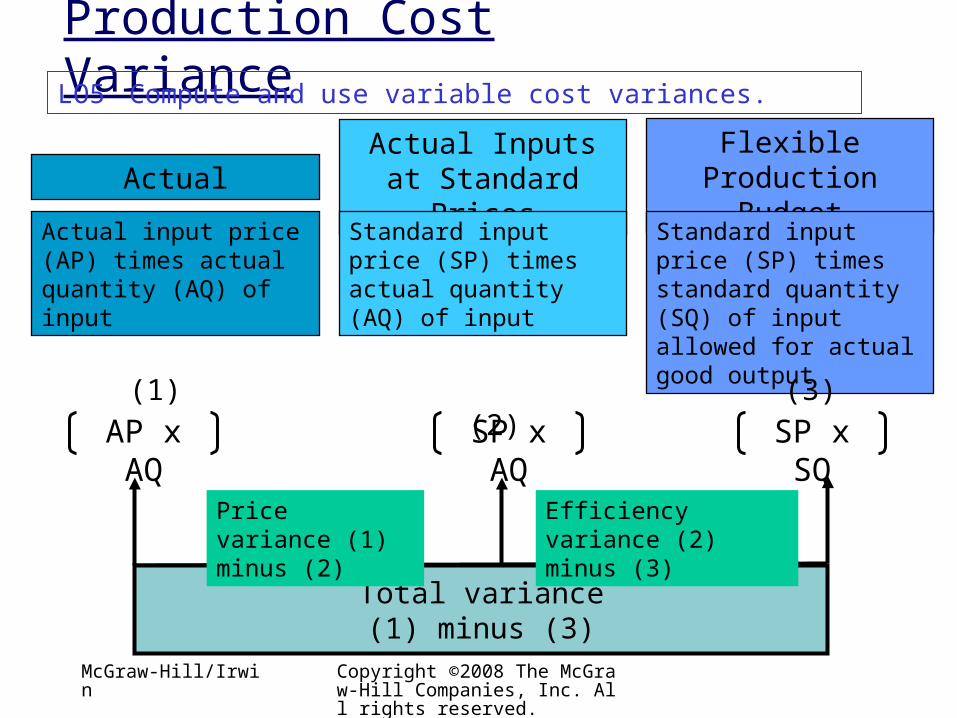
Production Cost VarianceLO5 Compute and use variable cost variances.
ActualActual Inputs at Standard Prices
Flexible Production
BudgetActual input price (AP) times actual quantity (AQ) of input
Standard input price (SP) times actual quantity (AQ) of input
Standard input price (SP) times standard quantity (SQ) of input allowed for actual good output
AP x AQ SP x AQ SP x SQ
Total variance(1) minus (3)
Price variance (1) minus (2)
Efficiency variance (2) minus (3)
(1) (2) (3)
McGraw-Hill/Irwin Copyright ©2008 The McGraw-Hill Companies, Inc. All rights reserved.
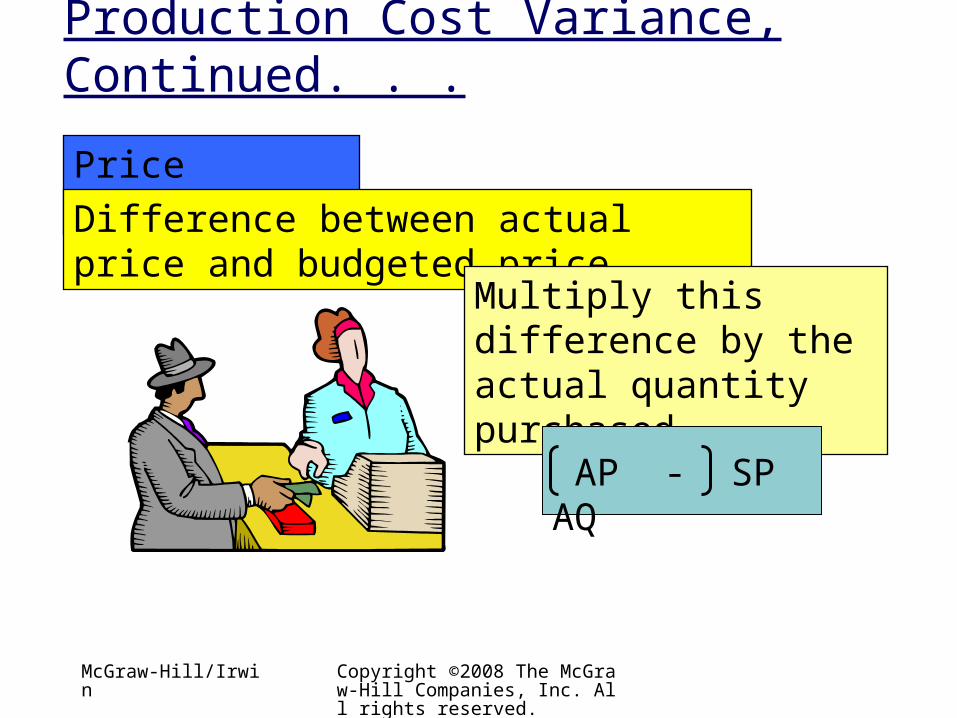
Production Cost Variance, Continued. . .
Price Variance
Difference between actual price and budgeted price
Multiply this difference by the actual quantity purchased
AP - SP AQ
McGraw-Hill/Irwin Copyright ©2008 The McGraw-Hill Companies, Inc. All rights reserved.
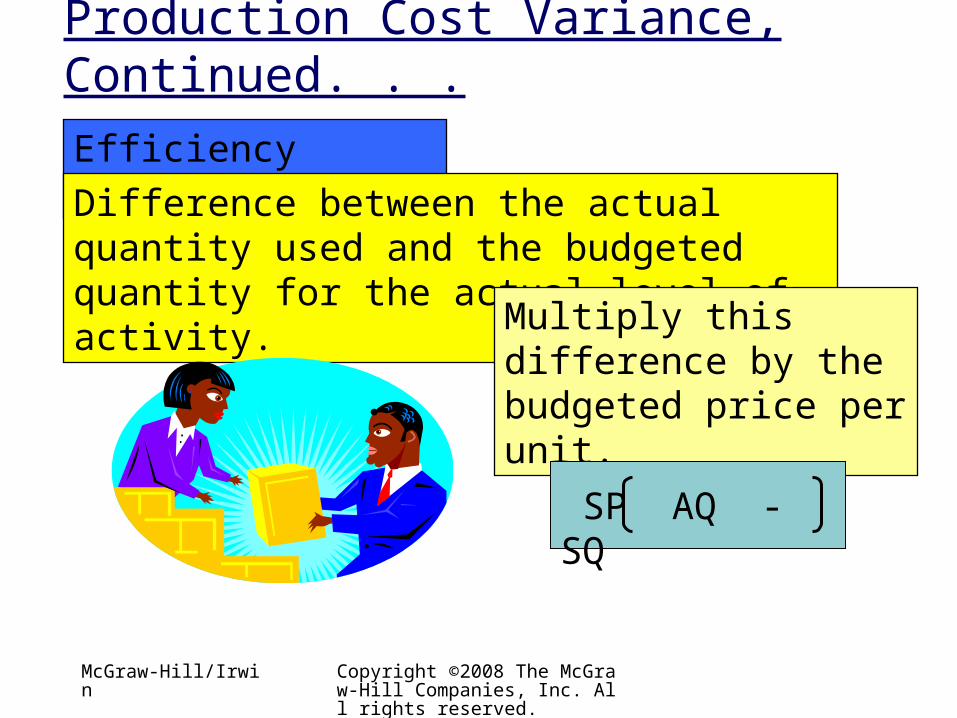
Production Cost Variance, Continued. . .
Efficiency Variance
Difference between the actual quantity used and the budgeted quantity for the actual level of activity.
Multiply this difference by the budgeted price per unit.
SP AQ - SQ
McGraw-Hill/Irwin Copyright ©2008 The McGraw-Hill Companies, Inc. All rights reserved.
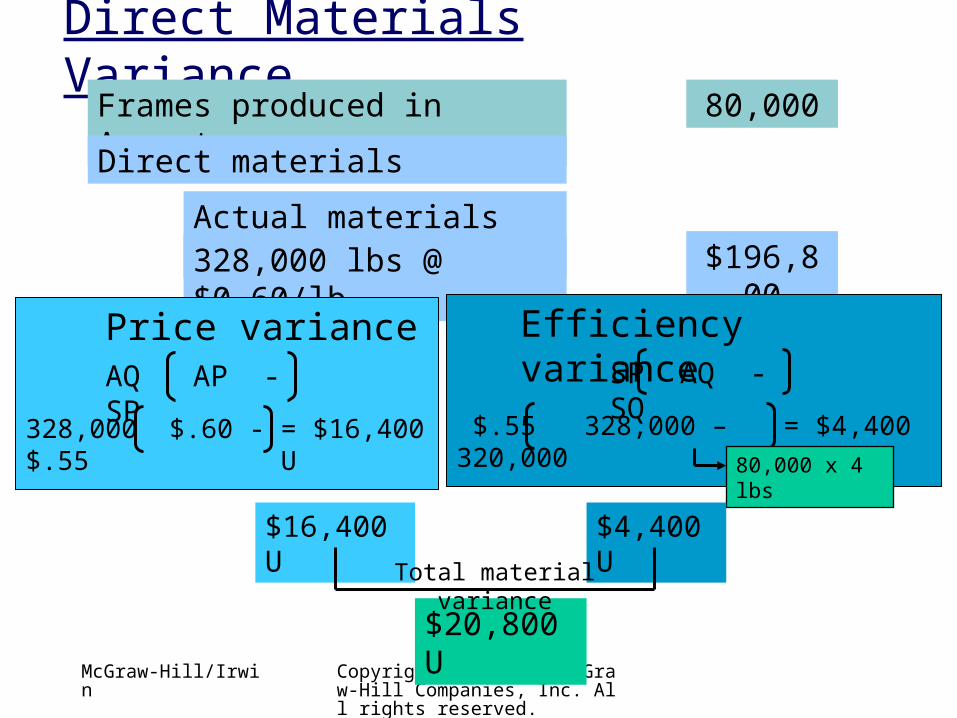
Direct Materials VarianceFrames produced in August 80,000
Direct materials
Actual materials cost328,000 lbs @ $0.60/lb
$196,800
Price varianceAQ AP - SP
328,000 $.60 - $.55
= $16,400 U
Efficiency variance SP AQ - SQ
$.55 328,000 – 320,000
= $4,400 U80,000 x 4
lbs
$16,400 U
$4,400 U
$20,800 U
Total material variance
McGraw-Hill/Irwin Copyright ©2008 The McGraw-Hill Companies, Inc. All rights reserved.
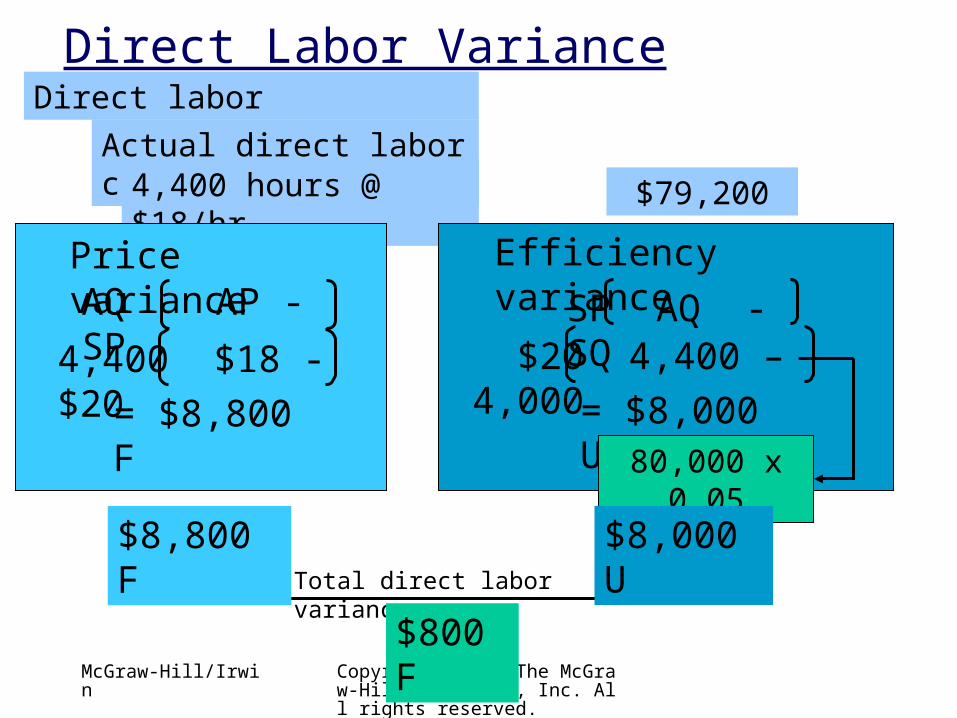
Direct Labor VarianceDirect labor
Actual direct labor cost4,400 hours @
$18/hr$79,200
Price variance
4,400 $18 - $20= $8,800 F
AQ AP - SPEfficiency variance
$20 4,400 – 4,000= $8,000 U
SP AQ - SQ
80,000 x 0.05
Total direct labor variance
$800 F
$8,800 F $8,000 U
McGraw-Hill/Irwin Copyright ©2008 The McGraw-Hill Companies, Inc. All rights reserved.
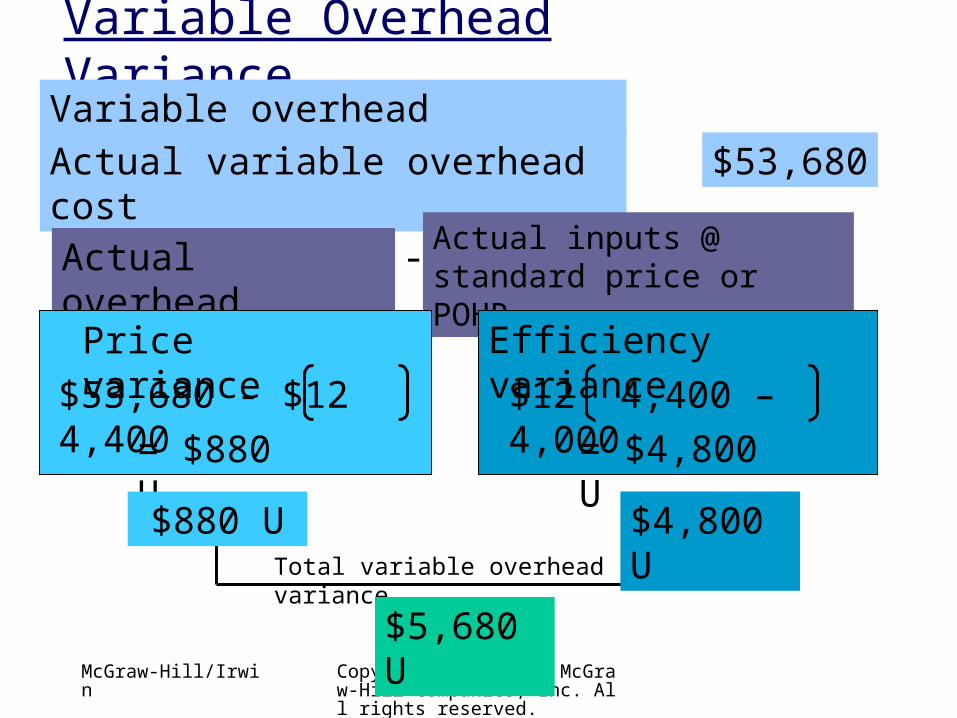
Variable Overhead VarianceVariable overheadActual variable overhead cost $53,680
Actual overhead - Actual inputs @ standard price or POHR
$53,680 - $12 4,400= $880 U
Price variance
= $4,800 U
Efficiency variance
$12 4,400 – 4,000
Total variable overhead variance
$5,680 U
$4,800 U
$880 U
McGraw-Hill/Irwin Copyright ©2008 The McGraw-Hill Companies, Inc. All rights reserved.
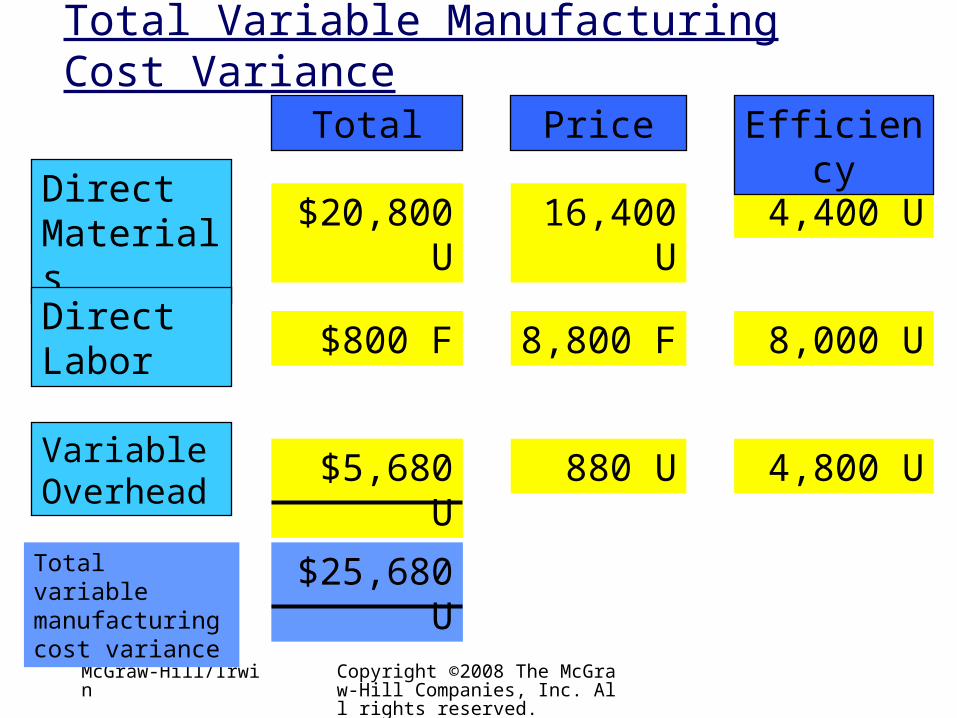
Total Variable Manufacturing Cost Variance
Direct Materials $20,800
U16,400
U4,400 U
$800 F 8,800 F 8,000 UDirect Labor
Variable Overhead
$5,680 U 880 U 4,800 U
Price EfficiencyTotal
$25,680 U
Total variable manufacturing cost variance
McGraw-Hill/Irwin Copyright ©2008 The McGraw-Hill Companies, Inc. All rights reserved.
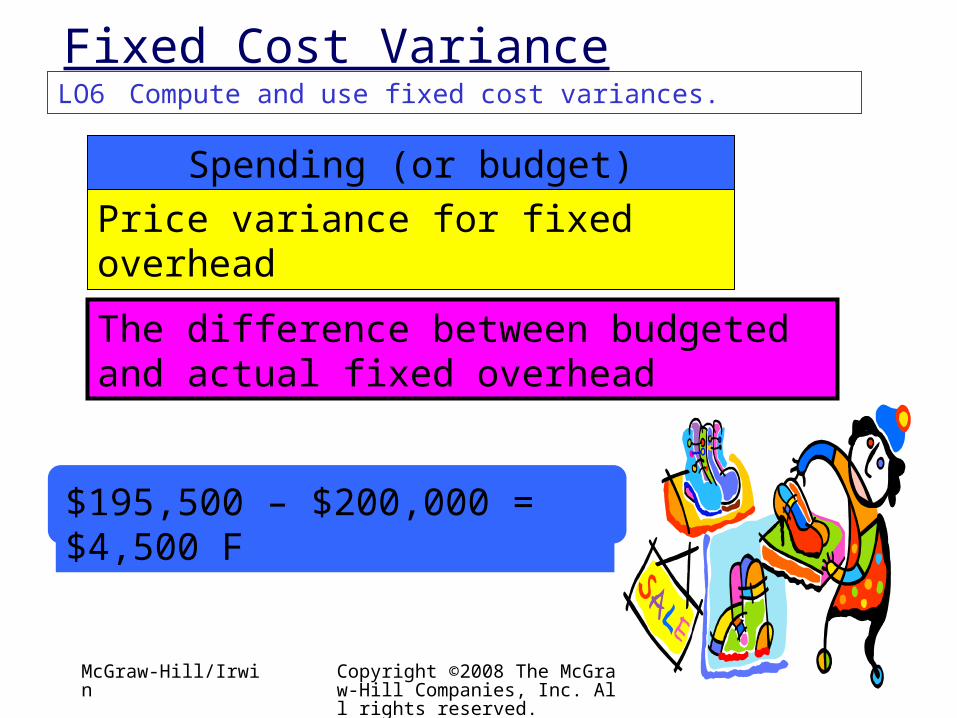
Fixed Cost VarianceLO6 Compute and use fixed cost variances.
Spending (or budget) Variance
Price variance for fixed overhead
The difference between budgeted and actual fixed overhead
$195,500 – $200,000 = $4,500 F
McGraw-Hill/Irwin Copyright ©2008 The McGraw-Hill Companies, Inc. All rights reserved.
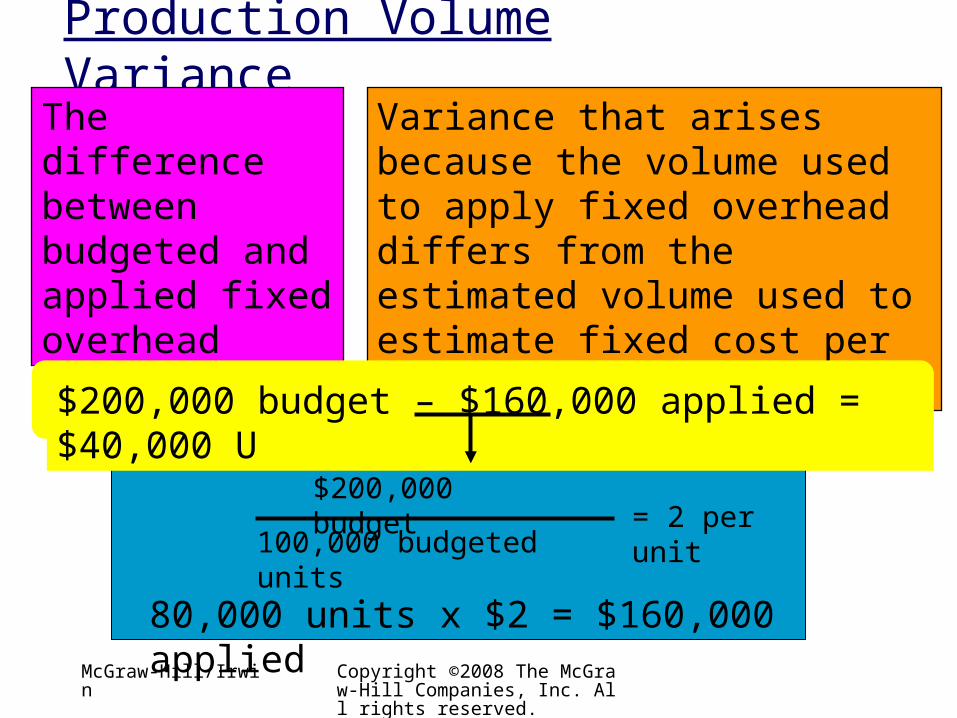
Production Volume Variance
Variance that arises because the volume used to apply fixed overhead differs from the estimated volume used to estimate fixed cost per unit.
The difference between budgeted and applied fixed overhead
$200,000 budget
100,000 budgeted units= 2 per unit
80,000 units x $2 = $160,000 applied
$200,000 budget – $160,000 applied = $40,000 U
McGraw-Hill/Irwin Copyright ©2008 The McGraw-Hill Companies, Inc. All rights reserved.
Chapter 16: END!