Embed Size (px)
Citation preview
1 23
Human EcologyAn Interdisciplinary Journal ISSN 0300-7839 Hum EcolDOI 10.1007/s10745-013-9573-0
Making Sense of Human Ecology Mapping:An Overview of Approaches to IntegratingSocio-Spatial Data into EnvironmentalPlanning
Rebecca McLain, Melissa Poe, KellyBiedenweg, Lee Cerveny, Diane Besser &Dale Blahna
1 23
Your article is protected by copyright and all
rights are held exclusively by Springer Science
+Business Media New York (outside the
USA). This e-offprint is for personal use only
and shall not be self-archived in electronic
repositories. If you wish to self-archive your
work, please use the accepted author’s
version for posting to your own website or
your institution’s repository. You may further
deposit the accepted author’s version on
a funder’s repository at a funder’s request,
provided it is not made publicly available until
12 months after publication.
Making Sense of Human Ecology Mapping: An Overviewof Approaches to Integrating Socio-Spatial Datainto Environmental Planning
Rebecca McLain & Melissa Poe & Kelly Biedenweg &
Lee Cerveny & Diane Besser & Dale Blahna
# Springer Science+Business Media New York (outside the USA) 2013
Abstract Ecosystem-based planning and management havestimulated the need to gather sociocultural values and hu-man uses of land in formats accessible to diverse plannersand researchers. Human Ecology Mapping (HEM)approaches offer promising spatial data gathering and ana-lytical tools, while also addressing important questionsabout human-landscape connections. This article reviewsand compares the characteristics of three HEM approachesthat are increasingly used in natural resource managementcontexts, each focused on a particular aspect of human-environmental interactions. These aspects include tenureand resource use (TRU), local ecological knowledge(LEK), and sense of place (SOP). We discuss their origins,provide examples of their use, and identify challenges totheir application. Our review serves as a guide for environ-mental managers, planners, and communities interested ingathering spatial data on aspects of human ecology impor-tant in ecosystem-based management and planning, and forscientists designing socioecological research.
Keywords Human ecology mapping . Ecosystem-basedplanning . Socioecological systems . Landscape valuesmapping
Introduction
Conservation scientists recognize the importance of integrat-ing sociocultural data into ecosystem-based planning andmanagement, as reflected in the use of terms such as socio-ecological systems (Alessa et al. 2008) and coupled human-natural systems (Liu et al. 2007). In practice, however, socialand cultural dimensions are still only weakly incorporated intoecosystem-based analyses (St Martin and Hall-Arber 2008).Factors contributing to the limited use of sociocultural datainclude mismatches in the geographic and temporal scales ofdata collection between sociocultural and biophysical data,lack of connection between people and the landscapes, incom-patible measurement systems, and lack of social science ex-pertise in environmental management agencies andorganizations (Endter-Wada et al. 1998; Endter-Wada andBlahna 2011). The growing reliance of land managers andenvironmental planners on geospatial techniques, includinggeographic information systems (GIS) and remote sensingtools, to study and manage ecosystems has created an addi-tional barrier to the integration of sociocultural values intoenvironmental planning. Numerous and detailed biophysicallayers for GIS-based mapping and analysis are readily avail-able, yet detailed socio-spatial layers data are limited.
Over the past two decades social scientists, community lead-ers, and indigenous groups have worked to address gaps inavailability of socio-spatial data relevant to ecosystem-basedplanning and management. Much of this work is informed bycitizens and stakeholder groups and falls within the fields ofpublic participation, GIS, and participatory GIS. Communityvalues mapping (Raymond et al. 2009), counter-mapping(Peluso 1995), cultural opportunities mapping (Tipa andNelson 2008), landscape values mapping (Zhu et al. 2010),mental mapping (McKenna et al. 2008), participatory mapping(Herlihy 2003), place-based planning (Farnum and Kruger
R. McLain (*) :D. BesserInstitute for Culture and Ecology, Portland, OR, USAe-mail: [email protected]
M. PoeNorthwest Sustainability Institute, Seattle, WA, USA
K. BiedenwegPuget Sound Institute, Tacoma, WA, USA
L. Cerveny :D. BlahnaUSDA-Forest Service, Pacific Northwest Research Station,Seattle, WA, USA
Hum EcolDOI 10.1007/s10745-013-9573-0
Author's personal copy
2008), public participation GIS (Brown and Reed 2009), andsocial values mapping (Sherrouse et al. 2011) are some of theterms used to describe these projects. All of these efforts seek tomap the diverse and complex connections between humans andlandscapes and thus fit under the broad umbrella of what werefer to as human ecology mapping (HEM).
Human ecology is a transdisciplinary science that focuses onunderstanding human-environmental interactions by “tracingchains of effects through ecosystems and human society”(Marten 2001: xv) with the goal of anticipating long-rangeenvironmental effects of human activities. It seeks to under-stand the world as a series of interrelated complex and dynamicsystems operating at multiple scales (Steiner 2002). Maps areuseful tools for identifying and visualizing human-environmental connections that have a spatial component andwhich are often difficult to discern using non-spatial analyticaltechniques. Recent technological advances in computerizedmapping and visualization tools, including GIS, interactiveweb technologies, GPS receivers, and smartphones, togetherwith the increasing availability of relatively low-cost remotesensing products, have created opportunities to visualize andexplore human-environment connections that were previouslyinvisible. Human ecology mapping uses these emerging tech-nologies, as well as older ones, to capture the complex anddynamic interactions that characterize socioecological systems.
Although maps are important means of communication, theyare never objective abstractions of reality (Soini 2001). What isincluded—or excluded—from a map, reflects and reinforces thevalues and beliefs of the society in which the mapmaker isembedded (Rundstrom 1990). Moreover, the inclusions andexclusions have the power to affect who controls the use ofspace (Harley 1988), who has access to environmental resources(Peluso 1995), whose ecological knowledge is considered legit-imate (Rundstrom 1990), and whose values and interests influ-ence natural resource decisions (Bethel et al. 2011).
More recently, geographers have begun to see maps asperformance, and imbued with power relations (Perkins2003). Understanding the performative qualities of mapsshifts attention from the maps and debates about what theyrepresent, to the process of map-making and explorations ofhow “a map becomes part of a story, to be created andenacted, rather than simply serving as a discourse for thepowerful” (Perkins 2003:345). The interpretive qualities ofmaps make human ecology mapping a particularly usefultool for understanding how individuals or groups view theworld and for comparing how landscape meanings of localpeople differ from landscape valuations by scientists (Soini2001). At the same time, the performance qualities of map-making make HEM approaches, with their emphasis onproviding venues where views about human-environmentalinteractions can be explored in contexts governed by princi-ples of openness and mutual respect, potential empowermenttools (Sletto 2009).
Choosing among human ecology mapping approaches is noeasy task. The scholarly literature on HEM is scattered acrossnumerous disciplines and sub-disciplines, including culturalecology, human ecology, political ecology, human geography,anthropology, environmental psychology, natural resource so-ciology, urban planning, and community development. Sortingthrough the strengths and limitations of different approaches toHEM is daunting when one considers the variety of methodsused to collect and represent sociocultural data spatially, as wellas the diversity of resource management themes explored andsociocultural variables measured.
This article is a guide for environmental managers, planners,researchers, and local communities interested in gathering spa-tial data on aspects of human ecology important in ecosystem-basedmanagement and planning.We examine three approachesto HEM: tenure and resource use (TRU); local ecologicalknowledge (LEK); and sense of place (SOP) mapping. Eachapproach addresses distinct questions about human-landscapeconnections that may arise in environmental planning. In realworld mapping contexts these themes often overlap and map-ping projects may address a combination of themes.
& Tenure and resource use mapping (TRU) delineates thespatial locations of land and resource tenure and land usesthat connect humans to a landscape or particular landscapefeatures.
Questions that TRUmapping typically addresses include:What ownership, use, and access rights to land and otherresources exist in the area beingmanaged?Who exerts thoseclaims and what activities are associated with them? Wheredo conflicts over ownership, use, and access rights exist?
& Local ecological knowledge mapping (LEK) aims tocapture local groups’ understandings of ecological process-es and relationships between humans and their environ-ment. Traditional ecological knowledge and indigenousecological knowledge mapping are variants of LEK map-ping. LEK mapping seeks to answer questions such as:How are human activities on the land or sea related to theecological conditions present in the management area?How and why does the spatial distribution of human activ-ities vary seasonally, annually, and over the long-term?
& Sense of place mapping (SOP) seeks to describe thevalues and/or meanings that people ascribe to landscapes,particular locations on landscapes, and activities associat-ed with those landscapes. Questions that drive SOP map-ping include: What values and meanings are associatedwith different areas of the landscape(s) being managed?How do these values and meanings differ across culturaland socio-demographic categories, such as ethnicity, race,age, gender, and class or among various cultural groups,tribes, user groups, landowners, or stakeholders? Wheredo landscape values andmeanings conflict with each otheror with proposed land management actions?
Hum Ecol
Author's personal copy
For each approach, we briefly describe its origins, data col-lection and analysis methods and processes, major applications,and associated challenges. We discuss key differences amongthe approaches and conclude by summarizing cross-cuttingchallenges, such as the limitations of GIS as a tool for HEM,power dynamics, and manager resistance to the use of HEMdata. Citations are provided for readers interested in delvingmore deeply into theoretical underpinnings and applications.
Tenure and Resource Use Mapping
The basic premise of tenure and resource use (TRU) map-ping is that politically and economically marginalizedgroups can assert or strengthen existing claims over landsand resources through the production of maps that representtheir conceptions of their territories rather than the bound-aries that have been imposed on them by nation-states orother outside entities (Fox 2002; Peluso 1995; Tobias 2000).We consider a variety of mapping approaches under therubric of TRU mapping, including land use and land occu-pancy, counter-mapping, indigenous mapping, andcommunity-based natural resource management mapping.We also include participatory GIS (PGIS) efforts that focuson the mapping of resource tenure claims and use patterns.
Tenure and resource use (TRU) mapping is strongly rootedin the cultural ecology, political ecology, and international de-velopment subfields of cultural anthropology and human geog-raphy. It is also heavily informed by participatory action andresearch theory and methods (Herlihy 2003). The theory under-lying TRU mapping posits that local populations have detailedknowledge of their surrounding lands and resources, knowledgethat is often embedded in place names, stories, songs, andartwork. Mapping is viewed as a social and political practice,not just a technical one (Fox 2002; Peluso 1995). Consequently,mapping processes that are collaborative, attend to internal andexternal power dynamics, and minimize opportunities for pow-erful individuals, groups, or communities to dominate mappingare heavily emphasized (Herlihy 2003).
TRU mapping has two identifiable origins (Chapin et al.2005)—use and occupancy mapping projects in Canada andAlaska during the 1960s and 1970s and Participatory RuralAppraisal (PRA)/Participatory Action Research (PAR) proj-ects in Latin America, Asia and Africa during the 1980s andearly 1990s. Hugh Brody’s Maps and Dreams (1982) is aseminal work in the field of TRU mapping, describing aneffort in which indigenous groups, government bureaucratsand representatives of energy companies in northern BritishColumbia developed plans for energy development thatwould protect local settlements and their access to subsis-tence resources. Maps of the spaces and places of land useand occupancy for the Beaver People provided critical datafor these plans, including spatial references to the Beaver
People’s histories of belonging, community formation, andgathering, hunting and fishing practices.
Regardless of origins, a fundamental characteristic ofTRU mapping projects is direct participation in the mappingprocess of individuals embedded in the landscapes beingmapped (Chapin et al. 2005). Maps produced through thisprocess have the potential to fundamentally alter powerdynamics between government agencies and society(Chapin et al. 2005; Peluso 1995). They can also alterdynamics within communities. In the Bolivian Amazon,for example, mapping was employed to clarify locally-defined tenure boundaries and internal access rights to indi-vidual Brazil nut trees (Cronkleton et al. 2010). Members ofthe forest community formed census brigades to map eachBrazil nut tree within the community’s boundaries. When aconflict over access rights arose, the conflict was mediatedby others in the brigade and mapping continued until mosttrees had been identified and allocated to individual familiesfor harvesting rights. As a result of this process, the com-munity was able to negotiate land boundaries with the landgranting agency that had excluded a portion of their tradi-tional area in newly created property maps.
TRU Mapping Methods and Processes
In a guide created for Canadian indigenous communities,Terry Tobias (2000) lays out the essentials of TRU mappingwith local people. While methods vary among communities,the ideal method includes generating community consensusabout the project, collaboratively developing a researchdesign with a trained professional and the local community,gathering and analyzing data, validating maps with thecommunity, and writing a report. The first step, obtainingcommunity support, is probably the most often overlooked,yet it is crucial to project success. Data collection methodsusually include key informant or focus group interviews;participants marking locations on paper maps, aerial photos,or satellite images; and gathering or verifying points andboundaries in the field with GPS technology (see, e.g.,Bauer 2009; Sletto 2009; Smith et al. 2012). Individualmaps are combined to produce community maps, whichare then validated through workshops or focus groups. Thestories that go with the maps are considered as important asspatial locations, as they reveal the social relationships thatunderlie particular socioecological systems (Sletto 2009;Vermeylen and Davies 2012).
TRU mapping protocols are often developed collabora-tively and many projects are structured to build long-termlocal mapping capacity through the training of communitymembers as ethnocartographers (Herlihy 2003). New tech-nologies, such as CyberTracker, a customized GPS andsoftware unit that can be programmed with icons and othervisual prompts, have expanded local capacity to collect
Hum Ecol
Author's personal copy
tenure and resource use data in Mexico (Smith et al. 2012),South Africa (Barodien and Barry 2004) and the Congorainforest (Lewis 2012). As they become more widely used,smartphones and tablet computers hold promise as easy-to-use tools for on-the-spot collecting, recording, and mappingof geospatial TRU data (McCall and Dunn 2012). An addi-tional step in tenure mapping is the presentation of results toexternal parties, such as governments or non-local land-owners, for formalizing claims or mediating conflict aboutland boundaries (Mather 2000; McCall and Minang 2005).
The spatial analysis and representation of TRU mappingis often quite simple. It requires delineating points and linesthat were recorded in the field. Attributes such as colors orsymbols can be applied to differentiate data specific to atype of resource or ownership group (e.g.,family). In theBolivian example above, access trails were drawn as linesand individual trees were marked as points (Cronkleton etal. 2010). Each point was assigned a color corresponding tothe family that had access to its nuts, producing a multi-colored map representing regions of use rights.
Applications of TRU Mapping
TRU mapping has been used for many purposes includingresolving internal community conflicts over resources(Kyem 2004), formalizing traditionally recognized landboundaries (Hodgson and Schroeder 2002), empoweringcommunities to assert and defend land or resource rights(Herlihy 2003; Peluso 1995), and assessing the impacts ofpolicy reforms on tenure systems (Smith et al. 2012). TRUmapping has also proved useful for establishing co-management agreements (McCall and Minang 2005) andland use plans (McCarthy et al. 2012). Enhancing intergen-erational knowledge exchange is an important goal of someprojects (Lewis 2012; Sletto 2009). Other applications in-clude establishing relationships of trust within or betweencommunities (Kyem 2004), improving relationships be-tween communities and external agencies (Mather 2000),and enhancing livelihood opportunities for rural communitymembers (Chapin et al. 2005).
Challenges Associated with TRU Mapping
Chapin et al. (2005) observe that outside “technical experts”typically take on central roles in most TRU mapping initia-tives due to a variety of factors, including lack of technicalcapacity within local communities and the different time-lines of technical experts versus community members.While outside assistance can be advantageous—and in somecases necessary—it carries with it the risk that outsiders willcontrol what data is collected and how it is used (Fox 2002).
TRU mapping processes favor those who show up tomap; educational, social status, and wealth differentials
may inhibit participation by particular sub-groups, agecohorts, and oftentimes women (McCall and Minang2005). The absence of key groups can result in data onresource conditions remaining unrecorded (Mather 2000)or in absent groups losing access to resources that arecritical for their livelihoods (Lewis 2012). A related issueis that more highly educated or more powerful factions mayseek to dominate the mapping process as a means for ac-quiring control over land or resources. Barnaud et al. (2010)found that in Thailand’s highlands, scenario modeling work-shops with careful selection of participants was an effectiveapproach to creating opportunities for less powerful com-munity members to have a voice in resource managementdiscussions.
Finally, it is important to consider the possible conse-quences of developing tenure and resource use maps. Theuse of western cartographic conventions risks establishingfixed boundaries in areas where boundaries have tradition-ally been porous and communities interdependent, provok-ing conflicts as some claims are extinguished in favor ofothers (Bryan 2011) and reducing the ability of communitiesto adapt to shifting ecological conditions (Hodgson andSchroeder 2002; Vermeylen and Davies 2012). The processof defining boundaries and formalizing land claims alsomay prompt village leaders to sell titled communal landwhich would have been difficult to sell when the land washeld under informal tenure arrangements (Hodgson andSchroeder 2002). Structuring TRU mapping projects so thatsecondary and overlapping rights are identified and recog-nized is one means by which the risks associated withmapping can be reduced (Bryan 2011). Building in precau-tions against corrupt village leaders requires acknowledgingthat corruption may exist and integrating legal and politicalstrategies, such as legal education and linking communitymembers to external organizations actively promoting trans-parency in resource governance (Hodgson and Schroeder2002).
Local Ecological Knowledge Mapping
The movement to assert territorial claims through TRUmapping has been accompanied by parallel, and oftenlinked, efforts to map local ecological knowledge (LEK) informats compatible with Cartesian cartography, a processwe refer to here as LEK mapping. Charnley et al. (2008:2)define LEK as “knowledge, practices, and beliefs regardingecological relationships that are gained through extensivepersonal observation of and interaction with local ecosys-tems, and shared among local resource users.” Terms relatedto LEK include traditional ecological knowledge (TEK),which is generally considered to have developed over amuch longer time than local ecological knowledge (Berkes
Hum Ecol
Author's personal copy
et al. 2000), and indigenous ecological knowledge (IEK),TEK that is specific to indigenous peoples (Aswani andLauer 2006). Theory and empirical research on LEK drawheavily from the disciplines of cultural anthropology andhuman geography, particularly the subfields of cultural ecol-ogy, ethnobotany, ethnobiology, and cognitive anthropology.
Spatialized knowledge consists of several elements:memorizing places in relation to an event (landmark knowl-edge), developing a sense of the sequence in which placesoccur (path or route knowledge), and understanding howmultiple places relate to each other in ways that permitcreative navigation (survey knowledge) (Ishikawa andMontello 2006). Resource users develop spatialized LEKprimarily by direct environmental interactions, often in anapprenticeship-type relationship with more experiencedpeople, but also through listening to stories (or more recent-ly through reading or watching movies, television, or vid-eos) shared by other individuals or groups (Aswani andLauer 2006; Feinberg et al. 2003). Through environmentaland cultural interactions, resource users develop cognitivemaps—internal representations of the world and its spatialproperties—that allow them to know what features exist inthe world, what the attributes of those features are, wherethey are located, and how to get to them. Over time, re-source users can develop a collective body of knowledgeabout the environment that extends back through time andacross relatively large spaces (McKenna et al. 2008; Hall etal. 2009a). The main purpose of LEK historically was toenable resource users to survive (Berkes et al. 2000).
Like all knowledge, LEK is embedded in the practices,management institutions, and world view of its knowledgecommunity participants (Berkes et al. 2000). Consequently,integrating LEK with scientific knowledge requires lookingbeyond the collection of factual LEK and identifying waysin which the world views and management institutions ofLEK holders can be incorporated into environmental plan-ning (Houde 2007). Rather than viewing LEK and scientificknowledge as in opposition, many scholars argue that it ismore productive to view them as knowledge-belief-valuesystems that, while providing different facts and based ondifferent world views, are potentially complementary(Agrawal 1995; Houde 2007). Hybrid knowledge systemsin which LEK incorporates scientific facts and data collec-tion technologies (Kendrick and Manseau 2008; Murray etal. 2008), and ecological research incorporates LEK, arebecoming increasingly common (Bethel et al. 2011;Gilchrist et al. 2005; Hall et al. 2009a).
LEK Mapping Methods and Processes
LEK mapping uses a mix of qualitative and quantitativemethods (Table 1). Key informant or focus group interviewsare typically used to collect data about place names, cultural
meanings, uses, and changing conditions of important loca-tions. Interviewees identify the locations of key places usingsketch maps, aerial photos, or satellite images. Most LEKmapping projects incorporate field visits to collect GPSpoints and other data about mapped locations. Once the datahave been compiled into map form, the maps are validatedin workshops or focus groups. GPS technology is some-times customized so that resource users can record datawhen scientists are not present. For example, Canadianuniversity students worked with Inuit hunters in the Arcticto co-design Igliniit, a GPS unit and software interface thathunters use to mark waypoints as they travel, and logobservations of animals, ice features, hazardous areas, andother data as part of their everyday activities (Gearheard etal. 2011). In areas where internet access is relatively com-mon, such as the North American Arctic, researchers areexperimenting with creating interactive multi-media web-based atlases and databases where local ecological knowl-edge can be shared and updated (Eisner et al. 2012; Pulsiferet al. 2011). Contextual data such as videos, photos, narra-tives by LEK holders, and copies of historic documents areincreasingly being included in LEK geodatabases (Aporta2011; Hall et al. 2009a).
The final step of LEK mapping is to combine or compareLEK data with scientific data for use in environmentalplanning or management. For example, in the SolomonIslands, Aswani and Lauer (2006) combined 7 years offishermen’s data with data collected by natural and physicalscientists. From 300 interviews with local inhabitants, theycreated a substantial LEK database about the spatial andtemporal characteristics of fishing grounds and benthic hab-itats. Once processed and overlaid with biophysical data,these records provided important information for predictingfishing behavior and determining the boundaries of marineprotected areas. Roth (2004) argues that successful integra-tion of LEK and scientific knowledge requires more thanagreement on facts; it also requires that local and scientificecological knowledge communities reach agreement on howresources should be managed.
Applications of Local Ecological Knowledge Mapping
Efforts to map LEK for natural resource management beganon a large-scale in the 1970s and 1980s among indigenouspeoples in Alaska and Canada. LEK mapping was seen as atool to challenge scientific data used to justify wildlifeharvest restrictions, data which indigenous peoples’ experi-ences suggested rested on inaccurate assumptions aboutwildlife migration patterns and therefore greatly underesti-mated extant populations of economically important species(Freeman 1992). Building on this foundation, many LEKmapping projects explicitly seek to empower resource usersor local communities by providing an avenue for their
Hum Ecol
Author's personal copy
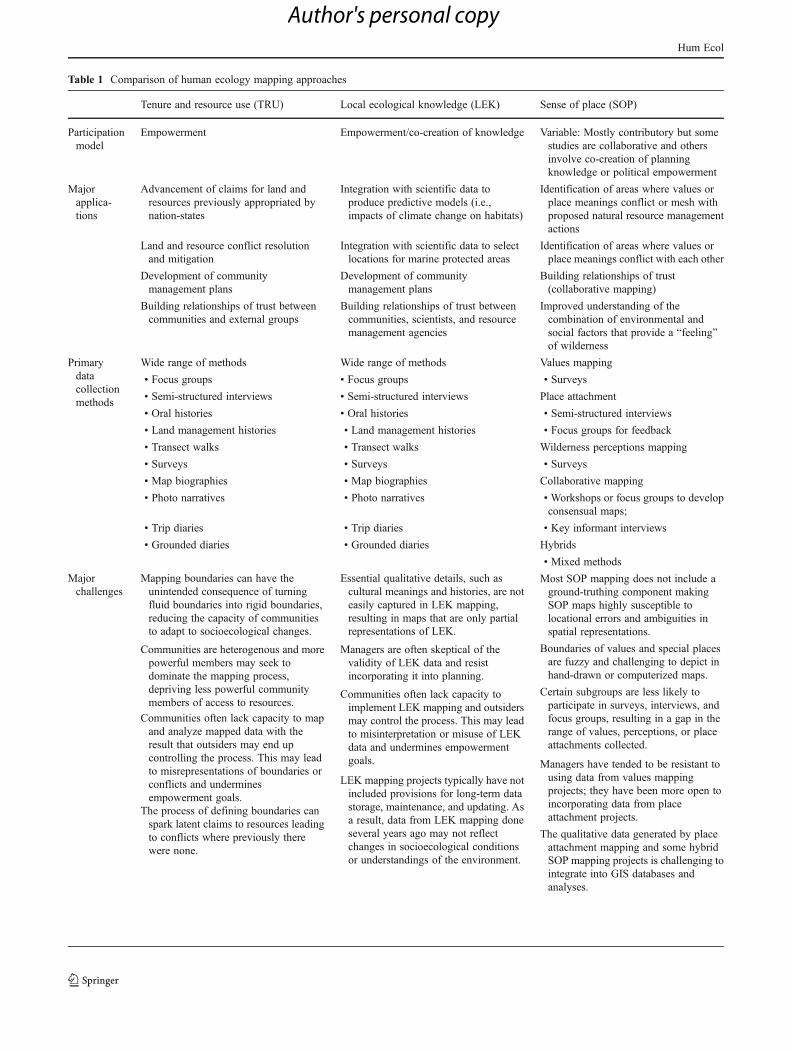
Table 1 Comparison of human ecology mapping approaches
Tenure and resource use (TRU) Local ecological knowledge (LEK) Sense of place (SOP)
Participationmodel
Empowerment Empowerment/co-creation of knowledge Variable: Mostly contributory but somestudies are collaborative and othersinvolve co-creation of planningknowledge or political empowerment
Majorapplica-tions
Advancement of claims for land andresources previously appropriated bynation-states
Integration with scientific data toproduce predictive models (i.e.,impacts of climate change on habitats)
Identification of areas where values orplace meanings conflict or mesh withproposed natural resource managementactions
Land and resource conflict resolutionand mitigation
Integration with scientific data to selectlocations for marine protected areas
Identification of areas where values orplace meanings conflict with each other
Development of communitymanagement plans
Development of communitymanagement plans
Building relationships of trust(collaborative mapping)
Building relationships of trust betweencommunities and external groups
Building relationships of trust betweencommunities, scientists, and resourcemanagement agencies
Improved understanding of thecombination of environmental andsocial factors that provide a “feeling”of wilderness
Primarydatacollectionmethods
Wide range of methods Wide range of methods Values mapping
• Focus groups • Focus groups • Surveys
• Semi-structured interviews • Semi-structured interviews Place attachment
• Oral histories • Oral histories • Semi-structured interviews
• Land management histories • Land management histories • Focus groups for feedback
• Transect walks • Transect walks Wilderness perceptions mapping
• Surveys • Surveys • Surveys
• Map biographies • Map biographies Collaborative mapping
• Photo narratives • Photo narratives • Workshops or focus groups to developconsensual maps;
• Trip diaries • Trip diaries • Key informant interviews
• Grounded diaries • Grounded diaries Hybrids
• Mixed methods
Most SOP mapping does not include aground-truthing component makingSOP maps highly susceptible tolocational errors and ambiguities inspatial representations.
Majorchallenges
Mapping boundaries can have theunintended consequence of turningfluid boundaries into rigid boundaries,reducing the capacity of communitiesto adapt to socioecological changes.
Essential qualitative details, such ascultural meanings and histories, are noteasily captured in LEK mapping,resulting in maps that are only partialrepresentations of LEK.
Boundaries of values and special placesare fuzzy and challenging to depict inhand-drawn or computerized maps.
Communities are heterogenous and morepowerful members may seek todominate the mapping process,depriving less powerful communitymembers of access to resources.
Managers are often skeptical of thevalidity of LEK data and resistincorporating it into planning.
Certain subgroups are less likely toparticipate in surveys, interviews, andfocus groups, resulting in a gap in therange of values, perceptions, or placeattachments collected.
Communities often lack capacity to mapand analyze mapped data with theresult that outsiders may end upcontrolling the process. This may leadto misrepresentations of boundaries orconflicts and underminesempowerment goals.
Communities often lack capacity toimplement LEK mapping and outsidersmay control the process. This may leadto misinterpretation or misuse of LEKdata and undermines empowermentgoals.
The process of defining boundaries canspark latent claims to resources leadingto conflicts where previously therewere none.
LEK mapping projects typically have notincluded provisions for long-term datastorage, maintenance, and updating. Asa result, data from LEK mapping doneseveral years ago may not reflectchanges in socioecological conditionsor understandings of the environment.
Managers have tended to be resistant tousing data from values mappingprojects; they have been more open toincorporating data from placeattachment projects.
The qualitative data generated by placeattachment mapping and some hybridSOP mapping projects is challenging tointegrate into GIS databases andanalyses.
Hum Ecol
Author's personal copy
knowledge and perspectives to enter externally-driven envi-ronmental planning and management processes (Bethel etal. 2011; Murray et al. 2008). LEK mapping is an importanttool for gathering data that are difficult to collect usingscientific procedures, but for which detailed LEK is alreadyavailable. For example, Inuit hunters participating in theIgliniit project described earlier are able to record data onenvironmental conditions for a much larger area and morecontinuously than is feasible with standard meteorologicaland biological monitoring approaches (Gearheard et al.2011). Historical management data from LEK can be usedto formulate and test hypotheses about how people will reactto ecological variability and future resource managementdecisions (Aswani and Lauer 2006; St. Martin and Hall-Arber 2008). LEK mapping can also highlight high useareas and provide a venue for identifying and mitigatingconflict in those areas (de Freitas and Tagliani 2009).
LEK mapping has been applied to marine spatial plan-ning in New England (St. Martin and Hall-Arber 2008),Canada (Murray et al. 2008), Brazil (de Freitas andTagliani 2009), New Zealand (Hall et al. 2009a), and theSolomon Islands (Aswani and Lauer 2006), among othercountries. It is used in Canada for understanding topics asdiverse as changes in polar sea ice conditions (Aporta 2011),caribou migration patterns (Kendrick and Manseau 2008),and migratory bird population dynamics (Gilchrist et al.2005). LEK also has been combined with scientific data todevelop better understandings of the drivers of land coverchange on South Africa’s Wild Coast (Chalmers andFabricus 2007) and of livelihood vulnerability and marshhabitat sustainability assessments for coastal communities inLouisiana (Bethel et al. 2011).
Challenges Associated with Local Ecological KnowledgeMapping
A major challenge associated with mapping LEK for envi-ronmental planning is that essential qualitative details, suchas cultural meanings, resource health, and changes in spe-cies distribution over time, may get lost in the process oftranslating LEK into western cartographic maps (Kendrickand Manseau 2008). While advances have been made inlinking qualitative LEK data into geodatabases, researchersare still struggling to develop effective ways of integrating itinto GIS-based maps for resource management (de Freitasand Tagliani 2009).
Another barrier to the widespread use of LEK in envi-ronmental planning and management is resource managers’skepticism about the validity of LEK (Hall et al. 2009a, b;Roth 2004). Systematic research that helps resource manag-ers better understand the strengths and limitations of bothLEK and scientific knowledge may be one avenue by whichresistance to LEK can be overcome (Chalmers and Fabricius
2007; Hall et al. 2009a, b). Working toward resource man-agement systems that rely on the co-production of knowl-edge and that engage LEK holders early on in planningprocesses has also been suggested as a means to alleviatemanager concerns about the validity of LEK (Houde 2007).Palmer and Wadley (2007) argue that some questions aboutLEK validity can be addressed by research that focuses onstudying LEK through observing lived practices rather thanrelying for evidence on LEK holders’ talk about environ-mental knowledge.
The issue of control over knowledge—including whoshould have control over LEK mapping processes and prod-ucts—is another challenge, particularly if local empower-ment is an objective. Historically, outside experts havedominated many LEK projects, raising concerns withinlocal knowledge communities about whether communitymembers risk losing control over what data is collected,how it is collected, and how it is shared.
Finally, most LEK mapping projects have no provisionfor updating maps and datasets as socioecological condi-tions and resource users’ understandings of their environ-ment change (Houde 2007). As the use of technologies thatpermit the collection of large amounts of data on an on-going basis expands, there is new urgency to ensure thatprovisions are made for the processing, storage, retrieval,and updating of extremely large data sets (Pulsifer et al.2011). This is particularly important if LEK is to be inte-grated into long-term and large-scale environmental moni-toring programs.
Sense of Place Mapping
SOP mapping draws on theory and empirical research inbehavioral geography and environmental psychology re-garding the concept of sense of place and the relationshipbetween sense of place and cognitive maps. Williams andStewart (1998:21) describe sense of place as “the idea thatplaces have meaning to people”. SOP theorists arguethat humans form attachments and assign meanings toplaces based on a variety of experiences (real or imag-ined) that occur in a particular place, such that “whatbegins as undifferentiated space becomes place as weget to know it better and endow it with value” (Tuan1977:6). Place meanings are intertwined with place-identity and involve a combination of beliefs, memories,and values (Proshansky et al. 1983); such meanings canemerge from direct personal experiences with particularplaces, through listening to others’ experiences, orthrough reading or watching movies about places onehas never visited. Additionally, physical attributes ofsettings influence the meanings that people assign tothem (Stedman 2003).
Hum Ecol
Author's personal copy
Understanding sense of place is important to environ-mental planners because the meanings people attach to land-scapes influence how they respond to proposed managementactions (Stedman 2003). For example, removing underbrushin forests to reduce the risk of fire may induce negativereactions from individuals who prefer forests to have a“wild” feeling but positive reactions from those who preferpark-like settings. The emotional attachments people haveto landscapes can motivate stewardship activities (Stedman2003); differences in the meanings different groups attach toplaces lie at the heart of many environmental conflicts(Cheng et al. 2003).
Behavioral geographers began using maps to exploresense of place in the 1960s. Lynch (1960) demonstrated thatcity residents’ free-hand sketch maps of their city showed ahigh degree of consistency in areas identified as meaningfulor lacking distinctiveness. He argued that such sketch mapswere physical representations of study participants’ “mentalmaps”, and that understanding those images could helpplanners better predict how proposed design changes wouldaffect those images. A decade later, Gould (1970) showedthat individual mental maps could be aggregated to identifyregional differences in residential preferences by using acommon base map as a template rather than relying onfree-hand sketches. Mental mapping has since been widelyused in urban and residential planning (Soini 2001), butonly in the past decade has it been widely applied in ruralcontexts.
SOP Mapping Methods and Processes
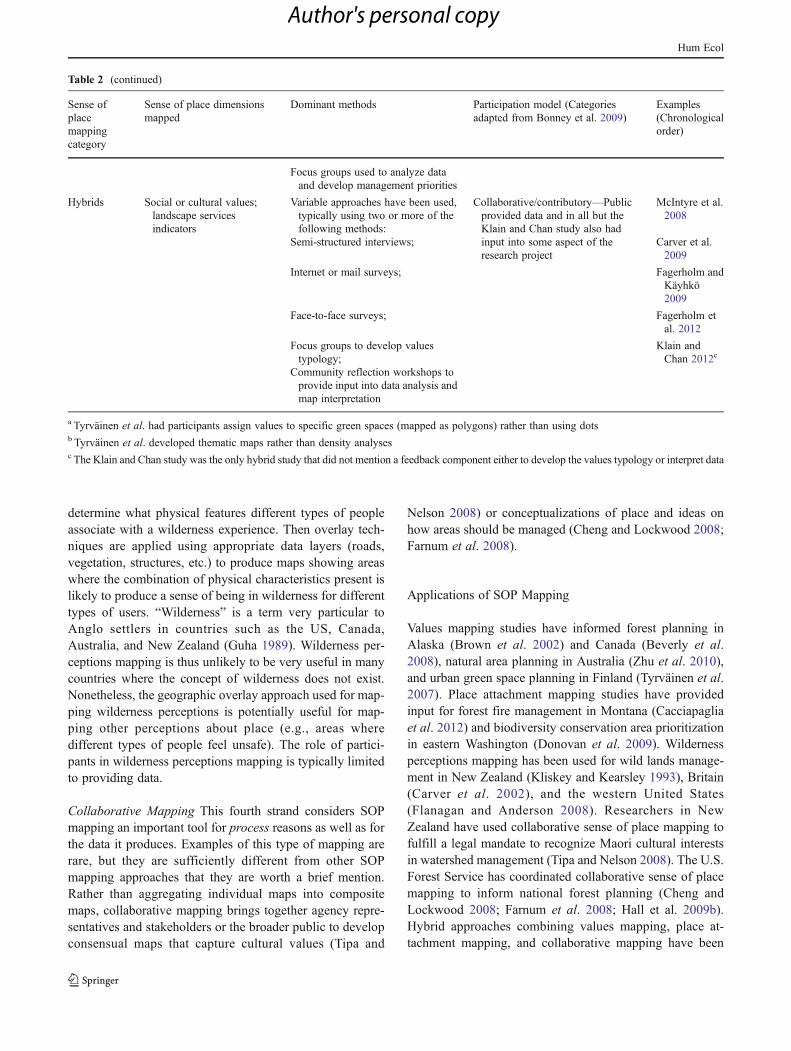
Terms used to describe SOP mapping include communityvalues mapping (Raymond et al. 2009), landscape valuesmapping (Carver et al. 2009), social values mapping(Sherrouse et al. 2011), place mapping (Cacciapaglia et al.2012), place-based planning (Farnum and Kruger 2008),and wilderness perceptions mapping (Kliskey andKearsley 1993) among others. In the sense of place mappingliterature we identified four fairly distinct strands differingaccording to what they map, data collection and analysismethods, and participation models (Table 2). The distinc-tions between these approaches are not clear cut; a numberof researchers have used hybrid approaches (see, e.g.,Carver et al. 2009; Fagerholm et al. 2012; Fagerholm andKäyhkö 2009; Klain and Chan 2012; McIntyre et al. 2008).
Values Mapping This strand of SOP mapping draws on aconceptual and methodological framework developed byBrown et al. (2002) for use in national forest planning.They collected sense of place data using quantitative meth-ods likely to be familiar to land managers with training inthe natural sciences with the hope that managers would bemore likely to use the data. Their framework measures the
location and intensity of values participants associate withparticular landscapes or features of landscapes.
Values mapping projects begin by creating a values ty-pology that participants use to assign values to differentparts of the landscape. Providing a pre-defined set of valuesreduces coding time and, if the same typology is used fordifferent studies, permits cross-study comparisons.Examples of values included in typologies include: aesthet-ic, biological, cultural, economic, future, historic, intrinsic,learning, life sustaining, recreation, spiritual, subsistence,therapeutic, and wilderness.
Mail or internet surveys are typically used to collect data.Survey respondents map locations they consider importantand assign values to those locations using the typology.Maps displaying the relative density of values across thelandscape are produced for each value and spatial relation-ships between landscape values and roads, water bodies,settlements or other relevant features are described (seeBeverly et al. 2008; Sherrouse et al. 2011). Participants inmost values mapping studies are typically treated as datacontributors and have minimal input in research design,implementation, or data analysis and interpretation.
Place Attachment Mapping This variant of SOP mappingseeks to elicit detailed information about the emotionalattachments or meanings associated with places.Gunderson and Watson (2007) argued that the values map-ping methodology developed by Brown et al. is ill-suited todescribing the complexity of interactions between emotions,values, experiences, and beliefs that form and influenceattachments to place. Place attachment mapping researchers(Table 2) typically collect data through open or semi-structured interviews during which participants map loca-tions they consider important, as well as giving the reasonswhy those places are important. Qualitative analysis soft-ware is used to identify key themes and values associatedwith the mapped locations. GIS layers for the themes andvalues are developed and maps are produced showing thedistribution of aggregated values and their relationship tobiophysical features. Place attachment practitioners contendthat developing the values categories inductively from in-terview data allows researchers to better capture respond-ents’ place meanings (Cacciapaglia et al. 2012; Gundersonand Watson 2007). However, transcribing and coding inter-views is time-consuming. In addition to soliciting data fromparticipants, place attachment studies often build in feed-back opportunities during the data analysis process.
Wilderness Perceptions Mapping This strand of SOP map-ping uses GIS overlays to model the spatial distribution ofpublic perceptions about wilderness (see Table 2). It seeks toanswer the question of “whose wilderness is where”(Kliskey and Kearsley 1993:206). Surveys are used to
Hum Ecol
Author's personal copy
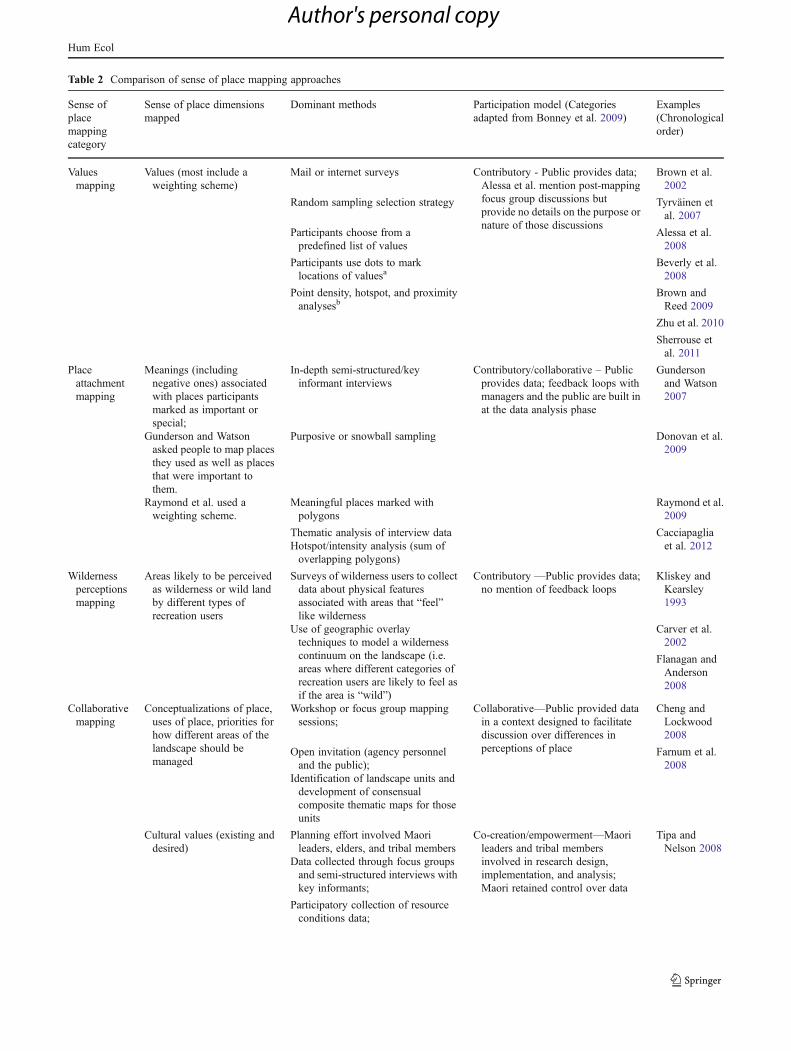
Table 2 Comparison of sense of place mapping approaches
Sense ofplacemappingcategory
Sense of place dimensionsmapped
Dominant methods Participation model (Categoriesadapted from Bonney et al. 2009)
Examples(Chronologicalorder)
Valuesmapping
Values (most include aweighting scheme)
Mail or internet surveys Contributory - Public provides data;Alessa et al. mention post-mappingfocus group discussions butprovide no details on the purpose ornature of those discussions
Brown et al.2002
Random sampling selection strategy Tyrväinen etal. 2007
Participants choose from apredefined list of values
Alessa et al.2008
Participants use dots to marklocations of valuesa
Beverly et al.2008
Point density, hotspot, and proximityanalysesb
Brown andReed 2009
Zhu et al. 2010
Sherrouse etal. 2011
Placeattachmentmapping
Meanings (includingnegative ones) associatedwith places participantsmarked as important orspecial;
In-depth semi-structured/keyinformant interviews
Contributory/collaborative – Publicprovides data; feedback loops withmanagers and the public are built inat the data analysis phase
Gundersonand Watson2007
Gunderson and Watsonasked people to map placesthey used as well as placesthat were important tothem.
Purposive or snowball sampling Donovan et al.2009
Raymond et al. used aweighting scheme.
Meaningful places marked withpolygons
Raymond et al.2009
Thematic analysis of interview data Cacciapagliaet al. 2012Hotspot/intensity analysis (sum of
overlapping polygons)
Wildernessperceptionsmapping
Areas likely to be perceivedas wilderness or wild landby different types ofrecreation users
Surveys of wilderness users to collectdata about physical featuresassociated with areas that “feel”like wilderness
Contributory —Public provides data;no mention of feedback loops
Kliskey andKearsley1993
Use of geographic overlaytechniques to model a wildernesscontinuum on the landscape (i.e.areas where different categories ofrecreation users are likely to feel asif the area is “wild”)
Carver et al.2002
Flanagan andAnderson2008
Collaborativemapping
Conceptualizations of place,uses of place, priorities forhow different areas of thelandscape should bemanaged
Workshop or focus group mappingsessions;
Collaborative—Public provided datain a context designed to facilitatediscussion over differences inperceptions of place
Cheng andLockwood2008
Open invitation (agency personneland the public);
Farnum et al.2008
Identification of landscape units anddevelopment of consensualcomposite thematic maps for thoseunits
Cultural values (existing anddesired)
Planning effort involved Maorileaders, elders, and tribal members
Co-creation/empowerment—Maorileaders and tribal membersinvolved in research design,implementation, and analysis;Maori retained control over data
Tipa andNelson 2008
Data collected through focus groupsand semi-structured interviews withkey informants;
Participatory collection of resourceconditions data;
Hum Ecol
Author's personal copy
determine what physical features different types of peopleassociate with a wilderness experience. Then overlay tech-niques are applied using appropriate data layers (roads,vegetation, structures, etc.) to produce maps showing areaswhere the combination of physical characteristics present islikely to produce a sense of being in wilderness for differenttypes of users. “Wilderness” is a term very particular toAnglo settlers in countries such as the US, Canada,Australia, and New Zealand (Guha 1989). Wilderness per-ceptions mapping is thus unlikely to be very useful in manycountries where the concept of wilderness does not exist.Nonetheless, the geographic overlay approach used for map-ping wilderness perceptions is potentially useful for map-ping other perceptions about place (e.g., areas wheredifferent types of people feel unsafe). The role of partici-pants in wilderness perceptions mapping is typically limitedto providing data.
Collaborative Mapping This fourth strand considers SOPmapping an important tool for process reasons as well as forthe data it produces. Examples of this type of mapping arerare, but they are sufficiently different from other SOPmapping approaches that they are worth a brief mention.Rather than aggregating individual maps into compositemaps, collaborative mapping brings together agency repre-sentatives and stakeholders or the broader public to developconsensual maps that capture cultural values (Tipa and
Nelson 2008) or conceptualizations of place and ideas onhow areas should be managed (Cheng and Lockwood 2008;Farnum et al. 2008).
Applications of SOP Mapping
Values mapping studies have informed forest planning inAlaska (Brown et al. 2002) and Canada (Beverly et al.2008), natural area planning in Australia (Zhu et al. 2010),and urban green space planning in Finland (Tyrväinen et al.2007). Place attachment mapping studies have providedinput for forest fire management in Montana (Cacciapagliaet al. 2012) and biodiversity conservation area prioritizationin eastern Washington (Donovan et al. 2009). Wildernessperceptions mapping has been used for wild lands manage-ment in New Zealand (Kliskey and Kearsley 1993), Britain(Carver et al. 2002), and the western United States(Flanagan and Anderson 2008). Researchers in NewZealand have used collaborative sense of place mapping tofulfill a legal mandate to recognize Maori cultural interestsin watershed management (Tipa and Nelson 2008). The U.S.Forest Service has coordinated collaborative sense of placemapping to inform national forest planning (Cheng andLockwood 2008; Farnum et al. 2008; Hall et al. 2009b).Hybrid approaches combining values mapping, place at-tachment mapping, and collaborative mapping have been
Table 2 (continued)
Sense ofplacemappingcategory
Sense of place dimensionsmapped
Dominant methods Participation model (Categoriesadapted from Bonney et al. 2009)
Examples(Chronologicalorder)
Focus groups used to analyze dataand develop management priorities
Hybrids Social or cultural values;landscape servicesindicators
Variable approaches have been used,typically using two or more of thefollowing methods:
Collaborative/contributory—Publicprovided data and in all but theKlain and Chan study also hadinput into some aspect of theresearch project
McIntyre et al.2008
Semi-structured interviews; Carver et al.2009
Internet or mail surveys; Fagerholm andKäyhkö2009
Face-to-face surveys; Fagerholm etal. 2012
Focus groups to develop valuestypology;
Klain andChan 2012c
Community reflection workshops toprovide input into data analysis andmap interpretation
a Tyrväinen et al. had participants assign values to specific green spaces (mapped as polygons) rather than using dotsb Tyrväinen et al. developed thematic maps rather than density analysesc The Klain and Chan study was the only hybrid study that did not mention a feedback component either to develop the values typology or interpret data
Hum Ecol
Author's personal copy
used to provide data for land use planning on Zanzibar(Fagerholm et al. 2012), coastal management (Klain andChan 2012) and recreation management in Canada(McIntyre et al. 2008), and fire management in Montana(Carver et al. 2009).
Challenges Associated with SOP Mapping
A major challenge of SOP mapping is that most projects relyon mappers’ memories or mental images of places andrarely include a field-based ground-truthing component.SOP mapping is thus highly susceptible to locational errorsand ambiguities in spatial representations (Zhu et al. 2010).This susceptibility is magnified for mapping projects inwhich participants mark locations using sticker dots, asthere is no way to know the spatial extent that each dotrepresents. Brown and Pullar (2012) found that it took tentimes as many point-based maps as polygon-based maps toachieve similar patterns when analyzing the data. Theyrecommend that the sticker dot method be used for mailand internet surveys which can reach a large number ofpeople and polygon methods for face-to-face interviews.
SOP mapping projects struggle with the question ofwhose landscape values or place meanings should bemapped. Many projects have solicited input only from indi-viduals residing in or near the study site or visiting the area(Brown and Reed 2009; Donovan et al. 2009; Tyrväinen etal. 2007). Yet many planning decisions need to account forthe values and place meanings of non-residents includ-ing those who never visit the area. In industrializedcountries, ready access to internet technologies hasmade it feasible to collect SOP data relatively inexpen-sively from non-residents but techniques for doing soremain experimental (Carver et al. 2002). However,well-educated, wealthier men tend to be disproportion-ately likely to participate in mail and internet surveysand other methods, such as workshops targeting specificsubgroups, may be needed to encourage broader-basedparticipation (Biedenweg et al. in review).
Brown and Reed (2009) describe chronic difficultieswith persuading natural resource planners to integratelandscape values mapping data into formal planning.They attribute this resistance to the lack of agencydirectives to include landscape value data in forest plan-ning, the costs of collecting and analyzing data, and thelack of agency social science expertise. However,researchers who built community and planner feedbackloops into their projects report positive responses fromplanners (Donovan et al. 2009; Raymond et al. 2009;Tipa and Nelson 2008). This suggests that more collab-orative forms of SOP mapping may help overcomeskepticism within government agencies about the valueof such data.
Discussion
Each of the approaches examined in this review provides aunique but important perspective on human-environmentalinteractions. Table 1 summarizes how TRU, LEK, and SOPmapping compare with respect to their theoretical roots,underlying models of participation, major applications,dominant data collection methods, and implementation chal-lenges. Both TRU and LEK mapping emerged from effortsby indigenous and local communities to gain greater influ-ence or control over land and resources and are theoreticallyand methodologically informed by the subfields of culturalecology, political ecology, and international development inthe disciplines of cultural geography and anthropology.TRU and LEK mapping draw heavily from the ethnogra-pher’s toolkit to translate individual and collective cognitivemaps into “standard” maps adhering to western cartographicconventions. Both approaches emphasize the use of quali-tative methods combined with field-based or remotelysensed measurements of boundaries, culturally importantlocations, or resource conditions. Additionally, many TRUand LEK mapping projects are driven by an empowermentmodel that seeks to maximize participants’ control over themapping process – and increasingly over the data and mapsproduced through those processes.
In contrast, SOP mapping is informed theoretically andmethodologically by the disciplines of behavioral geogra-phy, environmental psychology, and environmental plan-ning. Aside from the difference in thematic focus, SOPmapping differs significantly from LEK and TRU mappingin two respects. First, most SOP mapping projects concep-tualize participants as providers of data, or at most incorpo-rate feedback loops during the data analysis stage. Althoughcollaborative forms of SOP mapping do exist, they are rare.The discussions in LEK and TRU mapping projectsconcerning data sharing and control agreements and stepstaken to involve community members in all research phasesare strikingly absent in most SOP mapping studies. Tipa andNelson’s (2008) collaborative mapping with the Maori is anotable exception and indicates that more collaborativeapproaches to SOP mapping are possible. A second keydistinction between SOP mapping and TRU/LEK map-ping is the absence of efforts in SOP mapping projectsto ground-truth locations of the places or valuesmapped. This difference partly reflects differences inthe nature of the data and mapping goals, with senseof place locations being more abstract and harder to pindown compared to land boundaries or wildlife harvest-ing sites. However, it may also reflect the disciplinary“homes” of these approaches, with field-based observa-tions being a crucial component of ethnographers’ tool-kits but less commonly used by cognitive psychologistsand behavioral geographers.
Hum Ecol
Author's personal copy
Despite the differences in the three mapping approaches,they share a number of issues that need to be addressed inhuman ecology mapping projects. Three of these cross-cutting issues are briefly discussed below.
Limitations of GIS-Based Maps as Tools for RepresentingSocioecological Systems All three approaches share the aimof translating individual or collective mental maps intoCartesian coordinate systems. Yet mental map boundariesare often dynamic and fuzzy, qualities that do not translatewell into standard maps (McCall and Dunn 2012).Translation of mental maps into GIS data layers runs therisk of reifying boundaries as solid and rigid lines, ratherthan depicting them as the porous and shifting membranesthey often resemble. Moreover, mental maps consist of farmore than spatial locations: they include social relations,histories, events, and memories associated with those loca-tions. This data, too, is challenging to translate into standardmaps or geodatabases and, as a result, human ecologymapping inevitably oversimplifies and renders invisible im-portant aspects of human connections to landscapes.
Building in mechanisms to capture the fuzziness ofboundaries in mental maps can help limit some risks asso-ciated with HEM projects. For example, TRU mappingprojects can incorporate mechanisms for identifying anddocumenting overlapping and secondary rights to land andresources (Bryan 2011), providing communities and indi-viduals the flexibility in tenure arrangements needed toadapt to changing social and ecological conditions. Carveret al. (2009) have experimented with having participants inweb-based sense of place mapping use a customized “spraycan” tool to represent the fuzziness of spatial locations.Incorporation into geodatabases of explanatory narratives,oral histories, or land management histories associated withspatial locations can help human ecology mapping projectsretain important contextual data. However, researchers con-tinue to struggle with ways to analyze and display qualita-tive data. Interactive multi-media web-based cyber atlases,such as the Inuit sea ice atlas (Pulsifer et al. 2011), havestrong potential as platforms for representing the multiplefacets of human-environmental interactions in accessibleformats but they require considerable expertise and fundingto develop.
Power Differentials Mapping projects are an arena wherepower and access to resources are negotiated by the partiesat the table (Harley 1988), and those who are not engaged inmapping may not be heard. A related issue is that spatialacuity and map interpretation skills needed to participateeffectively in mapping are often unequally distributed with-in communities or across stakeholder groups. For example,if data is gathered or shared through a web-based interactiveGIS application, people comfortable with or with easy
access to such technologies may be more likely to partici-pate than those who are not (Eisner et al. 2012). TRU andLEK mapping practitioners have sought to minimize riskslinked to power and capacity imbalances by following par-ticipatory GIS “good governance” guidelines (McCall andDunn 2012), including recognition of intellectual propertyrights, sensitivity to local perceptions of space, awareness ofpower differentials within and between communities, crea-tion of opportunities for local input and decision-making,and training community members in mapping and analysis.These principles could potentially be applied to SOP map-ping projects as well.
Power imbalances could also be addressed by recruitingand training socially marginalized or less powerful commu-nity members in mapping techniques (Sletto 2009), throughthe use of geotechnologies likely to be understood by non-literate community members (such as photomaps rather thantopographical maps) (Mather 2000), or organizing mappingsessions geared to specific audiences (Biedenweg et al. inreview). In Canada, many First Nations have developedcapacity to do their own GIS-based mapping and havecreated networks, such as the Aboriginal MappingNetwork, to assist other groups in developing similar capac-ities (Brown and Nicholas 2012). As technology for record-ing spatial locations becomes more widely available,opportunities for removing barriers to participation in map-ping processes will increase (McCall and Dunn 2012). Theuse of a variety of mapping approaches and tools tailored todifferent skill and comfort levels can also help ensure that abroad spectrum of community members or stakeholders areincluded in mapping projects.
Resistance by Resource Managers to the use of HumanEcology Mapping Data Perhaps the biggest challenge facingefforts to integrate human ecology mapping into GIS-basedenvironmental planning is resistance on the part of scientists,resource managers, and planners. The reasons for resistance aremany. TRU mapping may threaten forest agencies’ long-standing control over valuable resources and forest agentsmay be skeptical of local communities’ capacity to manageforests sustainably (Roth 2004), sometimes justifiably so.Managers and planners, most of whom are trained in the naturalsciences and have little knowledge of social science methods,are skeptical of the validity of LEK or confused about what it is(Brook and McLachlan 2008; Kendrick and Manseau 2008).Additionally, collecting and validating LEK can be costly(Kendrick and Manseau 2008). Data collection costs and lackof agency directives requiring the use of sense of place data alsohinder efforts to integrate SOP mapping into resource planning(Brown and Reed 2009). The establishment of relationships oftrust and respect between community members, managers, andscientists is a key factor in successful efforts to integrate humanecology mapping into environmental management (Roth 2004;
Hum Ecol
Author's personal copy
Thornton and Scheer 2012; Tipa and Nelson 2008). Projectsthat emphasize community participation in all phases of map-ping tend to be more effective at creating such relationshipsthan those in which community members’ role is limited toproviding data (Brook and McLachlan 2008; Herlihy 2003;Thornton and Scheer 2012). Incorporating testing of LEK intomanagement programs can also help address concerns about itsvalidity (Gilchrist et al. 2005). The integration of social sciencecoursework into university level natural resource and ecologi-cal programs is a crucial step toward breaking down resistanceto the use of human ecology mapping in environmental plan-ning (Brook and McLachlan 2008).
Conclusion
Each of the approaches described in this review adds to ourknowledge of a particular dimension of human-environmentalinteractions. Used in combination, they offer the potential toproduce the kinds of multi-scalar and multi-dimensionalknowledge needed to manage complex ecosystems. To max-imize the effectiveness of human ecology mapping, however,two key constraints need to be overcome. One is the challengeof storing, accessing, analyzing and representing non-quantitative and non-cartographic data in GIS-based environ-ments. Fortunately, the past decade has seen significant de-velopment of qualitative GIS approaches that link images,annotated sketch maps, and narratives with spatial data. Asthese methods are refined and applied to real-world planningsituations, incorporating qualitative data into human ecologymapping will become easier. A second, much more challeng-ing constraint is the lack of social science expertise in mostnatural resource agencies. Overcoming this constraint requiresa reconceptualization of the fundamental job of such agenciesand the areas of expertise that need to be represented on theirstaffs. These agencies have long viewed measuring and map-ping natural resources (e.g., trees, fish, soil) as a critical aspectof what they do. If they are to be effective managers ofsocioecological systems, measuring and mapping human usesand values also must become part of their task as well.
Acknowledgments This work was supported by the USDA-ForestService, PNW Research Station under Joint Venture Agreement PNW08-JV-11261985-177,Mapping socioecological meanings of Olympic Pen-insula landscapes. We thank the two anonymous reviewers for their feed-back on the article and Leilan Greer for her assistance with copy-editing.
References
Agrawal, A. (1995). Dismantling the Divide between Indigenous andScientific Knowledge. Development and Change 26: 413–439.
Alessa, N., Kliskey, A., and Brown, G. (2008). Social-ecological HotspotsMapping: A Spatial Approach for Identifying Coupled Social-ecological Space. Landscape and Urban Planning 85(1): 27–39.
Aporta, C. (2011). Shifting Perspectives on Shifting Ice: Documentingand Representing Inuit Use of the Sea Ice. The CanadianGeographer 55(1): 6–19.
Aswani, S., and Lauer, M. (2006). Incorporating Fishermen’s LocalKnowledge and Behavior into Geographical Information Systems(GIS) for Designing Marine Protected Areas in Oceania. HumanOrganization 65(1): 81–102.
Barnaud, C., van Paassen, A., Trébuil, G., Promburom, T., andBousquet, F. (2010). Dealing with Power Games in aCompanion Modeling Process: Lessons from Community WaterManagement in Thailand Highlands. The Journal of AgriculturalEducation and Extension 16(1): 55–74.
Barodien, B., and Barry, M. (2004). Palm Computers for SpatiallyReferenced Social Surveys in Upgrading Informal Settlements.New Zealand Surveyor 294(June): 3–9.
Bauer, K. (2009). On the Politics and the Possibilities of ParticipatoryMapping and GIS: Using Spatial Technologies to Study CommonProperty and Land Use Change among Pastoralists in CentralTibet. Cultural Geographies 16(2): 229–252.
Berkes, F., Colding, J., and Folke, C. (2000). Rediscovery ofTraditional Ecological Knowledge as Adaptive Management.Ecological Applications 10(5): 1251–1262.
Bethel, M. B., Brien, L. F., Danielson, E. J., Laska, S. B., Troutman, J. P.,Boshart, W. M., Giardano, M. J., and Phillips, M. A. (2011).Blending Geospatial Technology and Traditional EcologicalKnowledge to Enhance Restoration Decision-support Processes inCoastal Louisiana. Journal of Coastal Research 27(3): 555–571.
Beverly, J. L., Uto, K., Wilkes, J., and Bothwell, P. (2008). AssessingSpatial Attributes of Forest Landscape Values: An Internet-basedParticipatory Mapping Approach. Canadian Journal of ForestResearch 38(2): 289–303.
Bonney, R., Ballard H., Jordan R., McCallie E., Phillips T., Shirk J.,and Wilderman C. C. (2009). Public Participation in ScientificResearch: Defining the Field and Assessing Its Potential forInformal Science Education. A CAISE Inquiry Group Report.Center for Advancement of Informal Science Education,Washington D.C.
Brody, H. (1982). Maps and Dreams. Pantheon Books, New York.Brook, R. K., and McLachlan, S. M. (2008). Trends and Prospects for
Local Knowledge in Ecological and Conservation Research andMonitoring. Biodiversity and Conservation 17: 3501–3512.
Brown, D., and Nicholas, G. (2012). Protecting Indigenous CulturalProperty in the Age of Digital Democracy: Institutional andCommunal Responses to Canadian First Nations and MaoriHeritage Concerns. Journal of Material Culture 17(3): 307–324.
Brown, G., and Pullar, D. V. (2012). An Evaluation of the Use ofPoints versus Polygons in Public Participation GeographicInformation Systems Using Quasi-experimental Design andMonte Carlo Simulation. International Journal of GeographicalInformation Science 26(2): 231–246.
Brown, G. G., and Reed, P. (2009). Public Participation GIS: A NewMethod for Use in National Forest Planning. Forest Science 55(2): 166–182.
Brown, G. G., Reed, P., and Harris, C. C. (2002). Testing a Place-basedTheory for Environmental Evaluation: An Alaska Case Study.Applied Geography 22: 49–76.
Bryan, J. (2011). Walking the Line: Participatory Mapping, IndigenousRights, and Neoliberalism. Geoforum 42: 40–50.
Cacciapaglia, M. A., Yung, L., and Patterson, M. E. (2012). PlaceMapping and the Role of Spatial Scale in UnderstandingLandowner Values of Fire and Fuels Management. Society andNatural Resources 25(5): 453–467.
Hum Ecol
Author's personal copy
Carver, S., Evans, A., and Fritz, S. (2002). Wilderness AttributeMapping in the United Kingdom. International Journal ofWilderness 8(1): 24–29.
Carver, S., Watson, A., Waters, T., Matt, R., Gunderson, K., and Davis, B.(2009). Developing computer-based participatory approaches tomapping landscape values for landscape and resource management.In Geertman, S., and Stillwell, J. (eds.), Planning Support SystemsBest Practice and New Methods. Springer, Dordrecht, pp. 431–448.
Chalmers N., and Fabricius C. (2007). Expert and Generalist LocalKnowledge about Land-cover Change on South Africa’s Wild Coast:Can Local Ecological Knowledge Add Value to Science? Ecologyand Society 12(1): 10 [online], http://www.ecologyandsociety.org/vol12/iss1/art10/.
Chapin, M., Lamb, Z., and Threlkeld, B. (2005). Mapping IndigenousLands. Annual Review of Anthropology 34: 619–638.
Charnley, S., Fischer, P., and Jones, E.T. (2008). Traditional and LocalEcological Knowledge about Forest Biodiversity in the PacificNorthwest. General Technical Report PNW-GTR-751. U.S.Department of Agriculture, Forest Service, Portland, OR.
Cheng, A. S., Kruger, L. E., andDaniels, S. E. (2003). “Place” as an IntegratingConcept in Natural Resource Politics: Propositions for a Social ScienceResearch Agenda. Society and Natural Resources 16: 87–104.
Cheng A.S., and Lockwood C. (2008). The Grand Mesa, Uncompaghre,and Gunnison National Forests. In Farnum, J., and Kruger, L. (eds.),Place-based Planning: Innovations and Applications from FourWestern Forests. General Technical Report PNW-GTR-741. U.S.Department of Agriculture, Forest Service, Portland, OR, pp. 33–40.
Cronkleton, P., Albornoz, M. A., Barnes, G., Evans, K., and deJong, W. (2010). Social Geomatics: Participatory ForestMapping to Mediate Resource Conflict in the BolivianAmazon. Human Ecology 38: 65–76.
de Freitas, D., and Tagliani, P. (2009). The Use of GIS for Integrationof Traditional and Scientific Knowledge in Supporting ArtisanalFisheries Management in Southern Brazil . Journal ofEnvironmental Management 90: 2071–2080.
Donovan, S. M., Looney, C., Hanson, T., Sánchez de León, Y.,Wulfhorst, J., Eigenbrode, S. D., Jennings, M., Johnson-Maynard, J., and Bosque Pérez, N. A. (2009). ReconcilingSocial and Biological Needs in an Endangered Ecosystem:The Palouse as a Model for Bioregional Planning. Ecologyand Society 14(1): 9. http://www.ecologyandsociety.org/vol14/iss1/art9.
Eisner, W. R., Cuomo, C. J., Hinkel, K. M., Jelacic, J., Kim, C., and delAlba, D. (2012). Producing an Indigenous Knowledge Web GISfor Arctic Alaska Communities: Challenges, Successes, andLessons Learned. Transactions in GIS 16(1): 17–37.
Endter-Wada, J., Blahna, D., Krannich, R., and Brunson, M. (1998). AFramework for Understanding Social Science Contributions toEcosystem Management. Ecological Applications 8(3): 891–904.
Endter-Wada, J., and Blahna, D. J. (2011). Linkages to Public LandFramework: Toward Embedding Humans in Ecosystem Analysisby Using ‘Inside-out Social Assessment. Ecological Applications21(8): 3254–3271.
Fagerholm, N., and Käyhkö, N. (2009). Participatory Mapping andGeographical Patterns of the Social Landscape Values of RuralCommunities in Zanzibar, Tanzania. Fennia 187: 43–60.
Fagerholm, N., Käyhkö, N., Ndumbaro, F., and Khamis, M. (2012).Community Stakeholders’ Knowledge in Landscape Assessments:Mapping Indicators for Landscape Services. Ecological Indicators18: 421–433.
Farnum, J., and Kruger, L. (2008). Place-based Planning: Innovationsand Applications from Four Western Forests. General TechnicalReport PNW-GTR-741. U.S.Department of Agriculture, ForestService, Portland, OR.
Farnum, J. O., DeZort, A., and Bean-Dochnal, J. (2008). TheBeaverhead-Deerlodge National Forest. In Farnum, J., and
Kruger, L. (eds.), Place-based Planning: Innovations andApplications from Four Western Forests. General TechnicalReport PNW-GTR-741. U.S. Department of Agriculture, ForestService, Portland, OR, pp. 7–14.
Feinberg, R., Dymon, U. J., Paiaki, P., Rangituteki, P., Nukuriaki, P., andRollins, M. (2003). ‘Drawing the Coral Heads’: Mental Mappingand its Physical Representation in a Polynesian Community. TheCartographic Journal 40(3): 243–253.
Flanagan, T. S., and Anderson, S. (2008). Mapping PerceivedWilderness to Support Protected Areas Management in the SanJuan National Forest, Colorado. Forest Ecology and Management256: 1039–1048.
Fox, J. (2002). Siam Mapped and Mapping in Cambodia: Boundaries,Sovereignty, and Indigenous Conceptions of Space. Society andNatural Resources 15(1): 65–78.
Freeman M. M. R. (1992). The Nature and Utility of TraditionalEcological Knowledge. Canadian Arctic Resources Committee10(1). [online], http://www.carc.org/pubs/v20no1/utility.htm.
Gearheard, S., Aporta, C., Aipellee, G., and O’Keefe, K. (2011). TheIgliniit Project: Inuit Hunters Document Life on the Trail toMap andMonitor Arctic Change. The Canadian Geographer 55(1): 42–55.
Gilchrist, G., Mallory, M., and Merkel, F. (2005). Can LocalEcological Knowledge Contribute to Wildlife Management?Case Studies of Migratory Birds. Ecology and Society 10(1):20. http://www.ecologyandsociety.org/vol10/iss1/art20/.
Gould, P. R. (1970). Onmental maps. In English, P.W., andMayfield, R. C.(eds.), Man, Space, and Environment: Concepts in ContemporaryHuman Geography. Oxford University Press, NewYork, pp. 260–282.
Guha, R. (1989). Radical American Environmentalism and WildernessPreservation: AThirdWorld Critique. Environmental Ethics 11: 71–83.
Gunderson, K., and Watson, A. (2007). Understanding Place Meaningson the Bitterroot National Forest, Montana. Society and NaturalResources 20(8): 705–721.
Hall, G. B., Moore, A., Knight, P., and Hanley, N. (2009a). TheExtraction and Utilization of Local and Scientific GeospatialKnowledge within the Bluff Oyster Fishery, New Zealand.Journal of Environmental Management 90: 2055–2070.
Hall T. E., Farnum J. O., Slider T. C., and Ludlow K. (2009). NewApproaches to Forest Planning: Inventorying and Mapping PlaceValues in the Pacific Northwest Region. Research Note PNW-RN-562. U.S. Department of Agriculture, Forest Service, Portland, OR.
Harley, J. B. (1988). Maps, knowledge, and power. In Cosgrove, D., andDaniels, S. (eds.), The Iconography of Landscape: Essays on theSymbolic Representation, Design and Use of Past Environments.Cambridge University Press, Cambridge, pp. 277–312.
Herlihy, P. H. (2003). Participatory Research Mapping of IndigenousLands in Darién, Panama. Human Organization 62(4): 315–331.
Hodgson, D. L., and Schroeder, R. A. (2002). Dilemmas of Counter-mapping Community Resources in Tanzania. Development andChange 33: 79–100.
Houde, N. (2007). The Six Faces of Traditional Ecological Knowledge:Challenges and Opportunities for Canadian Co-managementArrangements. Ecology and Society 12(2): 34. http://www.ecologyandsociety.org/vol12/iss2/art34/.
Ishikawa, T., and Montello, D. R. (2006). Spatial KnowledgeAcquisition from Direct Experience in the Environment:Individual Differences in the Development of Metric Knowledgeand the Integration of Separately Learned Places. CognitivePsychology 52: 93–129.
Kendrick, A., and Manseau, M. (2008). Representing TraditionalKnowledge: Resource Management and Inuit Knowledge ofBarren-Ground Caribou. Society and Natural Resources 21:404–418.
Klain, S. C., and Chan, K. M. A. (2012). Navigating Coastal Values:Participatory Mapping of Ecosystem Services for SpatialPlanning. Ecological Economics 82: 104–113.
Hum Ecol
Author's personal copy
Kliskey, A. D., and Kearsley, G. W. (1993). Mapping MultiplePerceptions of Wilderness in Southern New Zealand. AppliedGeography 13: 203–223.
Kyem, P. A. K. (2004). Of Intractable Conflicts and Participatory GISApplications: The Search for Consensus Amidst CompetingClaims and Institutional Demands. Annals of the Association ofAmerican Geographers 94(1): 37–57.
Lewis, J. (2012). Technological Leap-frogging in the Congo Basin,Pygmies and Global Positioning Systems in Central Africa: Whathas Happened and Where is it Going? African Study MonographsSupplement 43(March): 15–44.
Liu, J., Dietz, T., Carpenter, S. R., Alberti, M., Folke, C., Moran, E.,Pell, A. N., Deadman, P., Kratz, T., Lubchenco, J., Ostrom, E.,Ouyang, Z., Provencher, W., Redman, C. L., Schneider, S. H., andTaylor, W. W. (2007). Complexity of Coupled Human and NaturalSystems. Science 317(5844): 1513–1516.
Lynch, K. (1960). The Image of the City. Harvard-MIT Joint Center forUrban Studies, Boston.
Marten, G. (2001). Human Ecology—Basic Concepts for SustainableDevelopment. Earthscan, New York.
Mather, R. A. (2000). Using Photomaps to Support ParticipatoryProcesses of Community Forestry in the Middle Hills of Nepal.Mountain Research and Development 20(2): 154–161.
McCall, M. K., and Dunn, C. E. (2012). Geo-information Tools forParticipatory Spatial Planning: Fulfilling the Criteria for ‘Good’Governance? Geoforum 43: 81–94.
McCall, M. K., and Minang, P. A. (2005). Assessing Participatory GISfor Community-based Natural Resource Management: ClaimingCommunity Forests in Cameroon. The Geographical Journal 171(4): 340–356.
McCarthy, D., Whitelaw, D. P., Anderson, G. S., Cowan, D., McGarry, F.,Robins, A., Gardner, H. L., Barbeau, C. D., Charania, N. D., General,Z., Liedtke, J., Sutherland, C., Alencar, P., and Tsuji, L. J. S. ( 2012).Collaborative Geomatics and the Mushkegowuk Cree First Nations:Fostering Adaptive Capacity for Community-Based Sub-arcticNatural Resource Management. Geoforum 43: 305-314.
McIntyre, N., Moore, J., and Yuan, M. (2008). A Place-based, Values-centered Approach to Managing Recreation on Canadian CrownLands. Society and Natural Resources 21(8): 657–670.
McKenna, J., Quinn, R. J., Donnelly, D. J., and Cooper, J. A. G. (2008).AccurateMentalMaps as an Aspect of Local Ecological Knowledge(LEK): A Case Study from Lough Neagh, Northern Ireland.Ecology and Society 13(1): 13. http://www.ecologyandsociety.org/vol13/iss1/art13/.
Murray, G., Neis, B., Palmer, C. T., and Schneider, D. C. (2008).Mapping Cod: Fisheries Science, Fish Harvesters' EcologicalKnowledge and Cod Migrations in the Northern Gulf of St.Lawrence. Human Ecology 36(4): 581–598.
Palmer, C. T., and Wadley, R. L. (2007). Local EnvironmentalKnowledge, Talk, and Skepticism: Using ‘LES’ to Distinguish‘LEK’ from ‘LET’ in Newfoundland. Human Ecology 35(6):749–760.
Peluso, N. L. (1995). Whose Woods Are These? Counter-mappingForest Territories in Kalimantan, Indonesia. Antipode 27(4):383–406.
Perkins, C. (2003). Cartography: Mapping Theory. Progress in HumanGeography 27(3): 341–351.
Proshansky, H. M., Fabian, A. K., and Kaminoff, R. (1983). Place-identity: Physical World Socialization of the Self. Journal ofEnvironmental Psychology 3: 57–83.
Pulsifer, P. L., Laidler, G. J., Taylor, D. R. F., and Hayes, A. (2011).Towards an Indigenist Data Management Program: Reflections onExperiences Developing An Atlas of Sea Ice Knowledge and Use.The Canadian Geographer 55(1): 108–124.
Raymond, C. M., Bryan, B. A., MacDonald, D. H., Cast, A.,Strathearn, S., Grandgirard, A., and Kalivas, T. (2009). MappingCommunity Values for Natural Capital and Ecosystem Services.Ecological Economics 68: 1301–1315.
Roth, R. (2004). Spatial Organization of Environmental Knowledge:Conservation Conflicts in the Inhabited Forest of NorthernThailand. Ecology and Society 9(3): 5. http://www.ecologyandsociety.org/vol9/iss3/art5/.
Rundstrom, R. A. (1990). A Cultural Interpretation of Inuit MapAccuracy. Geographical Review 80(2): 155–168.
Sherrouse, B. C., Clement, J. M., and Semmens, D. J. (2011). A GISApplication for Assessing, Mapping, and Quantifying the SocialValues of Ecosystem Services. Applied Geography 31: 748–760.
Sletto, B. I. (2009). “We Drew What We Imagined”: ParticipatoryMapping, Performance, and the Arts of Landscape Making.Current Anthropology 50(4): 443–476.
Smith, D. A., Herlihy, P. H., Viera, A. R., Kelly, J. H., Hilburn, A. M.,Robledo, M. A., and Dobson, J. E. (2012). Using ParticipatoryResearch Mapping and GIS to Explore Local GeographicKnowledge of Indigenous Landscapes in Mexico. Focus onGeography 55(4): 119–124.
Soini, K. (2001). Exploring Human Dimensions of MultifunctionalLandscapes through Mapping and Map-making. Landscape andUrban Planning 57: 225–239.
Stedman, R. C. (2003). Is It Really A Social Construction?: TheContribution of the Physical Environment to Sense of Place.Society and Natural Resources 16: 671–685.
Steiner, F. (2002). Human Ecology. Island Press, Washington, D.C.St Martin, K., and Hall-Arber, M. (2008). The Missing Layer: Geo-
technologies, Communities, and Implications for Marine SpatialPlanning. Marine Policy 32(5): 779–786.
Thornton, T. F., and Scheer, A. M. (2012). Collaborative Engagementof Local and Traditional Knowledge and Science in MarineEnvironments: A Review. Ecology and Society 17(3): 8. http://dx.doi.org/10.5751/ES-04714-170308.
Tipa, G., and Nelson, K. (2008). Introducing Cultural Opportunities: AFramework for Incorporating Cultural Perspectives in ContemporaryResource Management. Journal of Environmental Policy andPlanning 10(4): 313–337.
Tobias, T. N. (2000). Chief Kerry’s Moose: A Guidebook to Land Useand Occupancy Mapping, Research Design and Data Collection.Ecotrust Canada and Union of BC Indian Chiefs, Vancouver.
Tuan, Y. F. (1977). Space and Place: The Perspective of Experience.Edward Arnold Ltd, London.
Tyrväinen, L., Mäkinen, K., and Schipperijn, J. (2007). Tools forMapping Social Values of Urban Woodlands and Other GreenAreas. Landscape and Urban Planning 79(1): 5–19.
Vermeylen, S., and Davies, G. (2012). Deconstructing the ConservancyMap: Hxaro, N!ore, and Rhizomes in the Kalahari. Cartographica47(2): 121–134.
Williams, D. R., and Stewart, S. I. (1998). Sense of Place: An ElusiveConcept that is Finding a Home in Ecosystem Management.Journal of Forestry 96: 18–23.
Zhu, X., Pfueller, S., Whitelaw, P., and Winter, C. (2010). SpatialDifferentiation of Landscape Values in the Murray River Regionof Victoria, Australia. Environmental Management 45(5): 896–911.
Hum Ecol
Author's personal copy