Embed Size (px)
Citation preview

8132019 Mcpt Teheran analisis de macizos rocosos en la ingenieria practica
httpslidepdfcomreaderfullmcpt-teheran-analisis-de-macizos-rocosos-en-la-ingenieria-practica 112
JGeope 2 (2) 2012 P 65-76
Using Miniature Cone Penetration Test (Mini-CPT) to determine
engineering properties of sandy soils
Mohammad Reza Nikudel Seyed Ehsan Mousavi Mashaallah Khamehchiyan Amin Jamshidi
Department of Geology Faculty of Basic Science Tarbiat Modares University
Corresponding author e-mail nikudelmmodaresacir
(received 10012012 accepted 28112012)
AbstractIn-situ testing techniques have proven to be successful in improving the speed and reliability of geotechnical investigations One of the
most common in-situ methods in engineering geology and site investigation is Cone Penetration Test (CPT) which is mainly used for
characterization of soils as it is a robust simple fast reliable and economic test that can provide continuous soundings of subsurface
soil Miniature Cone Penetration (Mini-CPT) Test is a new type of CPT but in diameter less than conventional CPT to determine the
bearing capacity and strength parameters of loose to semi-dense soils at shallow depth Mini-CPT needs lower force to penetrate intothe soil and its ability to identify very thin underneath layers is higher than CPT In this research a Mini-CPT apparatus was used in
laboratory conditions to define the relationships between tip resistance (qc(MCPT)) friction resistance (f s(MCPT)) and some engineering
properties of poorly graded sandy soils such as Relative Density (Dr ) Friction Angle (φ) Elastic Modulus (E) Shear Modulus (G) and
the Modulus of Subgrade Reaction (K s) with different densities Based on the results of the experiments the relationships between
both the qc(MCPT) and f s(MCPT) with engineering properties were obtained with a high determination coefficient (R 2gt085)
Keywords Engineering Properties Miniature Cone Penetration Test (Mini-CPT) Poorly Graded Sandy Soils
Introduction
In soil exploration a modern and expedient
approach is offered by cone penetration testing
(CPT) which involves pushing an electronic
penetrometer instrument into the soil and recordingmultiple measurements continuously with depth
(Schmertmann 1978 Briaud amp Miran 1992) By
using ASTM-D5778-95 (2003) three separate
measurements of tip resistance (qc) sleeve friction
(f s) and pore-water pressure (u) are obtained with
depth In its simplest application the cone
penetrometer offers a quick expedient and
economical way to profile the subsurface soil
layering at a particular site No drilling soil
samples or spoils are generated therefore CPT is
less disruptive from environmental standpoint Thecontinuous nature of CPT readings permits clear
explanations of various soil strata as well as their
depths thicknesses and extent perhaps better than
conventional rotary drilling operations A variety of
cone penetrometer systems is available ranging
from small mini-pushing units to very large trucks
The electronic penetrometers range in size from
small to large probes from one to five separate
channels of measurements (TRBNA 2007)
Miniature cone penetrometers are available with
the reduced cross-sectional sizes of 5 cm2 and 1
cm2 (Tumay et al 1998)
The most important advantages of miniature
penetrometer are
- Smaller downward thrust needed to advance the
penetrometer into the soil (Tumay et al 1998)
- Ability to identify very thin lenses (Meigh1987)
- Installation in a smaller vehicle that provides
greater mobility and site accessibility (Tufenkjian
amp Thompson 2005)
The Mini-CPT has been used for identification of
geotechnical properties of near surface seafloor
soils during the installation of military seafloor
cable systems in sands (Tufenkjian amp Thompson
2005) Earliest versions of sounding were
developed in 1917 by the Swedish State Railways
then by the Danish railways in 1927 (Meigh 1987)Initial cone systems were the mechanical-type
design with two sets of rods An outer set of steel
rods was employed to minimize soil friction and
protect an inner stack of rods that transferred tip
forces inside the hole into a pressure gauge read-
out at the ground surface (TRBNA 2007) A
friction sleeve to measure local skin friction over a
short length above the cone was then introduced in
Indonesia (Begemann 1965) The electric
penetrometer was first introduced in 1948 (Meigh
1987) As early as 1962 a research piezocone was
designed for tip and pore-water readings by theDelft Soil Mechanics Laboratory (Vlasblom 1985)
8132019 Mcpt Teheran analisis de macizos rocosos en la ingenieria practica
httpslidepdfcomreaderfullmcpt-teheran-analisis-de-macizos-rocosos-en-la-ingenieria-practica 212
66 Nikudel et al JGeope 2 (2) 2012
The combination of the electric cone with the
electric piezoprob was an inevitable design as the
hybrid piezocone penetrometer could be used to
obtain three independent readings during the samesounding tip stress sleeve friction and pore-water
pressures (Baligh et al 1981) Mini-CPT is a new
type of CPT with a projected cone area of 2 cm2
which gives finer details than the standard 10 cm2
cross-section area reference cone penetrometer
Continuous Intrusion Miniature Cone Penetration
Test (CIMCPT) may be used for rapid accurate
and economical characterization of sites and to
determine the engineering parameters of soil which
are needed in the design of pavements
embankments and earth structures The maximum
depth of penetration that can be achieved by theCIMCPT system is 12 m (Tumay et al 1998)
The main objective of this paper is to describe the
capability of the Mini-CPT to study the engineering
properties of sandy soils We used a penetrometer
with a diameter of 16 cm (projected area of 2 cm2)
in laboratory conditions In addition several testessuch as Plate Load Test (PLT) and direct shear test
were conducted to determine the deformability and
strength characterizations of soil sample
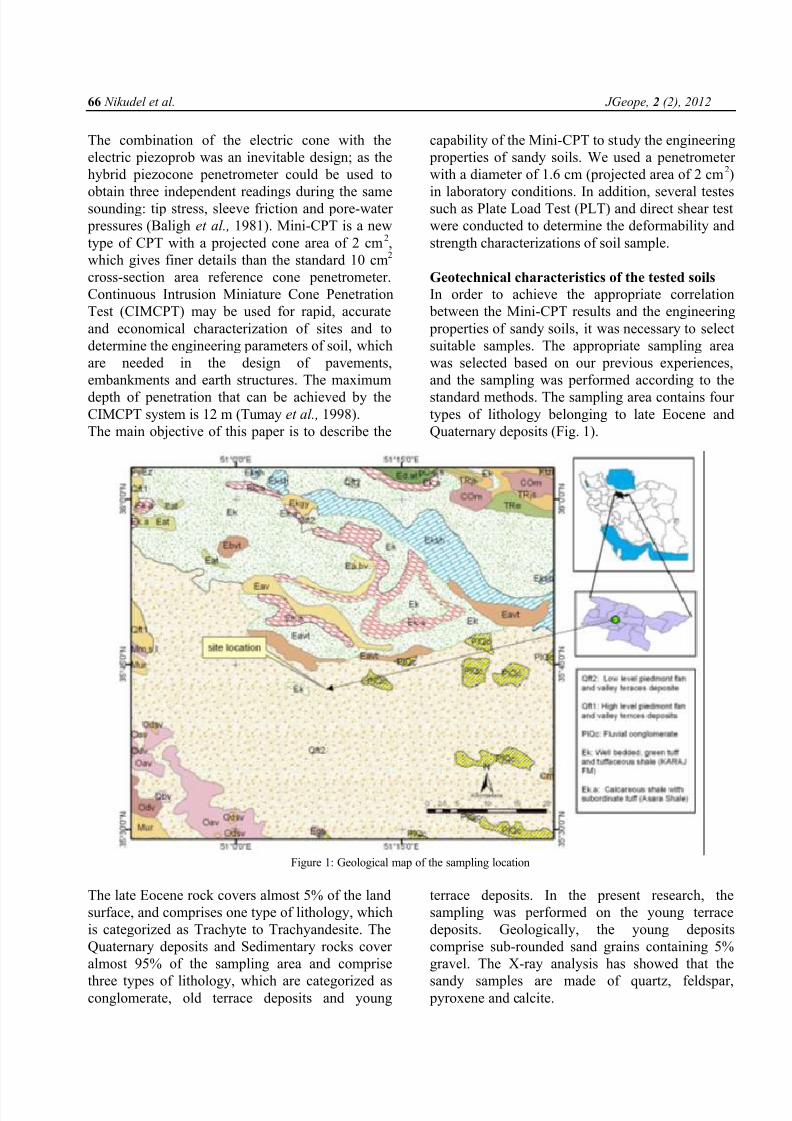
Geotechnical characteristics of the tested soils
In order to achieve the appropriate correlation
between the Mini-CPT results and the engineering
properties of sandy soils it was necessary to select
suitable samples The appropriate sampling area
was selected based on our previous experiences
and the sampling was performed according to the
standard methods The sampling area contains fourtypes of lithology belonging to late Eocene and
Quaternary deposits (Fig 1)
Figure 1 Geological map of the sampling location
The late Eocene rock covers almost 5 of the land
surface and comprises one type of lithology which
is categorized as Trachyte to Trachyandesite The
Quaternary deposits and Sedimentary rocks cover
almost 95 of the sampling area and comprise
three types of lithology which are categorized asconglomerate old terrace deposits and young
terrace deposits In the present research the
sampling was performed on the young terrace
deposits Geologically the young deposits
comprise sub-rounded sand grains containing 5
gravel The X-ray analysis has showed that the
sandy samples are made of quartz feldspar pyroxene and calcite
8132019 Mcpt Teheran analisis de macizos rocosos en la ingenieria practica
httpslidepdfcomreaderfullmcpt-teheran-analisis-de-macizos-rocosos-en-la-ingenieria-practica 312
Using Miniature Cone Penetration Test (Mini-CPT) to determine engineering hellip 67 To prepare the testing samples alluvial deposits
were oven-dried and passed through sieve No 4
Fig 2 shows the gradation curve of the sample after
passing sieve No 4 which is classified as poorlygraded sand (SP) according to the Unified Soil
Classification System (USCS) The index
properties of the soil are shown in Table 1 To
obtain a uniform compaction the sample in the
testing mould was compacted in several 100 mm
thick layers The compaction effort for dry soil was
applied using a 300 mm vibrating plate in a way
that the required density was achieved The in-
place density for each soil layer was controlled
using the sand cone method For the sand cone
method the hole from which the soil sample was
removed was filled with dry sand from a graduated bottle The sand has a uniform known density so
its dry weight volume is then known (see Fig 3)
Details of the tests on the samples with different
densities are shown in Table 2
Table 1 The index properties of used soilValueParameter
097emax(-)
046emin(-) 266Gs(-) 1785γd(max)(KNm3)
1324γd(min)(KNm3) 116Cu(-)
1Cc(-) 0Value of clay () 2Value of silt ()
spUSCS soil classification
Figure 2 Gradation curve of the used soil
Figure 3 Schematic diagram of sand cone method
Testing procedure
Several tests including Mini-CPT plate load and
direct shear were carried out to determine the
engineering properties of sandy soils Details of the
tests on the samples with different densities are
indicated in Table 2
Mini-CPT testIn this research Mini-CPTs were carried out to the
depth of approximately 1m in an especial designed
circular mould Two miniature cone penetrometers
with a projected cone area of 2 cm2 friction sleeve
area of 43 cm2 and a cone apex angle of 60deg were
used (Fig 4) They both were of the subtraction
type that measures either the cone resistance or
combined cone resistance plus local sleeve friction
resistance In the latter state combined cone
resistance plus the local sleeve friction resistance
must be subtracted from the local sleeve frictionresistance The ASTM-D3441 (2004) standard
method was followed to perform the tests Mini-
CPTs were done on the samples with different
relative densities (25 35 50 60 and 75)
and repeated three times The results for mean
qc(MCPT) and f s(MCPT) are shown in Fig 5a b
respectively Tip resistance (qc(MCPT)) and friction
resistance (f s(MCPT)) are shown in MPa and kPa
respectively It is to be noted that the presented
results for qc(MCPT) and f s(MCPT) are the average of
resistances in different depths The results of these
determinations are given in Table 3
8132019 Mcpt Teheran analisis de macizos rocosos en la ingenieria practica
httpslidepdfcomreaderfullmcpt-teheran-analisis-de-macizos-rocosos-en-la-ingenieria-practica 412
68 Nikudel et al JGeope 2 (2) 2012
Table 2 Testing program for the laboratory investigations and different densities for the tested soilDirect shear
(number of tests) PLT (number
of tests) Mini-CPT (number of
tests for f s and qc) Dry unit weight
(grcm3) Mean of water
content () Dr () 3 3 6 144 04 25 3
3
6
148
04
35
3 3 6 155 04 50 3 3 6 160 04 60 3 3 6 167 04 75
Table 3 Summary of all the results
Dr φ (Deg) qc(MCPT) (MPa) f s(MCPT) (kPa) EPLT(i) (MPa) EPLT(R2) (MPa) GPLT(i) (MPa) k s (MNm3)
25
1 295 1023 3196 6 25 15 26
2 32 1052 3627 75 29 19 27
3 33 1062 4073 8 38 22 28
35
1 32 2740 4262 93 41 25 46
2 341 2905 6313 95 5 26 48
3 342 3308 7190 10 55 3 49
50
1 355 3712 6325 13 6 43 100
2 37 4325 6650 15 85 5 100
3 39 4295 11103 15 9 52 125
60
1 39 6512 15758 155 105 95 120
2 39 8058 18592 155 11 10 120
3 395 8145 21493 16 115 11 130
75
1 41 10187 42746 20 142 145 162
2 42 10537 49290 225 15 18 178
3 435 12200 49965 249 158 19 200
Figure 4 Miniature cone pentrometers
Plate Load Test (PLT)Plate Load Test (PLT) is a common site
investigation tool which has been used for proof
testing of pavement layers in the European
countries for many years Currently it is also for
evaluation of both rigid and flexible pavements
(Abu-Farsakh et al 2004) The PLT in full or
small scale is sometimes considered as the best
means of determining the deformation
characteristics of the soils however it is only used
in exceptional cases due to the costs involved
(Bowles 1997) In the present research a round
plate with 230 mm diameter was used PLT was
used as a reference test to obtain the strength
parameters of the soil under investigation A
loading frame was designed to fit the mould and its
support To perform the test the bearing plate and
the hydraulic jack were carefully placed at thecenter of the sample under the loading frame (Fig
6) The hydraulic jack and the supporting frame
were able to apply a 60 ton load For measurement
of deformations dial gauges that are capable of
recording a maximum deformation of 254 mm (1
in) with an accuracy of 0001 in were used The
ASTM-D 1195-93 (1998) standard method was
followed to perform the test
Elasticity modulus is always considered as an
important deformability parameter for
geomaterials Based on stress-strain curve differentelasticity modulus can be defined as 1) the initial
tangent modulus 2) the tangent modulus at a given
stress level 3) reloading and unloading modulus
and 4) the secant modulus at a given stress level In
this study since the stress ndash strain curves had a clear
peak the initial tangent modulus was determined
for all PLT results To determine the initial
modulus (EPLT(i)) a line was drawn tangent to the
initial segment of the stress ndash strain curve Then an
arbitrary point was chosen on the line and the
stress and deflection corresponding to this point
were determined for calculating of the initialmodulus Fig 7 describes the settlement and stress
8132019 Mcpt Teheran analisis de macizos rocosos en la ingenieria practica
httpslidepdfcomreaderfullmcpt-teheran-analisis-de-macizos-rocosos-en-la-ingenieria-practica 512
Using Miniature Cone Penetration Test (Mini-CPT) to determine engineering hellip 69 used for determining EPLT(i) (Abu-farsakh et al
2004) A reloading stiffness modulus called
EPLT(R2) was also determined for each stress ndash strain
curve
Figure 5 a) Miniature cone tip resistance (qc(MCPT)) b)
Miniature cone friction resistance (f s(MCPT)) profiles in the sands
with different relative densities
Figure 6 A schematic diagram of plate load test (PLT) set up
(a) side view and (b) plan view
The second parameter which can be calculated
from the PLT results is shear modulus (G) Shear
modulus is defined as the ratio of shear stress to
shear strain (Bowles 1997) and is calculated fromequation (1) (Timoshenko amp Goodier 1970)
)1(8
qDG PLT
(1)
Where q is the bearing pressure D is the diameter
of the loading plate ρ is the settlement and υ is the
Poisson ratio
From the theory of elasticity the relationship
between the modulus of elasticity and the shear
modulus can be given as below
E=2(1+υ)G (2)
Since the non-rigid methods consider the effect of
local mat deformations on the distribution of
bearing pressure it is needed to define the
relationship between settlement and bearing
pressure This is usually done using the coefficient
of subgrade reaction (K s) Equation (3) is used to
determine K s from the PLT results (Coduto 2001)
k s= ΔPΔS (3)
Where K s is the modulus of subgrade reaction ΔP
is the applied pressure and ΔS is the measuredsettlement The results of these determinations are
given in Table 3
Figure 7 Definition of modulus from PLT (Abu-farsakh et al
2004) Direct shear test
In order to determine the soil friction angle (φ) 15
direct shear tests were carried out in a circular
shear mould according to ASTM-D 308-90 (2000)
(see Table 2) To prepare the soil samples fordirect shear test a circular shear box having 60
8132019 Mcpt Teheran analisis de macizos rocosos en la ingenieria practica
httpslidepdfcomreaderfullmcpt-teheran-analisis-de-macizos-rocosos-en-la-ingenieria-practica 612
70 Nikudel et al JGeope 2 (2) 2012
mm internal diameter and 25 mm height was used
To achieve a uniform compaction in the circular
shear mould of the direct shear machine tamping
by a small circular steel plate with 60 mm diameterwas used
Due to the nature of the soil samples (non-
cohesive) cohesion parameter (C) was equal to
zero and thus friction angles were calculated To
eliminate the effect of pore pressure all direct
shear tests were carried out in dry conditions The
results of direct shear tests are given in Table 3
Results and discussion
One of the most commonly accepted methods of
investigating empirical relationships between soil
properties is simple regression analysis In thisstudy the results of all tests were assessed to find
the best correlation between Mini-CPT strength
parameters (qc(MCPT) and f s(MCPT)) and the index
properties of the soil samples ie Relative Density
(Dr ) Friction Angle (φ) Elastic Modulus (E) Shear
Modulus (G) and Subgrade Reaction Modulus (K s)
The linear and non-linear simple regressions were
undertaken with 95 confidence level and the
determination coefficient (R 2) was obtained for the
relationships The authors attempted to develop the
best correlation between different variables in orderto attain the most reliable empirical equation
Mini-CPT parameters versus relative density (Dr )
Relative density is a useful parameter to describe
the consistency of sands CPT can be used to
estimate both the relative density of cohesionless
soil and the undrained strength of cohesive soils
through empirical correlations (USACE 1992)
Several investigators including Schmertmann
(1978) Villet amp Mitchell (1981) Baldi et al
(1982) Robertson amp Campanella (1983)
Jamiolkowski et al (1988) Puppala et al (1995)
and Juang et al (1996) have developed
correlations for the relative density (Dr ) as a
function of qc for sandy soils These relationships
are also functions of vertical effective stress
(Amini 2003)
In this study the correlation of Dr with qc(MCPT) and
f s(MCPT) was investigated (Fig 8) show the
relationships of Dr with qc(MCPT) and f s(MCPT) for the
tested samples respectively A very high
correlation with the determination coefficient 096
was found between Dr and qc(MCPT)Dr ()=23733 (qc(MCPT))
0469 R 2=096 (4)
Similarly a power relationship was observed
between Dr and f s(MCPT) with a high determination
coefficient 084
Dr ()=7408 (f s(MCPT))
0389
R
2
=085 (5)
Figure 8 Correlation between a) qc(MCPT) and b) f s(MCPT) with Dr
According to these results for estimation of Dr
using qc(MCPT) is more reliable than f s(MCPT) because
of higher determination coefficient The application
range of the equations obtained in this study is
1023-122 MPa for qc(MCPT) and 3196-49965 kPa
for f s(MCPT
Mini-CPT parameters versus friction angle (φ)
Friction angle is one of the most important index
parameters needed for calculation of shear strength
in any foundation design
(Fig 9) depict that good correlations were found
between friction angle (φ) and qc(MCPT) and f s(MCPT)
with determination correlations of 087 and 089
respectively
φ=305(qc(MCPT))0127
R 2=087 (6)
φ=215(f s(MCPT))0113 R 2=089 (7)
As can be seen from these Figs also equations (6)
and (7) in each case the best fit relation is
represented by power regression curves Anincrease in friction angle was recorded following an
8132019 Mcpt Teheran analisis de macizos rocosos en la ingenieria practica
httpslidepdfcomreaderfullmcpt-teheran-analisis-de-macizos-rocosos-en-la-ingenieria-practica 712
Using Miniature Cone Penetration Test (Mini-CPT) to determine engineering hellip 71 increase in both qc(MCPT) and f s(MCPT)
The correlation between friction angle (φ) and
relative density (Dr ) for the results obtained in this
research is presented in Fig 10 and equation (8)φ = 021(Dr )+26 R 2=092 (8)
Figure 9 Correlation between a) qc(MCPT) and b) f s(MCPT) with φ
Figure 10 Correlation between Dr and φ
There is a linear relationship between friction angle
(φ) and relative density (Dr ) with a high
determination coefficient (092)
Similar relationships have been obtained between
friction angle (φ) and relative density (Dr ) by
different authors such as Meyerhof (1959) He has
suggested equation (9) for normally consolidated
sands
=φ 015(Dr ) (9)
Mini-CPT parameters versus elastic modulus (E)
The cone penetration resistance has been correlated
with the equivalent elastic modulus of soils by
various investigators (Trofimenkov 1974
Schmertmann et al 1986)
Table 4 Summary of the equations developed in this paperDetermination
coefficient (R 2) Type correlation Equations Parameters (R 2=096) powerDr ()=23733 (qc(MCPT))
0469 Dr -qc(MCPT) (R 2=085) power Dr ()=7408 (f s(MCPT))
0389 Dr ()-f s(MCPT) (R 2=092) linear EPLT(i)=1457(qc(MCPT))+607 EPLT(i)-qc(MCPT) (R 2=096) linear EPLT(R2)=12(qc(MCPT))+2 EPLT(R2)-qc(MCPT) (R 2=097)logarithmic EPLT(R2)=46 Ln(f s(MCPT))-13 EPLT(R2)-f s(MCPT) (R 2=091) logarithmic EPLT(i)=556 Ln(f s(MCPT))-12 EPLT(i)-f s(MCPT) (R 2=092) power GPLT(i)=137(qc(MCPT))
097 GPLT(i)-qc(MCPT) (R 2=094) power GPLT(i)=01(f s(MCPT))
0869 GPLT(i)-f s(MCPT) (R 2=092) power k s=25(qc(MCPT))
0817 k s-qc(MCPT) (R 2=090) logarithmic k s=57Ln(f s(MCPT))-169k s-f s(MCPT) (R 2=087) power φ=305(qc(MCPT))
0127 φ-qc(MCPT) (R 2=089) power φ=215(f s(MCPT))
0113 φ-f s(MCPT)
(R 2=092) linear φ= 021(Dr )+26 φ-Dr In Fig 11 the correlations of qc(MCPT) with the
loading and reloading elastic modulus (EPLT(i) and
EPLT(R2)) are presented for the data obtained in this
study (also see equations 10 and 11) It can be seen
from the figures that the best-fitted relations are
represented by linear regression curves The results
of regression equations and the determination
coefficients are summarized in Table 4
EPLT(i)=1457(qc(MCPT))+607 R 2=092 (10)
EPLT(R2)=12(qc(MCPT))+2 R 2=096 (11)
A strong logarithmic correlation was also found
between f s(MCPT) and loading and reloading elastic
modulus (EPLT(i) and EPLT(R2)) with the determination
coefficients of 091 and 097 respectively (Fig 12)
EPLT(i)=556 Ln (f s(MCPT))-12 R 2=091 (12)
EPLT(R2)=46 Ln(f s(MCPT))-13 R 2=097 (13)
(b)
a
8132019 Mcpt Teheran analisis de macizos rocosos en la ingenieria practica
httpslidepdfcomreaderfullmcpt-teheran-analisis-de-macizos-rocosos-en-la-ingenieria-practica 812
72 Nikudel et al JGeope 2 (2) 2012
Figure 11 Correlation between a) EPLT(i) and b) EPLT(R2) with
qc(MCPT)
Figure 12 Correlation between a) EPLT(i) and b) EPLT(R2) with f s
The correlations established in this study were
compared with the equations obtained by different
researchers Schmertmann et al (1986) gave a
simple linear correlation for siltyclayey sands as
followsE=7qc (14)
Trofimenkov (1974) also suggested the following
correlations for the elasticity modulus in sand and
clay
E=3qc (for sand) (15)E=7qc (for clay) (16)
These researchers established linear equations
between E and qc while in this study logarithmic
equations between them were obtained
Mini-CPT parameters versus shear modulus (G)
Several methods are available to evaluate the shear
modulus of coarse-grained and fine grained soils
they include geophysical methods Plate Load Test
(PLT) etc which are all costly
In the present research correlations between theshear modulus (GPLT(i)) and miniature cone and
resistance parameters (qc(MCPT) and f s(MCPT)) were
investigated The best correlation between the shear
modulus (G) with qc(MCPT) and f s(MCPT)) is presented
in Fig 13 and also equations (17) and (18)
respectively
GPLT(i)=137(qc(MCPT))097
R 2=092 (17)
GPLT(i)=01(f s(MCPT))0869
R 2=094 (18)
Figure 13 Correlation between a) qc(MCPT) and b) f s(MCPT) with
G
It can be seen from equations (17) and (18) that the
best-fitted relations are represented by power
regression curves The determination coefficientwas obtained between GPLT(i) and qc(MCPT) and f s(MCPT)
is 092 and 094 respectively
(b)
(a)
(b)
(a)
(b)
(a)
8132019 Mcpt Teheran analisis de macizos rocosos en la ingenieria practica
httpslidepdfcomreaderfullmcpt-teheran-analisis-de-macizos-rocosos-en-la-ingenieria-practica 912
Using Miniature Cone Penetration Test (Mini-CPT) to determine engineering hellip 73
Figure 14 Correlation between k s with a) qc(MCPT) and b)
f s(MCPT)
Mini-CPT parameters versus subgrade reaction
modulus (K s )
The best relationships between subgrade reaction
modulus and Mini-CPT parameters are presented in
Fig (14) and also equations (19) and (20)
K s=25(qc(MCPT))0817
R 2
=092 (19)
Where K s is the subgrade reaction modulus and
qc(MCPT) is the tip resistance
As can be seen from equation (20) there is a power
relationship between K s and qc(MCPT) with a
determination coefficient of 092
A logarithmic relationship was observed between
K s and friction resistance (f s(MCPT)) with a lower
determination coefficient (R 2=090) than that of K s
and qc(MCPT)
K s=57Ln(f s(MCPT))-169 R 2=090 (20)
Comparison of the determination correlations in
equations (19) and (20) shows that qc(MCPT) is better
than f s(MCPT) for estimating K s (because of higher
determination coefficient)
Conclusions
In soil exploration an approach is offered by cone
penetration testing (CPT) Mini-CPT is one of the
newest types of CPT which is less in diameter than
the conventional test equipments The most
important advantages of miniature penetrometer
are 1- smaller downward thrust needed to advance
the penetrometer into the soil 2- ability to identify
very thin layers and 3- installation in a smaller
vehicle that provides greater mobility and site
accessibility In this research the ability of Mini-CPT to determine some engineering properties of
sandy soil was investigated Due to the lack of
convenient field conditions all tests were done in
laboratory conditions and also a Mini-CPT
apparatus was developed By having the tip and
friction resistance and carrying out some tests such
as PLT and direct shear test to determine soil
deformability parameters and friction angle the
best correlations between them were obtained
Final results are shown in the form of empirical
correlations with high value of determinationcoefficient (Table 4) The use of qc(MCPT) and
f s(MCPT) to the determine properties of sandy soils
in most instances gives the same value of R 2
except for the case of Dr Therefore it is highly
recommended to use qc(MCPT) than f s(MCPT) to
determine relative density (for its higher value of
R 2)
Acknowledgment
The authors greatly appreciate the Engineering
Geology Laboratory of Tarbiat Modares University
for the fund provided for the present investigation
References
Abu-farsakh M Khalid Alshibi PE Nazzal M Seyman E 2004 Assessment of in-situ test technology
for construction control of base courses and embankments Report No FHWALA04385 Louisiana
Transportation Research Center
Amini F 2003 Potential applications of dynamic and static cone penetrometers in MDOT pavement design
and construction Report No FHWAMS-DOT-RD-03-162 Jackson State University Jackson Miss 31
pp
American Society of Testing and Materials 2000 Standard test method for direct shear test of under drained
conditions (D3080-98) Annual Book of ASTM Standards 0408 pp 894 ndash 904
(b)
(a)
8132019 Mcpt Teheran analisis de macizos rocosos en la ingenieria practica
httpslidepdfcomreaderfullmcpt-teheran-analisis-de-macizos-rocosos-en-la-ingenieria-practica 1012
74 Nikudel et al JGeope 2 (2) 2012
American Society of Testing and Materials 2003 Standard test method for performing electronic friction
cone and piezocone penetration testing of soils (D5778-95) Annual Book of ASTM Standards 0408 19
pp
American Society of Testing and Materials 1998 Standard test method for repetitive static plate load tests ofsoils and flexible pavement components for use in evaluation and design of airport and highway
pavements (D1195-93) Annual Book of ASTM Standards 0408 pp 110 ndash 113
American Society of Testing and Materials 2004 Standard method of deep quasi-static cone and friction-
cone penetration tests of Soil (D3441) ASTM International West Conshohocken PA 7 pp
Baldi G Bellotti R Ghionna V Jamiolkowski M Pasqualini E 1982 Design Parameters for Sands
from CPT Proceedings Second of European Symposium On Penetration Testing A A Blakema
Rotterdam the Netherlands 2 425- 432
Baligh MM Azzouz AS Wissa AZE Martin RT Morrison MJ 1981 The piezocone penetrometer
cone penetration testing and experience Proc ASCE National Convention St Louis Mo pp 247 ndash 263
Begemann H K S 1965 The friction jacket cone as an aid in determining the soil profile Proceedings 6th
ICSMFE Montreal Quebec Canada 117-20
Bowles JE 1997 Foundation analysis and design McGraw-Hill International Editions 1207 pp Briaud J L Miran J 1992 The cone penetrometer test Report FHWA-SA-91-043 Federal Highway
Administration Washington DC 161 pp
Coduto D P 2001 Foundation design principal and practices Prentice Hall New Jersey 883 pp
Jamiolkowski M Ghionna V N Lancellotto R Pasqualini E 1988 New correlations of penetration tests
for design practice Penetration Testing 1988 ISOPT-1 J DeRuiter ed 1 263-296 Available from A A
Balkema Publishers Old Post Road Brookfield VT 05036
Juang C H Huang X H Holtz R D Chen J W 1996 Determining relative density of sands from CPT
using fuzzy sets Journal of Geotechnical Engineering 1221-6
Meigh AC 1987 Cone penetration testing-methods and interpretation CIRIA Ground Engineering Report
In-situ testing Construction Industries Research and Information Association London 141 pp
Meyerhof GG 1959 Compaction of sands and the bearing capacity of piles Journal of GeotechnicalEngineering 85 1 ndash 29
Puppala A J Acar Y B Tumay M T 1995 Cone penetration in very weakly cemented sand Journal of
Geotechnical Engineering 121 589-600
Robertson P K Campanella R G 1983 Interpretation of cone penetration tests Part I Sand Canadian
Geotechnical Journal 20 718-733
Schmertmann J H Baer w Gupta R Kessler K 1986 CPTDMT quality control of ground
modification Proceeding Use of In-Situ Tests in Geotechnical Engineering ASCE Special Publication
No 6 Blacksburg Virginia pp 985-1135
Schmertmann J H 1978 Guidelines for Cone Penetration Test Performance and Design Report FHWA-
TS-78-209 96 Federal Highway Administration Washington DC 146 pp
Timoshenko S P Goodier JN 1970 Theory of elasticity Mc Graw-Hill Book Company New York 591
pp
TRBNA (Transportation Research Board of the National Academies) 2007 Cone penetration testing
Synthesis 368 Georgia Available in httponlinepubstrborgOnlinepubsnchrpnchrp_syn_368pdf
Trofimenkov J G 1974 General Reports Eastern Europe Proceedings European Symposium of
Penetration Testing Stockholm Sweden 21 24-39
Tufenkjian MR Thompson DJ 2005 Shallow penetration resistance of a minicone in sand Proceedings
of the 16th International Conference on Soil Mechanics and Geotechnical Engineering Osaka Japan 89
pp
Tumay MT Kurup PU BoggessRL 1998 A continuous intrusion electronic miniature CPT
Geotechnical Site Characterization Balkema Rotterdam The Netherlands 2 1183 ndash 1188
US Army Corps of Engineers 1992 Engineering and design Bearing capacity of soils Available in
httpwwwusacearmymilpublicationseng-manualsem1110-1-1905basdocpdf
8132019 Mcpt Teheran analisis de macizos rocosos en la ingenieria practica
httpslidepdfcomreaderfullmcpt-teheran-analisis-de-macizos-rocosos-en-la-ingenieria-practica 1112
Using Miniature Cone Penetration Test (Mini-CPT) to determine engineering hellip 75 Villet W C Mitchell J K 1981 Cone resistance relative density and Friction angle Proc Session on
Cone Penetration Testing and Experience ASCE National Convention G N Norris and R D Holtz eds
ASCE New York NY pp 178-208
Vlasblom A 1985 The electrical penetrometer A historical account of its development LGMMededelingen Report No 92 Delft Soil Mechanics Laboratory The Netherlands 51 pp
8132019 Mcpt Teheran analisis de macizos rocosos en la ingenieria practica
httpslidepdfcomreaderfullmcpt-teheran-analisis-de-macizos-rocosos-en-la-ingenieria-practica 1212
76 Nikudel et al JGeope 2 (2) 2012
Appendix 1
The static load plate test is evaluated by assuming that the assessed subsoil can be characterized by a linear elastic
homogeneous isotropic half-space From the settlements of the rigid circular plate which is loaded by a concentrated
force P the Youngrsquos modulus E can be determined according to the theory of elasticity
E=(1- υ2)P2rs
Where υ is Poissonrsquos ratio of the subsoil and r denotes the radius of the plate Assuming that the pressure p below the
load plate is uniformly distributed we have
p=Pr 2π
Assuming further that the Poissonrsquos ratio is constant for all soils with υ = 0212 the so-called deformation modulus E can
be readily defined as
Ev=15rΔpΔs
In the above expression pressure p and settlement s are replaced in this equation by their increments Δp and Δs since the
soil behavior is nonlinear
8132019 Mcpt Teheran analisis de macizos rocosos en la ingenieria practica
httpslidepdfcomreaderfullmcpt-teheran-analisis-de-macizos-rocosos-en-la-ingenieria-practica 212
66 Nikudel et al JGeope 2 (2) 2012
The combination of the electric cone with the
electric piezoprob was an inevitable design as the
hybrid piezocone penetrometer could be used to
obtain three independent readings during the samesounding tip stress sleeve friction and pore-water
pressures (Baligh et al 1981) Mini-CPT is a new
type of CPT with a projected cone area of 2 cm2
which gives finer details than the standard 10 cm2
cross-section area reference cone penetrometer
Continuous Intrusion Miniature Cone Penetration
Test (CIMCPT) may be used for rapid accurate
and economical characterization of sites and to
determine the engineering parameters of soil which
are needed in the design of pavements
embankments and earth structures The maximum
depth of penetration that can be achieved by theCIMCPT system is 12 m (Tumay et al 1998)
The main objective of this paper is to describe the
capability of the Mini-CPT to study the engineering
properties of sandy soils We used a penetrometer
with a diameter of 16 cm (projected area of 2 cm2)
in laboratory conditions In addition several testessuch as Plate Load Test (PLT) and direct shear test
were conducted to determine the deformability and
strength characterizations of soil sample
Geotechnical characteristics of the tested soils
In order to achieve the appropriate correlation
between the Mini-CPT results and the engineering
properties of sandy soils it was necessary to select
suitable samples The appropriate sampling area
was selected based on our previous experiences
and the sampling was performed according to the
standard methods The sampling area contains fourtypes of lithology belonging to late Eocene and
Quaternary deposits (Fig 1)
Figure 1 Geological map of the sampling location
The late Eocene rock covers almost 5 of the land
surface and comprises one type of lithology which
is categorized as Trachyte to Trachyandesite The
Quaternary deposits and Sedimentary rocks cover
almost 95 of the sampling area and comprise
three types of lithology which are categorized asconglomerate old terrace deposits and young
terrace deposits In the present research the
sampling was performed on the young terrace
deposits Geologically the young deposits
comprise sub-rounded sand grains containing 5
gravel The X-ray analysis has showed that the
sandy samples are made of quartz feldspar pyroxene and calcite
8132019 Mcpt Teheran analisis de macizos rocosos en la ingenieria practica
httpslidepdfcomreaderfullmcpt-teheran-analisis-de-macizos-rocosos-en-la-ingenieria-practica 312
Using Miniature Cone Penetration Test (Mini-CPT) to determine engineering hellip 67 To prepare the testing samples alluvial deposits
were oven-dried and passed through sieve No 4
Fig 2 shows the gradation curve of the sample after
passing sieve No 4 which is classified as poorlygraded sand (SP) according to the Unified Soil
Classification System (USCS) The index
properties of the soil are shown in Table 1 To
obtain a uniform compaction the sample in the
testing mould was compacted in several 100 mm
thick layers The compaction effort for dry soil was
applied using a 300 mm vibrating plate in a way
that the required density was achieved The in-
place density for each soil layer was controlled
using the sand cone method For the sand cone
method the hole from which the soil sample was
removed was filled with dry sand from a graduated bottle The sand has a uniform known density so
its dry weight volume is then known (see Fig 3)
Details of the tests on the samples with different
densities are shown in Table 2
Table 1 The index properties of used soilValueParameter
097emax(-)
046emin(-) 266Gs(-) 1785γd(max)(KNm3)
1324γd(min)(KNm3) 116Cu(-)
1Cc(-) 0Value of clay () 2Value of silt ()
spUSCS soil classification
Figure 2 Gradation curve of the used soil
Figure 3 Schematic diagram of sand cone method
Testing procedure
Several tests including Mini-CPT plate load and
direct shear were carried out to determine the
engineering properties of sandy soils Details of the
tests on the samples with different densities are
indicated in Table 2
Mini-CPT testIn this research Mini-CPTs were carried out to the
depth of approximately 1m in an especial designed
circular mould Two miniature cone penetrometers
with a projected cone area of 2 cm2 friction sleeve
area of 43 cm2 and a cone apex angle of 60deg were
used (Fig 4) They both were of the subtraction
type that measures either the cone resistance or
combined cone resistance plus local sleeve friction
resistance In the latter state combined cone
resistance plus the local sleeve friction resistance
must be subtracted from the local sleeve frictionresistance The ASTM-D3441 (2004) standard
method was followed to perform the tests Mini-
CPTs were done on the samples with different
relative densities (25 35 50 60 and 75)
and repeated three times The results for mean
qc(MCPT) and f s(MCPT) are shown in Fig 5a b
respectively Tip resistance (qc(MCPT)) and friction
resistance (f s(MCPT)) are shown in MPa and kPa
respectively It is to be noted that the presented
results for qc(MCPT) and f s(MCPT) are the average of
resistances in different depths The results of these
determinations are given in Table 3
8132019 Mcpt Teheran analisis de macizos rocosos en la ingenieria practica
httpslidepdfcomreaderfullmcpt-teheran-analisis-de-macizos-rocosos-en-la-ingenieria-practica 412
68 Nikudel et al JGeope 2 (2) 2012
Table 2 Testing program for the laboratory investigations and different densities for the tested soilDirect shear
(number of tests) PLT (number
of tests) Mini-CPT (number of
tests for f s and qc) Dry unit weight
(grcm3) Mean of water
content () Dr () 3 3 6 144 04 25 3
3
6
148
04
35
3 3 6 155 04 50 3 3 6 160 04 60 3 3 6 167 04 75
Table 3 Summary of all the results
Dr φ (Deg) qc(MCPT) (MPa) f s(MCPT) (kPa) EPLT(i) (MPa) EPLT(R2) (MPa) GPLT(i) (MPa) k s (MNm3)
25
1 295 1023 3196 6 25 15 26
2 32 1052 3627 75 29 19 27
3 33 1062 4073 8 38 22 28
35
1 32 2740 4262 93 41 25 46
2 341 2905 6313 95 5 26 48
3 342 3308 7190 10 55 3 49
50
1 355 3712 6325 13 6 43 100
2 37 4325 6650 15 85 5 100
3 39 4295 11103 15 9 52 125
60
1 39 6512 15758 155 105 95 120
2 39 8058 18592 155 11 10 120
3 395 8145 21493 16 115 11 130
75
1 41 10187 42746 20 142 145 162
2 42 10537 49290 225 15 18 178
3 435 12200 49965 249 158 19 200
Figure 4 Miniature cone pentrometers
Plate Load Test (PLT)Plate Load Test (PLT) is a common site
investigation tool which has been used for proof
testing of pavement layers in the European
countries for many years Currently it is also for
evaluation of both rigid and flexible pavements
(Abu-Farsakh et al 2004) The PLT in full or
small scale is sometimes considered as the best
means of determining the deformation
characteristics of the soils however it is only used
in exceptional cases due to the costs involved
(Bowles 1997) In the present research a round
plate with 230 mm diameter was used PLT was
used as a reference test to obtain the strength
parameters of the soil under investigation A
loading frame was designed to fit the mould and its
support To perform the test the bearing plate and
the hydraulic jack were carefully placed at thecenter of the sample under the loading frame (Fig
6) The hydraulic jack and the supporting frame
were able to apply a 60 ton load For measurement
of deformations dial gauges that are capable of
recording a maximum deformation of 254 mm (1
in) with an accuracy of 0001 in were used The
ASTM-D 1195-93 (1998) standard method was
followed to perform the test
Elasticity modulus is always considered as an
important deformability parameter for
geomaterials Based on stress-strain curve differentelasticity modulus can be defined as 1) the initial
tangent modulus 2) the tangent modulus at a given
stress level 3) reloading and unloading modulus
and 4) the secant modulus at a given stress level In
this study since the stress ndash strain curves had a clear
peak the initial tangent modulus was determined
for all PLT results To determine the initial
modulus (EPLT(i)) a line was drawn tangent to the
initial segment of the stress ndash strain curve Then an
arbitrary point was chosen on the line and the
stress and deflection corresponding to this point
were determined for calculating of the initialmodulus Fig 7 describes the settlement and stress
8132019 Mcpt Teheran analisis de macizos rocosos en la ingenieria practica
httpslidepdfcomreaderfullmcpt-teheran-analisis-de-macizos-rocosos-en-la-ingenieria-practica 512
Using Miniature Cone Penetration Test (Mini-CPT) to determine engineering hellip 69 used for determining EPLT(i) (Abu-farsakh et al
2004) A reloading stiffness modulus called
EPLT(R2) was also determined for each stress ndash strain
curve
Figure 5 a) Miniature cone tip resistance (qc(MCPT)) b)
Miniature cone friction resistance (f s(MCPT)) profiles in the sands
with different relative densities
Figure 6 A schematic diagram of plate load test (PLT) set up
(a) side view and (b) plan view
The second parameter which can be calculated
from the PLT results is shear modulus (G) Shear
modulus is defined as the ratio of shear stress to
shear strain (Bowles 1997) and is calculated fromequation (1) (Timoshenko amp Goodier 1970)
)1(8
qDG PLT
(1)
Where q is the bearing pressure D is the diameter
of the loading plate ρ is the settlement and υ is the
Poisson ratio
From the theory of elasticity the relationship
between the modulus of elasticity and the shear
modulus can be given as below
E=2(1+υ)G (2)
Since the non-rigid methods consider the effect of
local mat deformations on the distribution of
bearing pressure it is needed to define the
relationship between settlement and bearing
pressure This is usually done using the coefficient
of subgrade reaction (K s) Equation (3) is used to
determine K s from the PLT results (Coduto 2001)
k s= ΔPΔS (3)
Where K s is the modulus of subgrade reaction ΔP
is the applied pressure and ΔS is the measuredsettlement The results of these determinations are
given in Table 3
Figure 7 Definition of modulus from PLT (Abu-farsakh et al
2004) Direct shear test
In order to determine the soil friction angle (φ) 15
direct shear tests were carried out in a circular
shear mould according to ASTM-D 308-90 (2000)
(see Table 2) To prepare the soil samples fordirect shear test a circular shear box having 60
8132019 Mcpt Teheran analisis de macizos rocosos en la ingenieria practica
httpslidepdfcomreaderfullmcpt-teheran-analisis-de-macizos-rocosos-en-la-ingenieria-practica 612
70 Nikudel et al JGeope 2 (2) 2012
mm internal diameter and 25 mm height was used
To achieve a uniform compaction in the circular
shear mould of the direct shear machine tamping
by a small circular steel plate with 60 mm diameterwas used
Due to the nature of the soil samples (non-
cohesive) cohesion parameter (C) was equal to
zero and thus friction angles were calculated To
eliminate the effect of pore pressure all direct
shear tests were carried out in dry conditions The
results of direct shear tests are given in Table 3
Results and discussion
One of the most commonly accepted methods of
investigating empirical relationships between soil
properties is simple regression analysis In thisstudy the results of all tests were assessed to find
the best correlation between Mini-CPT strength
parameters (qc(MCPT) and f s(MCPT)) and the index
properties of the soil samples ie Relative Density
(Dr ) Friction Angle (φ) Elastic Modulus (E) Shear
Modulus (G) and Subgrade Reaction Modulus (K s)
The linear and non-linear simple regressions were
undertaken with 95 confidence level and the
determination coefficient (R 2) was obtained for the
relationships The authors attempted to develop the
best correlation between different variables in orderto attain the most reliable empirical equation
Mini-CPT parameters versus relative density (Dr )
Relative density is a useful parameter to describe
the consistency of sands CPT can be used to
estimate both the relative density of cohesionless
soil and the undrained strength of cohesive soils
through empirical correlations (USACE 1992)
Several investigators including Schmertmann
(1978) Villet amp Mitchell (1981) Baldi et al
(1982) Robertson amp Campanella (1983)
Jamiolkowski et al (1988) Puppala et al (1995)
and Juang et al (1996) have developed
correlations for the relative density (Dr ) as a
function of qc for sandy soils These relationships
are also functions of vertical effective stress
(Amini 2003)
In this study the correlation of Dr with qc(MCPT) and
f s(MCPT) was investigated (Fig 8) show the
relationships of Dr with qc(MCPT) and f s(MCPT) for the
tested samples respectively A very high
correlation with the determination coefficient 096
was found between Dr and qc(MCPT)Dr ()=23733 (qc(MCPT))
0469 R 2=096 (4)
Similarly a power relationship was observed
between Dr and f s(MCPT) with a high determination
coefficient 084
Dr ()=7408 (f s(MCPT))
0389
R
2
=085 (5)
Figure 8 Correlation between a) qc(MCPT) and b) f s(MCPT) with Dr
According to these results for estimation of Dr
using qc(MCPT) is more reliable than f s(MCPT) because
of higher determination coefficient The application
range of the equations obtained in this study is
1023-122 MPa for qc(MCPT) and 3196-49965 kPa
for f s(MCPT
Mini-CPT parameters versus friction angle (φ)
Friction angle is one of the most important index
parameters needed for calculation of shear strength
in any foundation design
(Fig 9) depict that good correlations were found
between friction angle (φ) and qc(MCPT) and f s(MCPT)
with determination correlations of 087 and 089
respectively
φ=305(qc(MCPT))0127
R 2=087 (6)
φ=215(f s(MCPT))0113 R 2=089 (7)
As can be seen from these Figs also equations (6)
and (7) in each case the best fit relation is
represented by power regression curves Anincrease in friction angle was recorded following an
8132019 Mcpt Teheran analisis de macizos rocosos en la ingenieria practica
httpslidepdfcomreaderfullmcpt-teheran-analisis-de-macizos-rocosos-en-la-ingenieria-practica 712
Using Miniature Cone Penetration Test (Mini-CPT) to determine engineering hellip 71 increase in both qc(MCPT) and f s(MCPT)
The correlation between friction angle (φ) and
relative density (Dr ) for the results obtained in this
research is presented in Fig 10 and equation (8)φ = 021(Dr )+26 R 2=092 (8)
Figure 9 Correlation between a) qc(MCPT) and b) f s(MCPT) with φ
Figure 10 Correlation between Dr and φ
There is a linear relationship between friction angle
(φ) and relative density (Dr ) with a high
determination coefficient (092)
Similar relationships have been obtained between
friction angle (φ) and relative density (Dr ) by
different authors such as Meyerhof (1959) He has
suggested equation (9) for normally consolidated
sands
=φ 015(Dr ) (9)
Mini-CPT parameters versus elastic modulus (E)
The cone penetration resistance has been correlated
with the equivalent elastic modulus of soils by
various investigators (Trofimenkov 1974
Schmertmann et al 1986)
Table 4 Summary of the equations developed in this paperDetermination
coefficient (R 2) Type correlation Equations Parameters (R 2=096) powerDr ()=23733 (qc(MCPT))
0469 Dr -qc(MCPT) (R 2=085) power Dr ()=7408 (f s(MCPT))
0389 Dr ()-f s(MCPT) (R 2=092) linear EPLT(i)=1457(qc(MCPT))+607 EPLT(i)-qc(MCPT) (R 2=096) linear EPLT(R2)=12(qc(MCPT))+2 EPLT(R2)-qc(MCPT) (R 2=097)logarithmic EPLT(R2)=46 Ln(f s(MCPT))-13 EPLT(R2)-f s(MCPT) (R 2=091) logarithmic EPLT(i)=556 Ln(f s(MCPT))-12 EPLT(i)-f s(MCPT) (R 2=092) power GPLT(i)=137(qc(MCPT))
097 GPLT(i)-qc(MCPT) (R 2=094) power GPLT(i)=01(f s(MCPT))
0869 GPLT(i)-f s(MCPT) (R 2=092) power k s=25(qc(MCPT))
0817 k s-qc(MCPT) (R 2=090) logarithmic k s=57Ln(f s(MCPT))-169k s-f s(MCPT) (R 2=087) power φ=305(qc(MCPT))
0127 φ-qc(MCPT) (R 2=089) power φ=215(f s(MCPT))
0113 φ-f s(MCPT)
(R 2=092) linear φ= 021(Dr )+26 φ-Dr In Fig 11 the correlations of qc(MCPT) with the
loading and reloading elastic modulus (EPLT(i) and
EPLT(R2)) are presented for the data obtained in this
study (also see equations 10 and 11) It can be seen
from the figures that the best-fitted relations are
represented by linear regression curves The results
of regression equations and the determination
coefficients are summarized in Table 4
EPLT(i)=1457(qc(MCPT))+607 R 2=092 (10)
EPLT(R2)=12(qc(MCPT))+2 R 2=096 (11)
A strong logarithmic correlation was also found
between f s(MCPT) and loading and reloading elastic
modulus (EPLT(i) and EPLT(R2)) with the determination
coefficients of 091 and 097 respectively (Fig 12)
EPLT(i)=556 Ln (f s(MCPT))-12 R 2=091 (12)
EPLT(R2)=46 Ln(f s(MCPT))-13 R 2=097 (13)
(b)
a
8132019 Mcpt Teheran analisis de macizos rocosos en la ingenieria practica
httpslidepdfcomreaderfullmcpt-teheran-analisis-de-macizos-rocosos-en-la-ingenieria-practica 812
72 Nikudel et al JGeope 2 (2) 2012
Figure 11 Correlation between a) EPLT(i) and b) EPLT(R2) with
qc(MCPT)
Figure 12 Correlation between a) EPLT(i) and b) EPLT(R2) with f s
The correlations established in this study were
compared with the equations obtained by different
researchers Schmertmann et al (1986) gave a
simple linear correlation for siltyclayey sands as
followsE=7qc (14)
Trofimenkov (1974) also suggested the following
correlations for the elasticity modulus in sand and
clay
E=3qc (for sand) (15)E=7qc (for clay) (16)
These researchers established linear equations
between E and qc while in this study logarithmic
equations between them were obtained
Mini-CPT parameters versus shear modulus (G)
Several methods are available to evaluate the shear
modulus of coarse-grained and fine grained soils
they include geophysical methods Plate Load Test
(PLT) etc which are all costly
In the present research correlations between theshear modulus (GPLT(i)) and miniature cone and
resistance parameters (qc(MCPT) and f s(MCPT)) were
investigated The best correlation between the shear
modulus (G) with qc(MCPT) and f s(MCPT)) is presented
in Fig 13 and also equations (17) and (18)
respectively
GPLT(i)=137(qc(MCPT))097
R 2=092 (17)
GPLT(i)=01(f s(MCPT))0869
R 2=094 (18)
Figure 13 Correlation between a) qc(MCPT) and b) f s(MCPT) with
G
It can be seen from equations (17) and (18) that the
best-fitted relations are represented by power
regression curves The determination coefficientwas obtained between GPLT(i) and qc(MCPT) and f s(MCPT)
is 092 and 094 respectively
(b)
(a)
(b)
(a)
(b)
(a)
8132019 Mcpt Teheran analisis de macizos rocosos en la ingenieria practica
httpslidepdfcomreaderfullmcpt-teheran-analisis-de-macizos-rocosos-en-la-ingenieria-practica 912
Using Miniature Cone Penetration Test (Mini-CPT) to determine engineering hellip 73
Figure 14 Correlation between k s with a) qc(MCPT) and b)
f s(MCPT)
Mini-CPT parameters versus subgrade reaction
modulus (K s )
The best relationships between subgrade reaction
modulus and Mini-CPT parameters are presented in
Fig (14) and also equations (19) and (20)
K s=25(qc(MCPT))0817
R 2
=092 (19)
Where K s is the subgrade reaction modulus and
qc(MCPT) is the tip resistance
As can be seen from equation (20) there is a power
relationship between K s and qc(MCPT) with a
determination coefficient of 092
A logarithmic relationship was observed between
K s and friction resistance (f s(MCPT)) with a lower
determination coefficient (R 2=090) than that of K s
and qc(MCPT)
K s=57Ln(f s(MCPT))-169 R 2=090 (20)
Comparison of the determination correlations in
equations (19) and (20) shows that qc(MCPT) is better
than f s(MCPT) for estimating K s (because of higher
determination coefficient)
Conclusions
In soil exploration an approach is offered by cone
penetration testing (CPT) Mini-CPT is one of the
newest types of CPT which is less in diameter than
the conventional test equipments The most
important advantages of miniature penetrometer
are 1- smaller downward thrust needed to advance
the penetrometer into the soil 2- ability to identify
very thin layers and 3- installation in a smaller
vehicle that provides greater mobility and site
accessibility In this research the ability of Mini-CPT to determine some engineering properties of
sandy soil was investigated Due to the lack of
convenient field conditions all tests were done in
laboratory conditions and also a Mini-CPT
apparatus was developed By having the tip and
friction resistance and carrying out some tests such
as PLT and direct shear test to determine soil
deformability parameters and friction angle the
best correlations between them were obtained
Final results are shown in the form of empirical
correlations with high value of determinationcoefficient (Table 4) The use of qc(MCPT) and
f s(MCPT) to the determine properties of sandy soils
in most instances gives the same value of R 2
except for the case of Dr Therefore it is highly
recommended to use qc(MCPT) than f s(MCPT) to
determine relative density (for its higher value of
R 2)
Acknowledgment
The authors greatly appreciate the Engineering
Geology Laboratory of Tarbiat Modares University
for the fund provided for the present investigation
References
Abu-farsakh M Khalid Alshibi PE Nazzal M Seyman E 2004 Assessment of in-situ test technology
for construction control of base courses and embankments Report No FHWALA04385 Louisiana
Transportation Research Center
Amini F 2003 Potential applications of dynamic and static cone penetrometers in MDOT pavement design
and construction Report No FHWAMS-DOT-RD-03-162 Jackson State University Jackson Miss 31
pp
American Society of Testing and Materials 2000 Standard test method for direct shear test of under drained
conditions (D3080-98) Annual Book of ASTM Standards 0408 pp 894 ndash 904
(b)
(a)
8132019 Mcpt Teheran analisis de macizos rocosos en la ingenieria practica
httpslidepdfcomreaderfullmcpt-teheran-analisis-de-macizos-rocosos-en-la-ingenieria-practica 1012
74 Nikudel et al JGeope 2 (2) 2012
American Society of Testing and Materials 2003 Standard test method for performing electronic friction
cone and piezocone penetration testing of soils (D5778-95) Annual Book of ASTM Standards 0408 19
pp
American Society of Testing and Materials 1998 Standard test method for repetitive static plate load tests ofsoils and flexible pavement components for use in evaluation and design of airport and highway
pavements (D1195-93) Annual Book of ASTM Standards 0408 pp 110 ndash 113
American Society of Testing and Materials 2004 Standard method of deep quasi-static cone and friction-
cone penetration tests of Soil (D3441) ASTM International West Conshohocken PA 7 pp
Baldi G Bellotti R Ghionna V Jamiolkowski M Pasqualini E 1982 Design Parameters for Sands
from CPT Proceedings Second of European Symposium On Penetration Testing A A Blakema
Rotterdam the Netherlands 2 425- 432
Baligh MM Azzouz AS Wissa AZE Martin RT Morrison MJ 1981 The piezocone penetrometer
cone penetration testing and experience Proc ASCE National Convention St Louis Mo pp 247 ndash 263
Begemann H K S 1965 The friction jacket cone as an aid in determining the soil profile Proceedings 6th
ICSMFE Montreal Quebec Canada 117-20
Bowles JE 1997 Foundation analysis and design McGraw-Hill International Editions 1207 pp Briaud J L Miran J 1992 The cone penetrometer test Report FHWA-SA-91-043 Federal Highway
Administration Washington DC 161 pp
Coduto D P 2001 Foundation design principal and practices Prentice Hall New Jersey 883 pp
Jamiolkowski M Ghionna V N Lancellotto R Pasqualini E 1988 New correlations of penetration tests
for design practice Penetration Testing 1988 ISOPT-1 J DeRuiter ed 1 263-296 Available from A A
Balkema Publishers Old Post Road Brookfield VT 05036
Juang C H Huang X H Holtz R D Chen J W 1996 Determining relative density of sands from CPT
using fuzzy sets Journal of Geotechnical Engineering 1221-6
Meigh AC 1987 Cone penetration testing-methods and interpretation CIRIA Ground Engineering Report
In-situ testing Construction Industries Research and Information Association London 141 pp
Meyerhof GG 1959 Compaction of sands and the bearing capacity of piles Journal of GeotechnicalEngineering 85 1 ndash 29
Puppala A J Acar Y B Tumay M T 1995 Cone penetration in very weakly cemented sand Journal of
Geotechnical Engineering 121 589-600
Robertson P K Campanella R G 1983 Interpretation of cone penetration tests Part I Sand Canadian
Geotechnical Journal 20 718-733
Schmertmann J H Baer w Gupta R Kessler K 1986 CPTDMT quality control of ground
modification Proceeding Use of In-Situ Tests in Geotechnical Engineering ASCE Special Publication
No 6 Blacksburg Virginia pp 985-1135
Schmertmann J H 1978 Guidelines for Cone Penetration Test Performance and Design Report FHWA-
TS-78-209 96 Federal Highway Administration Washington DC 146 pp
Timoshenko S P Goodier JN 1970 Theory of elasticity Mc Graw-Hill Book Company New York 591
pp
TRBNA (Transportation Research Board of the National Academies) 2007 Cone penetration testing
Synthesis 368 Georgia Available in httponlinepubstrborgOnlinepubsnchrpnchrp_syn_368pdf
Trofimenkov J G 1974 General Reports Eastern Europe Proceedings European Symposium of
Penetration Testing Stockholm Sweden 21 24-39
Tufenkjian MR Thompson DJ 2005 Shallow penetration resistance of a minicone in sand Proceedings
of the 16th International Conference on Soil Mechanics and Geotechnical Engineering Osaka Japan 89
pp
Tumay MT Kurup PU BoggessRL 1998 A continuous intrusion electronic miniature CPT
Geotechnical Site Characterization Balkema Rotterdam The Netherlands 2 1183 ndash 1188
US Army Corps of Engineers 1992 Engineering and design Bearing capacity of soils Available in
httpwwwusacearmymilpublicationseng-manualsem1110-1-1905basdocpdf
8132019 Mcpt Teheran analisis de macizos rocosos en la ingenieria practica
httpslidepdfcomreaderfullmcpt-teheran-analisis-de-macizos-rocosos-en-la-ingenieria-practica 1112
Using Miniature Cone Penetration Test (Mini-CPT) to determine engineering hellip 75 Villet W C Mitchell J K 1981 Cone resistance relative density and Friction angle Proc Session on
Cone Penetration Testing and Experience ASCE National Convention G N Norris and R D Holtz eds
ASCE New York NY pp 178-208
Vlasblom A 1985 The electrical penetrometer A historical account of its development LGMMededelingen Report No 92 Delft Soil Mechanics Laboratory The Netherlands 51 pp
8132019 Mcpt Teheran analisis de macizos rocosos en la ingenieria practica
httpslidepdfcomreaderfullmcpt-teheran-analisis-de-macizos-rocosos-en-la-ingenieria-practica 1212
76 Nikudel et al JGeope 2 (2) 2012
Appendix 1
The static load plate test is evaluated by assuming that the assessed subsoil can be characterized by a linear elastic
homogeneous isotropic half-space From the settlements of the rigid circular plate which is loaded by a concentrated
force P the Youngrsquos modulus E can be determined according to the theory of elasticity
E=(1- υ2)P2rs
Where υ is Poissonrsquos ratio of the subsoil and r denotes the radius of the plate Assuming that the pressure p below the
load plate is uniformly distributed we have
p=Pr 2π
Assuming further that the Poissonrsquos ratio is constant for all soils with υ = 0212 the so-called deformation modulus E can
be readily defined as
Ev=15rΔpΔs
In the above expression pressure p and settlement s are replaced in this equation by their increments Δp and Δs since the
soil behavior is nonlinear

8132019 Mcpt Teheran analisis de macizos rocosos en la ingenieria practica
httpslidepdfcomreaderfullmcpt-teheran-analisis-de-macizos-rocosos-en-la-ingenieria-practica 312
Using Miniature Cone Penetration Test (Mini-CPT) to determine engineering hellip 67 To prepare the testing samples alluvial deposits
were oven-dried and passed through sieve No 4
Fig 2 shows the gradation curve of the sample after
passing sieve No 4 which is classified as poorlygraded sand (SP) according to the Unified Soil
Classification System (USCS) The index
properties of the soil are shown in Table 1 To
obtain a uniform compaction the sample in the
testing mould was compacted in several 100 mm
thick layers The compaction effort for dry soil was
applied using a 300 mm vibrating plate in a way
that the required density was achieved The in-
place density for each soil layer was controlled
using the sand cone method For the sand cone
method the hole from which the soil sample was
removed was filled with dry sand from a graduated bottle The sand has a uniform known density so
its dry weight volume is then known (see Fig 3)
Details of the tests on the samples with different
densities are shown in Table 2
Table 1 The index properties of used soilValueParameter
097emax(-)
046emin(-) 266Gs(-) 1785γd(max)(KNm3)
1324γd(min)(KNm3) 116Cu(-)
1Cc(-) 0Value of clay () 2Value of silt ()
spUSCS soil classification
Figure 2 Gradation curve of the used soil
Figure 3 Schematic diagram of sand cone method
Testing procedure
Several tests including Mini-CPT plate load and
direct shear were carried out to determine the
engineering properties of sandy soils Details of the
tests on the samples with different densities are
indicated in Table 2
Mini-CPT testIn this research Mini-CPTs were carried out to the
depth of approximately 1m in an especial designed
circular mould Two miniature cone penetrometers
with a projected cone area of 2 cm2 friction sleeve
area of 43 cm2 and a cone apex angle of 60deg were
used (Fig 4) They both were of the subtraction
type that measures either the cone resistance or
combined cone resistance plus local sleeve friction
resistance In the latter state combined cone
resistance plus the local sleeve friction resistance
must be subtracted from the local sleeve frictionresistance The ASTM-D3441 (2004) standard
method was followed to perform the tests Mini-
CPTs were done on the samples with different
relative densities (25 35 50 60 and 75)
and repeated three times The results for mean
qc(MCPT) and f s(MCPT) are shown in Fig 5a b
respectively Tip resistance (qc(MCPT)) and friction
resistance (f s(MCPT)) are shown in MPa and kPa
respectively It is to be noted that the presented
results for qc(MCPT) and f s(MCPT) are the average of
resistances in different depths The results of these
determinations are given in Table 3
8132019 Mcpt Teheran analisis de macizos rocosos en la ingenieria practica
httpslidepdfcomreaderfullmcpt-teheran-analisis-de-macizos-rocosos-en-la-ingenieria-practica 412
68 Nikudel et al JGeope 2 (2) 2012
Table 2 Testing program for the laboratory investigations and different densities for the tested soilDirect shear
(number of tests) PLT (number
of tests) Mini-CPT (number of
tests for f s and qc) Dry unit weight
(grcm3) Mean of water
content () Dr () 3 3 6 144 04 25 3
3
6
148
04
35
3 3 6 155 04 50 3 3 6 160 04 60 3 3 6 167 04 75
Table 3 Summary of all the results
Dr φ (Deg) qc(MCPT) (MPa) f s(MCPT) (kPa) EPLT(i) (MPa) EPLT(R2) (MPa) GPLT(i) (MPa) k s (MNm3)
25
1 295 1023 3196 6 25 15 26
2 32 1052 3627 75 29 19 27
3 33 1062 4073 8 38 22 28
35
1 32 2740 4262 93 41 25 46
2 341 2905 6313 95 5 26 48
3 342 3308 7190 10 55 3 49
50
1 355 3712 6325 13 6 43 100
2 37 4325 6650 15 85 5 100
3 39 4295 11103 15 9 52 125
60
1 39 6512 15758 155 105 95 120
2 39 8058 18592 155 11 10 120
3 395 8145 21493 16 115 11 130
75
1 41 10187 42746 20 142 145 162
2 42 10537 49290 225 15 18 178
3 435 12200 49965 249 158 19 200
Figure 4 Miniature cone pentrometers
Plate Load Test (PLT)Plate Load Test (PLT) is a common site
investigation tool which has been used for proof
testing of pavement layers in the European
countries for many years Currently it is also for
evaluation of both rigid and flexible pavements
(Abu-Farsakh et al 2004) The PLT in full or
small scale is sometimes considered as the best
means of determining the deformation
characteristics of the soils however it is only used
in exceptional cases due to the costs involved
(Bowles 1997) In the present research a round
plate with 230 mm diameter was used PLT was
used as a reference test to obtain the strength
parameters of the soil under investigation A
loading frame was designed to fit the mould and its
support To perform the test the bearing plate and
the hydraulic jack were carefully placed at thecenter of the sample under the loading frame (Fig
6) The hydraulic jack and the supporting frame
were able to apply a 60 ton load For measurement
of deformations dial gauges that are capable of
recording a maximum deformation of 254 mm (1
in) with an accuracy of 0001 in were used The
ASTM-D 1195-93 (1998) standard method was
followed to perform the test
Elasticity modulus is always considered as an
important deformability parameter for
geomaterials Based on stress-strain curve differentelasticity modulus can be defined as 1) the initial
tangent modulus 2) the tangent modulus at a given
stress level 3) reloading and unloading modulus
and 4) the secant modulus at a given stress level In
this study since the stress ndash strain curves had a clear
peak the initial tangent modulus was determined
for all PLT results To determine the initial
modulus (EPLT(i)) a line was drawn tangent to the
initial segment of the stress ndash strain curve Then an
arbitrary point was chosen on the line and the
stress and deflection corresponding to this point
were determined for calculating of the initialmodulus Fig 7 describes the settlement and stress
8132019 Mcpt Teheran analisis de macizos rocosos en la ingenieria practica
httpslidepdfcomreaderfullmcpt-teheran-analisis-de-macizos-rocosos-en-la-ingenieria-practica 512
Using Miniature Cone Penetration Test (Mini-CPT) to determine engineering hellip 69 used for determining EPLT(i) (Abu-farsakh et al
2004) A reloading stiffness modulus called
EPLT(R2) was also determined for each stress ndash strain
curve
Figure 5 a) Miniature cone tip resistance (qc(MCPT)) b)
Miniature cone friction resistance (f s(MCPT)) profiles in the sands
with different relative densities
Figure 6 A schematic diagram of plate load test (PLT) set up
(a) side view and (b) plan view
The second parameter which can be calculated
from the PLT results is shear modulus (G) Shear
modulus is defined as the ratio of shear stress to
shear strain (Bowles 1997) and is calculated fromequation (1) (Timoshenko amp Goodier 1970)
)1(8
qDG PLT
(1)
Where q is the bearing pressure D is the diameter
of the loading plate ρ is the settlement and υ is the
Poisson ratio
From the theory of elasticity the relationship
between the modulus of elasticity and the shear
modulus can be given as below
E=2(1+υ)G (2)
Since the non-rigid methods consider the effect of
local mat deformations on the distribution of
bearing pressure it is needed to define the
relationship between settlement and bearing
pressure This is usually done using the coefficient
of subgrade reaction (K s) Equation (3) is used to
determine K s from the PLT results (Coduto 2001)
k s= ΔPΔS (3)
Where K s is the modulus of subgrade reaction ΔP
is the applied pressure and ΔS is the measuredsettlement The results of these determinations are
given in Table 3
Figure 7 Definition of modulus from PLT (Abu-farsakh et al
2004) Direct shear test
In order to determine the soil friction angle (φ) 15
direct shear tests were carried out in a circular
shear mould according to ASTM-D 308-90 (2000)
(see Table 2) To prepare the soil samples fordirect shear test a circular shear box having 60
8132019 Mcpt Teheran analisis de macizos rocosos en la ingenieria practica
httpslidepdfcomreaderfullmcpt-teheran-analisis-de-macizos-rocosos-en-la-ingenieria-practica 612
70 Nikudel et al JGeope 2 (2) 2012
mm internal diameter and 25 mm height was used
To achieve a uniform compaction in the circular
shear mould of the direct shear machine tamping
by a small circular steel plate with 60 mm diameterwas used
Due to the nature of the soil samples (non-
cohesive) cohesion parameter (C) was equal to
zero and thus friction angles were calculated To
eliminate the effect of pore pressure all direct
shear tests were carried out in dry conditions The
results of direct shear tests are given in Table 3
Results and discussion
One of the most commonly accepted methods of
investigating empirical relationships between soil
properties is simple regression analysis In thisstudy the results of all tests were assessed to find
the best correlation between Mini-CPT strength
parameters (qc(MCPT) and f s(MCPT)) and the index
properties of the soil samples ie Relative Density
(Dr ) Friction Angle (φ) Elastic Modulus (E) Shear
Modulus (G) and Subgrade Reaction Modulus (K s)
The linear and non-linear simple regressions were
undertaken with 95 confidence level and the
determination coefficient (R 2) was obtained for the
relationships The authors attempted to develop the
best correlation between different variables in orderto attain the most reliable empirical equation
Mini-CPT parameters versus relative density (Dr )
Relative density is a useful parameter to describe
the consistency of sands CPT can be used to
estimate both the relative density of cohesionless
soil and the undrained strength of cohesive soils
through empirical correlations (USACE 1992)
Several investigators including Schmertmann
(1978) Villet amp Mitchell (1981) Baldi et al
(1982) Robertson amp Campanella (1983)
Jamiolkowski et al (1988) Puppala et al (1995)
and Juang et al (1996) have developed
correlations for the relative density (Dr ) as a
function of qc for sandy soils These relationships
are also functions of vertical effective stress
(Amini 2003)
In this study the correlation of Dr with qc(MCPT) and
f s(MCPT) was investigated (Fig 8) show the
relationships of Dr with qc(MCPT) and f s(MCPT) for the
tested samples respectively A very high
correlation with the determination coefficient 096
was found between Dr and qc(MCPT)Dr ()=23733 (qc(MCPT))
0469 R 2=096 (4)
Similarly a power relationship was observed
between Dr and f s(MCPT) with a high determination
coefficient 084
Dr ()=7408 (f s(MCPT))
0389
R
2
=085 (5)
Figure 8 Correlation between a) qc(MCPT) and b) f s(MCPT) with Dr
According to these results for estimation of Dr
using qc(MCPT) is more reliable than f s(MCPT) because
of higher determination coefficient The application
range of the equations obtained in this study is
1023-122 MPa for qc(MCPT) and 3196-49965 kPa
for f s(MCPT
Mini-CPT parameters versus friction angle (φ)
Friction angle is one of the most important index
parameters needed for calculation of shear strength
in any foundation design
(Fig 9) depict that good correlations were found
between friction angle (φ) and qc(MCPT) and f s(MCPT)
with determination correlations of 087 and 089
respectively
φ=305(qc(MCPT))0127
R 2=087 (6)
φ=215(f s(MCPT))0113 R 2=089 (7)
As can be seen from these Figs also equations (6)
and (7) in each case the best fit relation is
represented by power regression curves Anincrease in friction angle was recorded following an
8132019 Mcpt Teheran analisis de macizos rocosos en la ingenieria practica
httpslidepdfcomreaderfullmcpt-teheran-analisis-de-macizos-rocosos-en-la-ingenieria-practica 712
Using Miniature Cone Penetration Test (Mini-CPT) to determine engineering hellip 71 increase in both qc(MCPT) and f s(MCPT)
The correlation between friction angle (φ) and
relative density (Dr ) for the results obtained in this
research is presented in Fig 10 and equation (8)φ = 021(Dr )+26 R 2=092 (8)
Figure 9 Correlation between a) qc(MCPT) and b) f s(MCPT) with φ
Figure 10 Correlation between Dr and φ
There is a linear relationship between friction angle
(φ) and relative density (Dr ) with a high
determination coefficient (092)
Similar relationships have been obtained between
friction angle (φ) and relative density (Dr ) by
different authors such as Meyerhof (1959) He has
suggested equation (9) for normally consolidated
sands
=φ 015(Dr ) (9)
Mini-CPT parameters versus elastic modulus (E)
The cone penetration resistance has been correlated
with the equivalent elastic modulus of soils by
various investigators (Trofimenkov 1974
Schmertmann et al 1986)
Table 4 Summary of the equations developed in this paperDetermination
coefficient (R 2) Type correlation Equations Parameters (R 2=096) powerDr ()=23733 (qc(MCPT))
0469 Dr -qc(MCPT) (R 2=085) power Dr ()=7408 (f s(MCPT))
0389 Dr ()-f s(MCPT) (R 2=092) linear EPLT(i)=1457(qc(MCPT))+607 EPLT(i)-qc(MCPT) (R 2=096) linear EPLT(R2)=12(qc(MCPT))+2 EPLT(R2)-qc(MCPT) (R 2=097)logarithmic EPLT(R2)=46 Ln(f s(MCPT))-13 EPLT(R2)-f s(MCPT) (R 2=091) logarithmic EPLT(i)=556 Ln(f s(MCPT))-12 EPLT(i)-f s(MCPT) (R 2=092) power GPLT(i)=137(qc(MCPT))
097 GPLT(i)-qc(MCPT) (R 2=094) power GPLT(i)=01(f s(MCPT))
0869 GPLT(i)-f s(MCPT) (R 2=092) power k s=25(qc(MCPT))
0817 k s-qc(MCPT) (R 2=090) logarithmic k s=57Ln(f s(MCPT))-169k s-f s(MCPT) (R 2=087) power φ=305(qc(MCPT))
0127 φ-qc(MCPT) (R 2=089) power φ=215(f s(MCPT))
0113 φ-f s(MCPT)
(R 2=092) linear φ= 021(Dr )+26 φ-Dr In Fig 11 the correlations of qc(MCPT) with the
loading and reloading elastic modulus (EPLT(i) and
EPLT(R2)) are presented for the data obtained in this
study (also see equations 10 and 11) It can be seen
from the figures that the best-fitted relations are
represented by linear regression curves The results
of regression equations and the determination
coefficients are summarized in Table 4
EPLT(i)=1457(qc(MCPT))+607 R 2=092 (10)
EPLT(R2)=12(qc(MCPT))+2 R 2=096 (11)
A strong logarithmic correlation was also found
between f s(MCPT) and loading and reloading elastic
modulus (EPLT(i) and EPLT(R2)) with the determination
coefficients of 091 and 097 respectively (Fig 12)
EPLT(i)=556 Ln (f s(MCPT))-12 R 2=091 (12)
EPLT(R2)=46 Ln(f s(MCPT))-13 R 2=097 (13)
(b)
a
8132019 Mcpt Teheran analisis de macizos rocosos en la ingenieria practica
httpslidepdfcomreaderfullmcpt-teheran-analisis-de-macizos-rocosos-en-la-ingenieria-practica 812
72 Nikudel et al JGeope 2 (2) 2012
Figure 11 Correlation between a) EPLT(i) and b) EPLT(R2) with
qc(MCPT)
Figure 12 Correlation between a) EPLT(i) and b) EPLT(R2) with f s
The correlations established in this study were
compared with the equations obtained by different
researchers Schmertmann et al (1986) gave a
simple linear correlation for siltyclayey sands as
followsE=7qc (14)
Trofimenkov (1974) also suggested the following
correlations for the elasticity modulus in sand and
clay
E=3qc (for sand) (15)E=7qc (for clay) (16)
These researchers established linear equations
between E and qc while in this study logarithmic
equations between them were obtained
Mini-CPT parameters versus shear modulus (G)
Several methods are available to evaluate the shear
modulus of coarse-grained and fine grained soils
they include geophysical methods Plate Load Test
(PLT) etc which are all costly
In the present research correlations between theshear modulus (GPLT(i)) and miniature cone and
resistance parameters (qc(MCPT) and f s(MCPT)) were
investigated The best correlation between the shear
modulus (G) with qc(MCPT) and f s(MCPT)) is presented
in Fig 13 and also equations (17) and (18)
respectively
GPLT(i)=137(qc(MCPT))097
R 2=092 (17)
GPLT(i)=01(f s(MCPT))0869
R 2=094 (18)
Figure 13 Correlation between a) qc(MCPT) and b) f s(MCPT) with
G
It can be seen from equations (17) and (18) that the
best-fitted relations are represented by power
regression curves The determination coefficientwas obtained between GPLT(i) and qc(MCPT) and f s(MCPT)
is 092 and 094 respectively
(b)
(a)
(b)
(a)
(b)
(a)
8132019 Mcpt Teheran analisis de macizos rocosos en la ingenieria practica
httpslidepdfcomreaderfullmcpt-teheran-analisis-de-macizos-rocosos-en-la-ingenieria-practica 912
Using Miniature Cone Penetration Test (Mini-CPT) to determine engineering hellip 73
Figure 14 Correlation between k s with a) qc(MCPT) and b)
f s(MCPT)
Mini-CPT parameters versus subgrade reaction
modulus (K s )
The best relationships between subgrade reaction
modulus and Mini-CPT parameters are presented in
Fig (14) and also equations (19) and (20)
K s=25(qc(MCPT))0817
R 2
=092 (19)
Where K s is the subgrade reaction modulus and
qc(MCPT) is the tip resistance
As can be seen from equation (20) there is a power
relationship between K s and qc(MCPT) with a
determination coefficient of 092
A logarithmic relationship was observed between
K s and friction resistance (f s(MCPT)) with a lower
determination coefficient (R 2=090) than that of K s
and qc(MCPT)
K s=57Ln(f s(MCPT))-169 R 2=090 (20)
Comparison of the determination correlations in
equations (19) and (20) shows that qc(MCPT) is better
than f s(MCPT) for estimating K s (because of higher
determination coefficient)
Conclusions
In soil exploration an approach is offered by cone
penetration testing (CPT) Mini-CPT is one of the
newest types of CPT which is less in diameter than
the conventional test equipments The most
important advantages of miniature penetrometer
are 1- smaller downward thrust needed to advance
the penetrometer into the soil 2- ability to identify
very thin layers and 3- installation in a smaller
vehicle that provides greater mobility and site
accessibility In this research the ability of Mini-CPT to determine some engineering properties of
sandy soil was investigated Due to the lack of
convenient field conditions all tests were done in
laboratory conditions and also a Mini-CPT
apparatus was developed By having the tip and
friction resistance and carrying out some tests such
as PLT and direct shear test to determine soil
deformability parameters and friction angle the
best correlations between them were obtained
Final results are shown in the form of empirical
correlations with high value of determinationcoefficient (Table 4) The use of qc(MCPT) and
f s(MCPT) to the determine properties of sandy soils
in most instances gives the same value of R 2
except for the case of Dr Therefore it is highly
recommended to use qc(MCPT) than f s(MCPT) to
determine relative density (for its higher value of
R 2)
Acknowledgment
The authors greatly appreciate the Engineering
Geology Laboratory of Tarbiat Modares University
for the fund provided for the present investigation
References
Abu-farsakh M Khalid Alshibi PE Nazzal M Seyman E 2004 Assessment of in-situ test technology
for construction control of base courses and embankments Report No FHWALA04385 Louisiana
Transportation Research Center
Amini F 2003 Potential applications of dynamic and static cone penetrometers in MDOT pavement design
and construction Report No FHWAMS-DOT-RD-03-162 Jackson State University Jackson Miss 31
pp
American Society of Testing and Materials 2000 Standard test method for direct shear test of under drained
conditions (D3080-98) Annual Book of ASTM Standards 0408 pp 894 ndash 904
(b)
(a)
8132019 Mcpt Teheran analisis de macizos rocosos en la ingenieria practica
httpslidepdfcomreaderfullmcpt-teheran-analisis-de-macizos-rocosos-en-la-ingenieria-practica 1012
74 Nikudel et al JGeope 2 (2) 2012
American Society of Testing and Materials 2003 Standard test method for performing electronic friction
cone and piezocone penetration testing of soils (D5778-95) Annual Book of ASTM Standards 0408 19
pp
American Society of Testing and Materials 1998 Standard test method for repetitive static plate load tests ofsoils and flexible pavement components for use in evaluation and design of airport and highway
pavements (D1195-93) Annual Book of ASTM Standards 0408 pp 110 ndash 113
American Society of Testing and Materials 2004 Standard method of deep quasi-static cone and friction-
cone penetration tests of Soil (D3441) ASTM International West Conshohocken PA 7 pp
Baldi G Bellotti R Ghionna V Jamiolkowski M Pasqualini E 1982 Design Parameters for Sands
from CPT Proceedings Second of European Symposium On Penetration Testing A A Blakema
Rotterdam the Netherlands 2 425- 432
Baligh MM Azzouz AS Wissa AZE Martin RT Morrison MJ 1981 The piezocone penetrometer
cone penetration testing and experience Proc ASCE National Convention St Louis Mo pp 247 ndash 263
Begemann H K S 1965 The friction jacket cone as an aid in determining the soil profile Proceedings 6th
ICSMFE Montreal Quebec Canada 117-20
Bowles JE 1997 Foundation analysis and design McGraw-Hill International Editions 1207 pp Briaud J L Miran J 1992 The cone penetrometer test Report FHWA-SA-91-043 Federal Highway
Administration Washington DC 161 pp
Coduto D P 2001 Foundation design principal and practices Prentice Hall New Jersey 883 pp
Jamiolkowski M Ghionna V N Lancellotto R Pasqualini E 1988 New correlations of penetration tests
for design practice Penetration Testing 1988 ISOPT-1 J DeRuiter ed 1 263-296 Available from A A
Balkema Publishers Old Post Road Brookfield VT 05036
Juang C H Huang X H Holtz R D Chen J W 1996 Determining relative density of sands from CPT
using fuzzy sets Journal of Geotechnical Engineering 1221-6
Meigh AC 1987 Cone penetration testing-methods and interpretation CIRIA Ground Engineering Report
In-situ testing Construction Industries Research and Information Association London 141 pp
Meyerhof GG 1959 Compaction of sands and the bearing capacity of piles Journal of GeotechnicalEngineering 85 1 ndash 29
Puppala A J Acar Y B Tumay M T 1995 Cone penetration in very weakly cemented sand Journal of
Geotechnical Engineering 121 589-600
Robertson P K Campanella R G 1983 Interpretation of cone penetration tests Part I Sand Canadian
Geotechnical Journal 20 718-733
Schmertmann J H Baer w Gupta R Kessler K 1986 CPTDMT quality control of ground
modification Proceeding Use of In-Situ Tests in Geotechnical Engineering ASCE Special Publication
No 6 Blacksburg Virginia pp 985-1135
Schmertmann J H 1978 Guidelines for Cone Penetration Test Performance and Design Report FHWA-
TS-78-209 96 Federal Highway Administration Washington DC 146 pp
Timoshenko S P Goodier JN 1970 Theory of elasticity Mc Graw-Hill Book Company New York 591
pp
TRBNA (Transportation Research Board of the National Academies) 2007 Cone penetration testing
Synthesis 368 Georgia Available in httponlinepubstrborgOnlinepubsnchrpnchrp_syn_368pdf
Trofimenkov J G 1974 General Reports Eastern Europe Proceedings European Symposium of
Penetration Testing Stockholm Sweden 21 24-39
Tufenkjian MR Thompson DJ 2005 Shallow penetration resistance of a minicone in sand Proceedings
of the 16th International Conference on Soil Mechanics and Geotechnical Engineering Osaka Japan 89
pp
Tumay MT Kurup PU BoggessRL 1998 A continuous intrusion electronic miniature CPT
Geotechnical Site Characterization Balkema Rotterdam The Netherlands 2 1183 ndash 1188
US Army Corps of Engineers 1992 Engineering and design Bearing capacity of soils Available in
httpwwwusacearmymilpublicationseng-manualsem1110-1-1905basdocpdf
8132019 Mcpt Teheran analisis de macizos rocosos en la ingenieria practica
httpslidepdfcomreaderfullmcpt-teheran-analisis-de-macizos-rocosos-en-la-ingenieria-practica 1112
Using Miniature Cone Penetration Test (Mini-CPT) to determine engineering hellip 75 Villet W C Mitchell J K 1981 Cone resistance relative density and Friction angle Proc Session on
Cone Penetration Testing and Experience ASCE National Convention G N Norris and R D Holtz eds
ASCE New York NY pp 178-208
Vlasblom A 1985 The electrical penetrometer A historical account of its development LGMMededelingen Report No 92 Delft Soil Mechanics Laboratory The Netherlands 51 pp
8132019 Mcpt Teheran analisis de macizos rocosos en la ingenieria practica
httpslidepdfcomreaderfullmcpt-teheran-analisis-de-macizos-rocosos-en-la-ingenieria-practica 1212
76 Nikudel et al JGeope 2 (2) 2012
Appendix 1
The static load plate test is evaluated by assuming that the assessed subsoil can be characterized by a linear elastic
homogeneous isotropic half-space From the settlements of the rigid circular plate which is loaded by a concentrated
force P the Youngrsquos modulus E can be determined according to the theory of elasticity
E=(1- υ2)P2rs
Where υ is Poissonrsquos ratio of the subsoil and r denotes the radius of the plate Assuming that the pressure p below the
load plate is uniformly distributed we have
p=Pr 2π
Assuming further that the Poissonrsquos ratio is constant for all soils with υ = 0212 the so-called deformation modulus E can
be readily defined as
Ev=15rΔpΔs
In the above expression pressure p and settlement s are replaced in this equation by their increments Δp and Δs since the
soil behavior is nonlinear
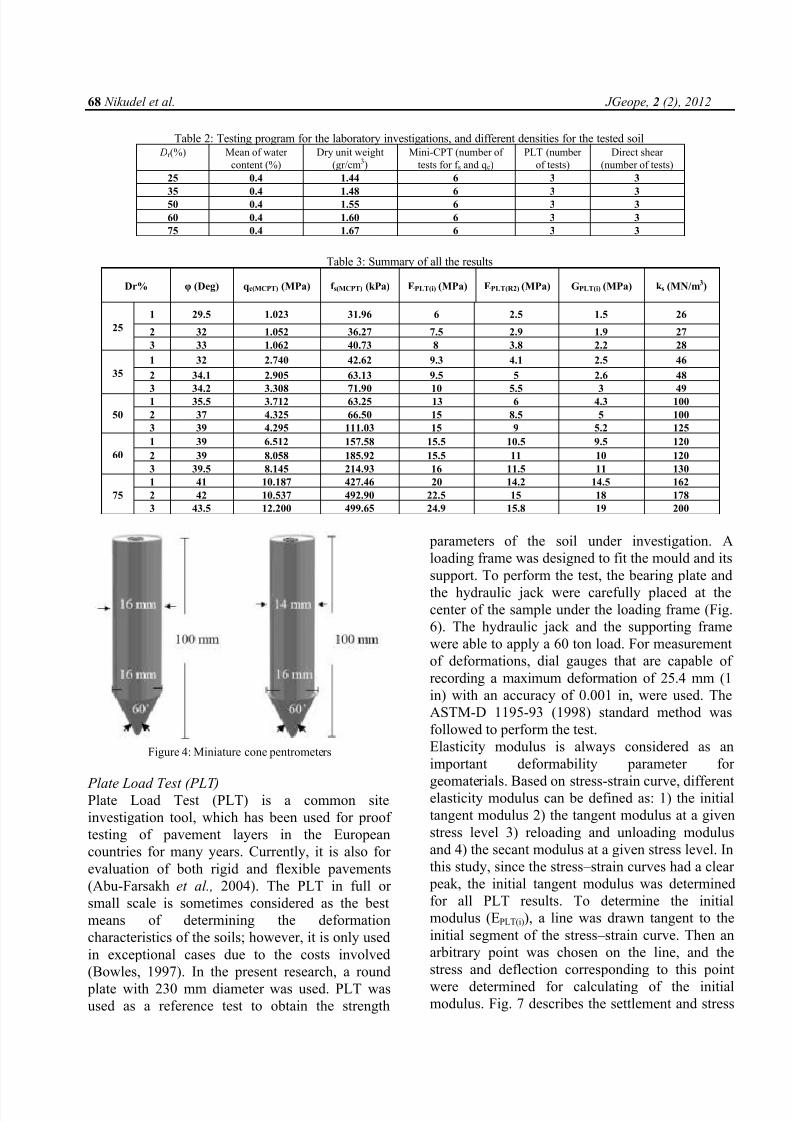
8132019 Mcpt Teheran analisis de macizos rocosos en la ingenieria practica
httpslidepdfcomreaderfullmcpt-teheran-analisis-de-macizos-rocosos-en-la-ingenieria-practica 412
68 Nikudel et al JGeope 2 (2) 2012
Table 2 Testing program for the laboratory investigations and different densities for the tested soilDirect shear
(number of tests) PLT (number
of tests) Mini-CPT (number of
tests for f s and qc) Dry unit weight
(grcm3) Mean of water
content () Dr () 3 3 6 144 04 25 3
3
6
148
04
35
3 3 6 155 04 50 3 3 6 160 04 60 3 3 6 167 04 75
Table 3 Summary of all the results
Dr φ (Deg) qc(MCPT) (MPa) f s(MCPT) (kPa) EPLT(i) (MPa) EPLT(R2) (MPa) GPLT(i) (MPa) k s (MNm3)
25
1 295 1023 3196 6 25 15 26
2 32 1052 3627 75 29 19 27
3 33 1062 4073 8 38 22 28
35
1 32 2740 4262 93 41 25 46
2 341 2905 6313 95 5 26 48
3 342 3308 7190 10 55 3 49
50
1 355 3712 6325 13 6 43 100
2 37 4325 6650 15 85 5 100
3 39 4295 11103 15 9 52 125
60
1 39 6512 15758 155 105 95 120
2 39 8058 18592 155 11 10 120
3 395 8145 21493 16 115 11 130
75
1 41 10187 42746 20 142 145 162
2 42 10537 49290 225 15 18 178
3 435 12200 49965 249 158 19 200
Figure 4 Miniature cone pentrometers
Plate Load Test (PLT)Plate Load Test (PLT) is a common site
investigation tool which has been used for proof
testing of pavement layers in the European
countries for many years Currently it is also for
evaluation of both rigid and flexible pavements
(Abu-Farsakh et al 2004) The PLT in full or
small scale is sometimes considered as the best
means of determining the deformation
characteristics of the soils however it is only used
in exceptional cases due to the costs involved
(Bowles 1997) In the present research a round
plate with 230 mm diameter was used PLT was
used as a reference test to obtain the strength
parameters of the soil under investigation A
loading frame was designed to fit the mould and its
support To perform the test the bearing plate and
the hydraulic jack were carefully placed at thecenter of the sample under the loading frame (Fig
6) The hydraulic jack and the supporting frame
were able to apply a 60 ton load For measurement
of deformations dial gauges that are capable of
recording a maximum deformation of 254 mm (1
in) with an accuracy of 0001 in were used The
ASTM-D 1195-93 (1998) standard method was
followed to perform the test
Elasticity modulus is always considered as an
important deformability parameter for
geomaterials Based on stress-strain curve differentelasticity modulus can be defined as 1) the initial
tangent modulus 2) the tangent modulus at a given
stress level 3) reloading and unloading modulus
and 4) the secant modulus at a given stress level In
this study since the stress ndash strain curves had a clear
peak the initial tangent modulus was determined
for all PLT results To determine the initial
modulus (EPLT(i)) a line was drawn tangent to the
initial segment of the stress ndash strain curve Then an
arbitrary point was chosen on the line and the
stress and deflection corresponding to this point
were determined for calculating of the initialmodulus Fig 7 describes the settlement and stress
8132019 Mcpt Teheran analisis de macizos rocosos en la ingenieria practica
httpslidepdfcomreaderfullmcpt-teheran-analisis-de-macizos-rocosos-en-la-ingenieria-practica 512
Using Miniature Cone Penetration Test (Mini-CPT) to determine engineering hellip 69 used for determining EPLT(i) (Abu-farsakh et al
2004) A reloading stiffness modulus called
EPLT(R2) was also determined for each stress ndash strain
curve
Figure 5 a) Miniature cone tip resistance (qc(MCPT)) b)
Miniature cone friction resistance (f s(MCPT)) profiles in the sands
with different relative densities
Figure 6 A schematic diagram of plate load test (PLT) set up
(a) side view and (b) plan view
The second parameter which can be calculated
from the PLT results is shear modulus (G) Shear
modulus is defined as the ratio of shear stress to
shear strain (Bowles 1997) and is calculated fromequation (1) (Timoshenko amp Goodier 1970)
)1(8
qDG PLT
(1)
Where q is the bearing pressure D is the diameter
of the loading plate ρ is the settlement and υ is the
Poisson ratio
From the theory of elasticity the relationship
between the modulus of elasticity and the shear
modulus can be given as below
E=2(1+υ)G (2)
Since the non-rigid methods consider the effect of
local mat deformations on the distribution of
bearing pressure it is needed to define the
relationship between settlement and bearing
pressure This is usually done using the coefficient
of subgrade reaction (K s) Equation (3) is used to
determine K s from the PLT results (Coduto 2001)
k s= ΔPΔS (3)
Where K s is the modulus of subgrade reaction ΔP
is the applied pressure and ΔS is the measuredsettlement The results of these determinations are
given in Table 3
Figure 7 Definition of modulus from PLT (Abu-farsakh et al
2004) Direct shear test
In order to determine the soil friction angle (φ) 15
direct shear tests were carried out in a circular
shear mould according to ASTM-D 308-90 (2000)
(see Table 2) To prepare the soil samples fordirect shear test a circular shear box having 60
8132019 Mcpt Teheran analisis de macizos rocosos en la ingenieria practica
httpslidepdfcomreaderfullmcpt-teheran-analisis-de-macizos-rocosos-en-la-ingenieria-practica 612
70 Nikudel et al JGeope 2 (2) 2012
mm internal diameter and 25 mm height was used
To achieve a uniform compaction in the circular
shear mould of the direct shear machine tamping
by a small circular steel plate with 60 mm diameterwas used
Due to the nature of the soil samples (non-
cohesive) cohesion parameter (C) was equal to
zero and thus friction angles were calculated To
eliminate the effect of pore pressure all direct
shear tests were carried out in dry conditions The
results of direct shear tests are given in Table 3
Results and discussion
One of the most commonly accepted methods of
investigating empirical relationships between soil
properties is simple regression analysis In thisstudy the results of all tests were assessed to find
the best correlation between Mini-CPT strength
parameters (qc(MCPT) and f s(MCPT)) and the index
properties of the soil samples ie Relative Density
(Dr ) Friction Angle (φ) Elastic Modulus (E) Shear
Modulus (G) and Subgrade Reaction Modulus (K s)
The linear and non-linear simple regressions were
undertaken with 95 confidence level and the
determination coefficient (R 2) was obtained for the
relationships The authors attempted to develop the
best correlation between different variables in orderto attain the most reliable empirical equation
Mini-CPT parameters versus relative density (Dr )
Relative density is a useful parameter to describe
the consistency of sands CPT can be used to
estimate both the relative density of cohesionless
soil and the undrained strength of cohesive soils
through empirical correlations (USACE 1992)
Several investigators including Schmertmann
(1978) Villet amp Mitchell (1981) Baldi et al
(1982) Robertson amp Campanella (1983)
Jamiolkowski et al (1988) Puppala et al (1995)
and Juang et al (1996) have developed
correlations for the relative density (Dr ) as a
function of qc for sandy soils These relationships
are also functions of vertical effective stress
(Amini 2003)
In this study the correlation of Dr with qc(MCPT) and
f s(MCPT) was investigated (Fig 8) show the
relationships of Dr with qc(MCPT) and f s(MCPT) for the
tested samples respectively A very high
correlation with the determination coefficient 096
was found between Dr and qc(MCPT)Dr ()=23733 (qc(MCPT))
0469 R 2=096 (4)
Similarly a power relationship was observed
between Dr and f s(MCPT) with a high determination
coefficient 084
Dr ()=7408 (f s(MCPT))
0389
R
2
=085 (5)
Figure 8 Correlation between a) qc(MCPT) and b) f s(MCPT) with Dr
According to these results for estimation of Dr
using qc(MCPT) is more reliable than f s(MCPT) because
of higher determination coefficient The application
range of the equations obtained in this study is
1023-122 MPa for qc(MCPT) and 3196-49965 kPa
for f s(MCPT
Mini-CPT parameters versus friction angle (φ)
Friction angle is one of the most important index
parameters needed for calculation of shear strength
in any foundation design
(Fig 9) depict that good correlations were found
between friction angle (φ) and qc(MCPT) and f s(MCPT)
with determination correlations of 087 and 089
respectively
φ=305(qc(MCPT))0127
R 2=087 (6)
φ=215(f s(MCPT))0113 R 2=089 (7)
As can be seen from these Figs also equations (6)
and (7) in each case the best fit relation is
represented by power regression curves Anincrease in friction angle was recorded following an
8132019 Mcpt Teheran analisis de macizos rocosos en la ingenieria practica
httpslidepdfcomreaderfullmcpt-teheran-analisis-de-macizos-rocosos-en-la-ingenieria-practica 712
Using Miniature Cone Penetration Test (Mini-CPT) to determine engineering hellip 71 increase in both qc(MCPT) and f s(MCPT)
The correlation between friction angle (φ) and
relative density (Dr ) for the results obtained in this
research is presented in Fig 10 and equation (8)φ = 021(Dr )+26 R 2=092 (8)
Figure 9 Correlation between a) qc(MCPT) and b) f s(MCPT) with φ
Figure 10 Correlation between Dr and φ
There is a linear relationship between friction angle
(φ) and relative density (Dr ) with a high
determination coefficient (092)
Similar relationships have been obtained between
friction angle (φ) and relative density (Dr ) by
different authors such as Meyerhof (1959) He has
suggested equation (9) for normally consolidated
sands
=φ 015(Dr ) (9)
Mini-CPT parameters versus elastic modulus (E)
The cone penetration resistance has been correlated
with the equivalent elastic modulus of soils by
various investigators (Trofimenkov 1974
Schmertmann et al 1986)
Table 4 Summary of the equations developed in this paperDetermination
coefficient (R 2) Type correlation Equations Parameters (R 2=096) powerDr ()=23733 (qc(MCPT))
0469 Dr -qc(MCPT) (R 2=085) power Dr ()=7408 (f s(MCPT))
0389 Dr ()-f s(MCPT) (R 2=092) linear EPLT(i)=1457(qc(MCPT))+607 EPLT(i)-qc(MCPT) (R 2=096) linear EPLT(R2)=12(qc(MCPT))+2 EPLT(R2)-qc(MCPT) (R 2=097)logarithmic EPLT(R2)=46 Ln(f s(MCPT))-13 EPLT(R2)-f s(MCPT) (R 2=091) logarithmic EPLT(i)=556 Ln(f s(MCPT))-12 EPLT(i)-f s(MCPT) (R 2=092) power GPLT(i)=137(qc(MCPT))
097 GPLT(i)-qc(MCPT) (R 2=094) power GPLT(i)=01(f s(MCPT))
0869 GPLT(i)-f s(MCPT) (R 2=092) power k s=25(qc(MCPT))
0817 k s-qc(MCPT) (R 2=090) logarithmic k s=57Ln(f s(MCPT))-169k s-f s(MCPT) (R 2=087) power φ=305(qc(MCPT))
0127 φ-qc(MCPT) (R 2=089) power φ=215(f s(MCPT))
0113 φ-f s(MCPT)
(R 2=092) linear φ= 021(Dr )+26 φ-Dr In Fig 11 the correlations of qc(MCPT) with the
loading and reloading elastic modulus (EPLT(i) and
EPLT(R2)) are presented for the data obtained in this
study (also see equations 10 and 11) It can be seen
from the figures that the best-fitted relations are
represented by linear regression curves The results
of regression equations and the determination
coefficients are summarized in Table 4
EPLT(i)=1457(qc(MCPT))+607 R 2=092 (10)
EPLT(R2)=12(qc(MCPT))+2 R 2=096 (11)
A strong logarithmic correlation was also found
between f s(MCPT) and loading and reloading elastic
modulus (EPLT(i) and EPLT(R2)) with the determination
coefficients of 091 and 097 respectively (Fig 12)
EPLT(i)=556 Ln (f s(MCPT))-12 R 2=091 (12)
EPLT(R2)=46 Ln(f s(MCPT))-13 R 2=097 (13)
(b)
a
8132019 Mcpt Teheran analisis de macizos rocosos en la ingenieria practica
httpslidepdfcomreaderfullmcpt-teheran-analisis-de-macizos-rocosos-en-la-ingenieria-practica 812
72 Nikudel et al JGeope 2 (2) 2012
Figure 11 Correlation between a) EPLT(i) and b) EPLT(R2) with
qc(MCPT)
Figure 12 Correlation between a) EPLT(i) and b) EPLT(R2) with f s
The correlations established in this study were
compared with the equations obtained by different
researchers Schmertmann et al (1986) gave a
simple linear correlation for siltyclayey sands as
followsE=7qc (14)
Trofimenkov (1974) also suggested the following
correlations for the elasticity modulus in sand and
clay
E=3qc (for sand) (15)E=7qc (for clay) (16)
These researchers established linear equations
between E and qc while in this study logarithmic
equations between them were obtained
Mini-CPT parameters versus shear modulus (G)
Several methods are available to evaluate the shear
modulus of coarse-grained and fine grained soils
they include geophysical methods Plate Load Test
(PLT) etc which are all costly
In the present research correlations between theshear modulus (GPLT(i)) and miniature cone and
resistance parameters (qc(MCPT) and f s(MCPT)) were
investigated The best correlation between the shear
modulus (G) with qc(MCPT) and f s(MCPT)) is presented
in Fig 13 and also equations (17) and (18)
respectively
GPLT(i)=137(qc(MCPT))097
R 2=092 (17)
GPLT(i)=01(f s(MCPT))0869
R 2=094 (18)
Figure 13 Correlation between a) qc(MCPT) and b) f s(MCPT) with
G
It can be seen from equations (17) and (18) that the
best-fitted relations are represented by power
regression curves The determination coefficientwas obtained between GPLT(i) and qc(MCPT) and f s(MCPT)
is 092 and 094 respectively
(b)
(a)
(b)
(a)
(b)
(a)
8132019 Mcpt Teheran analisis de macizos rocosos en la ingenieria practica
httpslidepdfcomreaderfullmcpt-teheran-analisis-de-macizos-rocosos-en-la-ingenieria-practica 912
Using Miniature Cone Penetration Test (Mini-CPT) to determine engineering hellip 73
Figure 14 Correlation between k s with a) qc(MCPT) and b)
f s(MCPT)
Mini-CPT parameters versus subgrade reaction
modulus (K s )
The best relationships between subgrade reaction
modulus and Mini-CPT parameters are presented in
Fig (14) and also equations (19) and (20)
K s=25(qc(MCPT))0817
R 2
=092 (19)
Where K s is the subgrade reaction modulus and
qc(MCPT) is the tip resistance
As can be seen from equation (20) there is a power
relationship between K s and qc(MCPT) with a
determination coefficient of 092
A logarithmic relationship was observed between
K s and friction resistance (f s(MCPT)) with a lower
determination coefficient (R 2=090) than that of K s
and qc(MCPT)
K s=57Ln(f s(MCPT))-169 R 2=090 (20)
Comparison of the determination correlations in
equations (19) and (20) shows that qc(MCPT) is better
than f s(MCPT) for estimating K s (because of higher
determination coefficient)
Conclusions
In soil exploration an approach is offered by cone
penetration testing (CPT) Mini-CPT is one of the
newest types of CPT which is less in diameter than
the conventional test equipments The most
important advantages of miniature penetrometer
are 1- smaller downward thrust needed to advance
the penetrometer into the soil 2- ability to identify
very thin layers and 3- installation in a smaller
vehicle that provides greater mobility and site
accessibility In this research the ability of Mini-CPT to determine some engineering properties of
sandy soil was investigated Due to the lack of
convenient field conditions all tests were done in
laboratory conditions and also a Mini-CPT
apparatus was developed By having the tip and
friction resistance and carrying out some tests such
as PLT and direct shear test to determine soil
deformability parameters and friction angle the
best correlations between them were obtained
Final results are shown in the form of empirical
correlations with high value of determinationcoefficient (Table 4) The use of qc(MCPT) and
f s(MCPT) to the determine properties of sandy soils
in most instances gives the same value of R 2
except for the case of Dr Therefore it is highly
recommended to use qc(MCPT) than f s(MCPT) to
determine relative density (for its higher value of
R 2)
Acknowledgment
The authors greatly appreciate the Engineering
Geology Laboratory of Tarbiat Modares University
for the fund provided for the present investigation
References
Abu-farsakh M Khalid Alshibi PE Nazzal M Seyman E 2004 Assessment of in-situ test technology
for construction control of base courses and embankments Report No FHWALA04385 Louisiana
Transportation Research Center
Amini F 2003 Potential applications of dynamic and static cone penetrometers in MDOT pavement design
and construction Report No FHWAMS-DOT-RD-03-162 Jackson State University Jackson Miss 31
pp
American Society of Testing and Materials 2000 Standard test method for direct shear test of under drained
conditions (D3080-98) Annual Book of ASTM Standards 0408 pp 894 ndash 904
(b)
(a)
8132019 Mcpt Teheran analisis de macizos rocosos en la ingenieria practica
httpslidepdfcomreaderfullmcpt-teheran-analisis-de-macizos-rocosos-en-la-ingenieria-practica 1012
74 Nikudel et al JGeope 2 (2) 2012
American Society of Testing and Materials 2003 Standard test method for performing electronic friction
cone and piezocone penetration testing of soils (D5778-95) Annual Book of ASTM Standards 0408 19
pp
American Society of Testing and Materials 1998 Standard test method for repetitive static plate load tests ofsoils and flexible pavement components for use in evaluation and design of airport and highway
pavements (D1195-93) Annual Book of ASTM Standards 0408 pp 110 ndash 113
American Society of Testing and Materials 2004 Standard method of deep quasi-static cone and friction-
cone penetration tests of Soil (D3441) ASTM International West Conshohocken PA 7 pp
Baldi G Bellotti R Ghionna V Jamiolkowski M Pasqualini E 1982 Design Parameters for Sands
from CPT Proceedings Second of European Symposium On Penetration Testing A A Blakema
Rotterdam the Netherlands 2 425- 432
Baligh MM Azzouz AS Wissa AZE Martin RT Morrison MJ 1981 The piezocone penetrometer
cone penetration testing and experience Proc ASCE National Convention St Louis Mo pp 247 ndash 263
Begemann H K S 1965 The friction jacket cone as an aid in determining the soil profile Proceedings 6th
ICSMFE Montreal Quebec Canada 117-20
Bowles JE 1997 Foundation analysis and design McGraw-Hill International Editions 1207 pp Briaud J L Miran J 1992 The cone penetrometer test Report FHWA-SA-91-043 Federal Highway
Administration Washington DC 161 pp
Coduto D P 2001 Foundation design principal and practices Prentice Hall New Jersey 883 pp
Jamiolkowski M Ghionna V N Lancellotto R Pasqualini E 1988 New correlations of penetration tests
for design practice Penetration Testing 1988 ISOPT-1 J DeRuiter ed 1 263-296 Available from A A
Balkema Publishers Old Post Road Brookfield VT 05036
Juang C H Huang X H Holtz R D Chen J W 1996 Determining relative density of sands from CPT
using fuzzy sets Journal of Geotechnical Engineering 1221-6
Meigh AC 1987 Cone penetration testing-methods and interpretation CIRIA Ground Engineering Report
In-situ testing Construction Industries Research and Information Association London 141 pp
Meyerhof GG 1959 Compaction of sands and the bearing capacity of piles Journal of GeotechnicalEngineering 85 1 ndash 29
Puppala A J Acar Y B Tumay M T 1995 Cone penetration in very weakly cemented sand Journal of
Geotechnical Engineering 121 589-600
Robertson P K Campanella R G 1983 Interpretation of cone penetration tests Part I Sand Canadian
Geotechnical Journal 20 718-733
Schmertmann J H Baer w Gupta R Kessler K 1986 CPTDMT quality control of ground
modification Proceeding Use of In-Situ Tests in Geotechnical Engineering ASCE Special Publication
No 6 Blacksburg Virginia pp 985-1135
Schmertmann J H 1978 Guidelines for Cone Penetration Test Performance and Design Report FHWA-
TS-78-209 96 Federal Highway Administration Washington DC 146 pp
Timoshenko S P Goodier JN 1970 Theory of elasticity Mc Graw-Hill Book Company New York 591
pp
TRBNA (Transportation Research Board of the National Academies) 2007 Cone penetration testing
Synthesis 368 Georgia Available in httponlinepubstrborgOnlinepubsnchrpnchrp_syn_368pdf
Trofimenkov J G 1974 General Reports Eastern Europe Proceedings European Symposium of
Penetration Testing Stockholm Sweden 21 24-39
Tufenkjian MR Thompson DJ 2005 Shallow penetration resistance of a minicone in sand Proceedings
of the 16th International Conference on Soil Mechanics and Geotechnical Engineering Osaka Japan 89
pp
Tumay MT Kurup PU BoggessRL 1998 A continuous intrusion electronic miniature CPT
Geotechnical Site Characterization Balkema Rotterdam The Netherlands 2 1183 ndash 1188
US Army Corps of Engineers 1992 Engineering and design Bearing capacity of soils Available in
httpwwwusacearmymilpublicationseng-manualsem1110-1-1905basdocpdf
8132019 Mcpt Teheran analisis de macizos rocosos en la ingenieria practica
httpslidepdfcomreaderfullmcpt-teheran-analisis-de-macizos-rocosos-en-la-ingenieria-practica 1112
Using Miniature Cone Penetration Test (Mini-CPT) to determine engineering hellip 75 Villet W C Mitchell J K 1981 Cone resistance relative density and Friction angle Proc Session on
Cone Penetration Testing and Experience ASCE National Convention G N Norris and R D Holtz eds
ASCE New York NY pp 178-208
Vlasblom A 1985 The electrical penetrometer A historical account of its development LGMMededelingen Report No 92 Delft Soil Mechanics Laboratory The Netherlands 51 pp
8132019 Mcpt Teheran analisis de macizos rocosos en la ingenieria practica
httpslidepdfcomreaderfullmcpt-teheran-analisis-de-macizos-rocosos-en-la-ingenieria-practica 1212
76 Nikudel et al JGeope 2 (2) 2012
Appendix 1
The static load plate test is evaluated by assuming that the assessed subsoil can be characterized by a linear elastic
homogeneous isotropic half-space From the settlements of the rigid circular plate which is loaded by a concentrated
force P the Youngrsquos modulus E can be determined according to the theory of elasticity
E=(1- υ2)P2rs
Where υ is Poissonrsquos ratio of the subsoil and r denotes the radius of the plate Assuming that the pressure p below the
load plate is uniformly distributed we have
p=Pr 2π
Assuming further that the Poissonrsquos ratio is constant for all soils with υ = 0212 the so-called deformation modulus E can
be readily defined as
Ev=15rΔpΔs
In the above expression pressure p and settlement s are replaced in this equation by their increments Δp and Δs since the
soil behavior is nonlinear
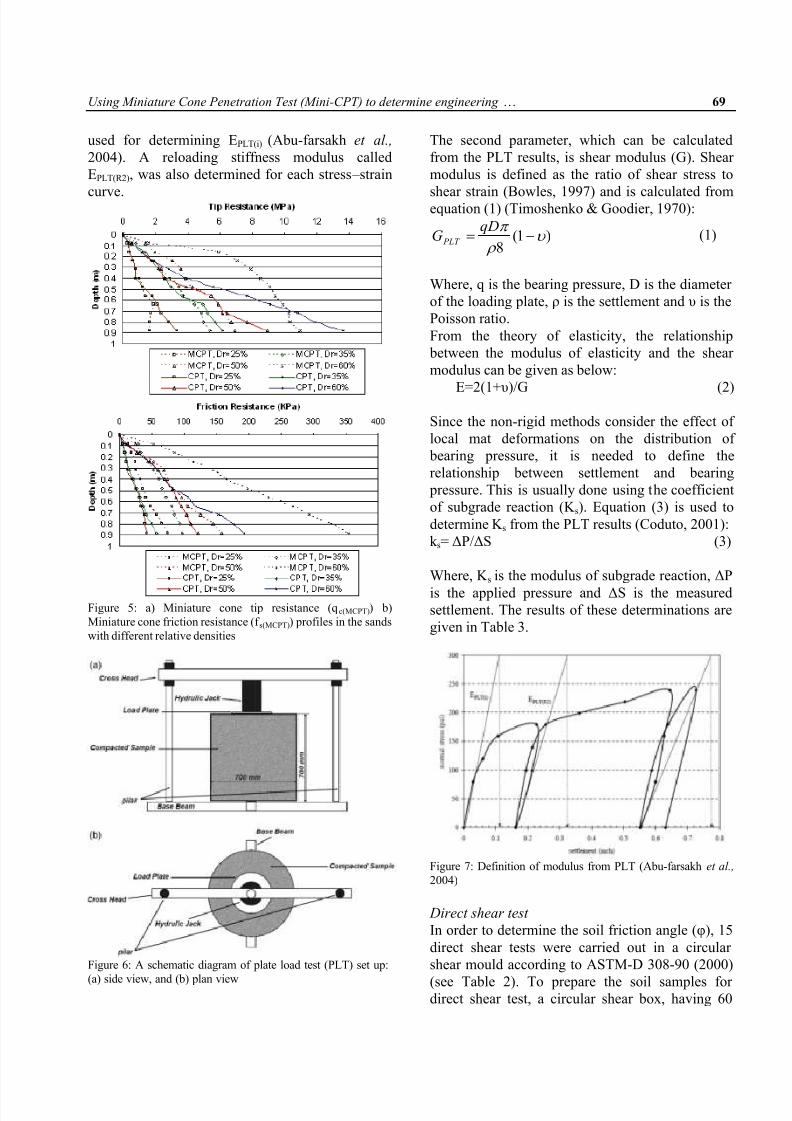
8132019 Mcpt Teheran analisis de macizos rocosos en la ingenieria practica
httpslidepdfcomreaderfullmcpt-teheran-analisis-de-macizos-rocosos-en-la-ingenieria-practica 812
72 Nikudel et al JGeope 2 (2) 2012
Figure 11 Correlation between a) EPLT(i) and b) EPLT(R2) with
qc(MCPT)
Figure 12 Correlation between a) EPLT(i) and b) EPLT(R2) with f s
The correlations established in this study were
compared with the equations obtained by different
researchers Schmertmann et al (1986) gave a
simple linear correlation for siltyclayey sands as
followsE=7qc (14)
Trofimenkov (1974) also suggested the following
correlations for the elasticity modulus in sand and
clay
E=3qc (for sand) (15)E=7qc (for clay) (16)
These researchers established linear equations
between E and qc while in this study logarithmic
equations between them were obtained
Mini-CPT parameters versus shear modulus (G)
Several methods are available to evaluate the shear
modulus of coarse-grained and fine grained soils
they include geophysical methods Plate Load Test
(PLT) etc which are all costly
In the present research correlations between theshear modulus (GPLT(i)) and miniature cone and
resistance parameters (qc(MCPT) and f s(MCPT)) were
investigated The best correlation between the shear
modulus (G) with qc(MCPT) and f s(MCPT)) is presented
in Fig 13 and also equations (17) and (18)
respectively
GPLT(i)=137(qc(MCPT))097
R 2=092 (17)
GPLT(i)=01(f s(MCPT))0869
R 2=094 (18)
Figure 13 Correlation between a) qc(MCPT) and b) f s(MCPT) with
G
It can be seen from equations (17) and (18) that the
best-fitted relations are represented by power
regression curves The determination coefficientwas obtained between GPLT(i) and qc(MCPT) and f s(MCPT)
is 092 and 094 respectively
(b)
(a)
(b)
(a)
(b)
(a)
8132019 Mcpt Teheran analisis de macizos rocosos en la ingenieria practica
httpslidepdfcomreaderfullmcpt-teheran-analisis-de-macizos-rocosos-en-la-ingenieria-practica 912
Using Miniature Cone Penetration Test (Mini-CPT) to determine engineering hellip 73
Figure 14 Correlation between k s with a) qc(MCPT) and b)
f s(MCPT)
Mini-CPT parameters versus subgrade reaction
modulus (K s )
The best relationships between subgrade reaction
modulus and Mini-CPT parameters are presented in
Fig (14) and also equations (19) and (20)
K s=25(qc(MCPT))0817
R 2
=092 (19)
Where K s is the subgrade reaction modulus and
qc(MCPT) is the tip resistance
As can be seen from equation (20) there is a power
relationship between K s and qc(MCPT) with a
determination coefficient of 092
A logarithmic relationship was observed between
K s and friction resistance (f s(MCPT)) with a lower
determination coefficient (R 2=090) than that of K s
and qc(MCPT)
K s=57Ln(f s(MCPT))-169 R 2=090 (20)
Comparison of the determination correlations in
equations (19) and (20) shows that qc(MCPT) is better
than f s(MCPT) for estimating K s (because of higher
determination coefficient)
Conclusions
In soil exploration an approach is offered by cone
penetration testing (CPT) Mini-CPT is one of the
newest types of CPT which is less in diameter than
the conventional test equipments The most
important advantages of miniature penetrometer
are 1- smaller downward thrust needed to advance
the penetrometer into the soil 2- ability to identify
very thin layers and 3- installation in a smaller
vehicle that provides greater mobility and site
accessibility In this research the ability of Mini-CPT to determine some engineering properties of
sandy soil was investigated Due to the lack of
convenient field conditions all tests were done in
laboratory conditions and also a Mini-CPT
apparatus was developed By having the tip and
friction resistance and carrying out some tests such
as PLT and direct shear test to determine soil
deformability parameters and friction angle the
best correlations between them were obtained
Final results are shown in the form of empirical
correlations with high value of determinationcoefficient (Table 4) The use of qc(MCPT) and
f s(MCPT) to the determine properties of sandy soils
in most instances gives the same value of R 2
except for the case of Dr Therefore it is highly
recommended to use qc(MCPT) than f s(MCPT) to
determine relative density (for its higher value of
R 2)
Acknowledgment
The authors greatly appreciate the Engineering
Geology Laboratory of Tarbiat Modares University
for the fund provided for the present investigation
References
Abu-farsakh M Khalid Alshibi PE Nazzal M Seyman E 2004 Assessment of in-situ test technology
for construction control of base courses and embankments Report No FHWALA04385 Louisiana
Transportation Research Center
Amini F 2003 Potential applications of dynamic and static cone penetrometers in MDOT pavement design
and construction Report No FHWAMS-DOT-RD-03-162 Jackson State University Jackson Miss 31
pp
American Society of Testing and Materials 2000 Standard test method for direct shear test of under drained
conditions (D3080-98) Annual Book of ASTM Standards 0408 pp 894 ndash 904
(b)
(a)
8132019 Mcpt Teheran analisis de macizos rocosos en la ingenieria practica
httpslidepdfcomreaderfullmcpt-teheran-analisis-de-macizos-rocosos-en-la-ingenieria-practica 1012
74 Nikudel et al JGeope 2 (2) 2012
American Society of Testing and Materials 2003 Standard test method for performing electronic friction
cone and piezocone penetration testing of soils (D5778-95) Annual Book of ASTM Standards 0408 19
pp
American Society of Testing and Materials 1998 Standard test method for repetitive static plate load tests ofsoils and flexible pavement components for use in evaluation and design of airport and highway
pavements (D1195-93) Annual Book of ASTM Standards 0408 pp 110 ndash 113
American Society of Testing and Materials 2004 Standard method of deep quasi-static cone and friction-
cone penetration tests of Soil (D3441) ASTM International West Conshohocken PA 7 pp
Baldi G Bellotti R Ghionna V Jamiolkowski M Pasqualini E 1982 Design Parameters for Sands
from CPT Proceedings Second of European Symposium On Penetration Testing A A Blakema
Rotterdam the Netherlands 2 425- 432
Baligh MM Azzouz AS Wissa AZE Martin RT Morrison MJ 1981 The piezocone penetrometer
cone penetration testing and experience Proc ASCE National Convention St Louis Mo pp 247 ndash 263
Begemann H K S 1965 The friction jacket cone as an aid in determining the soil profile Proceedings 6th
ICSMFE Montreal Quebec Canada 117-20
Bowles JE 1997 Foundation analysis and design McGraw-Hill International Editions 1207 pp Briaud J L Miran J 1992 The cone penetrometer test Report FHWA-SA-91-043 Federal Highway
Administration Washington DC 161 pp
Coduto D P 2001 Foundation design principal and practices Prentice Hall New Jersey 883 pp
Jamiolkowski M Ghionna V N Lancellotto R Pasqualini E 1988 New correlations of penetration tests
for design practice Penetration Testing 1988 ISOPT-1 J DeRuiter ed 1 263-296 Available from A A
Balkema Publishers Old Post Road Brookfield VT 05036
Juang C H Huang X H Holtz R D Chen J W 1996 Determining relative density of sands from CPT
using fuzzy sets Journal of Geotechnical Engineering 1221-6
Meigh AC 1987 Cone penetration testing-methods and interpretation CIRIA Ground Engineering Report
In-situ testing Construction Industries Research and Information Association London 141 pp
Meyerhof GG 1959 Compaction of sands and the bearing capacity of piles Journal of GeotechnicalEngineering 85 1 ndash 29
Puppala A J Acar Y B Tumay M T 1995 Cone penetration in very weakly cemented sand Journal of
Geotechnical Engineering 121 589-600
Robertson P K Campanella R G 1983 Interpretation of cone penetration tests Part I Sand Canadian
Geotechnical Journal 20 718-733
Schmertmann J H Baer w Gupta R Kessler K 1986 CPTDMT quality control of ground
modification Proceeding Use of In-Situ Tests in Geotechnical Engineering ASCE Special Publication
No 6 Blacksburg Virginia pp 985-1135
Schmertmann J H 1978 Guidelines for Cone Penetration Test Performance and Design Report FHWA-
TS-78-209 96 Federal Highway Administration Washington DC 146 pp
Timoshenko S P Goodier JN 1970 Theory of elasticity Mc Graw-Hill Book Company New York 591
pp
TRBNA (Transportation Research Board of the National Academies) 2007 Cone penetration testing
Synthesis 368 Georgia Available in httponlinepubstrborgOnlinepubsnchrpnchrp_syn_368pdf
Trofimenkov J G 1974 General Reports Eastern Europe Proceedings European Symposium of
Penetration Testing Stockholm Sweden 21 24-39
Tufenkjian MR Thompson DJ 2005 Shallow penetration resistance of a minicone in sand Proceedings
of the 16th International Conference on Soil Mechanics and Geotechnical Engineering Osaka Japan 89
pp
Tumay MT Kurup PU BoggessRL 1998 A continuous intrusion electronic miniature CPT
Geotechnical Site Characterization Balkema Rotterdam The Netherlands 2 1183 ndash 1188
US Army Corps of Engineers 1992 Engineering and design Bearing capacity of soils Available in
httpwwwusacearmymilpublicationseng-manualsem1110-1-1905basdocpdf
8132019 Mcpt Teheran analisis de macizos rocosos en la ingenieria practica
httpslidepdfcomreaderfullmcpt-teheran-analisis-de-macizos-rocosos-en-la-ingenieria-practica 1112
Using Miniature Cone Penetration Test (Mini-CPT) to determine engineering hellip 75 Villet W C Mitchell J K 1981 Cone resistance relative density and Friction angle Proc Session on
Cone Penetration Testing and Experience ASCE National Convention G N Norris and R D Holtz eds
ASCE New York NY pp 178-208
Vlasblom A 1985 The electrical penetrometer A historical account of its development LGMMededelingen Report No 92 Delft Soil Mechanics Laboratory The Netherlands 51 pp
8132019 Mcpt Teheran analisis de macizos rocosos en la ingenieria practica
httpslidepdfcomreaderfullmcpt-teheran-analisis-de-macizos-rocosos-en-la-ingenieria-practica 1212
76 Nikudel et al JGeope 2 (2) 2012
Appendix 1
The static load plate test is evaluated by assuming that the assessed subsoil can be characterized by a linear elastic
homogeneous isotropic half-space From the settlements of the rigid circular plate which is loaded by a concentrated
force P the Youngrsquos modulus E can be determined according to the theory of elasticity
E=(1- υ2)P2rs
Where υ is Poissonrsquos ratio of the subsoil and r denotes the radius of the plate Assuming that the pressure p below the
load plate is uniformly distributed we have
p=Pr 2π
Assuming further that the Poissonrsquos ratio is constant for all soils with υ = 0212 the so-called deformation modulus E can
be readily defined as
Ev=15rΔpΔs
In the above expression pressure p and settlement s are replaced in this equation by their increments Δp and Δs since the
soil behavior is nonlinear
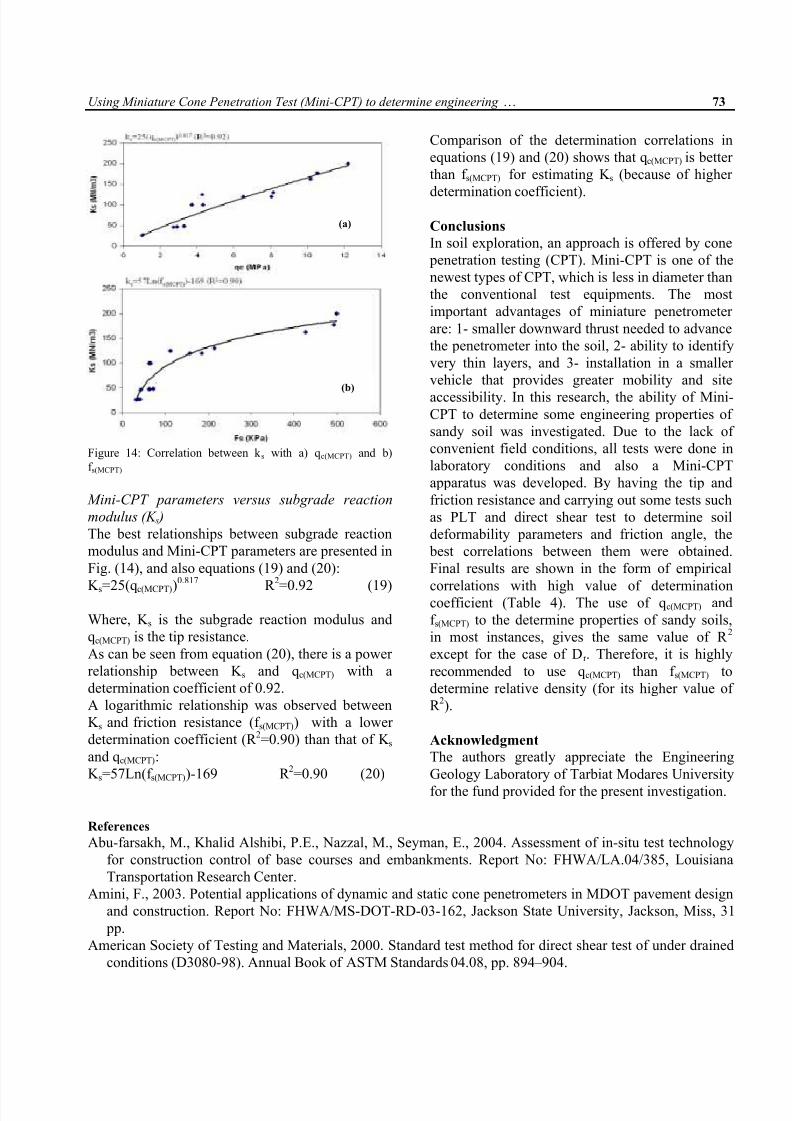
8132019 Mcpt Teheran analisis de macizos rocosos en la ingenieria practica
httpslidepdfcomreaderfullmcpt-teheran-analisis-de-macizos-rocosos-en-la-ingenieria-practica 1212
76 Nikudel et al JGeope 2 (2) 2012
Appendix 1
The static load plate test is evaluated by assuming that the assessed subsoil can be characterized by a linear elastic
homogeneous isotropic half-space From the settlements of the rigid circular plate which is loaded by a concentrated
force P the Youngrsquos modulus E can be determined according to the theory of elasticity
E=(1- υ2)P2rs
Where υ is Poissonrsquos ratio of the subsoil and r denotes the radius of the plate Assuming that the pressure p below the
load plate is uniformly distributed we have
p=Pr 2π
Assuming further that the Poissonrsquos ratio is constant for all soils with υ = 0212 the so-called deformation modulus E can
be readily defined as
Ev=15rΔpΔs
In the above expression pressure p and settlement s are replaced in this equation by their increments Δp and Δs since the
soil behavior is nonlinear