Embed Size (px)
Citation preview
Western Michigan University Western Michigan University
ScholarWorks at WMU ScholarWorks at WMU
Paper Engineering Senior Theses Chemical and Paper Engineering
12-1997
MD Ribbing Instability of Air Knife Coating Application MD Ribbing Instability of Air Knife Coating Application
Bradley W. Fadden Western Michigan University
Follow this and additional works at: https://scholarworks.wmich.edu/engineer-senior-theses
Part of the Wood Science and Pulp, Paper Technology Commons
Recommended Citation Recommended Citation Fadden, Bradley W., "MD Ribbing Instability of Air Knife Coating Application" (1997). Paper Engineering Senior Theses. 102. https://scholarworks.wmich.edu/engineer-senior-theses/102
This Dissertation/Thesis is brought to you for free and open access by the Chemical and Paper Engineering at ScholarWorks at WMU. It has been accepted for inclusion in Paper Engineering Senior Theses by an authorized administrator of ScholarWorks at WMU. For more information, please contact [email protected].
MD Ribbing Instability of Air
Knife Coating Application
A look at ribbing on the sheet caused by the film split of the coating application
� Bradley W. Fadden
Thesis Advisor
Dr. John Cameron with Dr. Kim Robinson of Fort James Corporation, Kalamazoo, Ml
Special thanks to Dr. Margaret Joyce
A Thesis submitted as partial fulfillment of
the course requirements for Paper 471
Western Michigan University
Kalamazoo, Michigan December 1997

Abstract:
The coating application process is an area of great concern for most mills that produce a
coated media. During the roll application of the coating onto the sheet, the fluid that is passed to
the sheet from the roll, goes through a process known as film splitting. Film splitting is the mechanism for the transfer of the fluid from the application roll to the sheet. Instead of smoothly
transferring onto the sheet, the film splits away from the roll and then onto the substrate. Without
even transfer and leveling of the coating fluid, the splitting results in stripes or ribs on the paper in
the machine direction. The result on the sheet is known as ribbing.
Fort James board mill of Kalamazoo, MI is currently experiencing this phenomenon with
their coated board. Dr. Kim W. Robinson, Director of Technology at Fort James, Kalamazoo,
has studied the ribbing effect, and it has been noticed that the ribbing follows a wave pattern in the machine direction transversely along the rolls. Ribbing is caused from the film split that is occurring between the roll and the sheet. The film split is a function of the low shear viscosity
(LSY) and high shear viscosity (HSY) of the coating fluid.
The HSY of the fluid is related to the transfer of the coating while the LSY is related to
the leveling effect of the coating. Good transfer and leveling of the coating yields good coating
coverage on the sheet. A measure of good coating coverage can be determined by calculating the
rheology index. The rheology index is the ratio of the HSY/LSY. Good coating surface appearance has been found at a rheology index of greater than 0.25 (3)
The viscosifier in the air knife coating formulation from FJ was replaced with
carboxymethyl cellulose (CMC) and hydroxyethyl cellulose (HEC). Each thickener was used at
low and medium molecular weights. The low shear viscosity was then calculated using the
dynamic stress simulator. Next, the high shear viscosity was calculated using the Hercules viscometer.
The results showed that none of the air knife coating formulations had a rheology index of
greater than 0.25. The greatest increase in rheology index came from the low molecular weight HEC.
In conclusion, air knife coating formulations have a propensity to rib. A small rheology
index of less than 0. 25 is an indicator towards ribbing. The reduced rheology index is a function of the solids content within air knife formulations In order to reach the rheology index of 0.25 or
greater, it is recommended that other factors within the formulation, such as the binder or
pigment, be changed along with the viscosifier
Introduction:
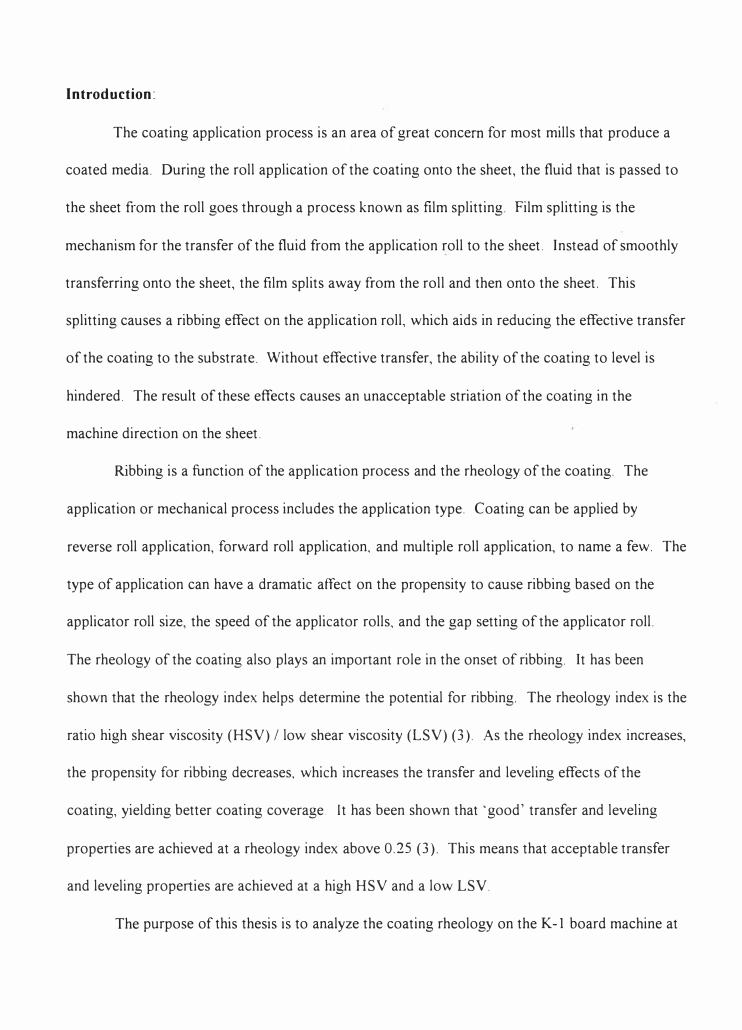
The coating application process is an area of great concern for most mills that produce a
coated media. During the roll application of the coating onto the sheet, the fluid that is passed to
the sheet from the roll goes through a process known as film splitting. Film splitting is the
mechanism for the transfer of the fluid from the application roll to the sheet. Instead of smoothly
transferring onto the sheet, the film splits away from the roll and then onto the sheet. This
splitting causes a ribbing effect on the application roll, which aids in reducing the effective transfer
of the coating to the substrate. Without effective transfer, the ability of the coating to level is
hindered. The result of these effects causes an unacceptable striation of the coating in the
machine direction on the sheet.
Ribbing is a function of the application process and the rheology of the coating. The
application or mechanical process includes the application type. Coating can be applied by
reverse roll application, forward roll application, and multiple roll application, to name a few. The
type of application can have a dramatic affect on the propensity to cause ribbing based on the
applicator roll size, the speed of the applicator rolls, and the gap setting of the applicator roll.
The rheology of the coating also plays an important role in the onset of ribbing. It has been
shown that the rheology index helps determine the potential for ribbing. The rheology index is the
ratio high shear viscosity (HSY)/ low shear viscosity (LSY) (3). As the rheology index increases,
the propensity for ribbing decreases, which increases the transfer and leveling effects of the
coating, yielding better coating coverage. It has been shown that 'good' transfer and leveling
properties are achieved at a rheology index above 0.25 (3 ). This means that acceptable transfer
and leveling properties are achieved at a high HSY and a low LSV.
The purpose of this thesis is to analyze the coating rheology on the K-1 board machine at
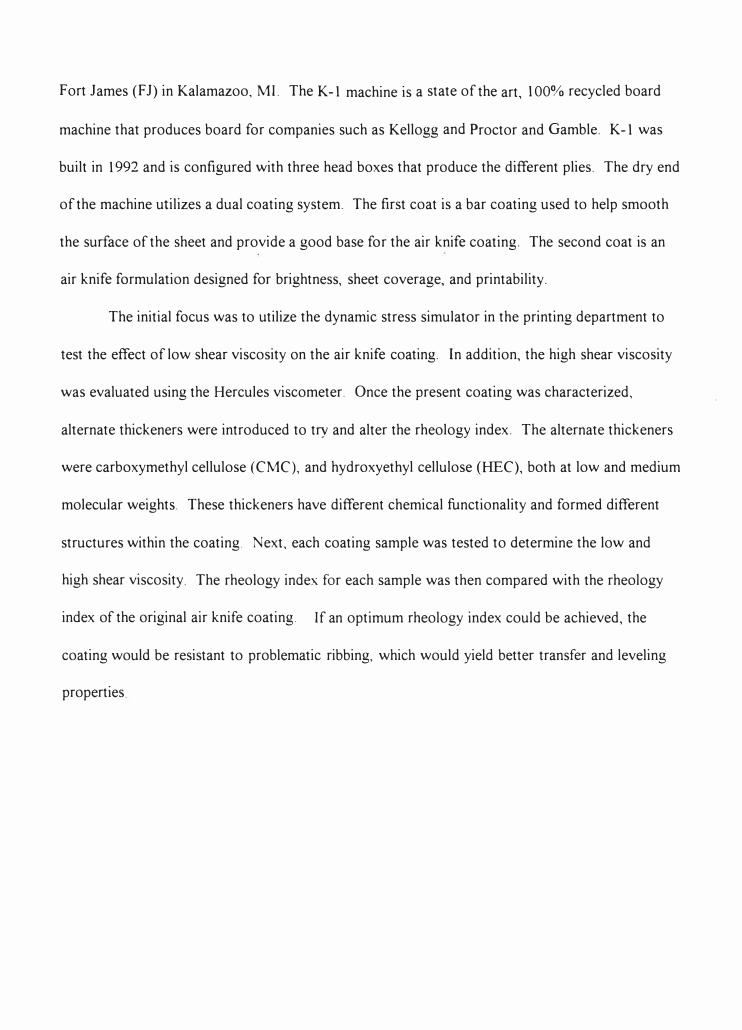
Fort James (FJ) in Kalamazoo, MI. The K-1 machine is a state of the art, 100% recycled board
machine that produces board for companies such as Kellogg and Proctor and Gamble. K-1 was
built in 1992 and is configured with three head boxes that produce the different plies. The dry end
of the machine utilizes a dual coating system. The first coat is a bar coating used to help smooth
the surface of the sheet and provide a good base for the air knife coating. The second coat is an
air knife formulation designed for brightness, sheet coverage, and printability.
The initial focus was to utilize the dynamic stress simulator in the printing department to
test the effect of low shear viscosity on the air knife coating. In addition, the high shear viscosity
was evaluated using the Hercules viscometer. Once the present coating was characterized,
alternate thickeners were introduced to try and alter the rheology index. The alternate thickeners
were carboxymethyl cellulose (CMC), and hydroxyethyl cellulose (HEC), both at low and medium
molecular weights. These thickeners have different chemical functionality and formed different
structures within the coating. Next, each coating sample was tested to determine the low and
high shear viscosity The rheology index for each sample was then compared with the rheology
index of the original air knife coating. If an optimum rheology index could be achieved, the
coating would be resistant to problematic ribbing, which would yield better transfer and leveling
properties
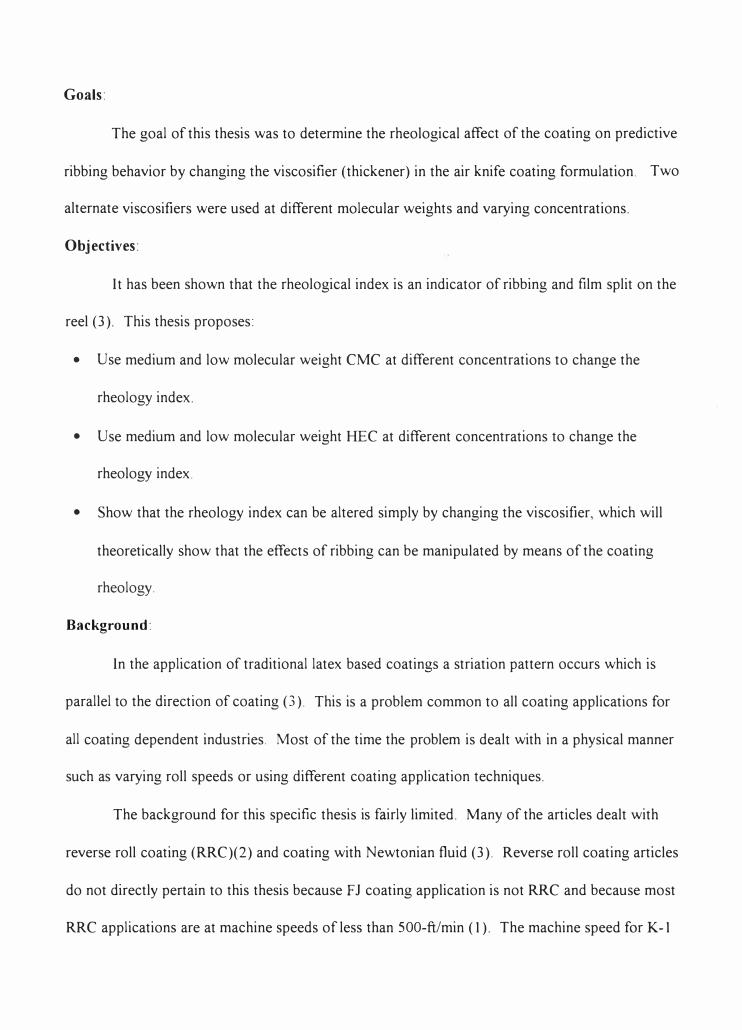
Goals:
The goal of this thesis was to determine the rheological affect of the coating on predictive
ribbing behavior by changing the viscosifier (thickener) in the air knife coating formulation. Two
alternate viscosifiers were used at different molecular weights and varying concentrations.
Objectives:
It has been shown that the rheological index is an indicator of ribbing and film split on the
reel (3). This thesis proposes:
• Use medium and low molecular weight CMC at different concentrations to change the
rheology index.
• Use medium and low molecular weight HEC at different concentrations to change the
rheology index.
• Show that the rheology index can be altered simply by changing the viscosifier, which will
theoretically show that the effects of ribbing can be manipulated by means of the coating
rheology.
Background:
In the application of traditional latex based coatings a striation pattern occurs which is
parallel to the direction of coating (3) This is a problem common to all coating applications for
all coating dependent industries. Most of the time the problem is dealt with in a physical manner
such as varying roll speeds or using different coating application techniques.
The background for this specific thesis is fairly limited. Many of the articles dealt with
reverse roll coating (RRC)(2) and coating with Newtonian fluid (3). Reverse roll coating articles
do not directly pertain to this thesis because FJ coating application is not RRC and because most
RRC applications are at machine speeds of less than 500-ft/min ( 1 ). The machine speed for K-1
ranges from 1000 - 1200 ft/min.
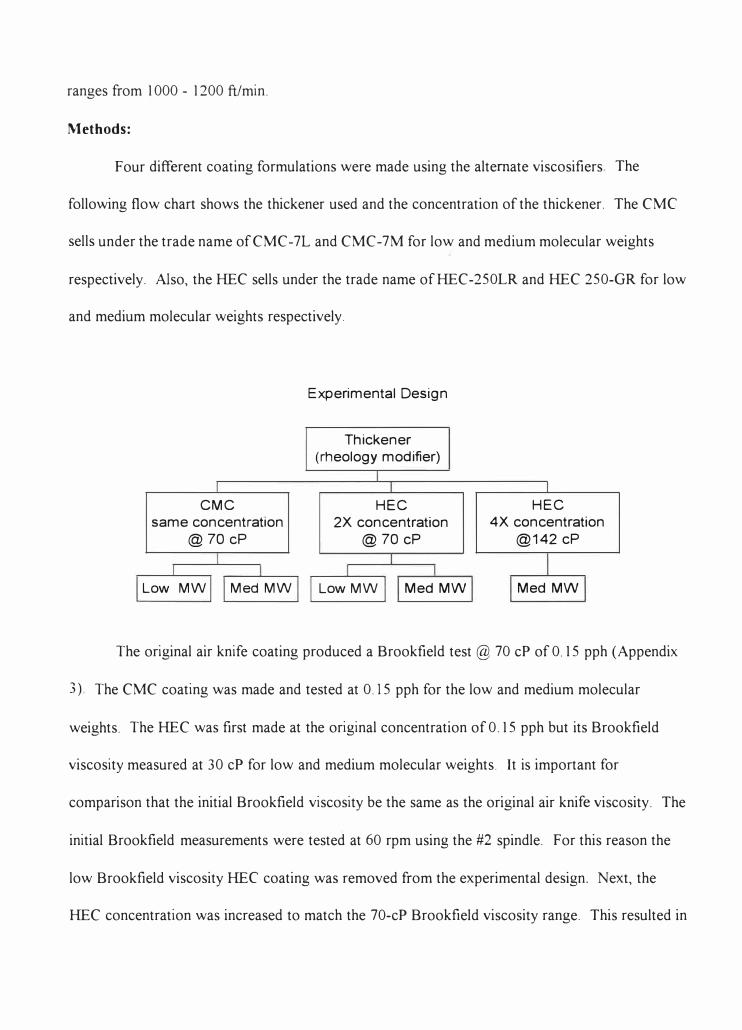
Methods:
Four different coating formulations were made using the alternate viscosifiers The
following flow chart shows the thickener used and the concentration of the thickener. The CMC
sells under the trade name of CMC-7L and CMC-7M for low and medium molecular weights
respectively. Also, the HEC sells under the trade name of HEC-250LR and HEC 250-GR for low
and medium molecular weights respectively.
CMC
same concentration
@70cP
Low MW Med MW
Experimental Design
Thickener
(rheology modifier)
HEC
2X concentration
@70 cP
Low MW Med MW
HEC
4X concentration
@142 cP
Med MW
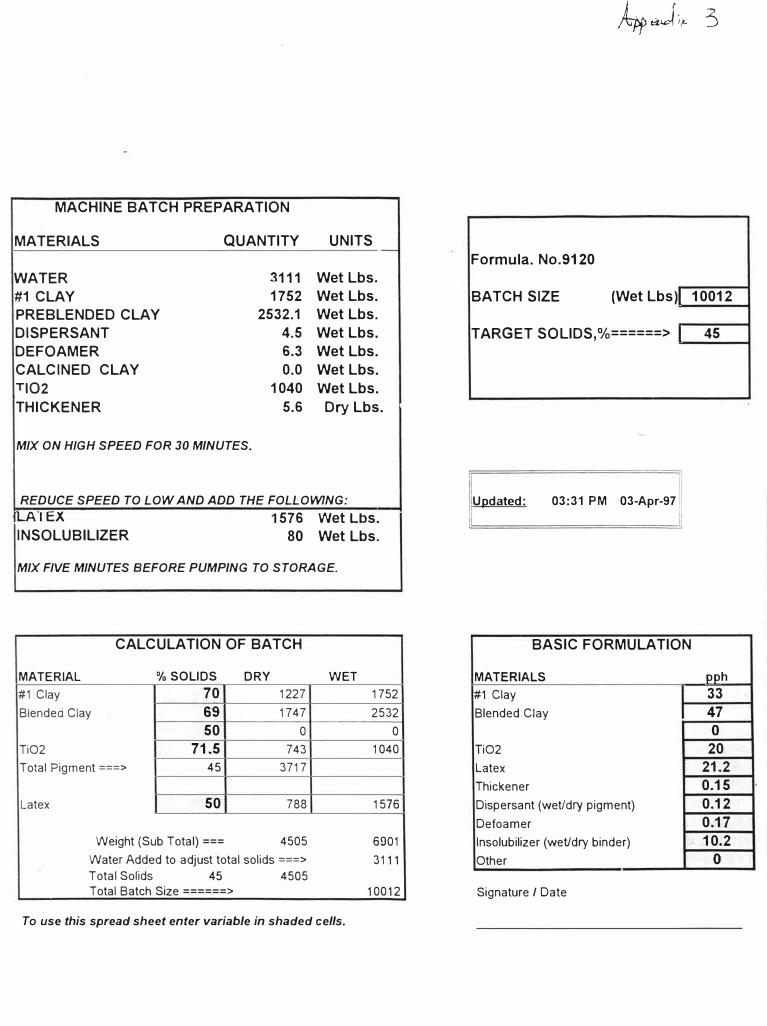
The original air knife coating produced a Brookfield test @ 70 cP of 0. 15 pph (Appendix
3) The CMC coating was made and tested at 0 15 pph for the low and medium molecular
weights. The HEC was first made at the original concentration of 0. 15 pph but its Brookfield
viscosity measured at 30 cP for low and medium molecular weights. It is important for
comparison that the initial Brookfield viscosity be the same as the original air knife viscosity. The
initial Brookfield measurements were tested at 60 rpm using the #2 spindle. For this reason the
low Brookfield viscosity HEC coating was removed from the experimental design. Next, the
HEC concentration was increased to match the 70-cP Brookfield viscosity range. This resulted in
doubling the concentration of the HEC to 0.60 pph. Finally, an additional batch ofHEC medium
molecular weight coating was prepared at 4X concentration with a Brookfield viscosity of 142
cP.
After the coating formulations were prepared they were subjected to low and high shear
viscosity testing. The Scientific Rheopectic viscometer was used to test for the low shear
viscosity. A double couette geometry was utilized to test the dynamic frequency sweep, dynamic
stress sweep, and a steady stress sweep. All coatings were pre-sheared at 50 dynes/cm2 for 30
seconds and allowed to recover for 300 seconds before testing. The Brookfield viscometer was
used to test the HSY. The HSY data was used to plot rpm vs. torque and apparent viscosity vs.
shear rate.
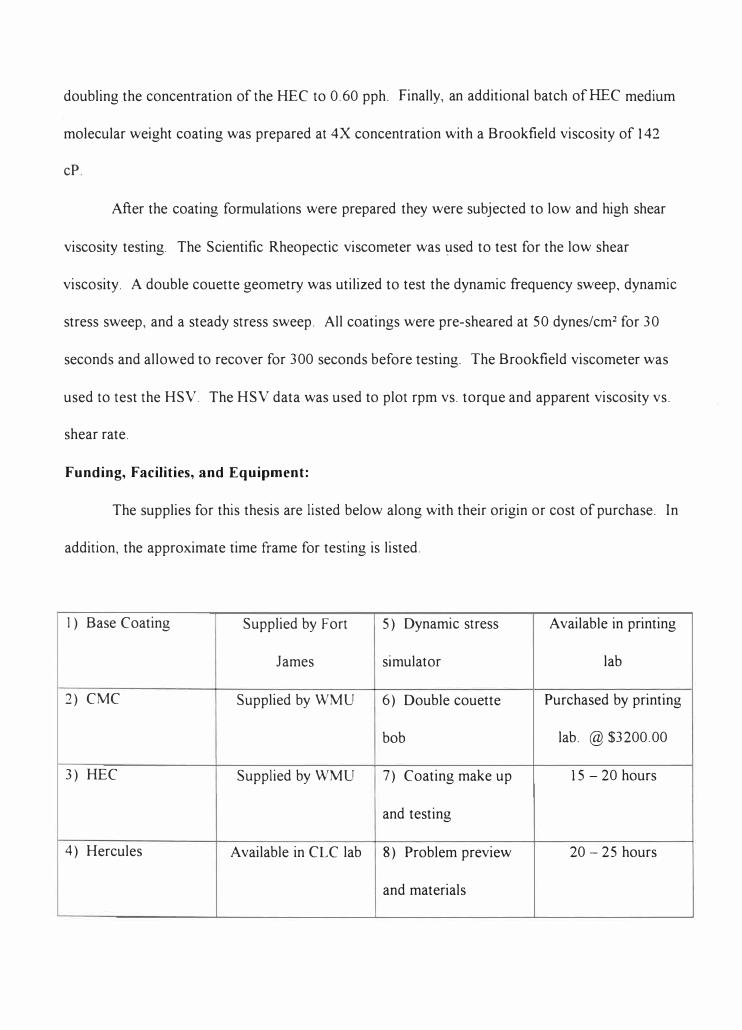
Funding, Facilities, and Equipment:
The supplies for this thesis are listed below along with their origin or cost of purchase. In
addition, the approximate time frame for testing is listed.
I) Base Coating
2) CMC
3) HEC
4) Hercules
Supplied by Fort
James
Supplied by WMU
Supplied by WMU
Available in CLC lab
5) Dynamic stress Available in printing
simulator lab
6) Double couette Purchased by printing
bob lab. @ $3200.00
7) Coating make up 15 - 20 hours
and testing
8) Problem preview 20 - 25 hours
and materials
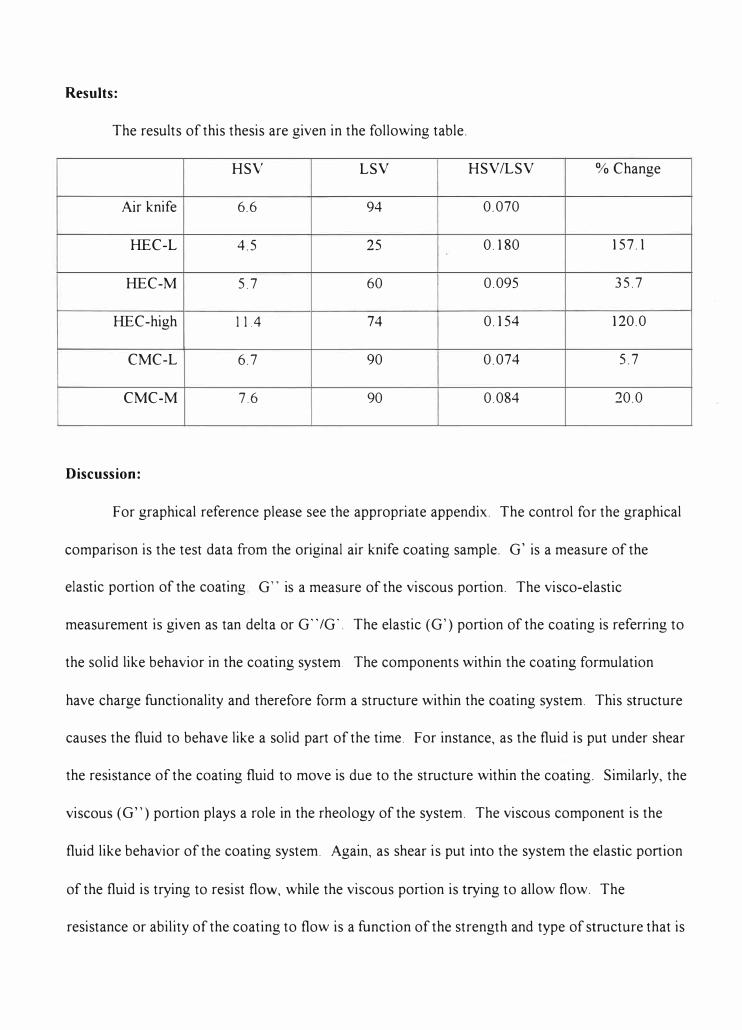
Results:
The results of this thesis are given in the following table.
HSY LSV HSV/LSV % Change
Air knife 6.6 94 0.070
HEC-L 4.5 25 0.180 157. l
HEC-M 5.7 60 0.095 35.7
HEC-high 114 74 0.154 120.0
CMC-L 6.7 90 0.074 5.7
CMC-M 7.6 90 0.084 20.0
Discussion:
For graphical reference please see the appropriate appendix. The control for the graphical
comparison is the test data from the original air knife coating sample. G' is a measure of the
elastic portion of the coating G" is a measure of the viscous portion. The visco-elastic
measurement is given as tan delta or G" /G ·. The elastic (G') portion of the coating is referring to
the solid like behavior in the coating system. The components within the coating formulation
have charge functionality and therefore form a structure within the coating system. This structure
causes the fluid to behave like a solid part of the time. For instance, as the fluid is put under shear
the resistance of the coating fluid to move is due to the structure within the coating. Similarly, the
viscous (G") portion plays a role in the rheology of the system. The viscous component is the
fluid like behavior of the coating system. Again, as shear is put into the system the elastic portion
of the fluid is trying to resist flow, while the viscous portion is trying to allow flow. The
resistance or ability of the coating to flow is a function of the strength and type of structure that is
built within the coating. As the shear rate increases the structure begins to yield or breakdown
and the fluid begins to flow. This is known as a shear thinning effect and is indicative of coating
systems. An explanation of the following graphs will give a further description of the rheology of
the coating formulation.
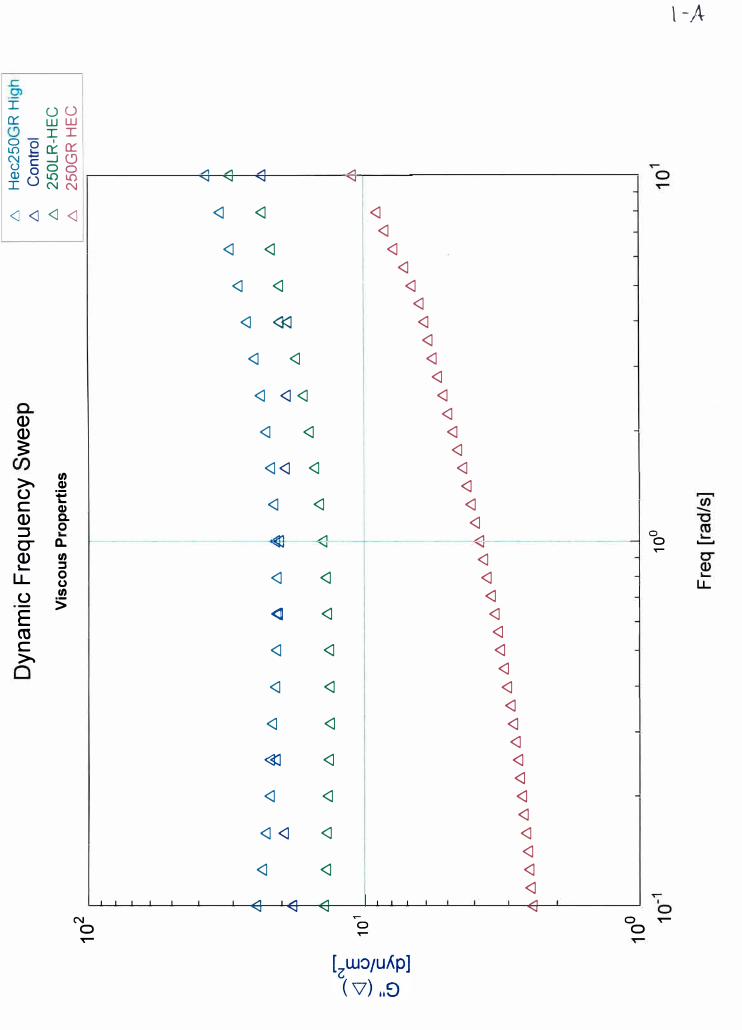
Appendix 1-A is a comparison of HEC at low and medium molecular weights with the
control. In addition, the high concentration HEC is also compared. This graph is the measure of
the amount of viscous structure that is built within the coating by the thickener. It is also a
measure of the type of structure that is being built. The results indicate that the medium
molecular weight HEC at the 2X concentration is significantly lower than the HEC-LR and the
high concentration HEC-GR This means that the HEC medium molecular weight did not build as
much structure as the other HEC samples or the original air knife coating. In addition, the
upward slope indicates that the structure is actually due to polymeric entanglement and may not
be a complete measure of the bonding structure.
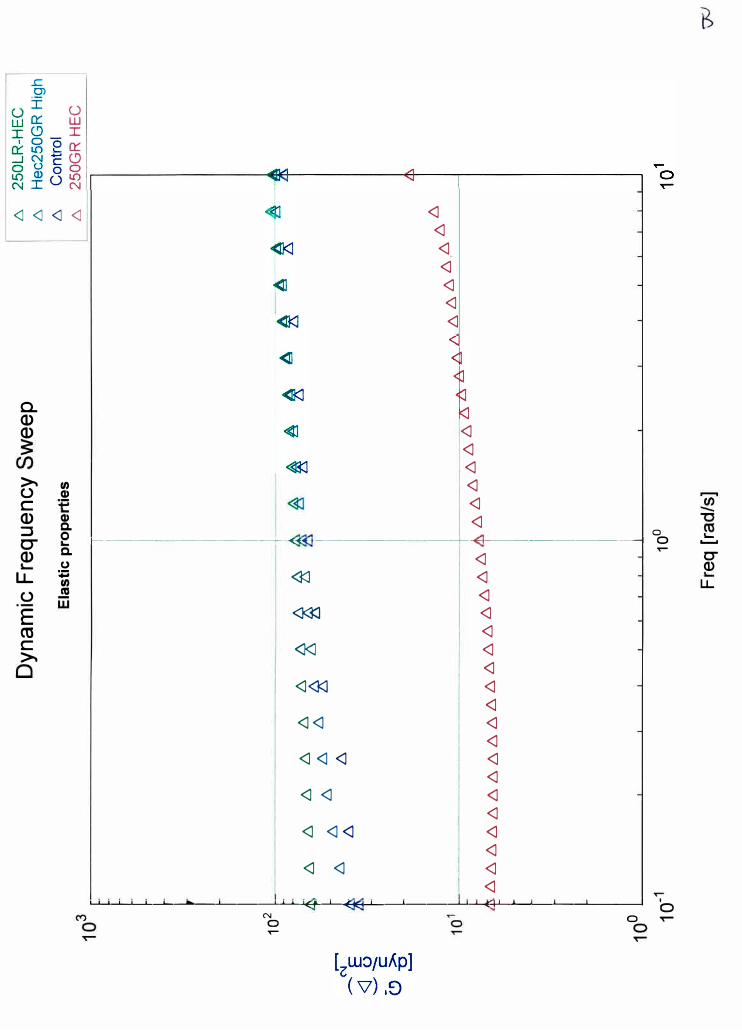
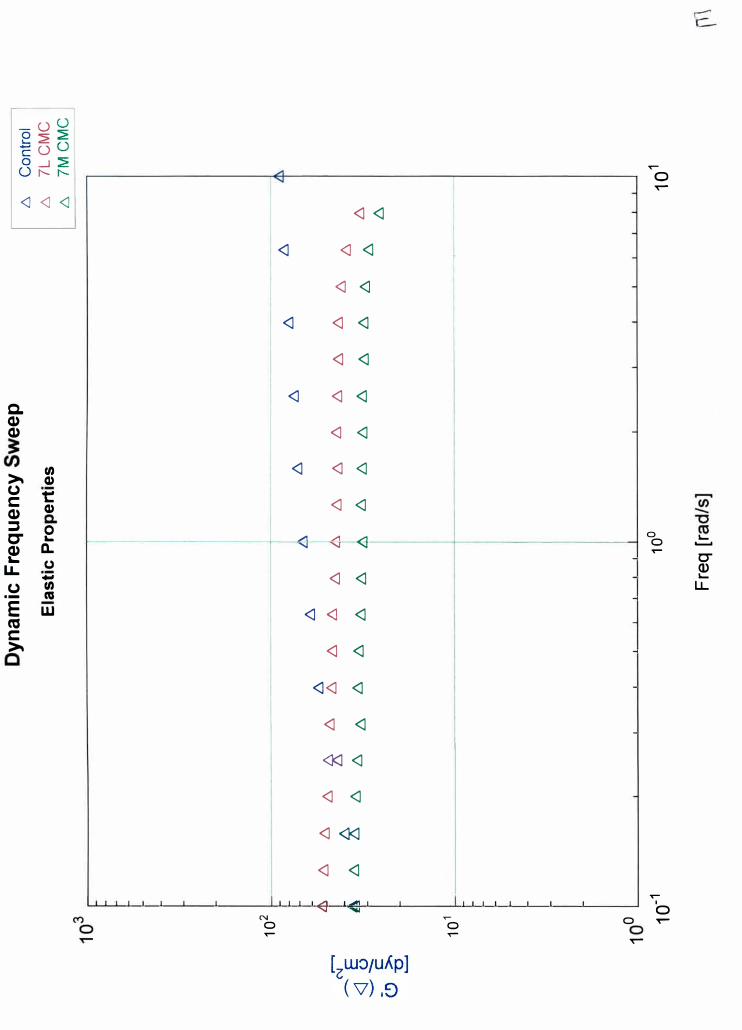
Appendix 1-B is a similar comparison of the HEC thickeners with the control. This
measurement is of the elastic portion of the coating formulation. This reinforces the previous data
and shows that the HEC medium is significantly lower in the elastic structure of the coating. This
further shows that the polymers within the coating may be entangled, although the upward slope
is much less pronounced.
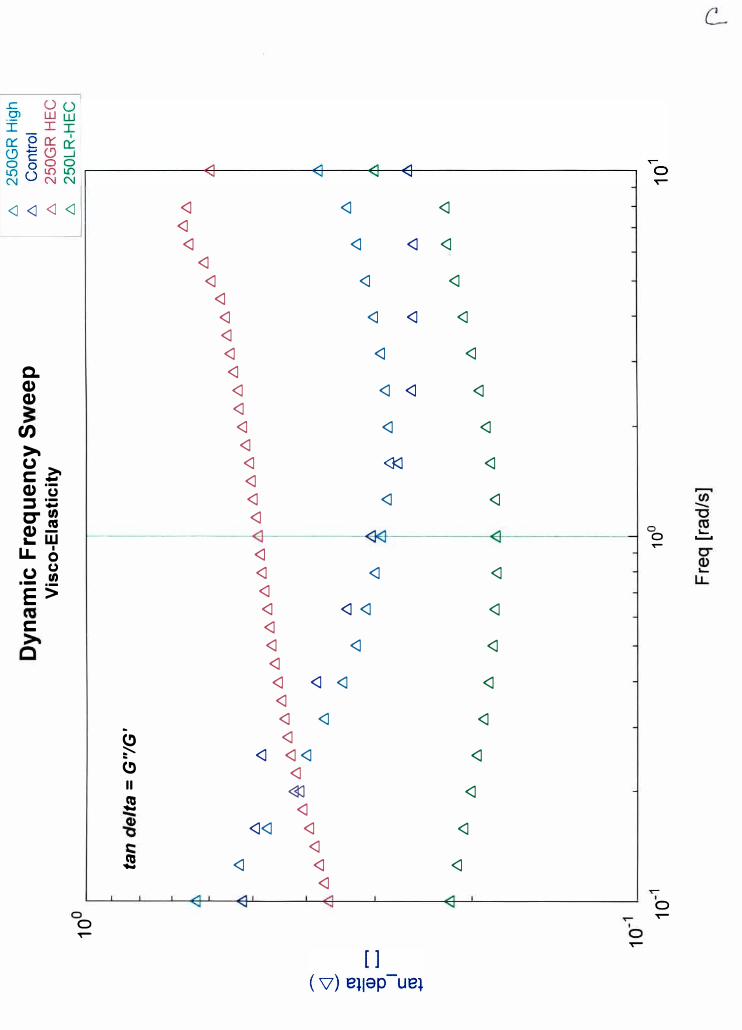
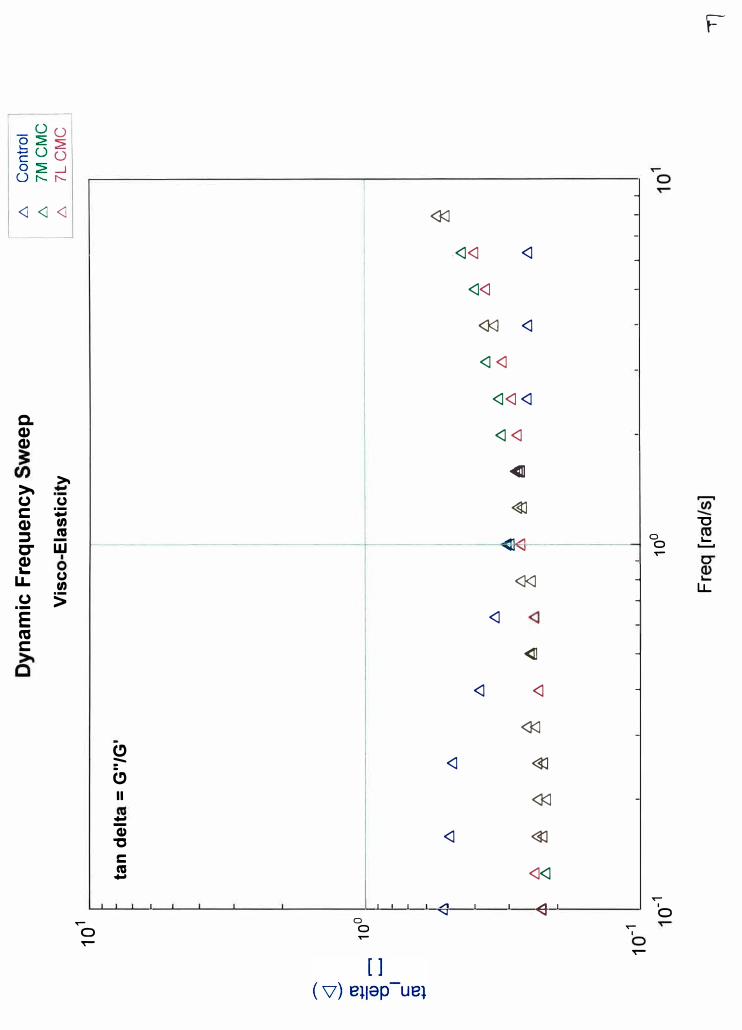
Appendix 1-C is the visco-elastic measurement of the HEC modifiers. The visco-elastic
data is a measurement of the ratio of the viscous portion / elastic portion. The visco-elastic
behavior is the expected result based on the viscous and elastic data of the previous two graphs.
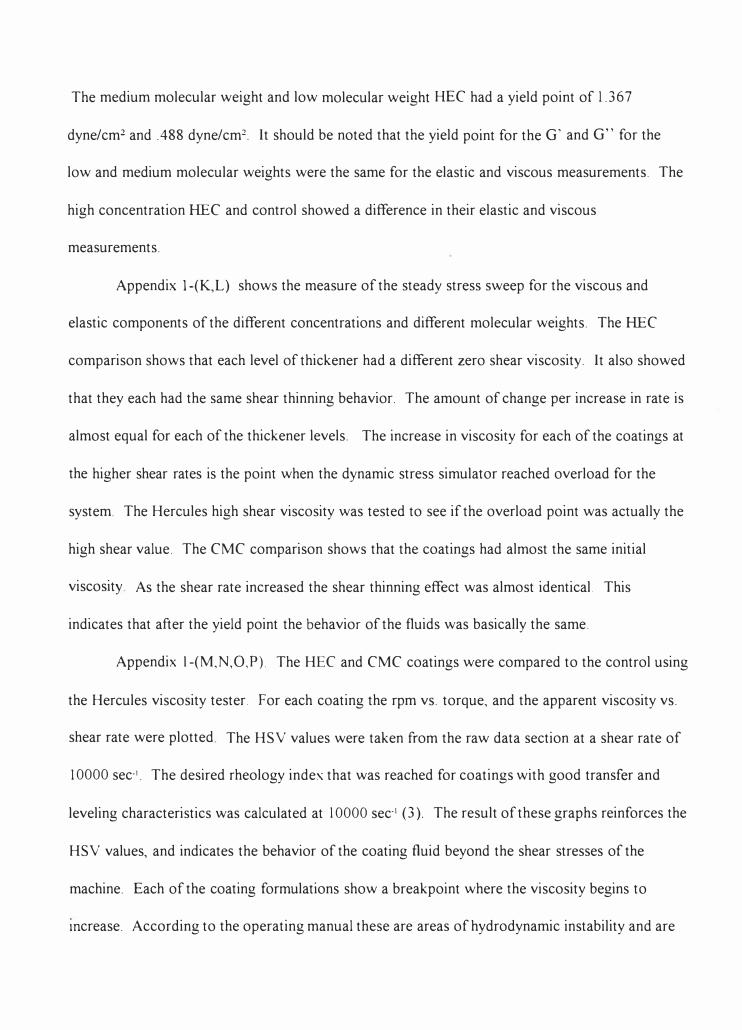
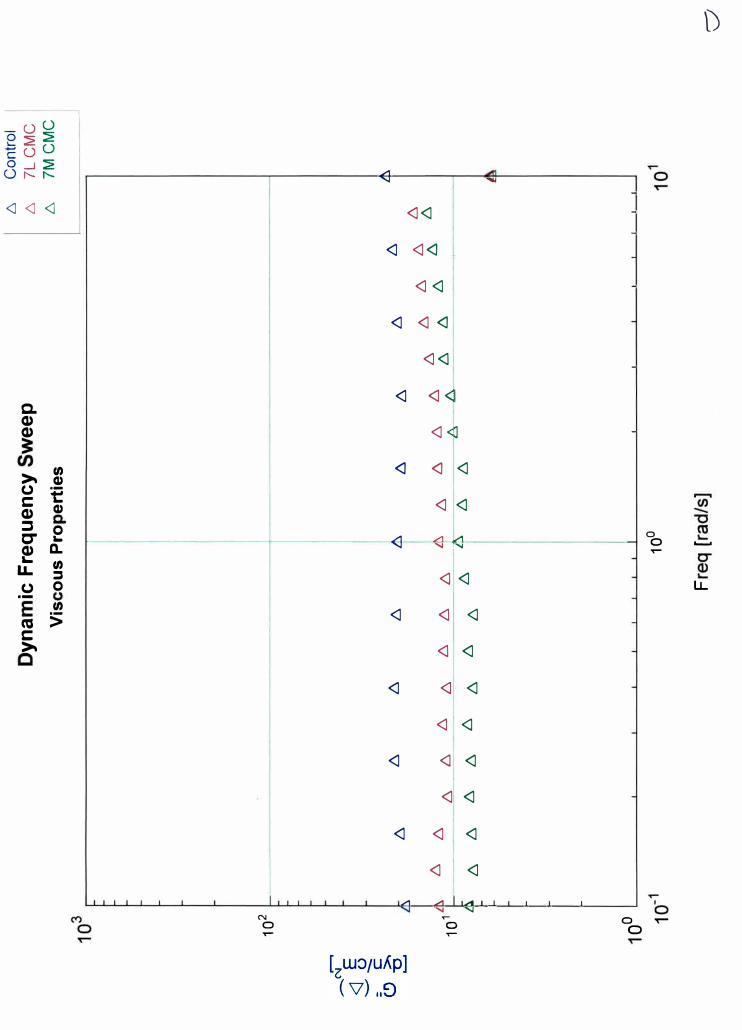
Appendix 1-{D,E, F) is a comparison of the CMC thickeners with the control. This data
shows that there is not much difference in the viscous coating structure when the original
thickener is replaced with the low or medium molecular weight CMC. The small upward slope is
too low in the order of magnitude to conclude that there is polymeric entanglement. A similar
comparison of the CMC with the control for the elastic measurement of the coating fluid is also
shown. As with the viscous portion there was very little difference in the elastic structure with the
addition of CMC.
The dynamic frequency testing was measured to give a basis for the structural integrity of
each of the coating formulations. These tests were further used to back up other testing such as
the steady stress sweep. If there was a great deal of structure then the coating could have a large
shear thinning effect. The dynamic frequency sweep information is used to validate further
findings when testing the viscosity
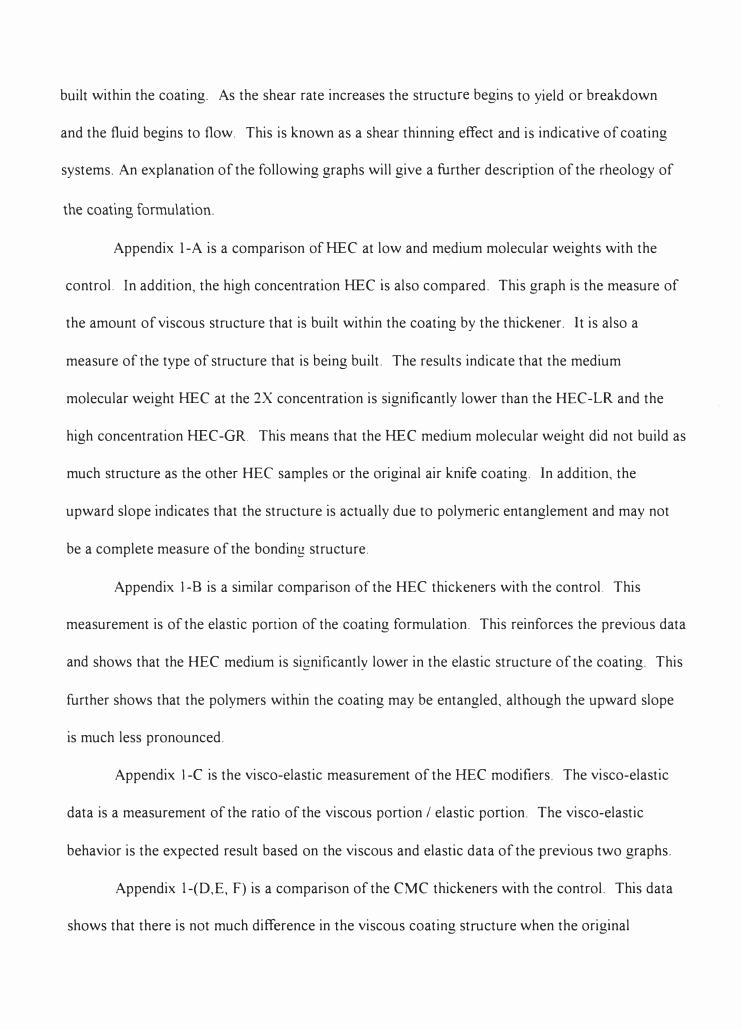
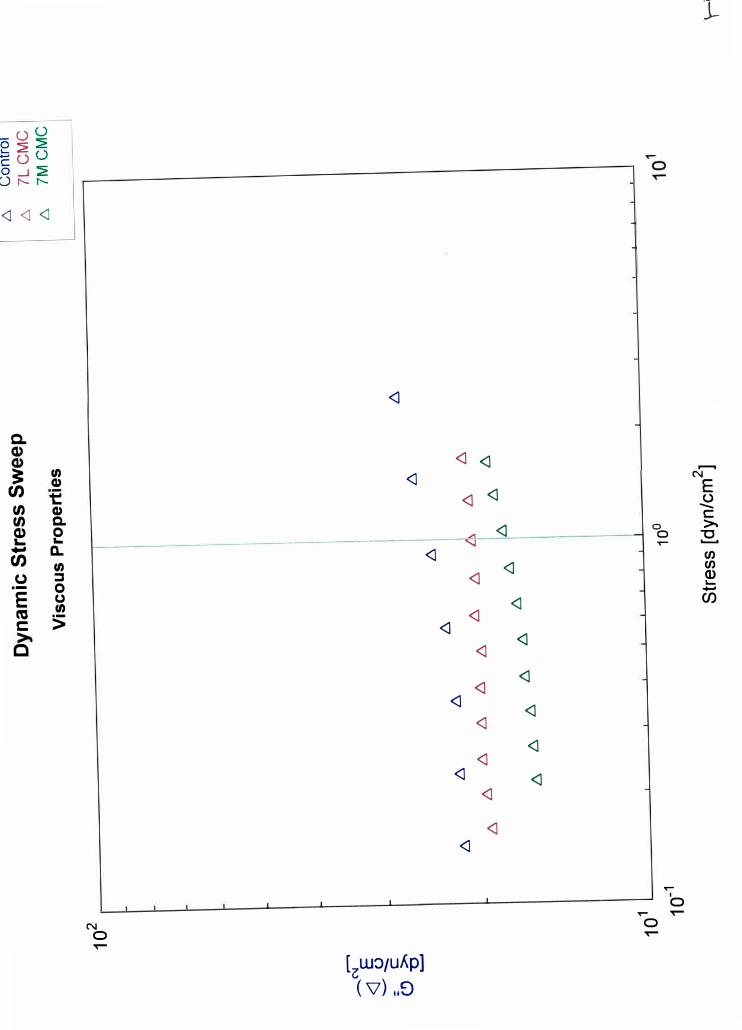
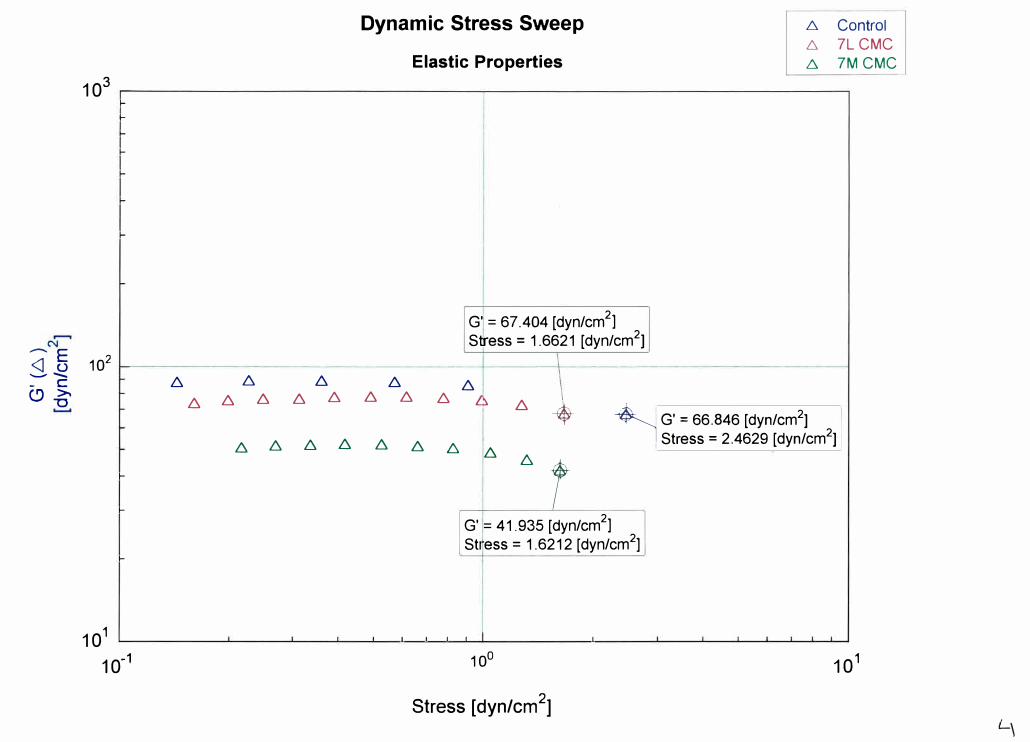
The next set of graphs is measuring the dynamic stress sweep. This comparison shows
that as stress is added to a coating system there is a point where the line begins to drop. This
drop point is called the yield point. The yield point is where the coating structure begins to break
down and the coating begins to flow. The 'y' axis gives the amount of structure within the
coating while the 'x' axis shows how strong the structure is in terms of how much stress it took
for the structure to begin to yield.
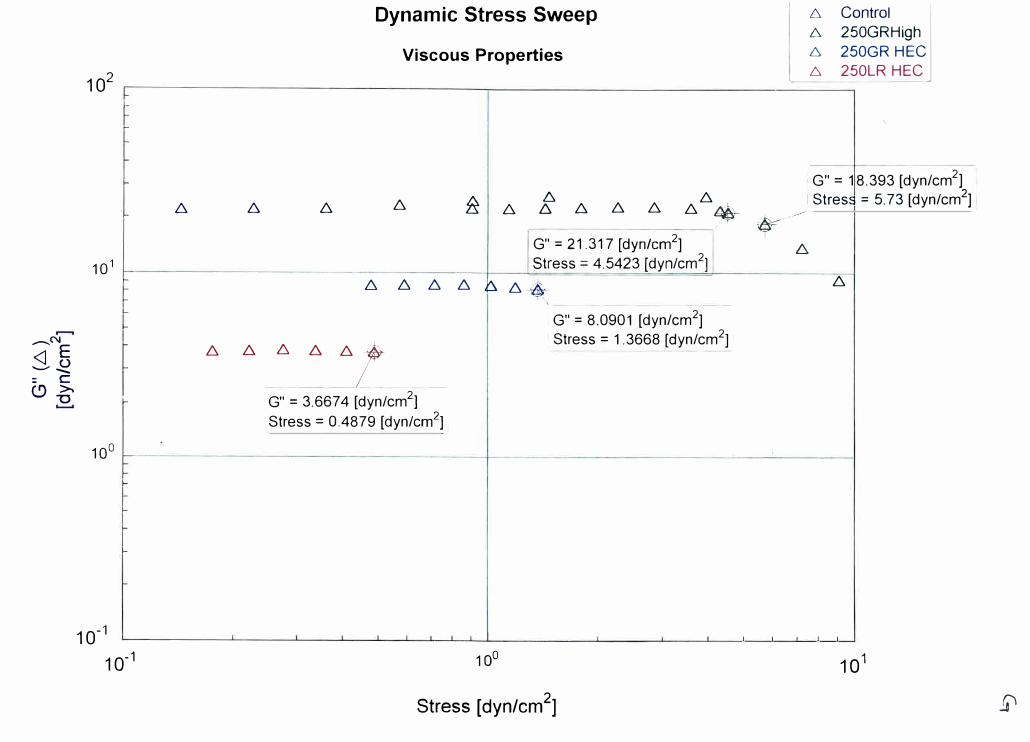
Appendix 1-(G,H) is the dynamic stress sweep for the HEC coatings. The control and
HEC at the high concentration started with the same amount of structure and both failed around 5
dyne/cm2. The medium molecular weight started with less structure and failed at a stress of
@I. 3 6 7 dyne/ cm2. The low molecular weight HEC had the least amount of structure and failed at
the lowest stress of 0.488 dyne/cm2.
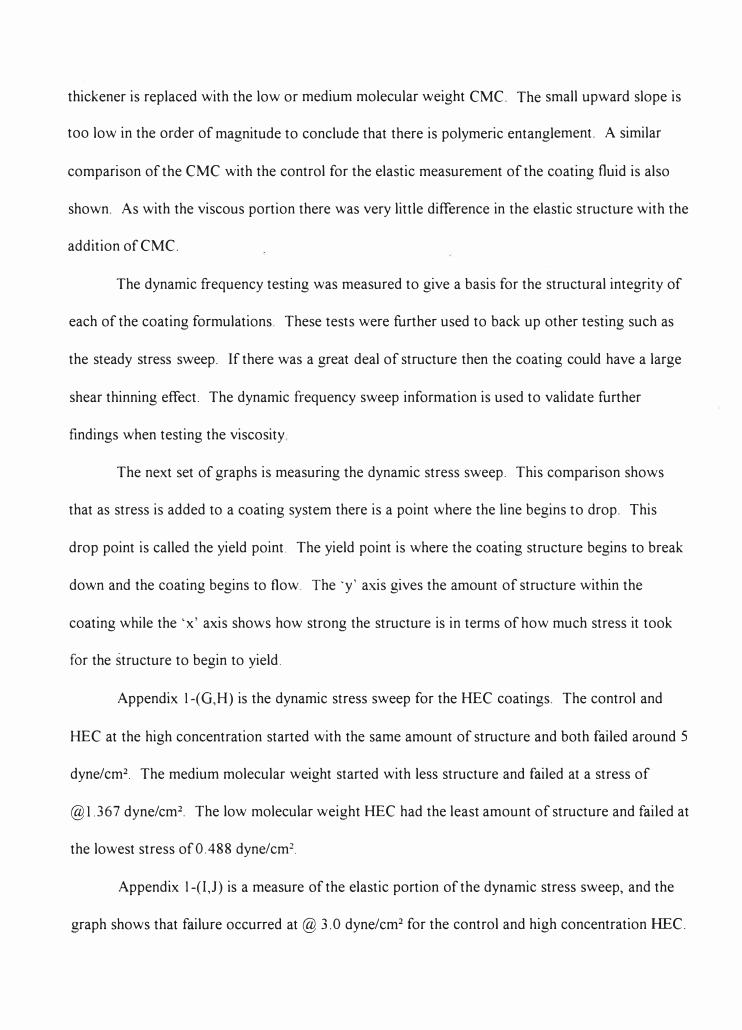
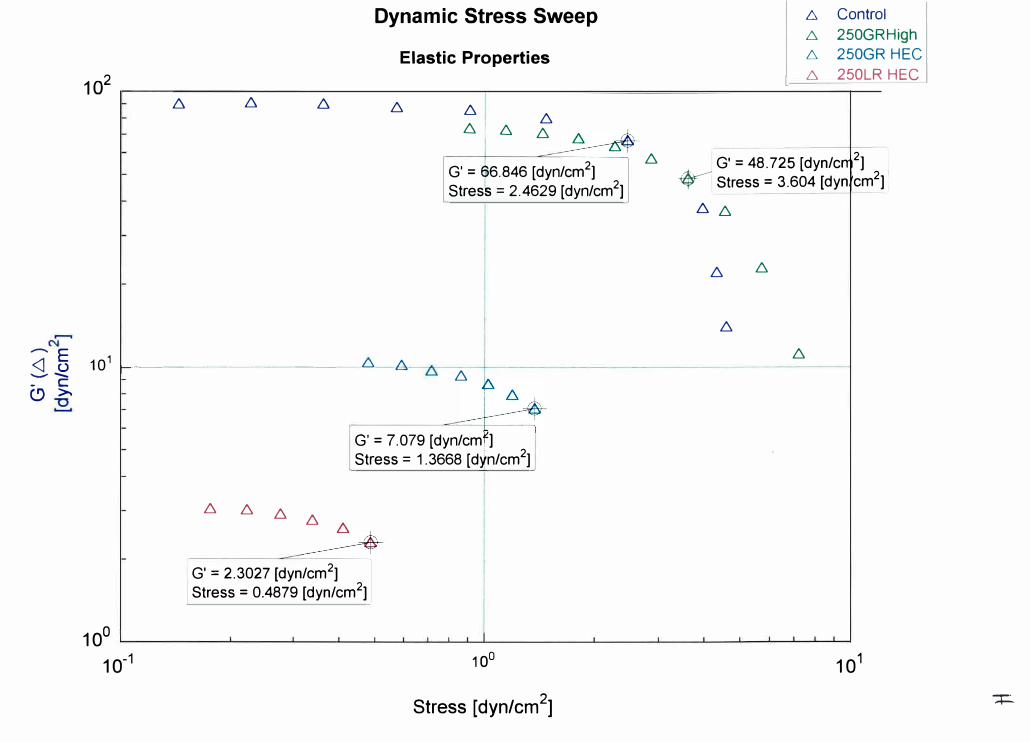
Appendix 1-(1,J) is a measure of the elastic portion of the dynamic stress sweep, and the
graph shows that failure occurred at@ 3.0 dyne/cm2 for the control and high concentration HEC.
The medium molecular weight and low molecular weight HEC had a yield point of 1.367
dyne/cm2 and .488 dyne/cm2. It should be noted that the yield point for the G' and G" for the
low and medium molecular weights were the same for the elastic and viscous measurements. The
high concentration HEC and control showed a difference in their elastic and viscous
measurements.
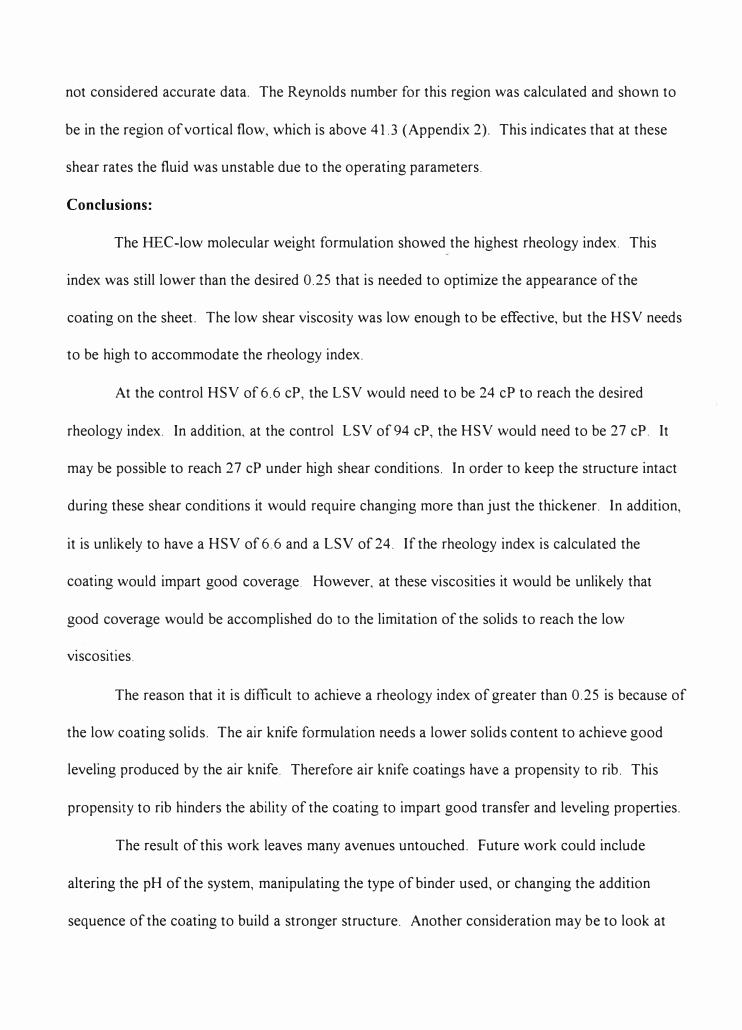
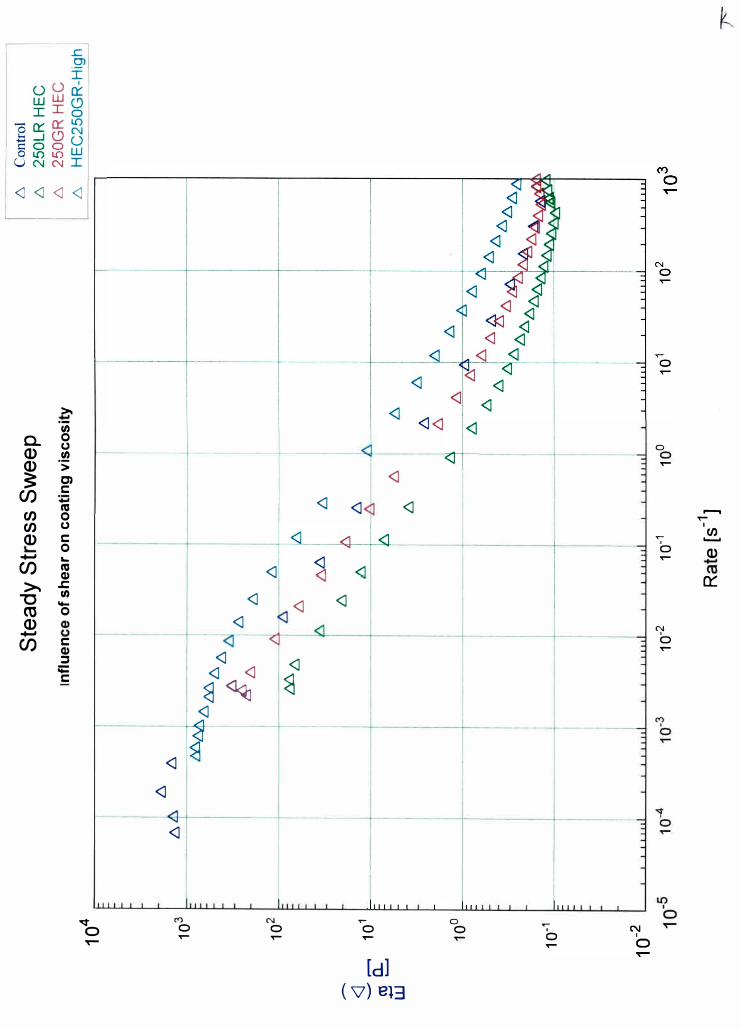
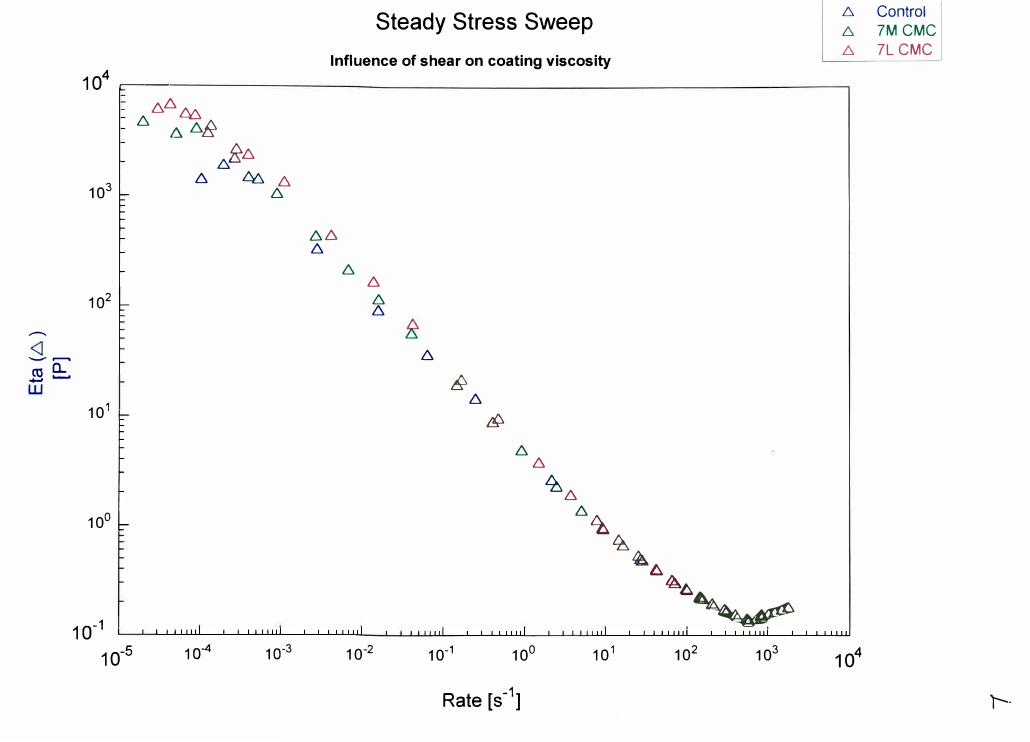
Appendix 1-(K,L) shows the measure of the steady stress sweep for the viscous and
elastic components of the different concentrations and different molecular weights. The HEC
comparison shows that each level of thickener had a different zero shear viscosity. It also showed
that they each had the same shear thinning behavior. The amount of change per increase in rate is
almost equal for each of the thickener levels. The increase in viscosity for each of the coatings at
the higher shear rates is the point when the dynamic stress simulator reached overload for the
system. The Hercules high shear viscosity was tested to see if the overload point was actually the
high shear value. The CMC comparison shows that the coatings had almost the same initial
viscosity As the shear rate increased the shear thinning effect was almost identical. This
indicates that after the yield point the behavior of the fluids was basically the same.
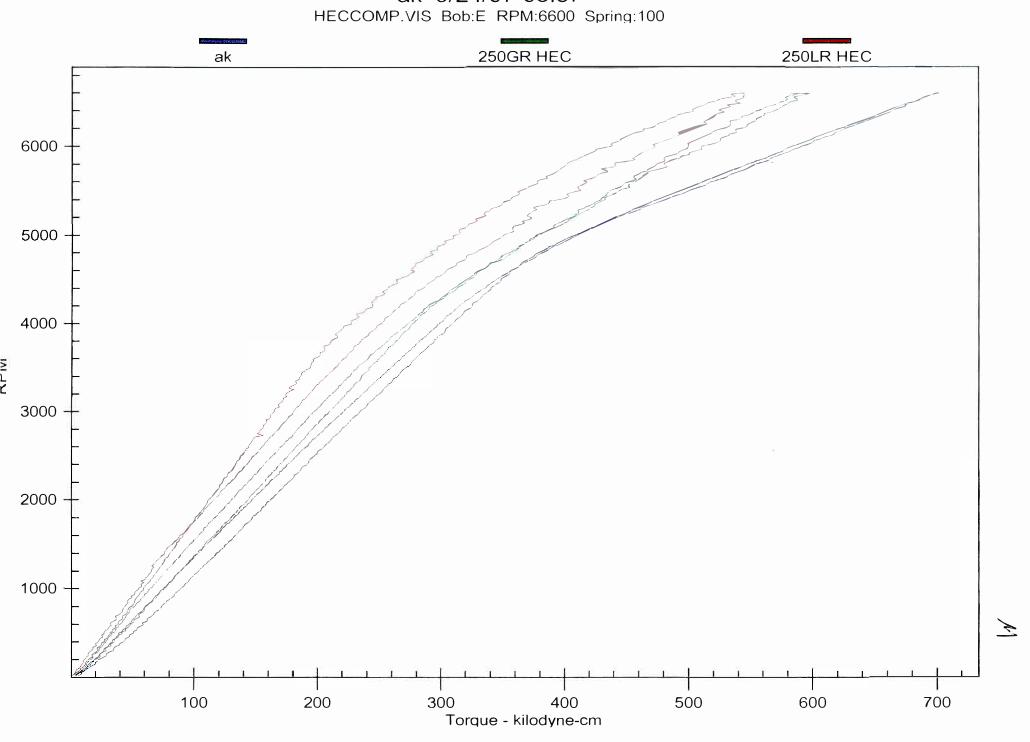
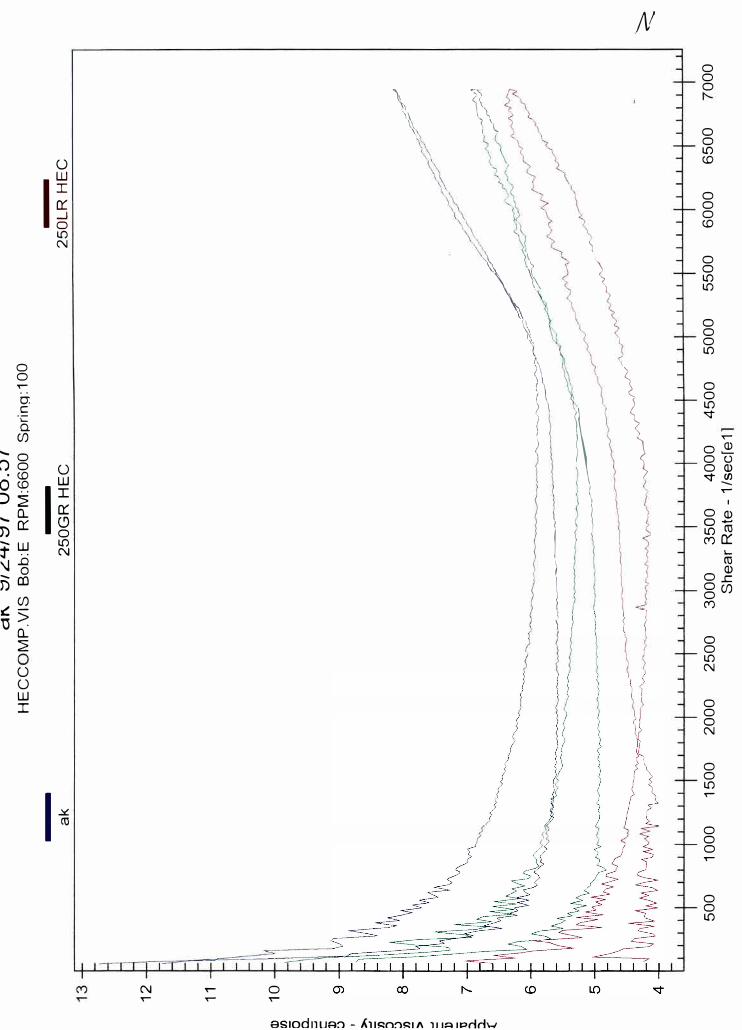
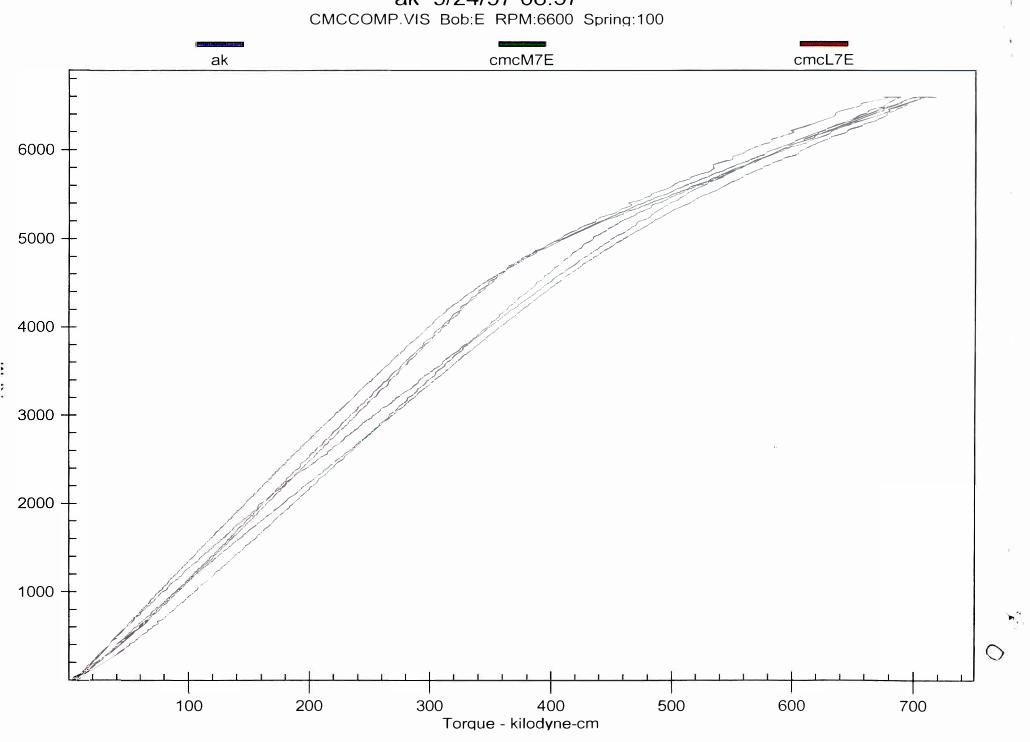
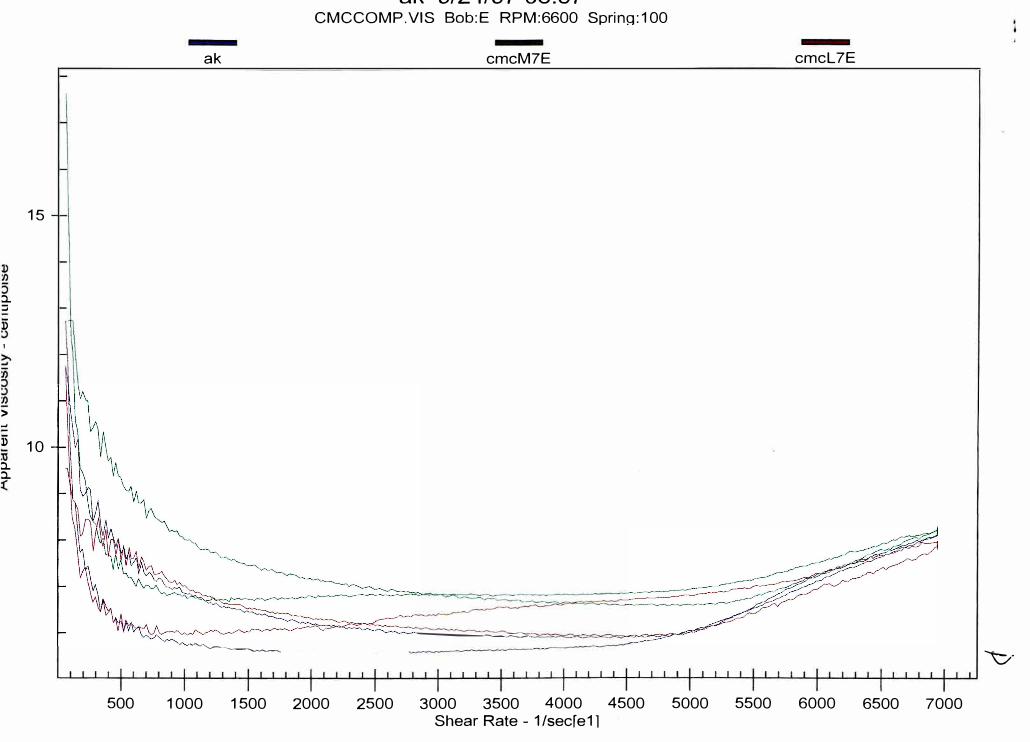
Appendix 1-(M,N,O,P) The HEC and CMC coatings were compared to the control using
the Hercules viscosity tester. For each coating the rpm vs. torque, and the apparent viscosity vs.
shear rate were plotted The HSY values were taken from the raw data section at a shear rate of
I 0000 sec· 1• The desired rheology index that was reached for coatings with good transfer and
leveling characteristics was calculated at I 0000 sec· 1 (3 ). The result of these graphs reinforces the
HSY values, and indicates the behavior of the coating fluid beyond the shear stresses of the
machine. Each of the coating formulations show a breakpoint where the viscosity begins to
mcrease. According to the operating manual these are areas of hydrodynamic instability and are
not considered accurate data. The Reynolds number for this region was calculated and shown to
be in the region of vertical flow, which is above 41.3 (Appendix 2). This indicates that at these
shear rates the fluid was unstable due to the operating parameters.
Conclusions:
The HEC-low molecular weight formulation showed the highest rheology index. This
index was still lower than the desired 0.25 that is needed to optimize the appearance of the
coating on the sheet. The low shear viscosity was low enough to be effective, but the HSY needs
to be high to accommodate the rheology index.
At the control HSY of 6.6 cP, the LSY would need to be 24 cP to reach the desired
rheology index. In addition, at the control LSY of 94 cP, the HSY would need to be 27 cP. It
may be possible to reach 27 cP under high shear conditions. In order to keep the structure intact
during these shear conditions it would require changing more than just the thickener. In addition,
it is unlikely to have a HSY of 6 6 and a LSY of 24. If the rheology index is calculated the
coating would impart good coverage. However, at these viscosities it would be unlikely that
good coverage would be accomplished do to the limitation of the solids to reach the low
viscosities.
The reason that it is difficult to achieve a rheology index of greater than 0.25 is because of
the low coating solids. The air knife formulation needs a lower solids content to achieve good
leveling produced by the air knife Therefore air knife coatings have a propensity to rib. This
propensity to rib hinders the ability of the coating to impart good transfer and leveling properties.
The result of this work leaves many avenues untouched. Future work could include
altering the pH of the system, manipulating the type of binder used, or changing the addition
sequence of the coating to build a stronger structure. Another consideration may be to look at

changing the type of coating application. For instance, if a rheology index of O .25 proves to be a
legitimate target for increasing coating appearance, it may be possible to obtain that by replacing
the air knife system with a different system. An additional hindrance of the air knife system is its
limitation with respect to speed. In order to increase machine speed and increase coating
appearance, it may be necessary to apply the topcoat with a rod coater. Rod coaters run at higher
solids and it would be easier to achieve a rheology index of 0.25 or greater.
I 00
O:'.'. WW
II Q Q I Q:'.'. L!) .... O:'.'.
N-_.J(.'.) u
coo
(].) 0 I.() I.() IONN
<l <l <l <l
Q)
Q) �
"' >- Q)
u t:C Q)
Q) C. ::J
0
O'" a.
Q) "'
I,,_ ::::s
LL 0 0
u "'
E >
ro C
>-
N 0 T"""
I I I I I I
,.., ,.., "',j "',j
<J
<J
<J
<J
A
"',j
<J
<J
<J
«J
<J <J
<J <J <J
<J <J
<J<J <J
<J <I
-- A .... ""
<I <I
<JI <I
<J <J
<J <I
<J <I
«] <I
<J <J
<J <J <I
<J <I
I _A ,,,., A
"',j "',j "',j
A
"',j
� 0 .....
<J
<J
<J
<J
<J
<J
<J
<J
<J
<J
<J
<J
<J
<J
<J
<I
<I
<J
I I I
A ""
<I
<I
<I
<I
<J
<I
<I
<I
<I
<I
<I
<I
<J
<I
<I
<I
<I
<I
<I A
"',j
-
0 0 .....
-
-
0 T"""
0
l -A
........
LL
<l <l <l <l
a.
Q)
Q)
� (.) C Q) :::J O" Q)
LL
(.)
E ro C �
"' (1)
(1) C. 0
C.
0 :.:; "'
.!!!
<] <] <] <] <] <] <]
<] <] <] <] <] <]
0 1----------+------«�---- ---+--<-+----------1 0 .....
«1
<J<3::J
<l<J
<]<}(]
<]<]
<] <l <]
<] <]
<] <] <]
<] <]
<] <] <] <] <] <] <l <] <l <] <] <] <] <l <] <] <] <] <]
L.J_J,-'----JL......J....---'---'----'---------L...L...L�_.L._�f-L-------1----1.....L---1....<l;::j-1-.J..........JL..,__J....._----1.... _ _____J 0 N 0 ...---
0 T"""
I,,_ ........
C" Q)
LL
<J <J <J <J
a. C1) C1)
en
�
(.) >iC: -C1) ·c:;:::, ; C'" ti) C1) .!... w
LL o(.) � ·- ·-
e >
C:
0 .,.-
.
� (!) II
.s
.s
<l
<l
<l
<l
<l
<l
<l
<l
<l
<l
<l
<l
<l
<l
<l
<l
<l
<l
<l
<l
<l
<l
<l
<l
<l
<l
<l
<l
<l
<l
<l
<l <l <l
<l
«] <l
<l<l <l
<l
<l <l
<l
<l
<l <l
<l
<l <l
<l
<l <l
<l
<l(J
<l
<l
<l <l
<l
<l
<l
<l
<l
<l
<l
<l
<l
<l
<l
<l
<l
<l
<l
<l
<l
<l
<l
<l
0 i... 0 ........ .....
i...
0 .,.-
.,.-
<] <] <]
Q. G) G)
,,, � Cl) (.) :e C G)
Cl)
:::::, 0 C" ...
G) a.Lo
,,,LL ::::,(.) 0·-
,,,
cu > C �
N 0 .....
/I"' -
<]<]
<] <J <]
<] <]
<] <] <]
<]<]
<] <] <
<J <J
<] <] <]
<] <]
/I .,.., ""'"' "' I"'
<J <]
<J <] <J
<] <]
<] <J <]
<J <J
<] <J <]
<] <]
<] <] <]
<] <]
,,., .,.., .A I _J "' "' ..---0 .....
I I I
-
-
-
-
-
-
0 0 .....
0 T""" 0
D
.......
LL
<J <J <J
C. Q) Q)
U) � Q) (.)
t:: t:
Q) Q)
::J 0 C" ...
e a.
(.) LL -
(.) U) ·- cu
E w
cu t: �
I o I I
N 0 ......
<] <]
<] <] <]
<] <]
<] <] <]
<] <]
<J <] <]
<J <]
<] <J <]
<J <]
,.A .A _....,� � �
<] <]
<J <] <]
<] <]
<]<] <]
<] <]
<l<J <J
<] <J
<J <l<J
<] <]
I I I O A ,.- ' '-I --
I I O O I I ' I ' � 0 ......
-
-
-
-
-
-
...... 0 �
0 0 ......
......
0 0 �
�
I... ........
C"' Q) I...
LL
<J <J <J
Q. Q) Q)
� � CJ u
C .:; Q) (/)
::::s C'a
C" w
Q) ...
u LL (/)
CJ > ·-
E n, C
(!) =-(!)
II
--
Cl) "0
C: C'a -
..-0 T""
' 0 0 ..-
I ' o
<Kl
<l<l <l
<l<l
<I<] <l
<l <l
<l<l <l
<l <l
4
�
_ _,, """"'
<l<l
<l
<ll
<l <l
<Kl
<l <ti
<Kl
<l <ti
<l<l
' ,.. ' ' A' 'I 'I
-
-
-
-
-
-
-
-
-
-
-
..-1
T""
F
"'C
0 lo... 0 ........ ..-
lo...
LL
..-
0
-1=<l (.) ...._, -- C
- >-(9 "O
102
10 1
10°
10- 1
Dynamic Stress Sweep
Viscous Properties I
'-
-
,0,. Control j ,0,. 250GRHigh ,0,. 250GR HEC 1:::,. 250LR HEC
\
L , G" = 18.393 [dyn/cm2]
" 6 6 6 6 fr. 6 /; 6 6 6 6 6 * Stres, = 5. 73 [dyn/cm2]
G" = 21.317 [dyn/cm2] �
_ Stress - 4.5423 [dyn/cm2]
� 6 6 6 6 � 6♦ 6
L • -- - - -- - --
L G" = 8.0901 [dyn/cm2]
� 6 6
�"'
� � 6 6 t - Stress = 1.3668 �yn/cm2
1
L G" = 3.6674 [dyn/cm2]
C
C
C-
C-
Stress = �.4879 [dyn/c�
' ' ' ' '
1 o-1 1 o0
101
Stress [ dyn/cm2
] £)
Dynamic Stress Sweep b. Control
2
6 250GRHigh Elastic Properties
10
6 250GR HEC
6 6 6
1 6 250LR HEC
b. b.b. I b.
b.b.
G' = �6.846 [dyn/cm2]
Stres� = 2.4629 [dyn/cm2]
b. G' = 48.725 [dyn/cll}2]
�Stress = 3.604 [dyn(cm2] 1
b. b.
b. b.
b.
� � 10 1 i------- -----...L::,-�
b. - C
b. C) >,
10°
10-1
G' = 7.079 [dyn/cmf] Stress = 1.3668 [dXn/cm2
]
b. b. b. b.
G' = 2.3027 [dyn/cm2]
(Stress = 0.4879 [dyn/cm2]
1 o0
Stress [dyn/cm2]
101
+-
r
<] <] <] -
-
<]
C.
-
<J <J
3: U) G) <l
........
u,
N
ti) � <J <J
E
G)
u
ti) C.
-
e 0
C
... ,. <]
0 >,
.., a. ""-J
0 "'C
u, <l .....
.._.
U)
Cl)
(.) :::s <] Cl)
·- 0 <J Q)
E u
"-
U)
-
ca <l
(f)
C: > <J
<]
C <l <J
<J <J
<J <J
<l
<J <l
<l <J <l
<l
<l
......
I I I I 0
N
...... T"""
0
0
T"""
T"""
[iW�/UAp] ( '7) 118
103
,_ ,_-,_
,_
,_
,_
<] 5 102
--
- C
(9 >, "'O
I-
--
101
10-1
6. 6. 6.
6. 6. 6. 6. 6.
6. 6. 6. 6.
Dynamic Stress Sweep
Elastic Properties
G' = 67.404 [dyn/cm2]
Stress = 1.6621 [dyn/cm2]
6. 6.6. 6. 6.
,0,. Control ,0,. 7L CMC ,0,. 7M CMC
L� 6.
�� � G' = 66.846 [dyn/cm2] 6. 6. ,0,.
Stress = 2.4629 [dyn/cm2]6.
' I '
G' St1
' '
" t = 41 . 935 [ dyn/cm2
]
ess = 1 . 6212 [ dyn/cm2]
I
10°
Stress [dyn/cm2]
101
L\
<J <J <J <J
>,
·u;c.. 0
0
Q) 1/)
Q) '>
� C) C
Cf)
en ns 0
en 0
C Q) 0
+-I ... Cf) ns
(1)
� � 1/)
"'O -ro 0
Q) +-I
C Cf) (1) :::,
;;:: C
b T""
<J
<J
<J
C")
0 .....
<J
<J
<J
<J <J <J
�¾ <J
N
0 .....
<J
<J <J <J
<J <J
<J
�
..-0 .....
[d] ( V) el3
0
0 .....
N ..-
I oo
0
.....
........ ..... ' u, ..- ........
0 Q) .....
a:::
N
0 .....
---
.__... .........
cu a.. - .......
104 .::----
103
102 �
10 1
10° �
1 o-1 I
10-5
6646.
6 I::!. 6/i
�6b:. �
6 66
1 o-4 10-
3
Steady Stress Sweep
Influence of shear on coating viscosity
666
6 6 66
6
& 6
&
6 6
�6 6
�
��
10-2 10-1 10° 10 1
Rate [s-1]
61A '6.
-�102 103
I':::,, Control 6 7M CMC 6 7L CMC
104
,-.
L t'.
6000
4000
3000
2000
1000
'-Al'\. '\..J"I� 11'-'1 ...._,,,_,. • ._..,
HECCOMP.VIS Bob:E RPM:6600 Sprinq:100
ak 250GR HEC 250LR HEC ---
/#� ///?/
�
/ _, /� //
�
/ /,// ////_// /'
.//'
/ /P' /'r
////// //1 ., /I
/// //// ,,.. ./
r, / //</
j/w Jfj/
I/;//
, 100 200 300 400
Torque - kilodyne-cm
500 600 700
-�
0
u l[) N
0 0 ..-.. 0: C
·;::Q Cf)
.... 0 (") 0
• <D 0 w 0 �
Ii ::> � .... (l_
j) 0::: -w l[) t .. N\J -8 - coj)
Cf):ii:::-:0 >:
(l_ �
0 0 w
I
1�
N ..-
....-
\ \\
--� \ \l \
\ r i\ �
0 ..-
as1od11uA!"> - All�O!")�I" 111A1Prlrh.-1
JV
0 0 0
0 0 l[) <D
0 0 0 <D
\0 0 l[) l[)
0 0 0 l[)
\
\ 0 0
\ \ l[)
"1"
..-0� 0 (.)
\0 Q)s:;;!" (/)---
..-I
\ 0 Q) o-
\
l[) cu (Y") 0:::
I... cu
0 Q)
l 0 ..c 0 Cf) (Y")
I
\ 0 0 l[) N
0 0 0 N
0 0 l[) ..-
0 0 0..-
0 0 l[)
1000
ak
ur, ,J/L�/.J/ VU . .J/
CMCCOMP.VIS Bob:E RPM:6600 Sprinq:100
cmcM7E cmcl7E
--� ��
��
/·� /cf _,-:-,;,::
/1/1/
/4?::/�-� r//2/P //�/7
,//�/ ,;2V/ � ,/
/ /ffY
// ;y;'/ /3/ f/ /
�/// 100 200 300 400 500 600 700
Torque - kilodyne-cm
.,-,
15
:l. :::;
j5
I
>
...
j5 10
:l. :l.
ak
CAI, v/ L-"""T/ v I "-J'-'•>.J I
CMCCOMP.VIS Bob:E RPM:6600 Sprinq:100
cmcM7E
------------=---�
�,....,.,..____-.............,�
cmcl7E
500 1000 1500 2000 2500 3000 3500 4000 4500 5000 5500 6000 6500 7000
Shear Rate - 1/secfe11
'b·

Reference:
(1) Coyle, D.J., Macosko, C.W., Scriven, L.E., "Reverse Roll Coating of Non-NewtonianLiquids", J. Rheology 34, July 1990, vS, p615-636.
(2) Greener, J., Middleman, S., "Reverse Roll Coating of Viscous and Visceoelastic Liquids", Ind.Eng. Chem. Fundam., 1981, v20, p63-66.
(3) Matsuda, T., Brendley FJ., W.H., "Transfer and Leveling Processes and Rheological Design inWater-Borne Reverse-Roll Coating Systems", Journal of Coatings Technology Reprint
20
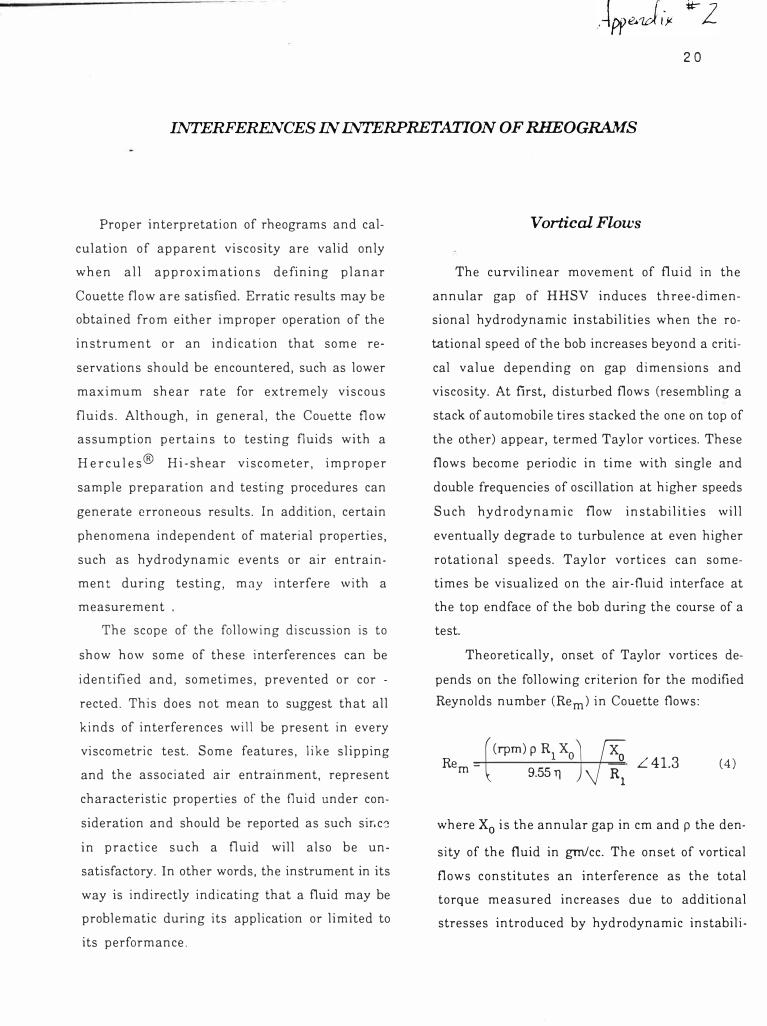
INTERFERENCES IN INTERPRETATION OF RHEOGRAMS
Proper interpretation of rheograms and cal
culation of apparent viscosity are valid only
when all approximations defining planar
Couette flow are satisfied. Erratic results may be
obtained from either improper operation of the
instrument or an indication that some re
servations should be encountered, such as lower
maximum shear rate for extremely viscous
fluids. Although, in general, the Couette flow
assumption pertains to testing fluids with a
Hercules® Hi-shear viscometer, improper
sample preparation and testing procedures can
generate erroneous results. In addition, certain
phenomena independent of material properties,
such as hydrodynamic events or air entrain
ment during testing, may interfere with a
measurement
The scope of the following discussion is to
show how some of these interferences can be
identified and, sometimes, prevented or cor -
rected. This does not mean to suggest that all
kinds of interferences will be present in every
viscometric test. Some features, like slipping
and the associated air entrainment, represent
characteristic properties of the fluid under con
sideration and should be reported as such sir.c�
in practice such a fluid will also be un
satisfactory. In other words, the instrument in its
way is indirectly indicating that a fluid may be
problematic during its application or limited to
its performance.
Vortical Flows
The curvilinear movement of fluid in the
annular gap of HHSV induces three-dimen
sional hydrodynamic instabilities when the ro
tational speed of the bob increases beyond a criti
cal value depending on gap dimensions and
viscosity. At first, disturbed flows (resembling a
stack of automobile tires stacked the one on top of
the other) appear, termed Taylor vortices. These
flows become periodic in time with single and
double frequencies of oscillation at higher speeds
Such hydrodynamic flow instabilities will
eventually degrade to turbulence at even higher
rotational speeds. Taylor vortices can some
times be visualized on the air-fluid interface at
the top endface of the bob during the course of a
test.
Theoretically, onset of Taylor vortices de
pends on the following criterion for the modified
Reynolds number (Rem) in Couette flows:
-((rpm) P R1 XoJfioRem - 9.55 Tl R
L 41.3
1
(4)
where X0 is the annular gap in cm and p the den
sity of the fluid in gm/cc. The onset of vortical
flows constitutes an interference as the total
torque measured increases due to additional
stresses introduced by hydrodynamic instabili-
ties. However, this increase in torque does not
relate to rheological properties of the fluid.
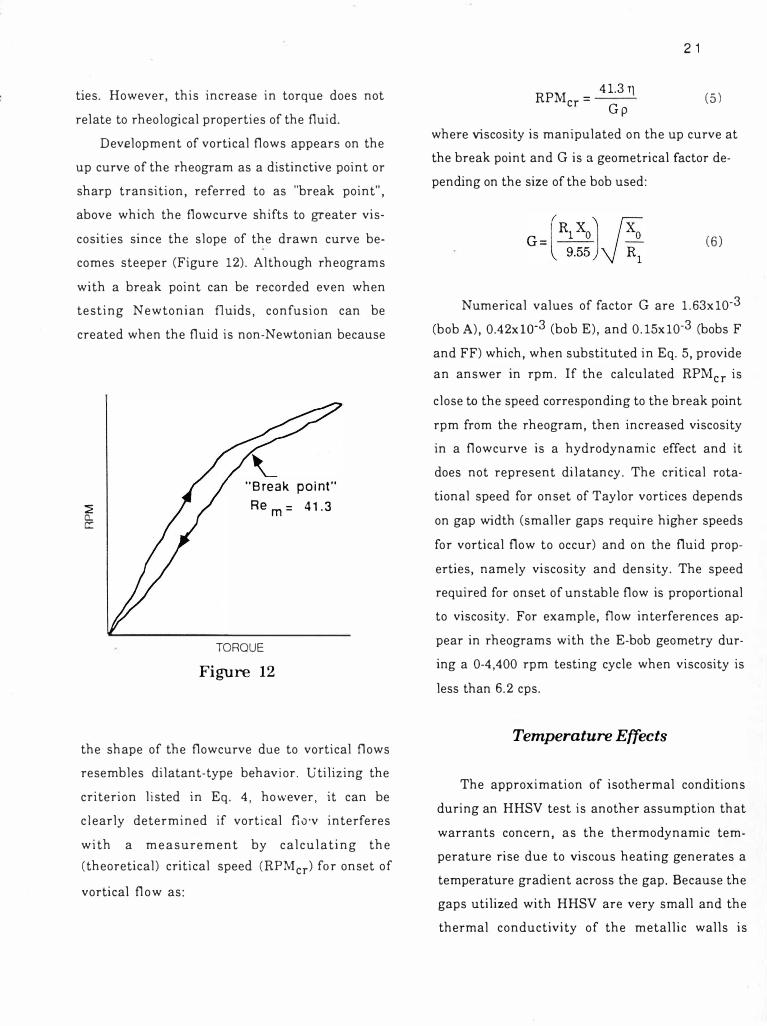
Development of vortical flows appears on the
up curve of the rheogram as a distinctive point or
sharp transition, referred to as "break point",
above which the flowcurve shifts to greater vis
cosities since the slope of the drawn curve be
comes steeper (Figure 12). Although rheograms
with a break point can be recorded even when
testing Newtonian fluids, confusion can be
created when the fluid is non-Newtonian because
� 0.. a:
"Break point"
Rem= 41.3
TORQUE
Figure 12
the shape of the flowcurve due to vortical flows
resembles dilatant-type behavior. utilizing the
criterion listed in Eq. 4, however, it can be
clearly determined if vortical f10•v interferes
with a measurement by calculating the
(theoretical) critical speed (RPMcr) for onset of
vortical flow as:
RPM = 4L31l
er Gp
2 1
(5)
where viscosity is manipulated on the up curve at
the break point and G is a geometrical factor de
pending on the size of the bob used:
(6)
Numerical values of factor G are l.63x10-3
(bob A), 0.42xio-3 (bob E), and 0.15xl0-3 (bobs F
and FF) which, when substituted in Eq. 5, provide
an answer in rpm. If the calculated RPMcr is
close to the speed corresponding to the break point
rpm from the rheogram, then increased viscosity
in a flowcurve is a hydrodynamic effect and it
does not represent dilatancy. The critical rota
tional speed for onset of Taylor vortices depends
on gap width (smaller gaps require higher speeds
for vortical flow to occur) and on the fluid prop
erties, namely viscosity and density. The speed
required for onset of unstable flow is proportional
to viscosity. For example, flow interferences ap
pear in rheograms with the E-bob geometry dur
ing a 0-4,400 rpm testing cycle when viscosity is
less than 6.2 cps.
Temperature Effects
The approximation of isothermal conditions
during an HHSV test is another assumption that
warrants concern, as the thermodynamic tem
perature rise due to viscous heating generates a
temperature gradient across the gap. Because the
gaps utilized with HHSV are very small and the
thermal conductivity of the metallic walls is
MACHINE BATCH PREPARATION
MATERIALS QUANTITY UNITS
WATER 3111 Wet Lbs. #1 CLAY 1752 Wet Lbs. PREBLENDED CLAY 2532.1 Wet Lbs. DISPERSANT 4.5 Wet Lbs. DEFOAMER 6.3 Wet Lbs. CALCINED CLAY 0.0 Wet Lbs. TtO2 1040 Wet Lbs. THICKENER 5.6 Dry Lbs.
MIX ON HIGH SPEED FOR 30 MINUTES.
REDUCE SPEED TO LOW AND ADD THE FOLLOWING:
LATEX 1576 Wet Lbs. INSOLUBILIZER 80 Wet Lbs.
MIX FIVE MINUTES BEFORE PUMPING TO STORAGE.
CALCULATION OF BATCH
MATERIAL % SOLIDS DRY WET #1 Clay 70 1227 1752
Blended Clay 69 1747 2532
50 0 0
TiO2 71.5 743 1040
Total Pigment ===> 45 3717
Latex 50 788 1576
Weight (Sub Total)=== 4505 6901
Water Added to adjust total solids ===> 3111
Total Solids 45 4505 Total Batch Size ======> 10012
To use this spread sheet enter variable in shaded cells.
Formula. No.9120
BATCH SIZE (Wet Lbs)I 10012
TARGET SOLIDS,%======> I 45
Updated: 03:31 PM 03-Apr-97 !\
BASIC FORMULATION
MATERIALS pph
#1 Clay 33 Blended Clay 47
0
TiO2 20 Latex 21�2· Thickener 0;15 Dispersant (wet/dry pigment) 0.12 Defoamer 0.17 lnsolubilizer (wet/dry binder) > 10�2Other
····o
Signature / Date