Embed Size (px)
Citation preview
1
Development of an ultrafast high throughput MALDI-triple quadrupole mass spectrometric method for the determination of 3,4-methylenedioxymethamphetamine (MDMA) in oral fluid
Michael Poetzsch1, Andrea E. Steuer1, Cedric M. Hysek2, Matthias E. Liechti2, Thomas Kraemer1* 1Department of Forensic Pharmacology and Toxicology, ZIFM - Zurich Institute of Forensic Medicine, University of Zurich, Zurich (Switzerland) 2Departement of Biomedicine, Division of Clinical Pharmacology and Toxicology, University Hospital Basel, University of Basel, Basel (Switzerland)
*Corresponding author:
Prof. Dr. Thomas Kraemer
University of Zurich
ZIFM – Zurich Institute of Forensic Medicine
Department of Forensic Pharmacology & Toxicology
Winterthurerstrasse 190/52
CH-8057 Zurich
Switzerland
Tel.: 0041 446355641; Fax: 0041 446356852
E-mail address: [email protected] (T. Kraemer)
Keywords: Oral fluid, MDMA, Ecstasy, MALDI, high throughput
This is the peer reviewed version of the following article: Poetzsch, M., Steuer, A. E., Hysek, C. M., Liechti, M. E., and Kraemer, T. (2016) Development of a high-speed MALDI-triple quadrupole mass spectrometric method for the determination of 3,4-methylenedioxymethamphetamine (MDMA) in oral fluid. Drug Test. Analysis, 8: 235–240, which has been published in final form at dx.doi.org/10.1002/dta.1810. This article may be used for non-commercial purposes in accordance with Wiley Terms and Conditions for Self-Archiving.
2
Abstract
3,4-Methylenedioxymethamphetamine (MDMA, ecstasy) still is a widely used illicit designer
drug and its detection in different matrices is of major importance for forensic purposes (e.g.
driving under the influence) as well as for work place drug testing or abstinence control.
Established analytical methods for the determination of MDMA are mainly employing high
performance liquid chromatography (HPLC) or gas chromatography (GC) coupled to mass
spectrometric detection. MALDI-QqQ-MS/MS is so far rarely used and offers an ultrafast
high throughput platform. The Quantisal™ Oral Fluid Collection Device was used for sample
collection. After addition of the deuterated internal standard and a carbonate buffer (0.75 M
Na2CO3), oral fluid samples were liquid-liquid extracted (ButOAc/EtOAc, 1:1). As little as 1
microliter of a mixture of this extract and the MALDI matrix (alpha-cyano-4-
hydroxycinnamic acid) was spotted onto the MALDI plate and could directly be analyzed.
With MALDI omitting chromatographic separation, very short analysis times of about 10
seconds per sample were possible. The method was developed and validated according to
international guidelines including specificity, recovery, matrix effects, accuracy and precision,
stabilities and limit of quantification. All validation criteria were fulfilled except for ion
suppression/enhancement. Comparison with a routine LC-MS/MS method showed good
agreement of the results. Applicability of the method was shown by analyzing about 250 oral
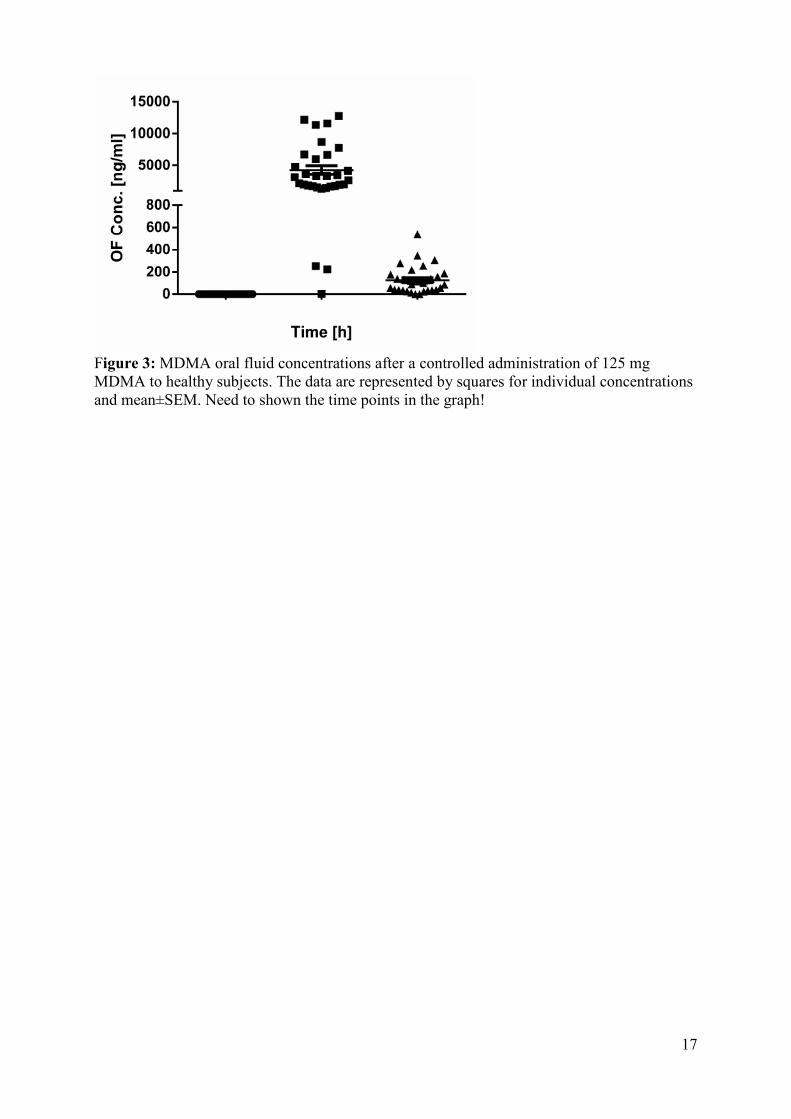
fluid samples collected after controlled administration of 125 mg MDMA in a
pharmacokinetic study. The whole lot of samples could be analyzed in less than one hour,
proving the ultra-high speed of the method.
Introduction
3,4-Methylenedioxymethamphetamine (MDMA, ecstasy) is an illicit drug of abuse that
produces feelings of energy, friendliness, euphoria and empathychange refs! Include current
Nr 20 and the ones newly noted in the reference section (Hysek et al., 2011; Hysek et al.,
3
2014b)After decreasing numbers of MDMA seizures in recent years, most likely due to its
non-availability on the illicit drug market, the Substance Abuse and Mental Health Services
Administration and the European Monitoring Centre for Drugs and Drug Addiction
(EMCDDA) have reported on increasing MDMA consumption in the United States and
Europe again since 2010 (Studies, 2010; (EMCDDA), 2013). For this reason its detection in
biological matrices for the purpose of work place drug testing or forensic cases is still of main
interest. Drug abstinence control can be performed with a variety of specimens. Blood and
serum offer good quantitative correlation to the actual physical influence (Kolbrich et al.,
2008; Barnes et al., 2011), whereas urine or sweat offer mainly qualitative information
(Abraham et al., 2009; Barnes et al., 2009). In hair, drug consumption behavior from months
to years can be monitored (Pragst et al., 2006; Poetzsch et al., 2014). Oral fluid (OF) sample
collection offers a less invasive method, which is already widely distributed for abstinence
control or driving under the influence of drugs (DUID) testing (Wille et al., 2014).
Furthermore, reference pharmacokinetic data for MDMA in OF are already available for
method comparison (Barnes et al., 2011). Analytical methods used for the determination of
MDMA in different matrices are mainly employing high performance liquid chromatography
(HPLC) or gas chromatography (GC) coupled to mass spectrometric detection (Scheidweiler
et al., 2006; Schwaninger et al., 2011). Matrix assisted laser desorption/ionization triple
quadrupole tandem mass spectrometry (MALDI-QqQ-MS/MS) is so far not very common and
offers a novel high throughput platform (Meesters et al., 2011b; Meesters et al., 2011a).
Biological samples are mixed with the MALDI matrix solution and spotted (0.25 – 1.5 µl)
onto a MALDI stainless steel target plate. The matrix solution contains a small molecule that
absorbs the energy of the laser and thus leads to soft ionization of the analyte. The analyte is
afterwards analyzed in the multi reaction monitoring (MRM) mode, which is very selective
and reduces the background noise caused by the matrix molecules. MALDI-QqQ-MS/MS
offers very short sample analysis times, with about 10 seconds per sample in our procedure
4
and is therefore perfectly suitable for high throughput quantification as needed for forensic
drug testing or in pharmacokinetic studies generating high numbers of samples.
The aim of the present study was therefore to develop a high throughput MALDI-QqQ-
MS/MS method for analysis of MDMA and its main metabolite 3,4
methylenedioxyamphetamine (MDA) in oral fluid. The resulting method should be validated
according to international guidelines. Furthermore, its applicability should be proven by
analyzing OF samples from a double-blind, placebo-controlled, crossover study with
ingestion of 125 mg of MDMA (Hysek et al., 2014a).
Experimental
Chemicals and reagents
3,4-Methylenedioxymethamphetamine (MDMA); 3,4-methylenedioxyamphetamine (MDA);
MDMA-D5; MDA-D5 and methylphenidate (MPh) were obtained from Lipomed (Arlesheim,
Switzerland). Water was purified with a Purelab Ultra (Labtec, Villmergen, Switzerland)
filtration unit. Alpha-cyano-4-hydroxycinnamic acid (CHCA), acetonitrile (ACN), methanol
(MeOH), sodium carbonate (Na2CO3), ethyl acetate (EtOAc), butyl acetate (ButOAc) and
trifluoroacetic acid (TFA) were purchased from Sigma Aldrich (Buchs, Switzerland). All
other chemicals used were purchased from Merck (Zug, Switzerland) and of the highest grade
available.
Sample preparation
MALDI-MS Oral Fluid Samples
To 80 µl QuantisalTM (Alere toxicology, Abington, UK) buffer solution 10 µl deuterated
internal standard (IS) solution was added and vortexed for 30 seconds. 100 µl 0.75 M Na2CO3
buffer pH 10 was added and vortexed for 30 sec. Afterwards 1 ml ButOAc/EtOAc (1:1) was
5
added and shaken for 10 min at 1400 rpm and then centrifuged at 10˙000 rpm for 10 min.
Finally, the supernatant was evaporated under a gentle nitrogen stream after adding 50 µl 2%
TFA at room temperature. The residue was reconstituted in 50 µl CHCA solution (10 mg/ml
in 0.1 % TFA/ACN 1:1). One µl each was spotted into three wells of the MALDI target plate
(OPTI TOF 384 well insert 123 x 81 mm, AB Sciex, Darmstadt, Germany) and was dried at
room temperature before measurement.
Apparatus
MALDI-MS experiments were performed on a Flashquant® Workstation (AB Sciex,
Darmstadt, Germany) fitted with a high repetition laser (Nd: YAG, λ = 355 nm, elliptic shape
100 x 200 µm). Measurements were acquired in MS/MS mode using positive ionization.
Source operation conditions were: continuous mode (1 mm/s), laser power 40 %, laser
frequency 1000 Hz. MS conditions were: unit resolution, vacuum gauge q2: 4.8 x 10⁻⁵ Torr
(nitrogen as collision gas). Transitions and optimized MS parameters are shown in Table 1.
Data acquisition and processing was performed with Analyst 1.4.2 software and Flashquant®
software (AB Sciex, Darmstadt, Germany).
Comparison to micro flow liquid chromatography (MFLC) was performed using an AB Sciex
Eksigent micro flow LC system (Redwood City, California, USA) coupled to an AB Sciex
4500 QTtrap linear ion trap (LIT) quadrupole mass spectrometer (AB Sciex, Darmstadt,
Germany). The MFLC settings were as follows: Halo Phenyl Hexyl column (eksigent;
AB Sciex, Brugg, Switzerland) 50 x 0.5 mm, 2.7 µm, gradient elution with 10 mM
ammonium formate buffer in water pH 3.5 (A) and acetonitrile containing 0.1 % (v/v) formic
acid (B). The flow rate was 50 µL/min with the following gradient: 95% A for 0.1 min,
0.1-0.7 min decrease to 30 % A, 0.7-0.9 min hold at 30 % A, 0.9-1 min return to initial
conditions. Reequilibrating is performed for 1 min before the next injection. Injection volume
6
was 5 µL. The Turbo V ion source, equipped with a hybrid electrode (50 µm internal
diameter), was operated in positive ESI mode with the following MS conditions: gas 1:
nitrogen (50 psi); gas 2: nitrogen (60 psi); ion spray voltage: 5.5 kV; ion-source temperature:
250 °C; curtain gas: nitrogen (30 psi); collision gas, medium. The MS settings for each
analyte are given in Table 1. The MS was controlled by analyst 1.6.2 software.
Method Validation for MALDI-MS
Preparation of calibration and quality control (QC) samples
Separate stock solutions of MDMA, MDA (10 µg/ml) and MDMA-D5, MDA-D5 (1 µg/ml)
were prepared in MeOH. Spiking solutions were prepared in MeOH by mixing appropriate
amounts of the corresponding stock solution. All solutions were stored in aliquots at -20 °C.
Calibration standards and QC samples (Low, High, above calibration range (ACR)) were
prepared from 80 µl analyte-free QuantisalTM buffer solution. The final MDMA and MDA
calibrator concentrations were: 5; 50; 100; 150; 200; 300; 500; 1000; 2000 ng/ml and QC
samples: 10 (Low); 1800 (High); 10000 (ACR) ng/ml, respectively. ACR QC samples were
diluted 1:10 with analyte free QuantisalTM buffer solution. IS concentrations were 50 ng/ml
MDMA and MDA, respectively.
Selectivity and cross talk
80 µl of each analyte solution and each IS were analyzed for interferences in the other MRM
transitions.
Specificity
Ten blank QuantisalTM buffer solutions containing oral fluid from different donors were
analyzed for peaks interfering with the detection of analytes or ISTD. Two zero samples
(blank samples + IS) were analyzed to check for appropriate IS purity and presence of native
analytes.
Matrix effects and recovery
7
Matrix effects and (ME) recovery (RE) were determined at QC Low and High concentration
using 6 oral fluids from different donors according to the simplified approach described by
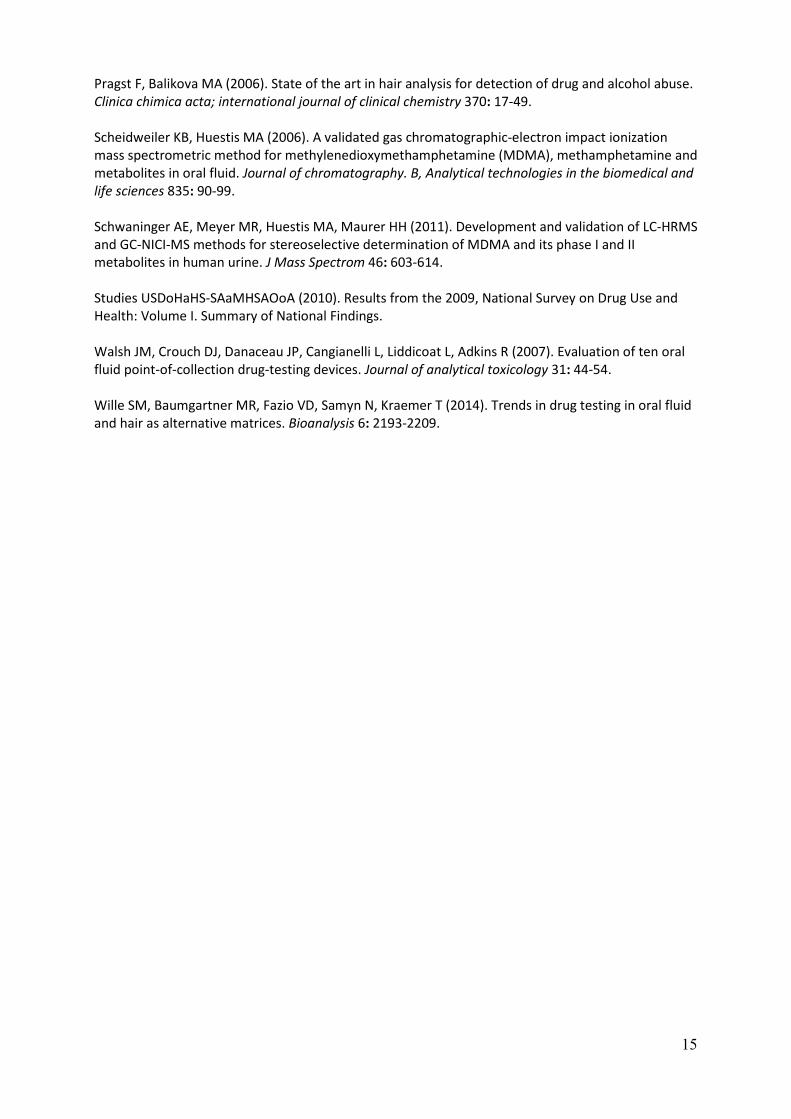
Matuszewski et al (Matuszewski et al., 2003). For investigating ion-suppression /
enhancement, ten QuantisalTM buffer solutions were spiked with MPh and MDMA in
combinations of different concentrations (table 1) and absolute areas under the curve were
compared.
Calibration model
Replicates (n=6) at each concentration level were analyzed as described above. The regression
lines were calculated using non-weighted, weighted 1/x and weighted 1/x2 regression models.
The final choice of model was made after calculating validation data using these alternatives.
Daily calibration curves were prepared with each batch of validation samples.
Accuracy and precision
QC samples (Low, High, ACR) were analyzed according to the procedures described above in
duplicate on each of eight days. Accuracy was calculated in terms of bias as the percent
deviation of the mean calculated concentration at each concentration level from the
corresponding theoretical concentration. Intra-day and inter-day precision were calculated as
relative standard deviation (RSD) according to ref. (Peters et al., 2007)
Stability
Process sample stability were investigated at QC Low and High concentration (n=6)
according to ref. (Peters et al., 2007). For in source stability QC Low and High samples were
stored in the MALDI source for 24h under vacuum condition and relative intensities
compared.
Limits
The lowest point of the calibration curve was defined as the limit of quantitation (LOQ) of the
method and fulfilled the requirement of LOQ with a signal to noise ratio of 10:1 determined
by comparing background signal height after blank sample extraction and extraction of the
8
lowest calibrator. LOD was determined by dilution of the lowest calibrator until a signal to
noise ratio of 3:1 was reached.
Comparison of MALDI-MS/MS and MFLC-MS/MS
For performance comparison of MALDI-MS/MS and MFLC-MS/MS, 15 authentic OF
samples were quantified with both systems. For that purpose calibrators and authentic samples
were prepared as described above. For LC-MS/MS quantitation, the residue was reconstituted
in eluent A/B (95/5) instead of MALDI matrix solution. Obtained results were compared
applying a Wilcoxon test with a 0.05 significance level.
Proof of applicability
The presented method was applied to about 250 samples of a pharmacokinetic study after
controlled administration of 125 mg MDMA. 16 participants received MDMA or placebo in
combination with methylphenidate and/or placebo (Hysek et al., 2014a). Concentrations of
MDMA in oral fluid were assessed.
Results and Discussion
MALDI-MS method development
MALDI-QqQ-MS/MS is a relatively new technique which achieves its high throughput ability
mainly by direct ionization of the analyte without chromatographic separation. Due to the lack
of chromatographic separation, retention time as one criterion for identification is missing as
well as separation from other substances prior to the ionization process. Separation from other
substances can only be achieved by changes in sample preparation. Therefore, the mass
spectrometry specificities, inter-substance influences as well as ion suppression/enhancement
effects are discussed in detail in the following.
Cross talk is a phenomenon which might occur in case of MS/MS acquisition. Precursor ions
are fragmented in the collision cell most likely through collision induced dissociation (CID)
followed by extraction of the ions out of the collision cell. In case of insufficient extraction,
9
fragments might still be present when the next ion is fragmented. Separation of isomers by
tandem mass spectrometric detection without chromatographic separation is therefore difficult
due to almost identical fragmentation. In our method, no isomers were included but MDMA
and MDA both dissociate into the same ion fragment of m/z 105 (table 1) and therefore cross
talk might occur in case of both substances being present in the same sample. However, cross
talk could not be detected with the chosen 5 ms pause between MRM transitions.
MALDI process is still not completely understood so far. It is known, that the analyte of
interest has to be co-crystallized with the appropriate MALDI matrix. Compounds like salts or
proteins which may disturb the co-crystallization reduce the ionization yield dramatically.
This phenomenon was seen when trying to mix the analyte containing QuantisalTM buffer
solution directly with the MALDI matrix. The QuantisalTM oral fluid collection system
contains an unknown buffer solution. A loss of intensity of up to 65 % compared to the finally
performed LLE was measured. Salts from buffer or the sample itself lead to loss of signal
intensity. This was also seen when LLE extraction was performed after pH adjustment using
phosphate buffer or sodium hydroxide. Best results were finally achieved with the use of
0.75 M sodium carbonate buffer. Thus, LLE proved to be the best compromise between fast
and cheap sample preparation and necessary sample clean-up for an optimized MALDI
process.
The ionization process might also be influenced by other drugs of abuse or pharmaceuticals
eventually present in the sample. This was investigated by analyzing spiked samples
containing MPh and MDMA at different concentration ratios. MPh was chosen for that
experiment because it was co-administered in the study from which the oral fluid samples for
applicability testing were received (Hysek et al., 2014a). MPh suppressed the MDMA signal
intensity (Figure 1) but ion-suppression was still within guideline regulations. Surprisingly,
decrease of signal intensity was independent from MPh concentration in a range expected
10
after MPh treatment. These aspects should be further evaluated for multi-analyte methods or
when more drugs in oral fluid have to be expected.
Oral fluid MALDI-MS method validation
Specificity, Selectivity and Cross Talk
Blank oral fluid samples from ten different donors were analyzed for mass spectrometric
interferences. No interfering transitions were detected caused by the internal standard or
methylphenidate.
Matrix effects and Recovery
Recovery was efficient with 95.3 ± 12.3 % for MDMA and fulfilled guideline criteria. Matrix
effects were 74.5 ± 6.4 % for QC low and 70.1 ± 3.0 % for QC high. Ion-suppression was
greater than guideline limits (75-125 %) but reproducible with small standard deviations.
Calibration model
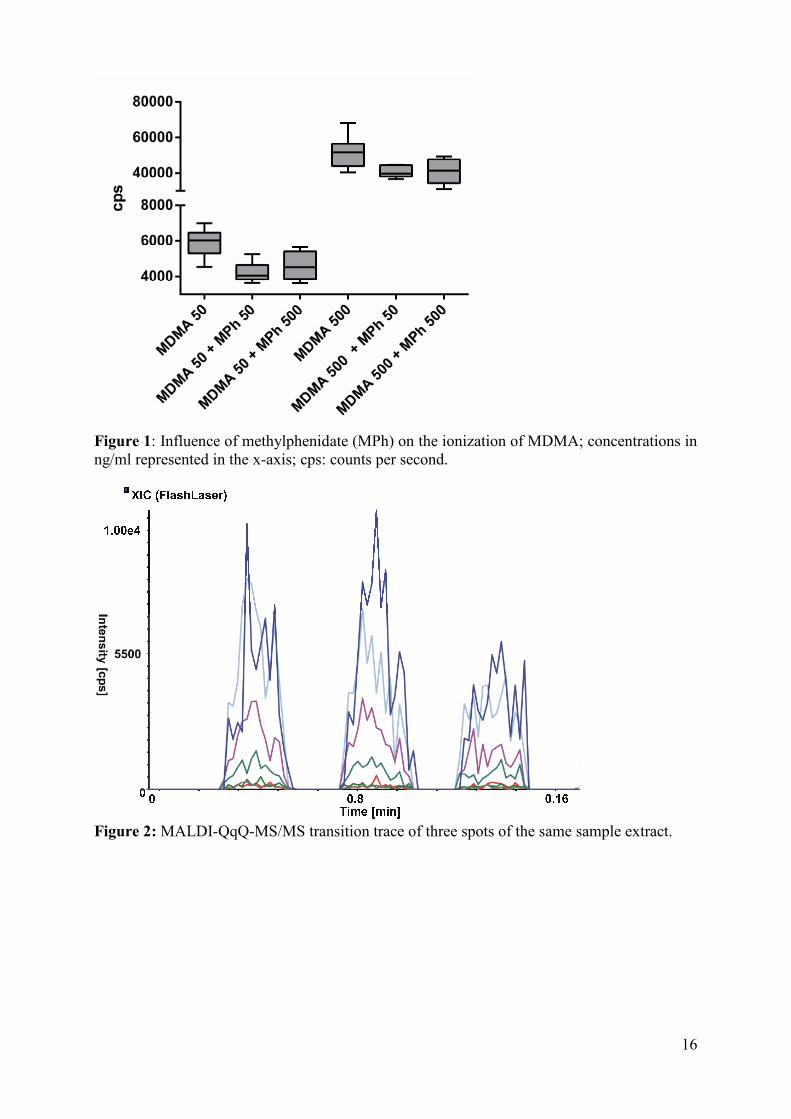
For quantitation the area ratio of analyte to internal deuterated standard was employed.
Figure 2 illustrates the obtained MRM traces of three spots of the same sample. One transition
was used as quantifier and second as qualifier. Six replicates of calibration curves were used
to evaluate the calibration model. The calibration range for MDMA was 5 – 2000 ng/ml.
Samples with higher concentrations were diluted with QuantisalTM buffer solution. An above
calibration range (ACR) quality control was treated the same way and secured the procedure,
already during validation. A 1/x weighted linear calibration model was used for unequal
variances and showed best accuracy and precision data. Calibrator concentrations were within
30 % of target based on the full calibration curve.
Accuracy and precision
QC samples (Low; High; ACR) were analyzed in duplicates on each of eight days as proposed
by Peters et al. (Peters et al., 2007) and their concentrations determined from daily calibration
curve. Accuracy, intra-day and inter-day precision were calculated as described above. All
11
validation parameters fulfilled the necessary criteria (Table 2). Nevertheless, some important
experimental aspects must be considered. The laser can be employed in discrete shot or
straight line mode. Applying discrete shot mode, the laser fires on the sample spot for a few
milliseconds at one position and then moves to the next spot. This further increases sample
throughput but decreases accuracy and precision. In straight line mode the laser moves
continuously through the spot diameter at fixed laser speed. A laser speed of 1 mm/s was the
best compromise between analysis time and optimal accuracy and precision in our
experiment. Furthermore, so called hot spots might occur during sample drying, which means
that ionization is increased or decreased by optimal or insufficient crystallization at certain
spots in the spotted sample. These phenomena can be compensated for by use of an internal
standard. It was clearly seen, that differences in crystallization, spot size and absence of
chromatographic separation required compensation by internal standard use. Accuracy and
precision were further improved by spotting three replicates of one sample on the MALDI
plate and averaging intensities.
Stability
The used MALDI source is under the same vacuum as the Q0 region of the instrument.
MDMA is known for fast evaporation in the deprotonated state. Evaporation of MDMA might
therefore also occur when the spotted samples are kept in the vacuum source. No degradation
was determined for samples spotted onto the MALDI target plate and stored in the MALDI
source for 12 h. Normally, the acquisition of a 384 well plate takes approximately 28 min.
(laser speed: 1 mm/sec). Also, no degradation of MDMA and MDA was observed after two
freeze/thaw cycles in the QuantisalTM collection system device. Long-term stability data on
MDMA stability in the QuantisalTM OF collection system have already been published (Walsh
et al., 2007)
Limits of quantification and detection
12
The LOQ for MDMA was consistent with the lowest calibrator with less than 30% bias
compared to the target concentration. The necessary MALDI matrix always caused a little
background noise, which had to be evaluated during method development. It is recommended
to check all possible transitions for their signal to noise ratio. The choice of MALDI matrix
can also influence background noise. For evaluation of LOD and LOQ the area ratio of a
blank sample and a spiked sample was evaluated and area ratios were found to be greater than
three for LOD and ten for LOQ, respectively.
MDA showed a significant in-source fragmentation which deteriorated the limit of detection
dramatically. In-source fragmentation can occur due to multiple parameters. Plate voltage
applied to the MALDI plate during acquisition accelerates ions towards the QO region and
can cause source fragmentation in case of maladjustment. Ion source pressure is responsible
for the cooling of the MALDI plume during ionization and can also influence fragmentation.
Unfortunately, it was not possible to reduce the in-source fragmentation of MDA in a
sufficient way to quantify this major metabolite of MDMA. Fragment monitoring of MDA
was also not possible because MDMA in-source fragmented in the same manner but with less
intensity. One possibility to avoid in-source fragmentation would be to derivatize MDA.
However, this would be too time consuming, especially for a high throughput method.
Comparison of MALDI-MS/MS and LC-MS/MS
Quantitative results of 15 authentic OF samples measured with LC-MS/MS and MALDI-
MS/MS were comparable. Statistical Wilcoxon matched pair test showed a P value of 0.89
and thus no statistically significant differences. This comparison substantiates the
applicability of MALDI-QqQ-MS/MS as a high throughput platform comparable to LC-
MS/MS methods.
Study results oral fluid
The validated method was successfully applied to the analysis of more than 250 authentic
samples of a pharmacokinetic study. MDMA was detectable 3 and 24 hours after
13
administration. Concentrations of MDMA are shown in Figure 3. It could clearly be
demonstrated that MALDI-QqQ-MS/MS use for routine quantification is a clear advantage in
case of high sample numbers. The whole lot of 250 samples could be analyzed in
approximately one hour including calibrators and QCs. Using the LC-MS/MS method which
had been employed for the comparison above, the analysis time would have been around 6
hours. Furthermore, sample amount used for measurements could be further downscaled and
costs for eluents required for LC-MS analysis could be omitted. MDA was detected in
samples collected 3 h after administration at a time corresponding to the maximal plasma
exposure of MDMA (Hysek et al., 2014a) and when MDA levels close to maximum are
already reached (Hysek et al., 2011). Samples collected at the time of intake (t=0h) and 24 h
after administration were negative for MDA. MDA could not be quantified.
Conclusion
A MALDI-QqQ-MS/MS high throughput method was developed with an analysis time of 10
seconds per sample for the validated quantification of MDMA in oral fluid samples. The
method fulfilled the required validation criteria except for matrix effects. Ion
suppression / enhancement phenomena were investigated in detail and showed small standard
deviations despite the lack of chromatographic separation. The method was successfully
applied to 250 oral fluid samples of a pharmacokinetic study.
Acknowledgements
The authors would like to thank their colleagues Sandra Staeheli, Eva Tingelhoff, Andreas
Roemmelt and Milena M. Madry for their assistance.
14
(EMCDDA) EMCfDaDA (2013). European Drug Report 2013 - Trends and Developments. Lisbon:
European Monitoring Centre for Drugs and Drug Addiction (EMCDDA)
Abraham TT, Barnes AJ, Lowe RH, Kolbrich Spargo EA, Milman G, Pirnay SO, et al. (2009). Urinary
MDMA, MDA, HMMA, and HMA excretion following controlled MDMA administration to humans.
Journal of analytical toxicology 33: 439-446.
Barnes AJ, De Martinis BS, Gorelick DA, Goodwin RS, Kolbrich EA, Huestis MA (2009). Disposition of
MDMA and metabolites in human sweat following controlled MDMA administration. Clinical
chemistry 55: 454-462.
Barnes AJ, Scheidweiler KB, Kolbrich-Spargo EA, Gorelick DA, Goodwin RS, Huestis MA (2011). MDMA
and metabolite disposition in expectorated oral fluid after controlled oral MDMA administration.
Therapeutic drug monitoring 33: 602-608.
Hysek CM, Simmler LD, Ineichen M, Grouzmann E, Hoener MC, Brenneisen R, et al. (2011). The
norepinephrine transporter inhibitor reboxetine reduces stimulant effects of MDMA ("ecstasy") in
humans. Clin Pharmacol Ther 90: 246-255.
Hysek CM, Simmler LD, Schillinger N, Meyer N, Schmid Y, Donzelli M, et al. (2014a). Pharmacokinetic
and pharmacodynamic effects of methylphenidate and MDMA administered alone or in combination.
The international journal of neuropsychopharmacology / official scientific journal of the Collegium
Internationale Neuropsychopharmacologicum 17: 371-381.
Hysek CM, Schmid Y, Simmler LD, Domes G, Heinrichs M, Eisenegger C, et al. (2014b). MDMA
enhances emotional empathy and prosocial behavior. Social cognitive and affective neuroscience 9:
1645-1652.
Kolbrich EA, Goodwin RS, Gorelick DA, Hayes RJ, Stein EA, Huestis MA (2008). Plasma
pharmacokinetics of 3,4-methylenedioxymethamphetamine after controlled oral administration to
young adults. Ther Drug Monit 30: 320-332.
Matuszewski BK, Constanzer ML, Chavez-Eng CM (2003). Strategies for the assessment of matrix
effect in quantitative bioanalytical methods based on HPLC-MS/MS. Anal Chem 75: 3019-3030.
Meesters RJ, van Kampen JJ, Scheuer RD, van der Ende ME, Gruters RA, Luider TM (2011a).
Determination of the antiretroviral drug tenofovir in plasma from HIV-infected adults by ultrafast
isotope dilution MALDI-triple quadrupole tandem mass spectrometry. Journal of mass spectrometry :
JMS 46: 282-289.
Meesters RJ, den Boer E, Mathot RA, de Jonge R, van Klaveren RJ, Lindemans J, et al. (2011b).
Ultrafast selective quantification of methotrexate in human plasma by high-throughput MALDI-
isotope dilution mass spectrometry. Bioanalysis 3: 1369-1378.
Peters FT, Drummer OH, Musshoff F (2007). Validation of new methods. Forensic Sci Int 165: 216-
224.
Poetzsch M, Steuer AE, Roemmelt AT, Baumgartner MR, Kraemer T (2014). Single Hair Analysis of
Small Molecules Using MALDI-Triple Quadrupole MS Imaging and LC-MS/MS: Investigations on
Opportunities and Pitfalls. Analytical chemistry 86: 11758-11765.
15
Pragst F, Balikova MA (2006). State of the art in hair analysis for detection of drug and alcohol abuse.
Clinica chimica acta; international journal of clinical chemistry 370: 17-49.
Scheidweiler KB, Huestis MA (2006). A validated gas chromatographic-electron impact ionization
mass spectrometric method for methylenedioxymethamphetamine (MDMA), methamphetamine and
metabolites in oral fluid. Journal of chromatography. B, Analytical technologies in the biomedical and
life sciences 835: 90-99.
Schwaninger AE, Meyer MR, Huestis MA, Maurer HH (2011). Development and validation of LC-HRMS
and GC-NICI-MS methods for stereoselective determination of MDMA and its phase I and II
metabolites in human urine. J Mass Spectrom 46: 603-614.
Studies USDoHaHS-SAaMHSAOoA (2010). Results from the 2009, National Survey on Drug Use and
Health: Volume I. Summary of National Findings.
Walsh JM, Crouch DJ, Danaceau JP, Cangianelli L, Liddicoat L, Adkins R (2007). Evaluation of ten oral
fluid point-of-collection drug-testing devices. Journal of analytical toxicology 31: 44-54.
Wille SM, Baumgartner MR, Fazio VD, Samyn N, Kraemer T (2014). Trends in drug testing in oral fluid
and hair as alternative matrices. Bioanalysis 6: 2193-2209.
16
Figure 1: Influence of methylphenidate (MPh) on the ionization of MDMA; concentrations in ng/ml represented in the x-axis; cps: counts per second.
Figure 2: MALDI-QqQ-MS/MS transition trace of three spots of the same sample extract.
17
Figure 3: MDMA oral fluid concentrations after a controlled administration of 125 mg MDMA to healthy subjects. The data are represented by squares for individual concentrations and mean±SEM. Need to shown the time points in the graph!


![A study of impurities in intermediates and 3,4-methylenedioxymethamphetamine (MDMA) samples produced via reductive amination routes [Forensic Sci. Int., 2005, 155, 2–3, 141–157]](https://img.pdfslide.net/doc/110x75/55cf9df9550346d033b01aef/a-study-of-impurities-in-intermediates-and-34-methylenedioxymethamphetamine.jpg)


![Determination of 3,4-methylenedioxymethamphetamine (MDMA ... · analysis of MDMA in confiscated tablets has been carried out in several forensic laboratories around the world [3,7-9]](https://img.pdfslide.net/doc/110x75/5eabfdde9802fd36ea1784cf/determination-of-34-methylenedioxymethamphetamine-mdma-analysis-of-mdma-in.jpg)

![Spatio‐temporal assessment of illicit drug use at large ...[cocaine, cannabis, amphetamine, methamphetamine and methylenedioxymethamphetamine (MDMA)] in raw wastewater [8]. The monitoring](https://img.pdfslide.net/doc/110x75/5e87ef6a7ddc284d9b6428b9/spatioatemporal-assessment-of-illicit-drug-use-at-large-cocaine-cannabis.jpg)


![[MDMA]MDMA Neurochemistry](https://img.pdfslide.net/doc/110x75/577dab601a28ab223f8c57f3/mdmamdma-neurochemistry.jpg)
