Embed Size (px)
Citation preview

MCS Preprint #ANL/MCS-P1315-0106.
Monitoring and Discovery in a Web Services Framework: Functionality and Performance of Globus Toolkit MDS4
Jennifer M. Schopf1,2,4, Ioan Raicu2, Laura Pearlman3, Neill Miller2, Carl Kesselman3, Ian Foster1,2, Mike D’Arcy3
1 Mathematics and Computer Science Division, Argonne National Laboratory 2 Department of Computer Science, The University of Chicago
3Information Science Institute, University of Southern California 4 UK National eScience Centre, University of Edinburgh
Abstract
The Globus Toolkit Monitoring and Discovery System (MDS4) defines and implements mechanisms for service and resource discovery and monitoring in distributed environments. MDS4 is distinguished from previous similar systems by its extensive use of interfaces and behaviors defined in the new WS-Resource Framework and WS-Notification specifications, and by its deep integration into essentially every component of the Globus Toolkit. We describe the MDS4 architecture and the Web service interfaces and behaviors that allow users to discover resources and services, monitor resource and service states, receive updates on current status, and visualize monitoring results. We also describe how MDS4 can be used to implement large-scale distributed monitoring and distributed systems, and present experimental results that provide insights into the performance that can be achieved via the use of these mechanisms.
1. Overview
The resources available to a virtual organization (VO) in a Grid environment can change frequently as new resources and services (brokering services, replica managers, file servers, etc.) are added and old ones are removed or become inaccessible. In addition, resource and service properties may change: for example, when a data server is upgraded to larger capacity, different access rates, or different access protocols. These dynamic behaviors can make both discovery—the process of finding suitable resources to perform a task—and monitoring—the process of observing
resources or services to track their status for purposes such as fixing problems and tracking usage—significant undertakings.
Typical monitoring and discovery use cases include providing data so that resource brokers can locate computing elements appropriate for a job, streaming data to a steering application so that adjustments can be made to a running application, and notifying system administrators when changes in system load or disk space availability occur, in order to identify possible performance anomalies.
The Globus Toolkit’s solution to these closely related problems is its Monitoring and Discovery System (MDS): a suite of components for monitoring and discovering resources and services. MDS4, the version in the Globus Toolkit 4 [Foster05], uses standard interfaces defined within the Web Services Resource Framework (WSRF) and WS-Notification (WS-N) specifications [FCF+05] to provide query and subscription interfaces to arbitrarily detailed resource data (modeled in XML). A trigger interface can be configured to take action when pre-configured conditions are met. MDS4 services acquire their information through an extensible interface that can be used to query WSRF services for resource property information, execute a program to acquire data, or interface with third-party monitoring systems.
Grid computing resources and services can advertise a large amount of data for many different purposes. MDS4 was designed to enable access to such data by multiple people across multiple administrative domains. As such, it is not an event handling system, as is NetLogger [GT03], or a cluster monitor in its own right, as is Ganglia [MCC04], but can interface to these more detailed monitoring systems (and to archives).
1

The rest of this paper is as follows. We detail in Section 2 MDS4 services, infrastructure, data sources, and interfaces, and in Section 3 describe a typical deployment. We give preliminary performance results in Section 4, compare MDS4 with the earlier MDS2 system in Section 5, discuss related work in Section 6, and conclude in Section 7.
The principal contributions of this paper are as follows: • We show by example how monitoring and
discovery capabilities can be integrated into the design of a distributed computing infrastructure so that any and every resource and service can be monitored and discovered in a uniform manner.
• In doing so, we validate the value of primitive interfaces and behaviors defined by the WSRF and WS-N specifications as a basis for building such systems.
• We present performance results that provide insights into the performance of our MDS4 implementation of a WSRF/WSN-based monitoring and discovery system, and permit comparisons with a previous non-WSRF/WSN based system.
2. MDS4 Details
MDS4 builds heavily on capabilities provided by the WSRF and WS-N specifications [FCF+05]; indeed, it can be viewed as an exemplary use case for those specifications, which define the mechanisms used to describe information sources, access information via both queries and subscriptions, and manage information lifetimes.
The neck of the MDS4 “protocol hourglass” (Figure 1) comprises not only these standard protocols for data access and delivery but also standard schemas for information representation, such as the GLUE schema [GLUE]. Below the neck of the hourglass, MDS4 interfaces to different local information sources, translating their diverse schemas into appropriate XML schema transmitted over WSRF/WS-N protocols. Above the neck of the hourglass, various tools and applications can take advantage of the uniform Web services query, subscription, and notification interfaces to those information sources that MDS4 implements.
In the rest of this section, we describe the MDS4 implementation. We first review in Section 2.1 the Web service standards that underpin our approach. Then, in Section 2.2 we describe the higher-level Index service, which collects and publishes aggregated information about Grid resources, and Trigger service, which collects resource information and performs
GLUE Schema Attributes(cluster info,queue info, FS info)
Information Users :Schedulers, Portals, etc.
Cluster monitors(Ganglia, Hawkeye,Clumon, and Nagios soon)
Services(GRAM, RFT, RLS)
Queueing systems(PBS, LSF, Torque)
WS standard interfaces for subscription, registration, notification
GLUE Schema Attributes(cluster info,queue info, FS info)
Information Users :Schedulers, Portals, etc.
Cluster monitors(Ganglia, Hawkeye,Clumon, and Nagios soon)
Cluster monitors(Ganglia, Hawkeye,Clumon, and Nagios soon)
Services(GRAM, RFT, RLS)
Services(GRAM, RFT, RLS)
Queueing systems(PBS, LSF, Torque)Queueing systems(PBS, LSF, Torque)
WS standard interfaces for subscription, registration, notification
Figure 1: MDS4 provides a protocol hourglass.
actions when certain conditions are met. These services are built upon a common infrastructure called the Aggregation Framework, described in Section 2.3, which provides common interfaces and mechanisms for working with data sources. MDS4 also includes several software components, called Information Providers, described in Section 2.4, that are used to collect information, and a web-based user interface called WebMDS, described in Section 2.5. We describe a typical MDS4 deployment in Section 3. 2.1 Web Services Standards Used By MDS4
Different use cases can motivate a need for a wide
variety of information about Grid resources and services. Our experience with MDS2 [CFF+01], in which information was collected and delivered by a separate set of services, emphasized the advantages of incorporating standardized interfaces and monitoring functionality into every service, so that monitoring and discovery data becomes ubiquitously available. Indeed, this experience was a major motivator for the Web services standards [FCF+05] on which we build here. These standards define interfaces for specifying and interacting with data about services. In particular: • WS-ResourceProperties defines a mechanism by
which Web services can describe and publish resource properties, or sets of information about a resource. Resource property types are defined in the service’s WSDL, and resource properties can be retrieved, in the form of XML documents, using WS-ResourceProperties query operations.
• WS-BaseNotification defines a subscription/notification interface for accessing resource property information.
2
• WS-ServiceGroup defines a mechanism for grouping related resources and/or services together as service groups.
The MDS4 Index and Trigger services make extensive use of these standards and the mechanisms defined by them. Both use service groups as part of their administrative interface to keep track of what information they are to collect, and the primary client interfaces to the Index are resource property queries and subscription/notification.
2.2 MDS4 Services
An MDS Index service collects information about
Grid resources and makes this information available as resource properties. It differs from a UDDI registry [UDDI] primarily in the facts that it stores not only the location from which a piece of data is available, but also a cached version of the data—and maintains that cached copy current via lifetime management mechanisms.
An Index service instance (also called an Index) provides access to information via the operations defined in WS-ResourceProperties and WS-BaseNotification. The primary resource property advertised by the Index Service is a Service Group whose entries correspond to the data aggregated by this service. A user adds data to the Index by creating a service group entry to this Service Group with metadata describing how (and how often) the Index Service should acquire that data. The Index then updates this service group entry to include both the actual data and the metadata. Data added to an Index can be in any (XML) format. We provide more information about the use of Service Groups within MDS and the mechanisms used to collect data in Section 2.3.
A Grid will typically operate multiple Indexes that maintain different data for different purposes. Each GT4 container has a default Index that records resources created within the container. In addition, sites and VOs may maintain one or more Indexes to record available containers, resources, and services. In general, Index services can be arranged in hierarchies, but there is no single global Index that provides information about every resource on the Grid. This structure is deliberate, as each VO will have different policies on who can access its resources. No person is part of every VO.
In the most common use case, an Index republishes data that was originally made available by some other service. However, the current Index implementation does not collect and enforce these remote servers’
access control policies. To guard against the risk that an Index will allow broader access than the original publisher of the data intended, we recommend that the Index be run in one of two modes: a public index, in which all Index data is collected through anonymous queries and access is granted to everyone, or a personal index, in which all index data is collected using credentials delegated by an individual and access is restricted to that same individual.
The Trigger service collects information and compares that data against a set of conditions defined in a configuration file. When a condition is met, an action takes place, such as emailing a system administrator when the disk space on a server reaches a threshold. This functionality, inspired by a similar capacity in Hawkeye [HAW], has proven useful in trouble shooting for projects such as the Earth System Grid (ESG) [BBB+05].
2.3 Aggregator Framework Implementation
The Index and Trigger service implementations are
both specializations of a more general aggregator framework, a software framework for building services that collect and aggregate data. This framework can be used to construct other services: for example, it should be straightforward to implement a variant of the Index service that makes data available in Condor ClassAds format.
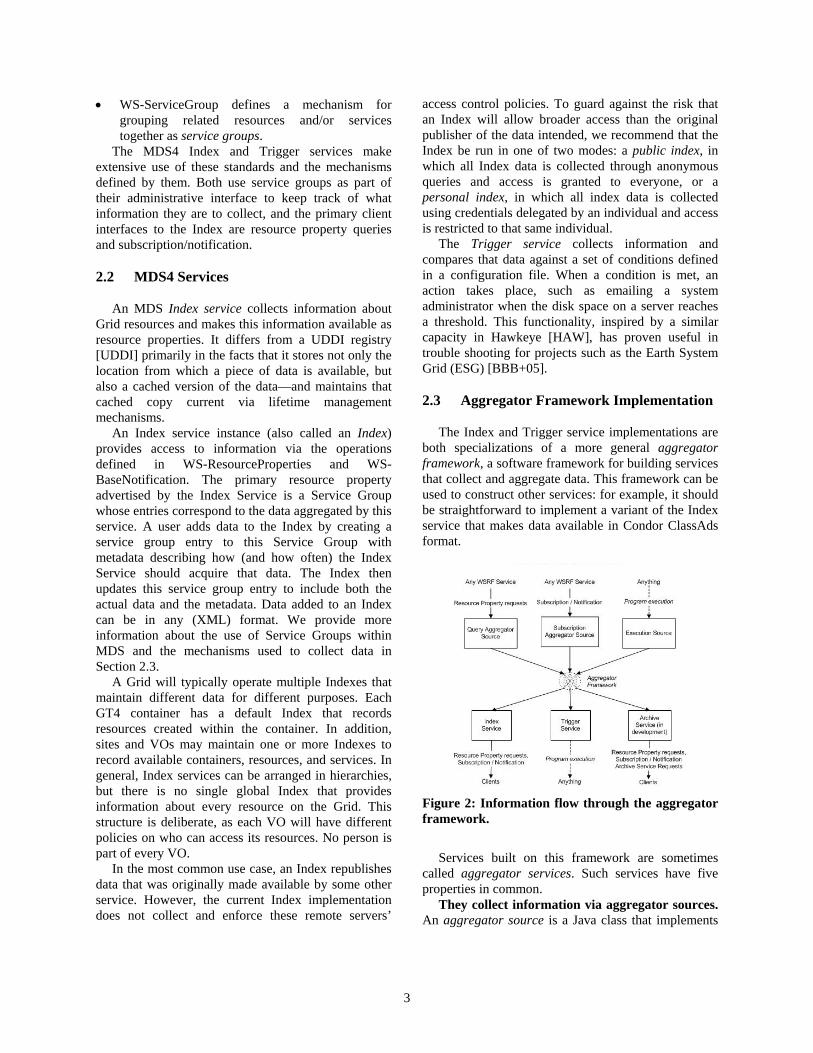
Figure 2: Information flow through the aggregator framework.
Services built on this framework are sometimes
called aggregator services. Such services have five properties in common.
They collect information via aggregator sources. An aggregator source is a Java class that implements
3

an interface (defined as part of the aggregator framework) to collect XML-formatted data. MDS4 supports three types of aggregator source (see Figure 2). A Query source uses WS-ResourceProperties mechanisms to poll a WSRF service for resource property information. A Subscription source collects data from a service via WS-Notification subscription/notification. Finally, an Execution source executes an administrator-supplied program to collect information, which is returned as an XML document.
Aggregator services use a common configuration mechanism to maintain information about aggregator sources and parameters specifying what data to get, and from where. The aggregator framework WSDL defines an aggregating WS-ServiceGroup entry type that holds both configuration information and data. Administrative client programs use standard WS-ServiceGroup registration mechanisms to register these service group entries to the Aggregator.
Soft consistency model: published information is renewed at a administrator-controllable frequency. Thus, load caused by information updates can be reduced at the expense of having slightly older information. This delay is not a problem in practice,
for example, it is generally acceptable to know the amount of free disk space on a system 5 minutes ago rather than 2 seconds ago.
Aggregator services are self-cleaning. Each registration has a lifetime, and if a registration expires without being refreshed, it and its associated data are removed from the server. Thus, outdated entries are removed automatically when they cease to renew their registrations.
The presence of a resource in an aggregator service makes no guarantee about the availability of the resource for users of that aggregator service. An aggregator service such as the Index or Trigger provides an indication that certain resources are likely to be useful, but the ultimate decision about whether the resources can be used is left to direct negotiation between user and resource. A user who has decided to access a particular service based on MDS4 information might still find they are not authorized when they submit a request. This strategy has two advantages: MDS4 need not keep track of policy information (something that is hard to do concisely) and resources need not publish policies.
Table 1: Currently available information providers for MDS4.
Name Info source Source Type Information Provided Hawkeye Condor pool Execution Basic host data (name, ID), processor
information, memory size, OS name and version, file system data, processor load data, and other basic Condor host data.
Ganglia Cluster Execution Basic host data (name, ID), memory size, OS name and version, file system data, processor load data, and other basic cluster data.
Nagios Cluster Execution Same as Ganglia CluMon Cluster Execution Same as Ganglia GRAM GT4 grid resource
allocation and management service
Query, Subscription
Processor information, memory size, queue information, number of CPUs available and free, job count information, and some memory statistics
RFT GT4 reliable file transfer service
Query, Subscription
RFT service status data, number of active transfers, transfer status, information about the resource running the service
CAS GT4 community authorization service
Query, Subscription
Identifies the VO served by the service instance
RLS GT4 replica location service
Execution Location of replicas on physical storage systems (based on user registrations) for later queries
Basic Every GT4 Web service
Query, Subscription
ServiceMetaDataInfo element includes start time, version, and service type name
TeraGrid Configuration file Execution TeraGrid-specific cluster data
4

2.4 Information Providers The data that an MDS4 aggregator source publishes
into an aggregator service is obtained from an external component called an information provider. In the case of a Query or Subscription source, the information provider is a WSRF-compliant service from which data is obtained via WS-ResourceProperty or WS-Notification mechanisms, respectively. In the case of an Execution source, the information provider is an executable program that obtains data via some domain-specific mechanism. Table 1 lists the currently available information providers for MDS4. 2.5 User Interfaces
An advantage of using a standard, widely-adopted data format such as XML is that one can then use various commodity tools to manipulate data. For
example, we have developed a tool called WebMDS that uses standard resource property requests to query resource property data and XSLT transforms [XSLT] to format and display them. In this way, we obtain user-friendly front-end to Index data. Web site administrators can customize their own WebMDS deployments by using HTML form options and creating their own XSLT transforms. Index data can also be retrieved in its raw XML format via WebMDS and viewed using a web browser’s native XML formatting capabilities, or saved in a file and viewed using any commodity XML viewer. Figure 3 shows a sample general WebMDS page, and Figure 4 shows the TeraGrid adaptation we have deployed.
In addition, GT4 command-line clients (wsrf-query, wsrf-get-property, wsrf-get-properties) and corresponding Java, C, and Python API implement resource property query operations that can be used to query an Index directly, when required.
Figure 3: Sample WebMDS page from
http://mds.globus.org:8080/webmds/webmds?info=indexinfo&xsl=servicegroupxsl.
5

Figure 4: WebMDS for TeraGrid deployment.
3. Putting it All Together
We describe a typical MDS4 deployment: a multi-project VO spanning 30 sites (three representative sites are shown in Figure 3) and including a wide set of collaborating applications. The components are heterogeneous in nature, and deploy a varied set of software and services. The MDS4 online documentation provides details on how to configure the various components of such a deployment.
Working from the local level up, each clustered resource in this deployment has deployed Ganglia (on common queued clusters) or Hawkeye (on Condor pools) for host-level monitoring and to allow MDS access to scheduler and cluster information. In Figure 3, Site 1 has two clusters, each with a Ganglia deployment, and Site 2 is running Condor and Hawkeye tool. The different schedulers run on the two clusters at Site 1 (PBS and LSF, respectively), are easily handled in our MDS deployment.
Each site also runs additional services. Site 1 in Figure 3 runs a Reliable File Transfer (RFT) server and Site 3 a Replica Location Service (RLS). In addition, each site has deployed a site-wide Index (e.g., the Index for Site 1 is labeled “A” in Figure 3). Each such Index contains all services and resources at the site, and thus allow the site to track its local resources, including those provided by Ganglia or Hawkeye.
Application B in Figure 3 also operates an application-specific Index (“B”) that contains registrations for the application-specific services at the different sites: i.e., the RFT service at Site 1 and the RLS service at Site 3. This Index makes it easy for users of those applications to see track such application-specific resources and services.
Figure 3 also shows that this VO has decided on a three-level tier for the VO-wide indexes. The first tier is at the site level, as described. The second tier is an East Coast-West Coast division, whereby Sites 2 and 3 share a combined West Coast Index running at Site 2 (labeled C in Figure 3). Site 2 also maintains the VO-wide server running on a resource at Site 2 (labeled D
6

in Figure 3) to which the other sites’ Index services have also registered. This structure allows any VO participant to view all VO resources. In general, such hierarchical structures can be arbitrarily deep—indeed, they may not be organized hierarchical.
The VO has deployed WebMDS as well (“E” in Figure 3) so that all VO users can view the current state of VO resources and services. In addition, a Trigger service (“F”) is deployed to alert interested parties about changes in VO status. The VO operations center uses this Trigger for automatic notification of service failures.
This deployment provides VO members with a rich collection of data that they can use in a variety of
ways. For example, they can make job submission or replica selection decisions by querying the VO-wide Index; evaluate the status of Grid services by looking at the VO-wide WebMDS setup; and/or be notified when disks are full or other error conditions happen by being on the list of administrators via the configured Trigger service. Individual projects can examine just the state of the resources and services of interest to them, as Application B is doing. Furthermore, these sophisticated capabilities are provided quite easily, via the appropriate configuration of mechanisms and interfaces built in to every GT4 container and service.
WebMDS
Site 3
App BIndexApp BIndex
Site 3IndexSite 3Index
Rsc 3.a
RLS
I
Rsc 3.b
RLS
II
Rsc 3.b
Site 1
West CoastIndex
West CoastIndex
TriggerService
Rsc 2.a
HawkeyeHawkeye
Rsc 2.b
GRAMGRAMII
Site 2IndexSite 2IndexSite 2Index
Ganglia/LSF
Rsc 1.c
GRAM(LSF)I
Ganglia/LSFGanglia/LSF
Rsc 1.c
GRAM(LSF)GRAM(LSF)II
Rsc 1.a
Ganglia/PBS
Rsc 1.b
GRAM(PBS)I
Ganglia/PBSGanglia/PBS
Rsc 1.b
GRAM(PBS)GRAM(PBS)II
Site 1IndexSite 1IndexSite 1Index
RFTRFT
Rsc 1.d
II
AA
BB
CC
DD
EE
VO Index
FF
Trigger action
Figure 5: Sample MDS4 deployment. Yellow (light grey) boxes are containers, orange (dark grey) are
services, ovals are Indexes, white boxes with a small outline are resources, and white boxes with a thick line are sites. The dashed lines are registrations.
7
4. MDS4 Performance Results
We performed experiments to measure MDS4 query response time, throughput, and stability, and to compare MDS4 performance with that of MDS2. This included the response time and throughput, stability, and capacity of the Index service.
4.1 Index Performance
We first quantify MDS4 response time, or time to serve a query request, and throughput, or aggregate number of queries per minute. We find that query performance is tied to the size of the index being queried, the number of other concurrent requests, and the size of a query. Our experiments investigate this performance space. 4.1.1 Experimental Methodology
We ran our experiments on a portion of the University of Chicago TeraGrid machine, with 20 dedicated IA32 nodes used to run the client workload and one dedicated IA32 node used for the Index. Each node had dual 2.4GHz Xeon processors, 4GB RAM, and SuSE v8.1. The 21 nodes were all connected via 1Gb/s Ethernet network.
The Index was populated with sample entries consisting of the standard pieces of information required for a ServiceGroupEntry (i.e., ServiceGroupEntryEPR, MemberServiceEPR, Aggregator configuration information), as well as a small amount of data. The size of each sample entry was approximately 1.9KB.
We performed experiments with Indexes containing 1, 10, 25, 50, 100, 250, and 500 entries. To compare these sizes to current practice, we can look at the number of XML elements in the Index. In our current TeraGrid deployment, we collect 17 attributes from each of 10 queues at SDSC and NCSA, host data consisting of 3 attributes for approximately 900 nodes, and 12 attributes for sub-cluster data for 7 subclusters, giving us approximately 3,000 attributes, roughly 1900 XML elements, at a total size of 192KB. Each XML entry is roughly comparable to several attributes because of the overhead of the ServiceGroup registration elements for each entry, along with the actual data. To compare that to the tests run here, an Index populated with 50 sample entries has an element count of 1113 and is approximately 94KB in size. Thus, we conclude that the entry sizes used for these experiments are similar to what is being used in current
deployments from the perspective of data size and element counts.
We ran our experiments for in-cache data in the Indexes only. Current Grid deployments seem to renew data on 1, 6, or even 24 hour cycles [GITS, SOE+04], so cache misses are likely to be rare in those configurations.
We ran experiments using DiPerf [DRR+04] for approximately 10 minute each. In the first two minutes we started the concurrent clients and in the remaining eight minutes we collected performance data. Each data point is the average behavior over the eight minutes. For throughput the error bars show the 95% variance for each client for each minute. For response time, the error bars are the standard deviation of all the measurements. We ran experiments with 1, 4, 8, 16, 32, 64, 128, 256, 384, 512, 640, 768, and 800 concurrent clients. The limit of 800 clients was due to a maximum of 1024 open file descriptors allowed on our test-bed machine. Sites with root permissions can adjust this parameter.
Each query retrieved all data in the Index. We did this because we wanted to reflect the performance of the MDS infrastructure not the performance of Xquery’s searches. Each client only opens and closes its connection to the server once over the course of an experiment.
We compare our performance to that of the MDS2 [CFF+01] Index service. MDS2 is an LDAP-based monitoring system that is part of the pre-WS Globus Toolkit v 2.4.3. A more detailed description is given in Section 5. We used a 100-entry Index, which was approximately 11.4KB in size. The queries were for the full Index contents.
4.1.2 Results
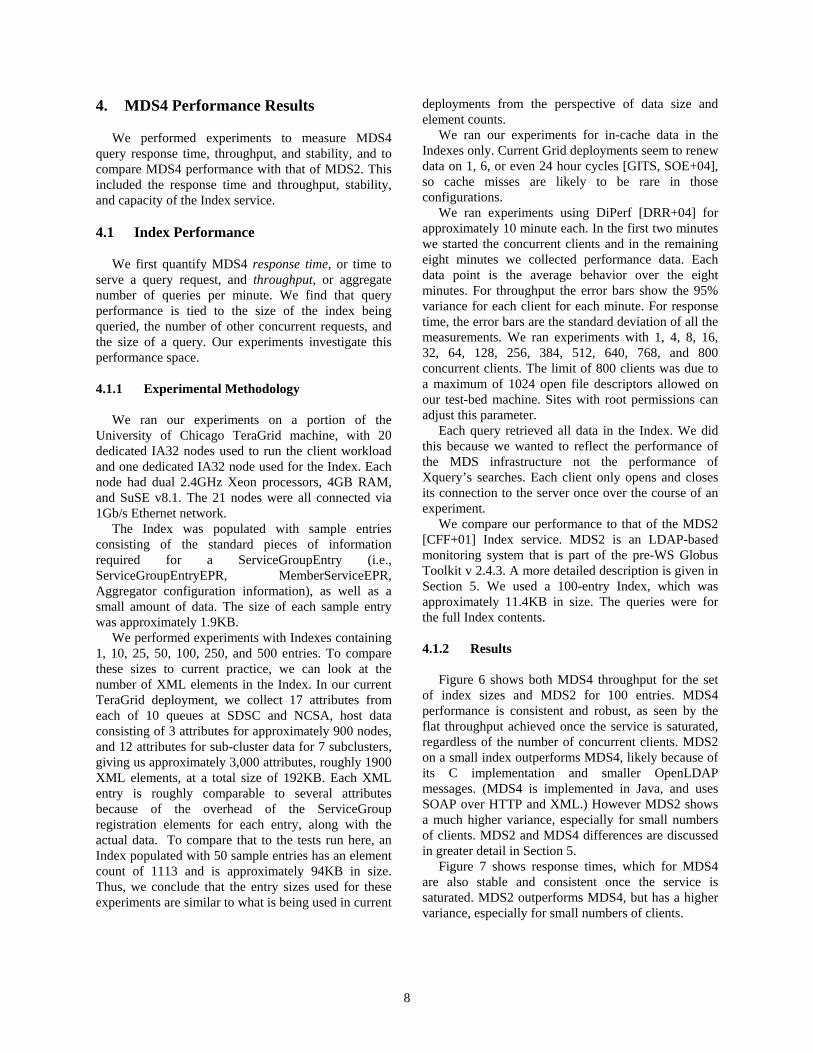
Figure 6 shows both MDS4 throughput for the set of index sizes and MDS2 for 100 entries. MDS4 performance is consistent and robust, as seen by the flat throughput achieved once the service is saturated, regardless of the number of concurrent clients. MDS2 on a small index outperforms MDS4, likely because of its C implementation and smaller OpenLDAP messages. (MDS4 is implemented in Java, and uses SOAP over HTTP and XML.) However MDS2 shows a much higher variance, especially for small numbers of clients. MDS2 and MDS4 differences are discussed in greater detail in Section 5.
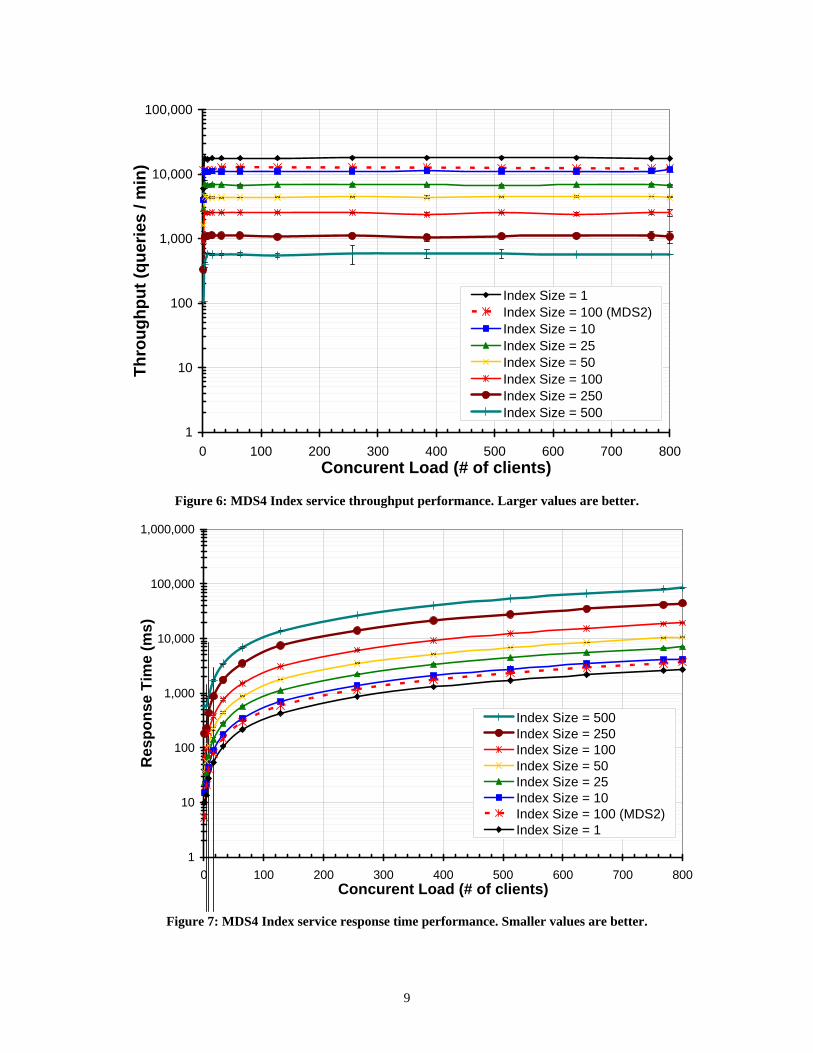
Figure 7 shows response times, which for MDS4 are also stable and consistent once the service is saturated. MDS2 outperforms MDS4, but has a higher variance, especially for small numbers of clients.
8
1
10
100
1,000
10,000
100,000
0 100 200 300 400 500 600 700 800Concurent Load (# of clients)
Thro
ughp
ut (q
uerie
s / m
in)
Index Size = 1Index Size = 100 (MDS2)Index Size = 10Index Size = 25Index Size = 50Index Size = 100Index Size = 250Index Size = 500
Figure 6: MDS4 Index service throughput performance. Larger values are better.
1
10
100
1,000
10,000
100,000
1,000,000
0 100 200 300 400 500 600 700 800Concurent Load (# of clients)
Res
pons
e Ti
me
(ms)
Index Size = 500Index Size = 250Index Size = 100Index Size = 50Index Size = 25Index Size = 10Index Size = 100 (MDS2)Index Size = 1
Figure 7: MDS4 Index service response time performance. Smaller values are better.
9

4.2 Index Service Stability
To test service stability, we ran long-running experiments against Indexes of different sizes on a cluster of dual-processor Intel PIII 1133MHz computers, each with 1.5GB of RAM and connected on the same physical switch via Gigabit Ethernet. The Indexes were populated as in the previous experiment. In each case, multiple clients repeatedly queries the Index, which is running on a separate machine. Stability is excellent.
Table 2: Index service stability results.
Vers. Index
Size
Time up
(Days)
Queries
Processed
Query
Per
Sec.
Round-trip
Time (ms)
4.0.1 25 66+ 81,701,925 14 69
4.0.1 50 66+ 49,306,104 8 115
4.0.1 100 33 14,686,638 5 194
4.0.0 1 14 93,890,248 76 13
4.0.0 1 96 623,395,877 74 13
4.3 Index Service Maximum Size
The MDS4 Index is currently maintained in memory, and thus the maximum Index size is limited by the Java heap size. To evaluate the practical applications of this approach, we measured the maximum number of sample entries that could be stored for different heap sizes, Table 3 shows that the number of entries scales linearly with available memory. The maximum heap size on a most machines is approximately 2GB due to address space limitations. We are currently examining out-of-memory approaches for larger indexes.
Table 3: Container heap size currently dictates the number of entries in an MDS4 Index service.
Heap Size
(MB)
Approx. Max.
Index Entries
Index Size
(MB) 64 600 1.0
128 1275 2.2 256 2650 4.5 512 5400 9.1
1024 10800 17.7
1536 16200 26.18 5. MDS4 vs MDS2: Other Factors
MDS2 was one of the first cross-administrative domain grid monitoring systems, It was designed “to support initial discovery and ongoing monitoring of the existence and characteristics of resources, services, computations, and other entities” [CFF+01]. It defined the basic architecture for grid monitoring that we are still using today – a set of distributed information providers that communicate with a set of higher level services that collect, manage, index and respond to the data, with caching and soft-state registrations.
While MDS4 and MDS2 have a similar architecture, they differ significantly in their implementations. MDS2 is primarily a set of C-coded LDAP backend modules to the University of Michigan’s OpenLDAP server. Published information is modeled in the LDIF format, and information providers are mostly shell scripts. While the tight integration with the OpenLDAP server provided certain advantages, in particular fast client query response times, the MDS2 index’s caching ability was hampered by the lack of a persistent query mechanism and cache stability issues in large deployments.
In contrast, the MDS4 code is written in Java and runs on top of the SOAP-over-HTTP protocol stack used by the GT4 Java WSRF core, which allows MDS4 to be closely integrated with core GT4 functionality. Unlike MDS2, MDS4 is designed as an integral part of GT4 that leverages many of its features including the communication protocols, shared code-base, and WSRF-compatibility. In contrast, MDS2 system was a separate component with a more loosely-coupled integration to the rest of the toolkit.
WSRF compliance provides MDS4 with standard, well-defined interfaces. The MDS4 Index can, without any modification, aggregate any data advertised as resource properties by any service that supports any of the query or subscription/notification operations defined in the WS-ResourceProperties specification, and any client application that supports the operations described in that standard can query or receive notifications from the MDS4 Index.
While the MDS2 protocols specified the use of LDAP as a query language, the MDS4 standards allow for the use of multiple query languages, with the name of the query language specified as part of the query request. Our current implementation supports only XPath; however, the GT4 code base includes a plug-in interface to support additional query languages.
MDS4 also benefits from added extensibility when working with information providers. User-
10
customizable API and code mechanisms are provided to make the task of data ingestion more flexible. The Aggregator mechanism provides a facility through which XML data can be ingested from a variety of sources (including WSRF services, non-WSRF services, and/or external programs or program interfaces), and subsequently published as a single aggregate resource property using the WS-ServiceGroup paradigm. In addition to the Aggregator component, MDS4 also provides a similar facility for working with WS-Resource Properties, whereby data can be collected from the same variety of potential information sources as the Aggregator, but is published as individual WS-Resource Properties rather than Service Group entries.
In MDS2, the learning curve for writing information providers was steep and often involved more than simple working knowledge of the LDIF data format, which could include such activities as registering LDIF OID namespaces with a naming authority and other complex information modeling tasks in order for compliance with the LDIF data format. The XML-based information model for data in MDS4 is generally considered to be more flexible and user-friendly than LDIF, and the process of writing and/or integrating information providers into the system is easier and less time-consuming. In fact, for WSRF-compliant services, no special information provider is required; if the service advertises resource properties, the MDS4 services can aggregate those properties without using specialized providers. Common registration tasks are simplified, allowing for easier construction of VOs. Furthermore, the addition of the Trigger service allows for more sophisticated monitoring configurations to be constructed, which in MDS2 were not possible without extensive customizations to the existing code.
MDS4 is also more reliable than MDS2. The MDS4 Index is able to sustain a heavy load for months without significant impact on server performance. In contrast, MDS2 servers experienced significant load and memory usage problems when run for prolonged periods without restarting. This difference is apparent in the high MDS2 variance numbers, which we attribute in part to concurrency issues that result in not all homogenous clients receiving equal share of resources. Thus, the time to answer a query can vary by orders of magnitude across different clients.
6. Related Work
The MDS4 approach is not dissimilar to others used in the field. Its primary advantage is the use of
standard interfaces, the flexibility of the information provider infrastructure, the robust high-level services, and notification of failures. It can, and does, interact with many other tools in order to provide a standard interface to a wide variety of data.
The most closely related project is Inca [SOE+04], which is primarily used for software stack validation and site certification. A central manager controls a set of information providers (called reporters) that are run at regular intervals, collecting data in an archive (called the depot). It is currently deployed on TeraGrid [TG], GEON [GEON], NGS [NGS], and DEISA [DEI]. Inca does not gather cluster or queuing data for resource selection data at this time.
R-GMA [CGM+03] is the other widely-deployed monitoring framework, primarily because of its strong ties to the EGEE project [EGEE]. R-GMA makes all data that is publishes appear as if it were all resident in a single, large, relational database. However, because it does not use caching, it has had significant performance problems [ZFS05].
There are many other tools that look at part of the Grid monitoring and discovery space, these include Nagios [NAG], Ganglia [MCC04], and MonaLisa [Legrand03].
Similarly, there is a large body of work on resource discovery in large-scale distributed systems, for example pragmatic systems such as SWORD [OAP+04], CAN [RFH+01] , CHORD [SMK+01] , PASTRY [RD01] and TAPESTRY [ZKJ01], and more theoretical work, such as [HLL99].
Performance studies of Grid monitoring systems include work on previous MDS versions. Smith et al. [SWM+00] investigated MDS2 performance by focusing on the effect of different versions of backend LDAP and data distribution strategies. Aloisio et al. [ACE+01] studied the capabilities and limitations of MDS2 as well as the security effect on the performance although their experiments were limited to simple tests on the MDS2 Index (GIIS) only.
Keung et al. [KDJ+03, KDJ+03b] analyzed MDS2 performance with different back-end implementations by varying information-gathering methods. This work compliments our studies [ZS04] in which we examined MDS2 behavior at a fine granularity by using NetLogger technologies to instrument the server and client codes, but did not compare this behavior to any other system. Zhang et al. have examined the performance of MDS2, R-GMA, and Hawkeye [ZFS03, ZFS05].
Plale et al. [PJJ+04, PJL+03] benchmarked a synthetic workload (queries and updates) against a non realistic Grid information service implemented with three different database platforms: relational
11
(MySQL), native XML (Xindice), and LDAP. In other work, Plale et al. [PDvL02] discussed the pros and cons of building a Grid Information service on a hierarchical representation and a relational representation; however, their approach was theoretical not experimental.
7. Conclusions
We have described how monitoring and discovery
capabilities can be integrated into the design of a distributed computing infrastructure so that any and every resource and service can be monitored and discovered in a uniform manner. Using Web service standards that define the primitive interfaces and behaviors, we have built the basis of a monitoring system for Grid use. Our initial performance results indicate that the basic performance is acceptable, although further work is needed to understand performance bottlenecks of the system. Acknowledgments
We appreciate the help of Xuehai Zhang for
assistance with the experiments. This work was supported in part by the Mathematical, Information, and Computational Sciences Division subprogram of the Office of Advanced Scientific Computing Research, Office of Science, U.S. Department of Energy, under contract W-31-109-Eng-38. Additional support was provided by NSF NMI Award SCI-0438372. References [ACE+01] G. Aloisio, M. Cafaro, I. Epicoco, and S. Fiore, “Analysis of the globus toolkit grid information service”, GridLab technical report GridLab-10-D.1-0001-GIS_Analysis, 2001. [BBB+05] D. Bernholdt, S. Bharathi, D. Brown, K. Chanchio, M. Chen, A. Chervenak, L. Cinquini, B. Drach, I. Foster, P. Fox, J. Garcia, C. Kesselman, R. Markel, D. Middleton, V. Nefedova, L. Pouchard, A. Shoshani, A. Sim, G. Strand, and D. Williams, “The Earth System Grid: Supporting the Next Generation of Climate Modeling Research”, Proceedings of the IEEE, 93 (3), p 485-495, 2005. [CFF+01] K. Czajkowski, S. Fitzgerald, I. Foster, and C. Kesselman, “Grid Information Services for Distributed Resource Sharing“, Proceedings of the10th
IEEE International Symposium on High Performance Distributed Computing, p 181-184, 2001. [CGM+03] A. Cooke, A.Gray, L. Ma, W. Nutt, J. Magowan, P. Taylor, R. Byrom, L. Field, S. Hicks, and J. Leake, “R-GMA: An Information Integration System for Grid Monitoring”, Proceedings of the 11th International Conference on Cooperative Information Systems, 2003. [DEI] DEISA: The Distributed European Infrastructure for Supercomputing Applications, http://www.deisa.org/ . [DRR+04] C. Dumitrescu, I. Raicu, M. Ripeanu, and I. Foster, “DiPerF: Automated DIstributed PERformance Testing Framework”, Proceedings of the 5th International Workshop in Grid Computing, 2004. [EGEE] Enabling Grids for eScience Project, http://public.eu-egee.org/ . [Foster05] I. Foster, “A Globus Toolkit Primer”, www.globus.org/primer, 2005. [FCF+05] I. Foster, K. Czajkowski, D. Ferguson, J. Frey, S. Graham, T. Maguire, D. Snelling, and S. Tuecke, “Modeling and Managing State in Distributed Systems: The Role of OGSI and WSRF”, Proceedings of the IEEE, 93 (3). 604-612. 2005. [GEON] GEON: Cyberinfrastructure of the Geosciences, http://www.geongrid.org/ . [GITS] Grid Integration test Service (GITS), http://www.ngs.rl.ac.uk/sites/common/docs/gits14.html . [GLUE] Glue Schema Specification, www.hicb.org/glue/glue-schema/schema.html . [GT03] D. Gunter and B. Tierney, “NetLogger: A Toolkit for Distributed System Performance Tuning and Debugging,” Proceedings of Integrated Network Management 2003, 2003. [Haw] Hawkeye, http://www.cs.wisc.edu/condor/hawkeye. [HLL99] Mor Harchol-Balter, Tom Leighton, Daniel Lewin, “Resource Discovery in Distributed Networks”, Proceedings of the 18th Annual ACM-SIGACT/SIGOPS Symposium on Principles of Distributed Computing, pp. 229-238, May 1999.
12

[KDJ+03] H. N. Lim Choi Keung, J. R. D. Dyson, S. A. Jarvis, and G. R. Nudd, “Performance evaluation of a grid resource monitoring and discovery service”, IEEE Proceedings: Software, vol. 150, pp. 243-251, 2003. [KDJ+03b] H. N. Lim Choi Keung, J. R. D. Dyson, S. A. Jarvis, and G. R. Nudd, “Predicting the Performance of Globus Monitoring and Discovery Service (MDS-2) Queries”, 4th International Workshop on Grid Computing, 2003. [Legrand03] Iosif Legrand, “MonaLisa: MONitoring Agents using a Large Integrated Architecture”, talk available from http://chep03.ucsd.edu/files/103.pdf . [MCC04] Massie, M.L., Chun, B.N. and Culler, D.E, “The Ganglia Distributed Monitoring System: Design, Implementation, and Experience”, Parallel Computing, 30 (7), 2004. [NAG] Nagios, http://www.nagios.org/ . [NGS] The UK National Grid Service, http://www.ngs.ac.uk/ . [OAP+04] D. Oppenheimer, J. Albrecht, D. Patterson, and A. Vahdat, “Distributed resource discovery on PlanetLab with SWORD”, 1st Workshop on Real, Large Distributed Systems, 2004. [PDvL02] B. Plale, P. Dinda, and G. v. Laszewski, “Key concepts and services of a grid information service,” Proceedings of the 15th International Conference on Parallel and Distributed Computing Systmes (PDCS), 2002. [PJJ+04] B. Plale, C. Jacobs, S. Jensen, Y. Liu, C. Moad, R. Parab, and P. Vaidya, “Understanding Grid Resource Information Management through a Synthetic Database Benchmark/Workload”, Proceedings of the 4th IEEE/ACM International Symposium on Cluster Computing and the Grid (CCGrid2004), 2004. [PJL+03] B. Plale, C. Jacobs, Y. Liu, C. Moad, R. Parab, and P. Vaidya, “Benchmark Details of Synthetic Database Benchmark/Workload for Grid Resource Information”, Indiana University Computer Science Technical Report TR-583 Technical Report TR-583, August 2003 2003. [RD01] A. Rowstron and P. Druschel, “Pastry: Scalable, Decentralized Object Location, and Routing for Large-
Scale Peer-to-Peer Systems”, in Proceedings of IFIP/ACM International Conference on Distributed Systems Platforms (Middleware), 2001, p. 329–350. [RFH+01] S. Ratnasamy, P. Francis, M. Handley, R. Karp, and S. Shenker. “A Scalable Content Addressable Network”, in Proceedings of ACM SIGCOMM 2001, 2001. [SMK+01] I. Stoica, R. Morris, D. Karger, F. Kaashoek, and H. Balakrishnan, “Chord: A Scalable Peer-To-Peer Lookup Service for Internet Applications”, in Proceedings of the 2001 ACM SIGCOMM Conference, 2001, p. 149–160. [SOE+04] Shava Smallen, Catherine Olschanowsky, Kate Ericson, Pete Beckman, and Jennifer Schopf, “The Inca Test Harness and Reporting Framework”, Proceedings of SuperComputing '04, November 2004. Also available as SDSC Technical Report #SDSC-TR-2004-3, http://www.sdsc.edu/TR/SDSC-TR-2004-3-IncaTest.pdf. [SWM+00] W. Smith, A. Waheed, D. Meyers, and J. Yan, “An evaluation of alternative designs for a grid information service”, Proceedings of the 9th IEEE International Symposium on High Performance Distributed Computing (HPDC-9), 2000. [TG] TeraGrid, www.teragrid.org . [UDDI] UDDI Standard, http://www.uddi.org . [XPATH] XML Path Language (XPath) Version 1.0, Nov. 1999, http://www.w3.org/TR/xpath . [XSLT] XSL Transformations (XSLT) Version 1.0, Nov. 1999, http://www.w3.org/TR/xslt . [ZFS03] X. Zhang, J. Freschl, and J. M. Schopf, “A performance study of monitoring and information services for distributed systems,” Proceedings of the 12th IEEE International Symposium on High Performance Distributed Computing (HPDC-12), 2003. [ZFS05] Xuehai Zhang, Jeffrey L. Freschl, and Jennifer M. Schopf, “A Scalability Analysis of Three Monitoring and Information Systems: MDS2, R-GMA, and Hawkeye”, ANL Tech Report, available from www.mcs.anl.gov/~jms/jmspubs.html, 2005. [ZKJ01] B. Y. Zhao, J. D. Kubiatowicz, and A. D. Joseph, “Tapestry: An Infrastructure for Fault-tolerant
13

Wide-area Location and Routing”, Technical report, UC Berkeley, April 2001, no UCB/CSD-01-1141. [ZS04] X. Zhang and J. M. Schopf, “Performance Analysis of the Globus Toolkit Monitoring and
Discovery Service, MDS2”, Proceedings of IEEE IPCCC International Workshop on Middleware Performance (IWMP 2004), 2004.
14