Embed Size (px)
Citation preview
ME 142Engineering Computation I
Graphing with Excel
Key Concepts
Creating a Basic XY Scatter GraphLinking Chart Titles to a CellAdding Data to an Existing GraphPlotting Multiple CurvesPlotting Multiple Curves with Diff. X ValuesAdding a Trend LineModifying the Graph
Creating a Basic XY Scatter Graph
What is the difference between an XY Scatter Graph and a Line Graph?
Creating a Basic XY Scatter Graph
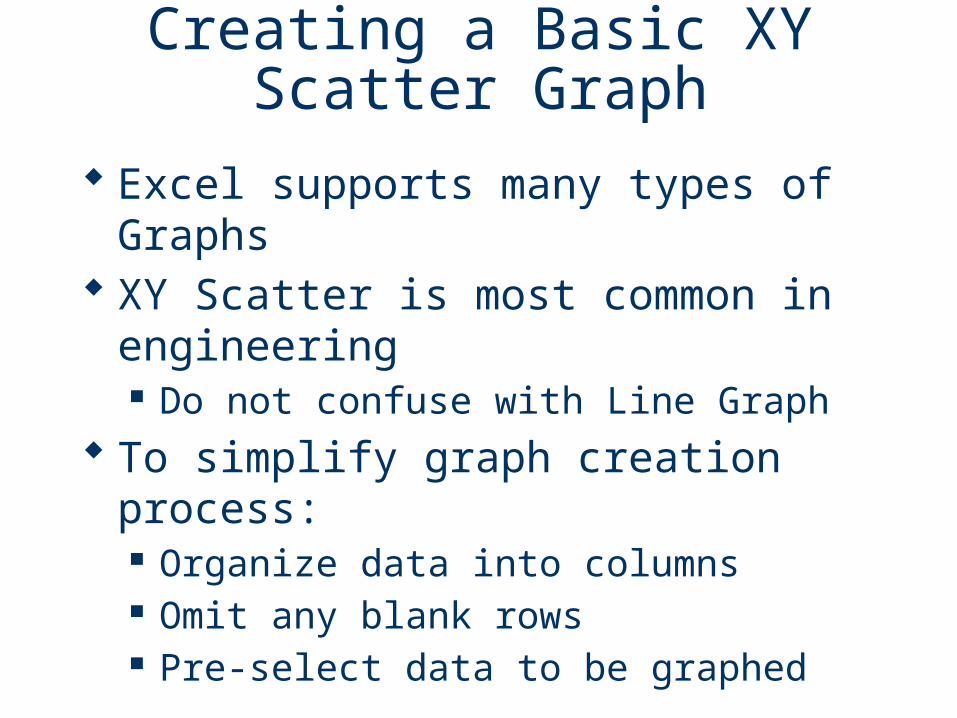
Excel supports many types of Graphs XY Scatter is most common in engineering
Do not confuse with Line Graph
To simplify graph creation process: Organize data into columns Omit any blank rows Pre-select data to be graphed
Example ProblemCreate an XY Scatter Graph:
Linking Chart Titles to a Cell
How do you link a chart title or chart label to a cell?
Example ProblemCreate an XY Scatter Graph:Link titles/labels to cells
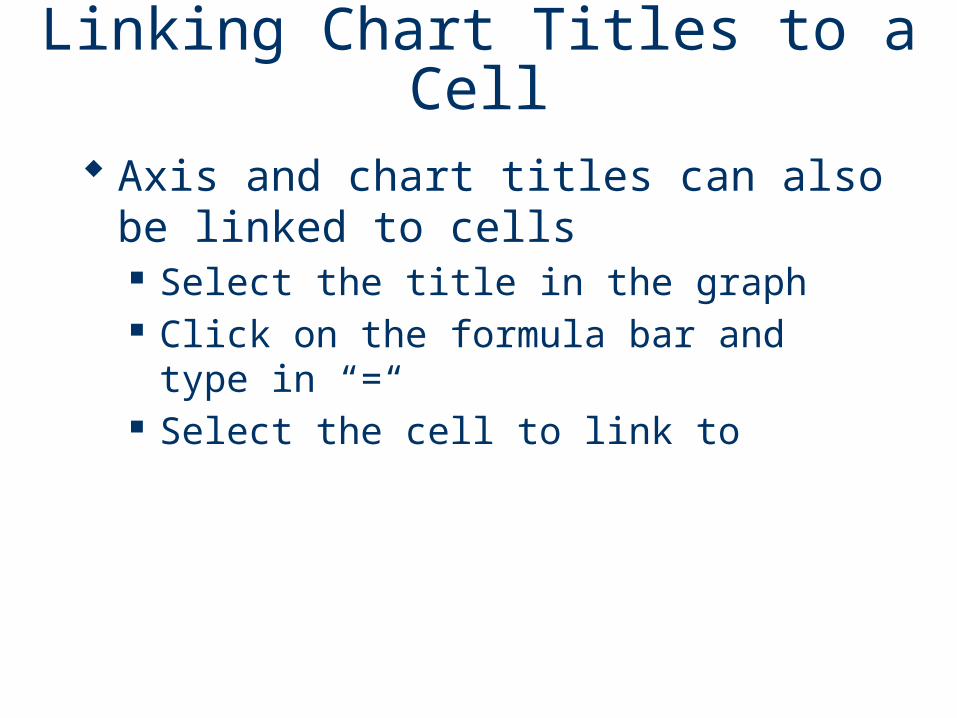
Linking Chart Titles to a Cell
Axis and chart titles can also be linked to cells Select the title in the graph Click on the formula bar and type in “=“ Select the cell to link to
Adding Data to an Existing Graph
Plotting Multiple Curves
How do you add data to an existing graph?
How do you plot multiple curves on the same graph?
Adding Data to an Existing Graph
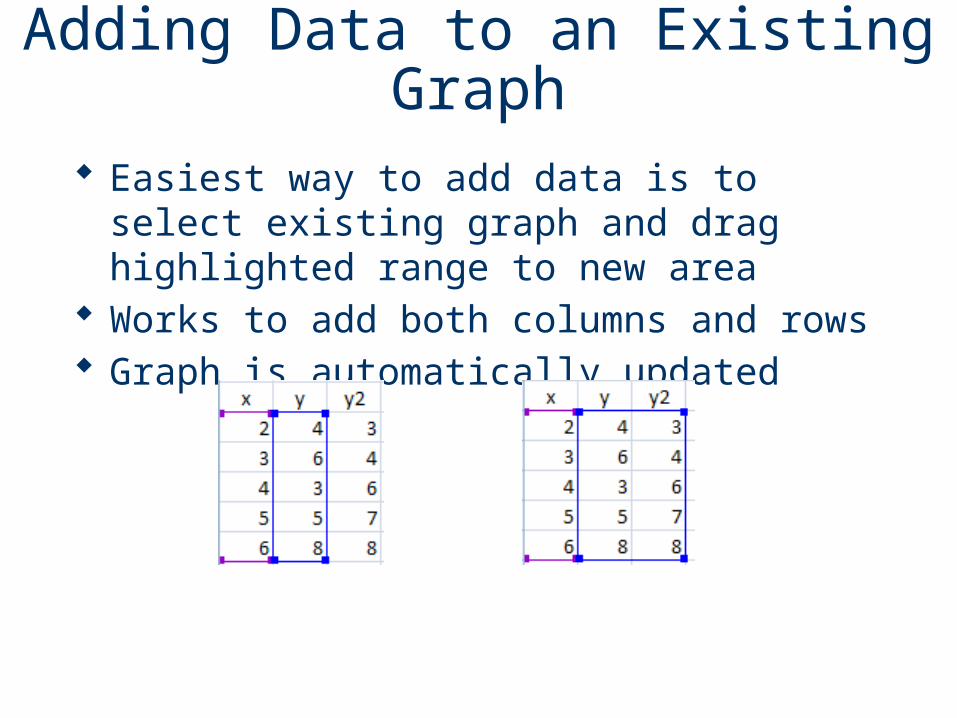
Easiest way to add data is to select existing graph and drag highlighted range to new area
Works to add both columns and rows Graph is automatically updated
Plotting Multiple Curves
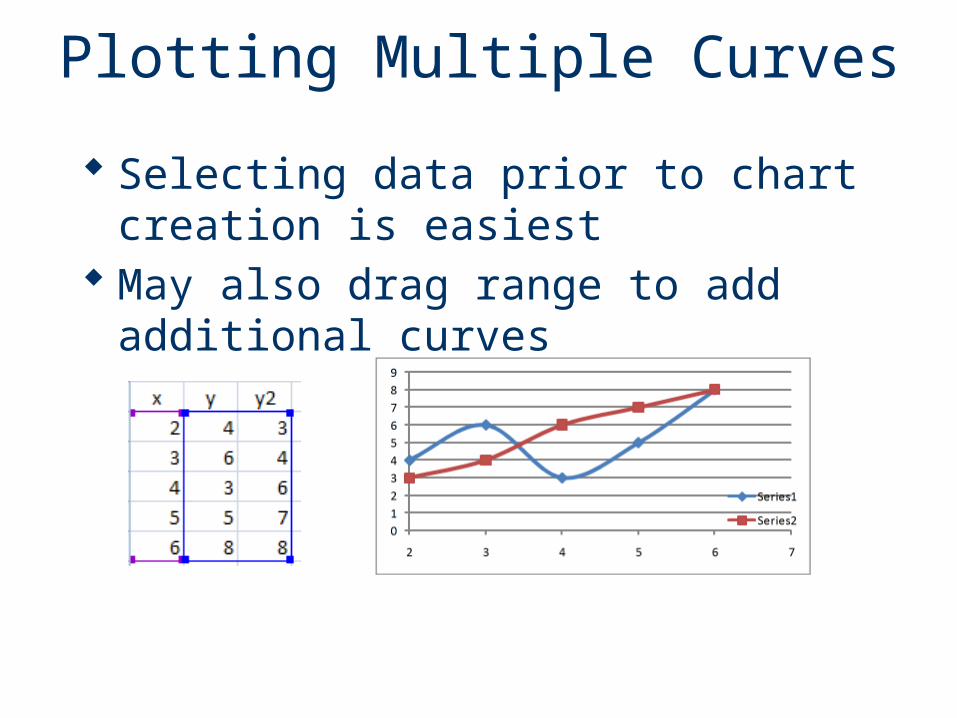
Selecting data prior to chart creation is easiest
May also drag range to add additional curves
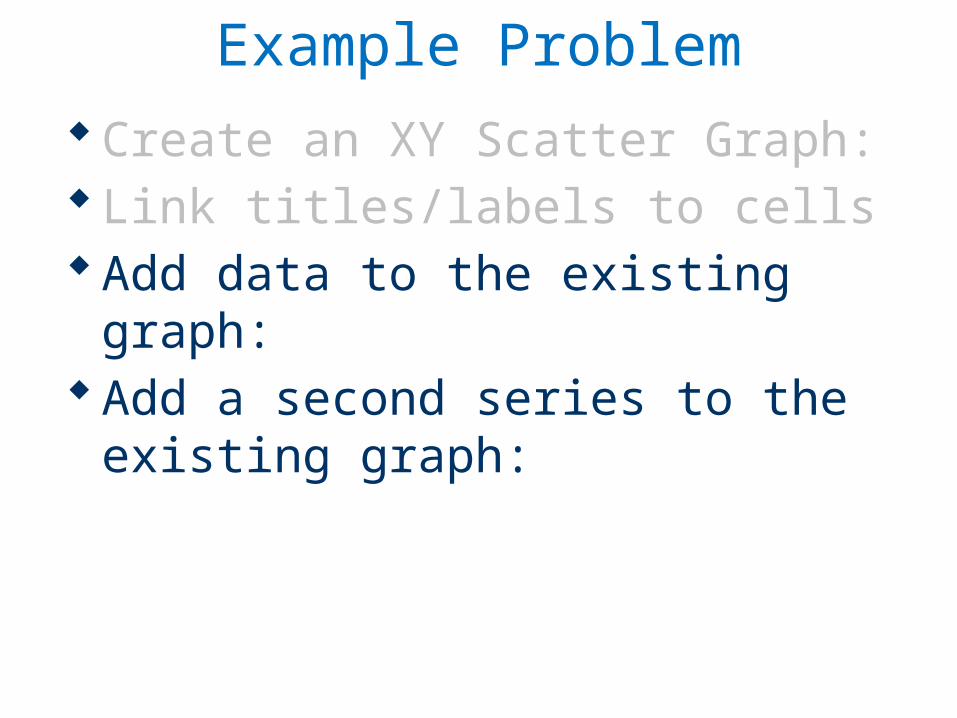
Example ProblemCreate an XY Scatter Graph:Link titles/labels to cellsAdd data to the existing graph:Add a second series to the existing graph:
Plotting Multiple Curves with Different X Values
How do you plot multiple curves that have different X-values on the same
graph?
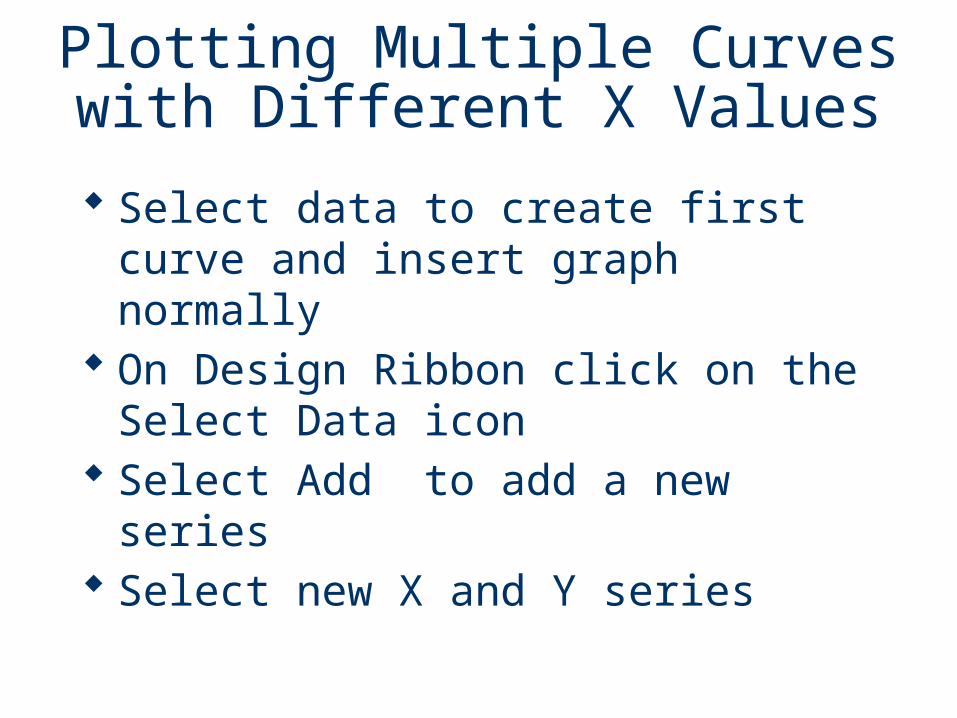
Plotting Multiple Curves with Different X Values
Select data to create first curve and insert graph normally
On Design Ribbon click on the Select Data icon
Select Add to add a new series Select new X and Y series
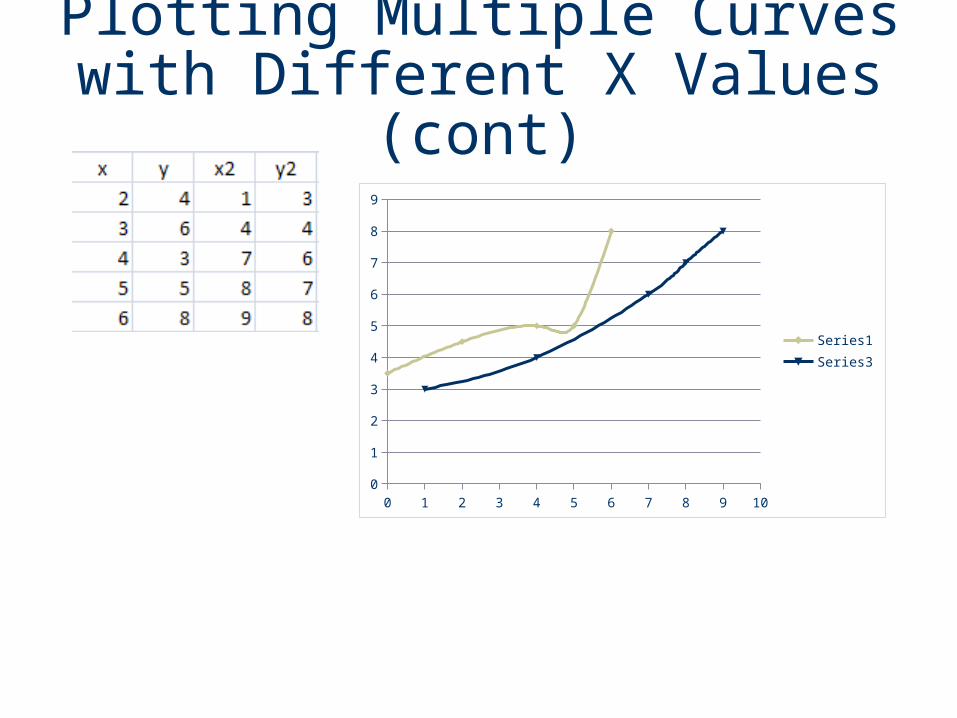
Plotting Multiple Curves with Different X Values (cont)
0 1 2 3 4 5 6 7 8 9 100
1
2
3
4
5
6
7
8
9
Series1
Series3
Adding a Trend Line
What is a Trend line?
How do you add a Trend line to an existing graph?
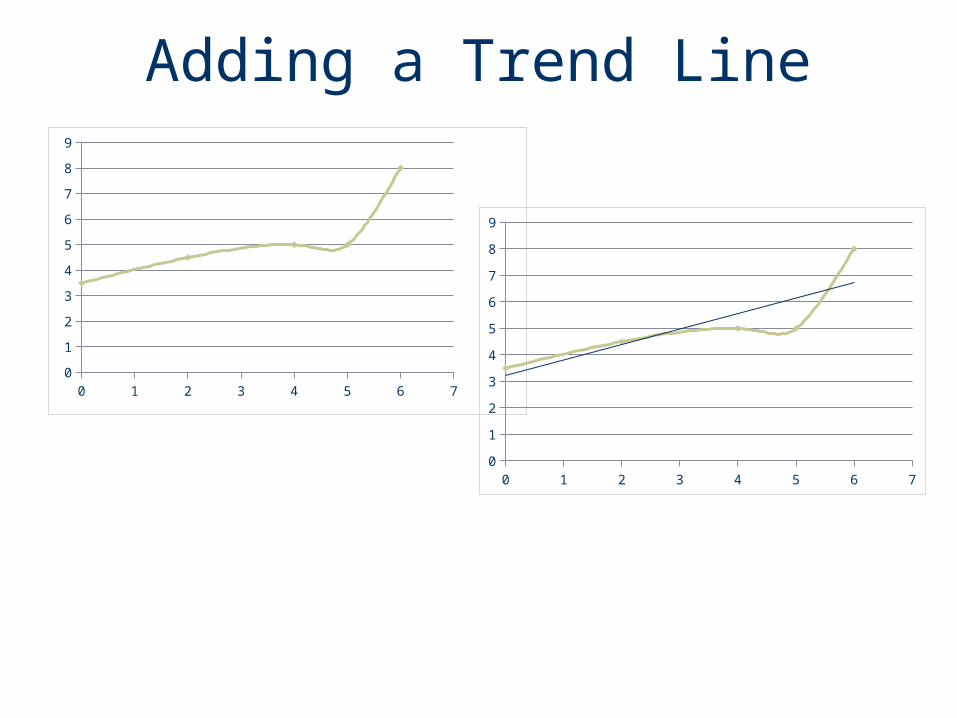
Adding a Trend Line
0 1 2 3 4 5 6 70
1
2
3
4
5
6
7
8
9
0 1 2 3 4 5 6 70
1
2
3
4
5
6
7
8
9
Common Graph Modification Tasks
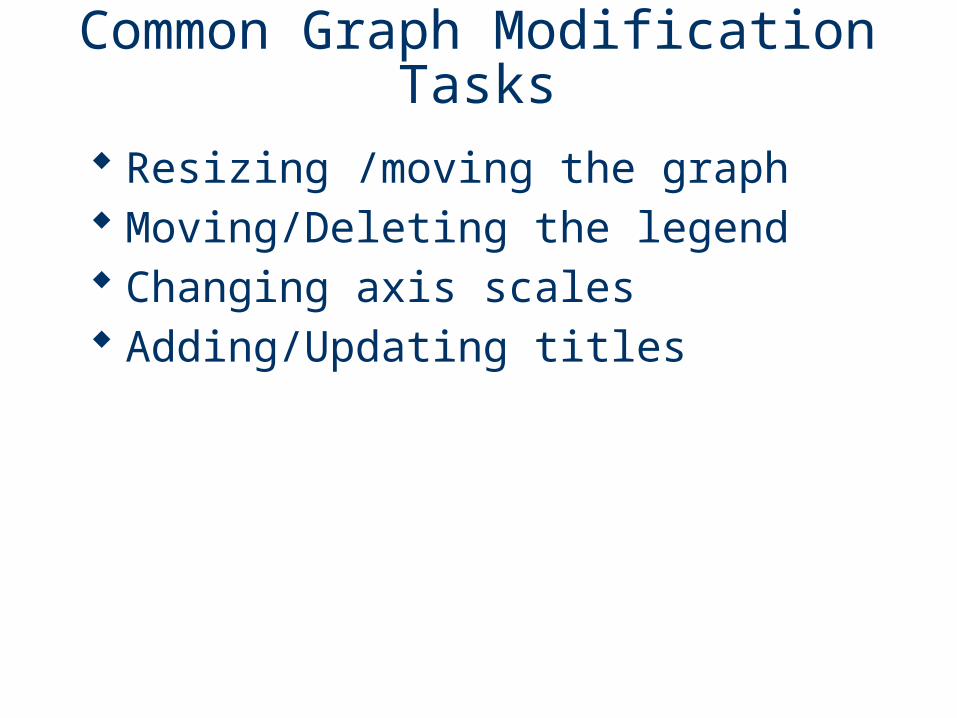
Common Graph Modification Tasks
Resizing /moving the graph Moving/Deleting the legend Changing axis scales Adding/Updating titles
Review Questions
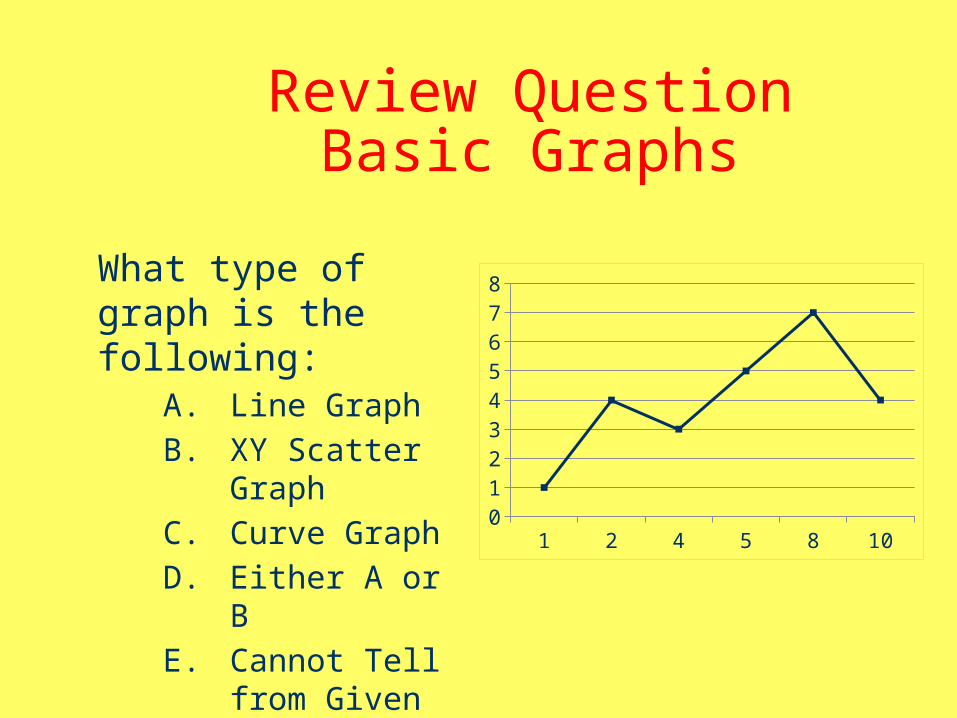
Review QuestionBasic Graphs
What type of graph is the following:
A. Line Graph
B. XY Scatter Graph
C. Curve Graph
D. Either A or B
E. Cannot Tell from Given Information
1 2 4 5 8 100
1
2
3
4
5
6
7
8
Review QuestionTrendlines
The only Trendline option supported by Excel is linear
A. True
B. False

Homework Help ‘n Hints