Embed Size (px)
Citation preview
ME 322: Instrumentation Lecture 6
January 30, 2015
Professor Miles Greiner
Review Calibration, Lab 3 Calculations, Plots and Tables
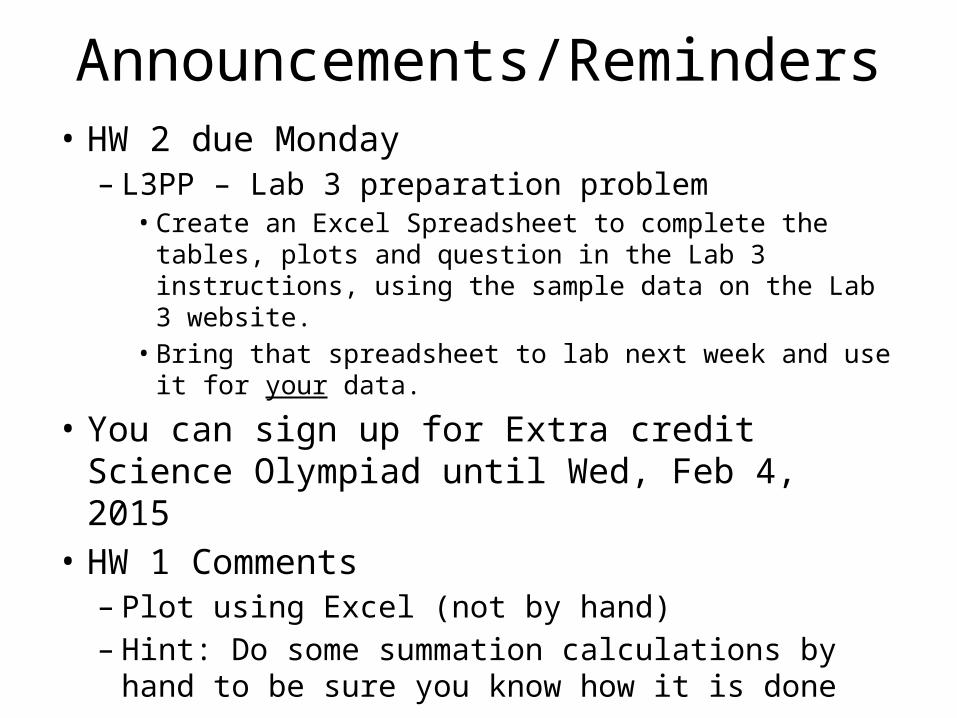
Announcements/Reminders• HW 2 due Monday
– L3PP – Lab 3 preparation problem• Create an Excel Spreadsheet to complete the tables, plots
and question in the Lab 3 instructions, using the sample data on the Lab 3 website.
• Bring that spreadsheet to lab next week and use it for your data.
• You can sign up for Extra credit Science Olympiad until Wed, Feb 4, 2015
• HW 1 Comments– Plot using Excel (not by hand)– Hint: Do some summation calculations by hand to
be sure you know how it is done
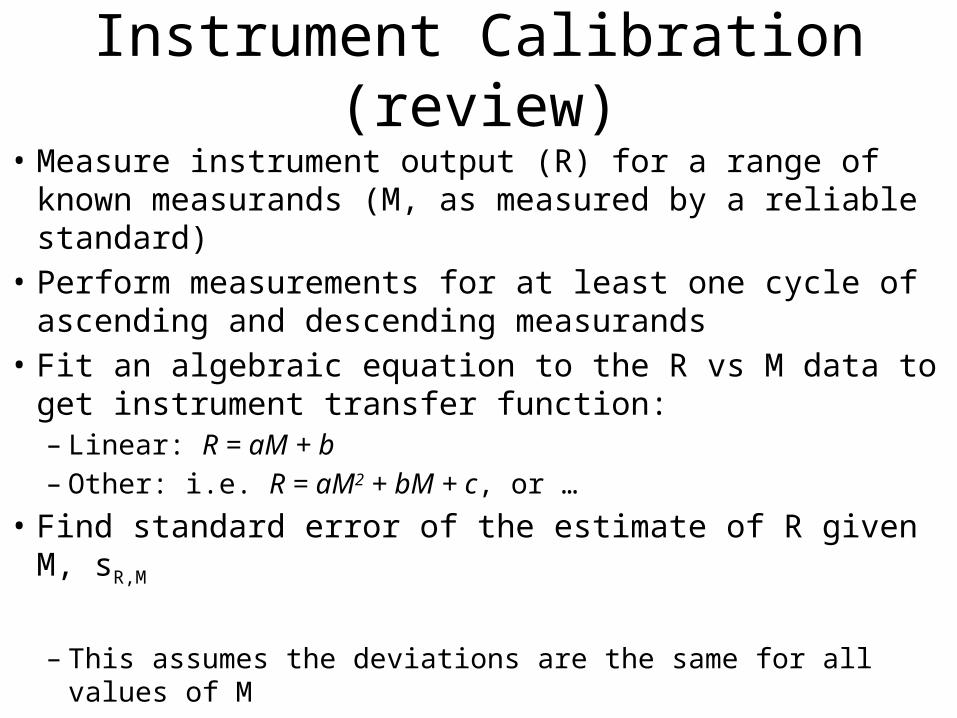
Instrument Calibration (review)
• Measure instrument output (R) for a range of known measurands (M, as measured by a reliable standard)
• Perform measurements for at least one cycle of ascending and descending measurands
• Fit an algebraic equation to the R vs M data to get instrument transfer function:– Linear: R = aM + b– Other: i.e. R = aM2 + bM + c, or …
• Find standard error of the estimate of R given M, sR,M
– This assumes the deviations are the same for all values of M
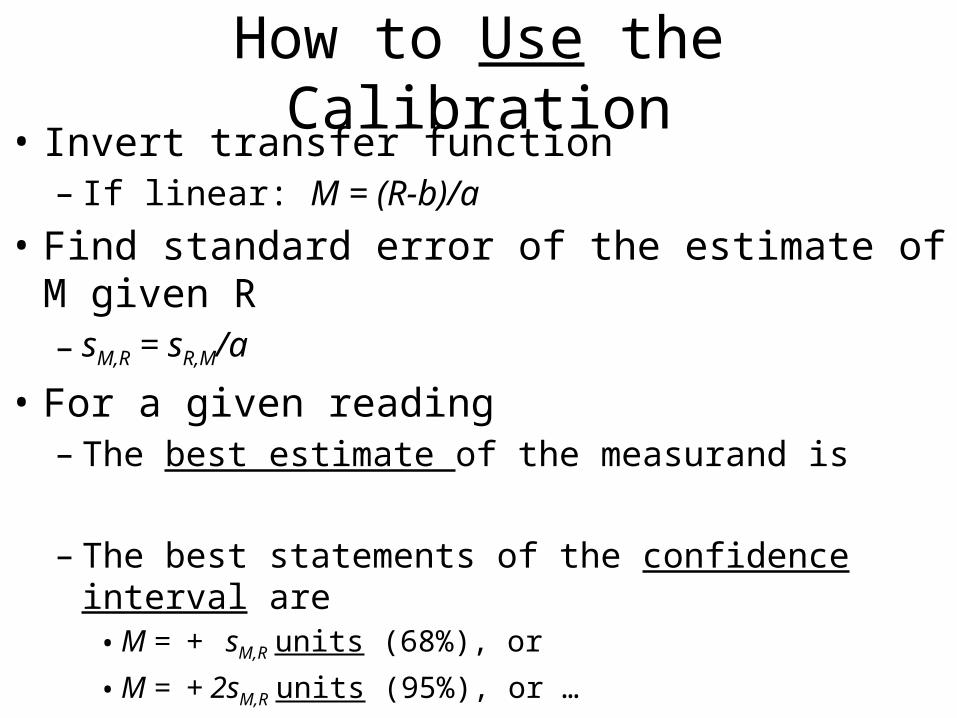
How to Use the Calibration• Invert transfer function
– If linear: M = (R-b)/a
• Find standard error of the estimate of M given R– sM,R = sR,M/a
• For a given reading – The best estimate of the measurand is
– The best statements of the confidence interval are• M = + sM,R units (68%), or
• M = + 2sM,R units (95%), or …
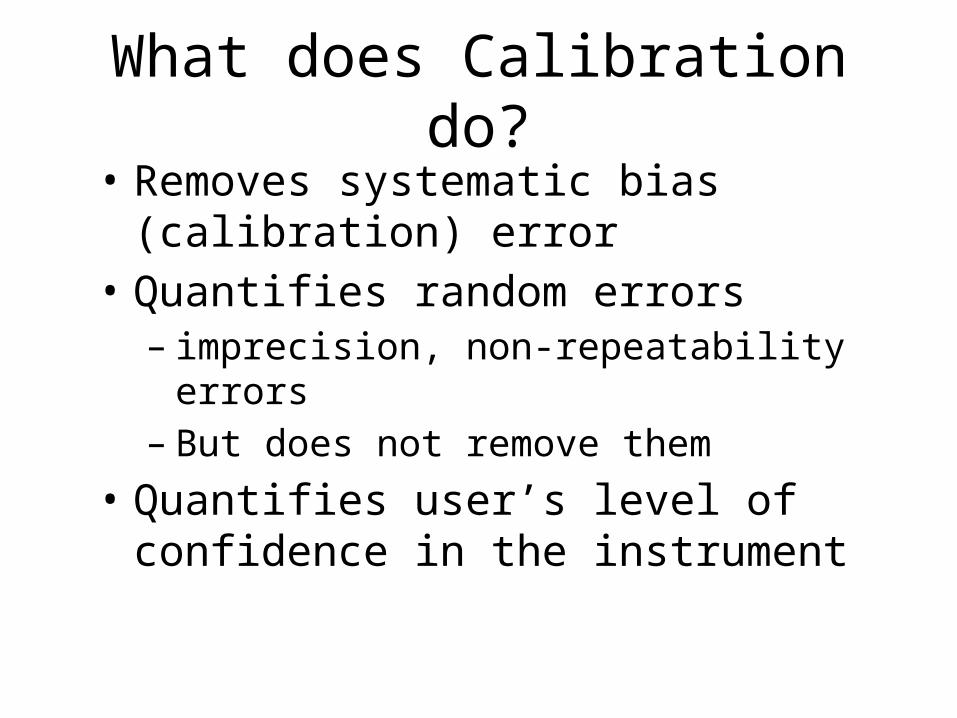
What does Calibration do?
• Removes systematic bias (calibration) error• Quantifies random errors
– imprecision, non-repeatability errors– But does not remove them
• Quantifies user’s level of confidence in the instrument
Manufacturers often state “accuracy”
• May include both imprecision and calibration drift– Often not clearly defined
• This is one of the objectives of Lab 3
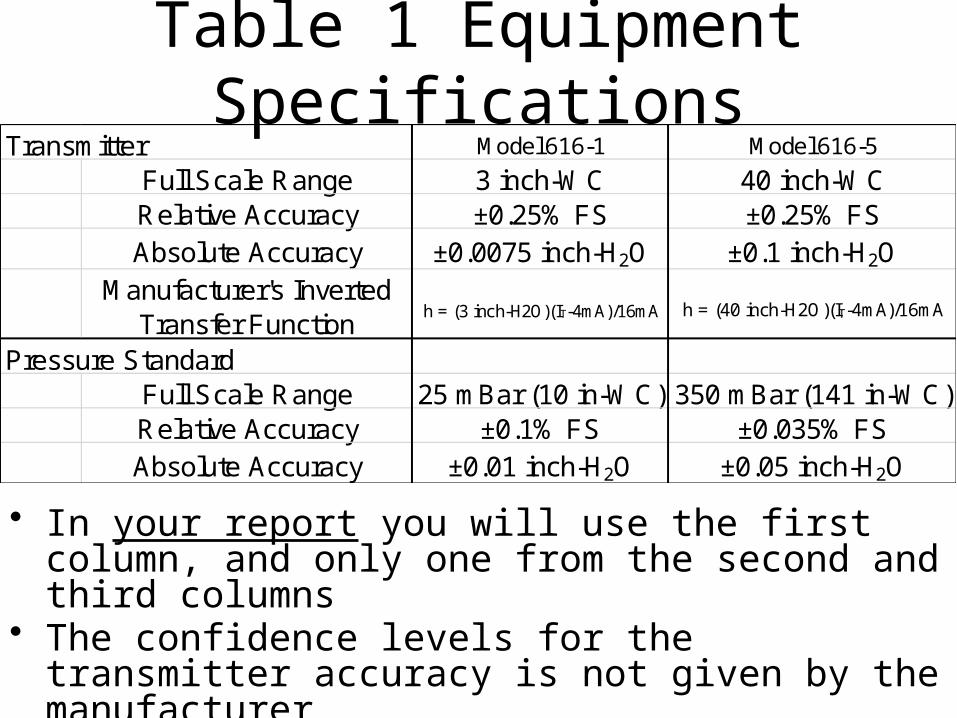
Table 1 Equipment Specifications
• In your report you will use the first column, and only one from the second and third columns
• The confidence levels for the transmitter accuracy is not given by the manufacturer – We will determine it in this experiment.
Transmitter Model 616-1 Model 616-5
Full Scale Range 3 inch-WC 40 inch-WCRelative Accuracy ±0.25% FS ±0.25% FSAbsolute Accuracy ±0.0075 inch-H2O ±0.1 inch-H2O
Manufacturer's Inverted Transfer Function h = (3 inch-H2O)(IT-4mA)/16mA h = (40 inch-H2O)(IT-4mA)/16mA
Pressure StandardFull Scale Range 25 mBar (10 in-WC) 350 mBar (141 in-WC)Relative Accuracy ±0.1% FS ±0.035% FSAbsolute Accuracy ±0.01 inch-H2O ±0.05 inch-H2O
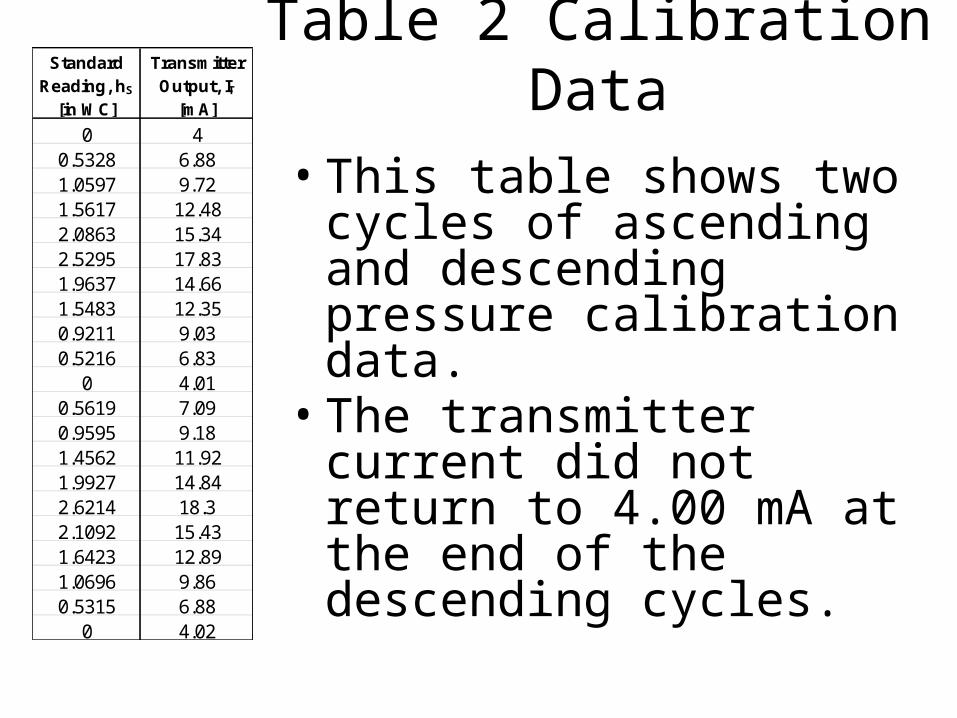
Table 2 Calibration Data
• This table shows two cycles of ascending and descending pressure calibration data.
• The transmitter current did not return to 4.00 mA at the end of the descending cycles.
0 40.5328 6.881.0597 9.721.5617 12.482.0863 15.342.5295 17.831.9637 14.661.5483 12.350.9211 9.030.5216 6.83
0 4.010.5619 7.090.9595 9.181.4562 11.921.9927 14.842.6214 18.32.1092 15.431.6423 12.891.0696 9.860.5315 6.88
0 4.02
Standard Reading, hS
[in WC]
Transmitter Output, IT
[mA]
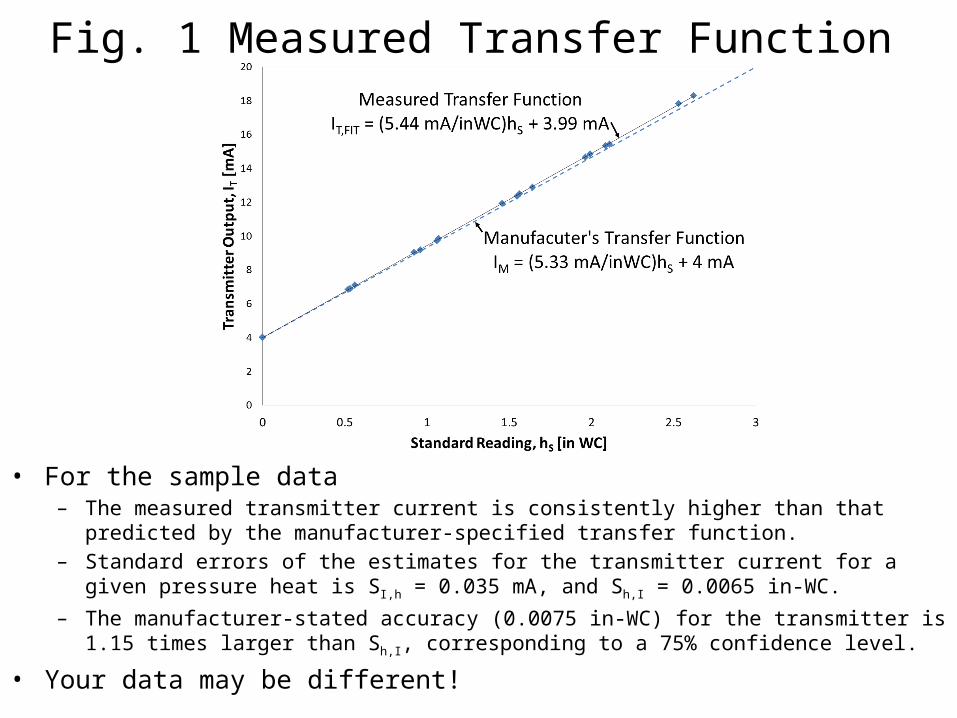
Fig. 1 Measured Transfer Function
• For the sample data– The measured transmitter current is consistently higher than that predicted by the manufacturer-
specified transfer function.
– Standard errors of the estimates for the transmitter current for a given pressure heat is S I,h = 0.035 mA, and Sh,I = 0.0065 in-WC.
– The manufacturer-stated accuracy (0.0075 in-WC) for the transmitter is 1.15 times larger than Sh,I, corresponding to a 75% confidence level.
• Your data may be different!
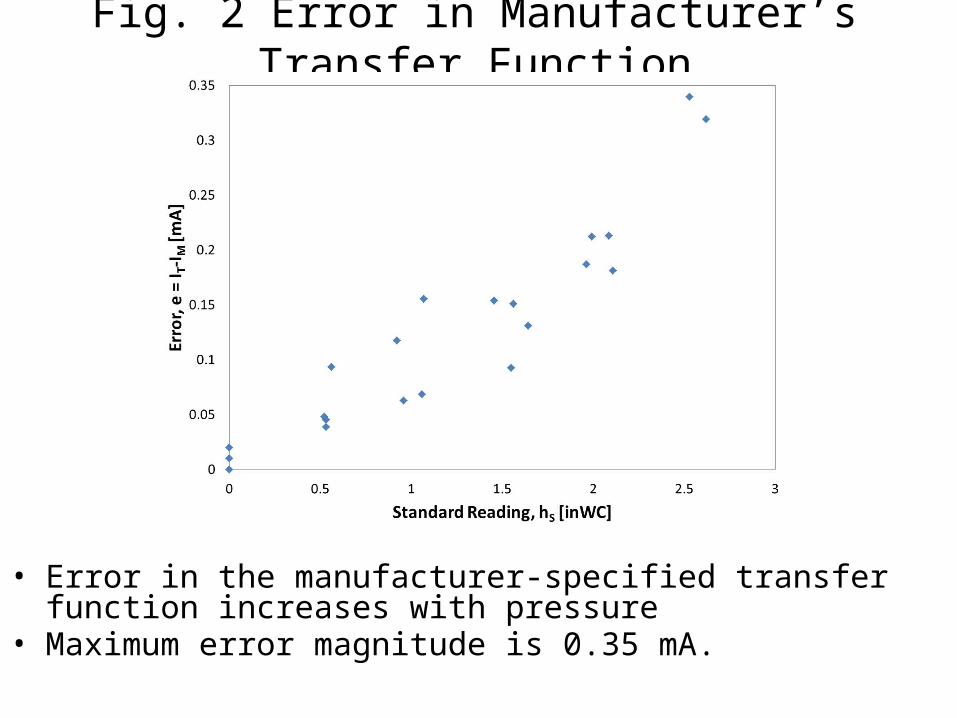
Fig. 2 Error in Manufacturer’s Transfer Function
• Error in the manufacturer-specified transfer function increases with pressure
• Maximum error magnitude is 0.35 mA.
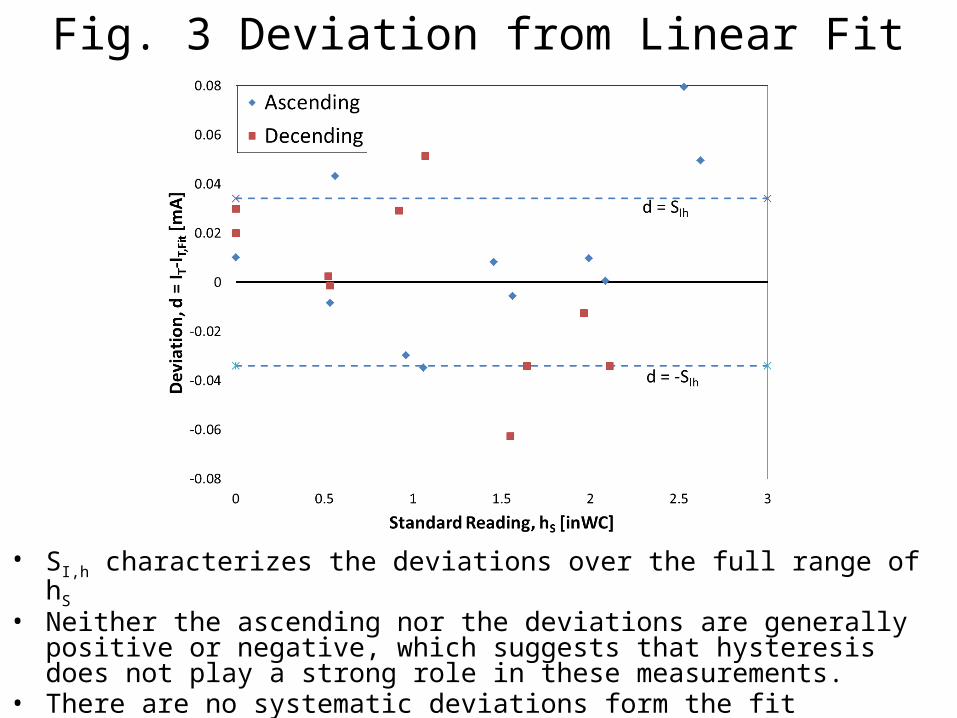
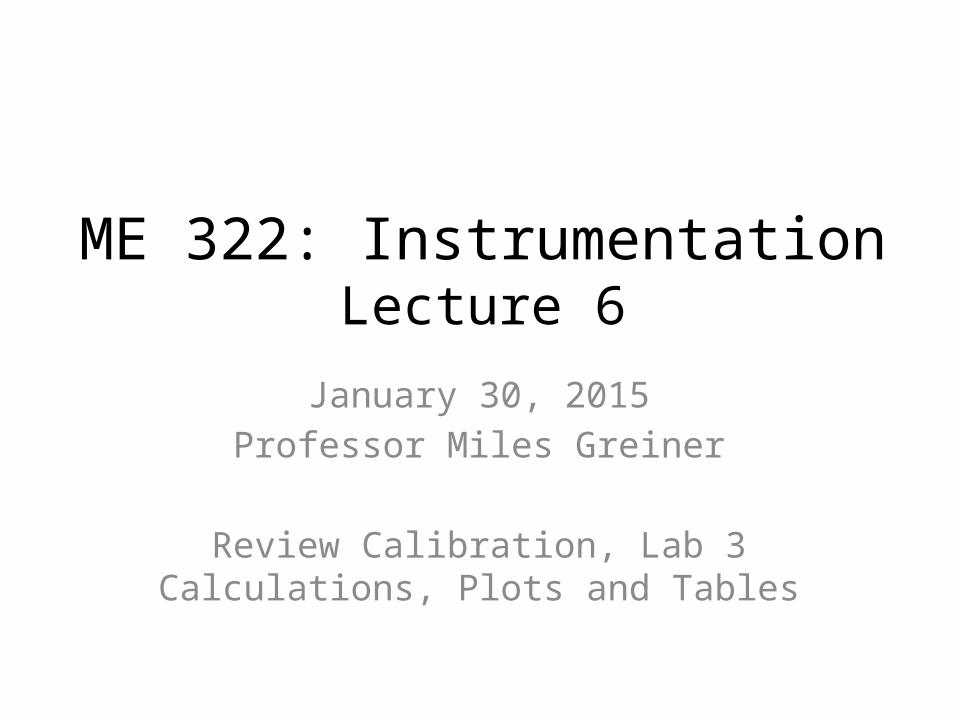
Fig. 3 Deviation from Linear Fit
• SI,h characterizes the deviations over the full range of hS
• Neither the ascending nor the deviations are generally positive or negative, which suggests that hysteresis does not play a strong role in these measurements.
• There are no systematic deviations form the fit correlation, indicating the instrument response is essentially linear.
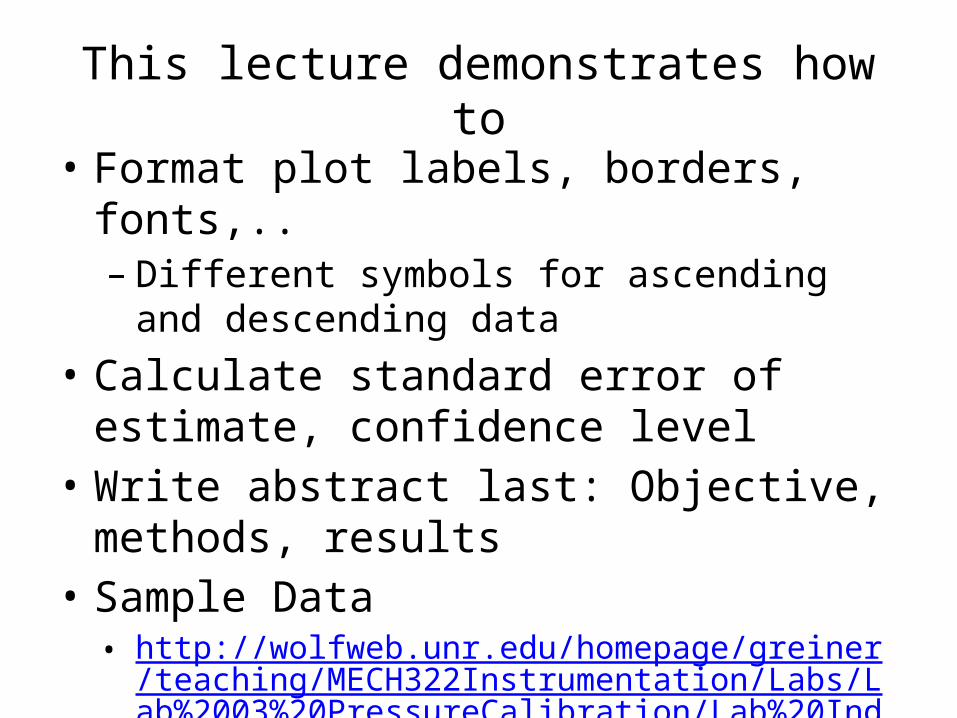
This lecture demonstrates how to• Format plot labels, borders, fonts,..
– Different symbols for ascending and descending data
• Calculate standard error of estimate, confidence level
• Write abstract last: Objective, methods, results• Sample Data
• http://wolfweb.unr.edu/homepage/greiner/teaching/MECH322Instrumentation/Labs/Lab%2003%20PressureCalibration/Lab%20Index.htm
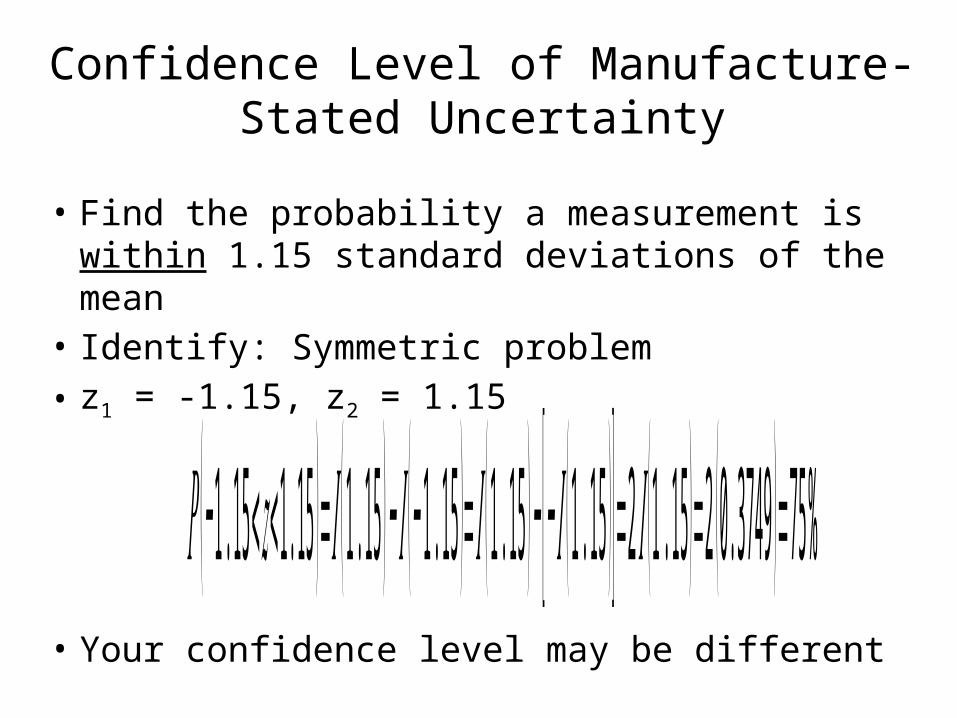
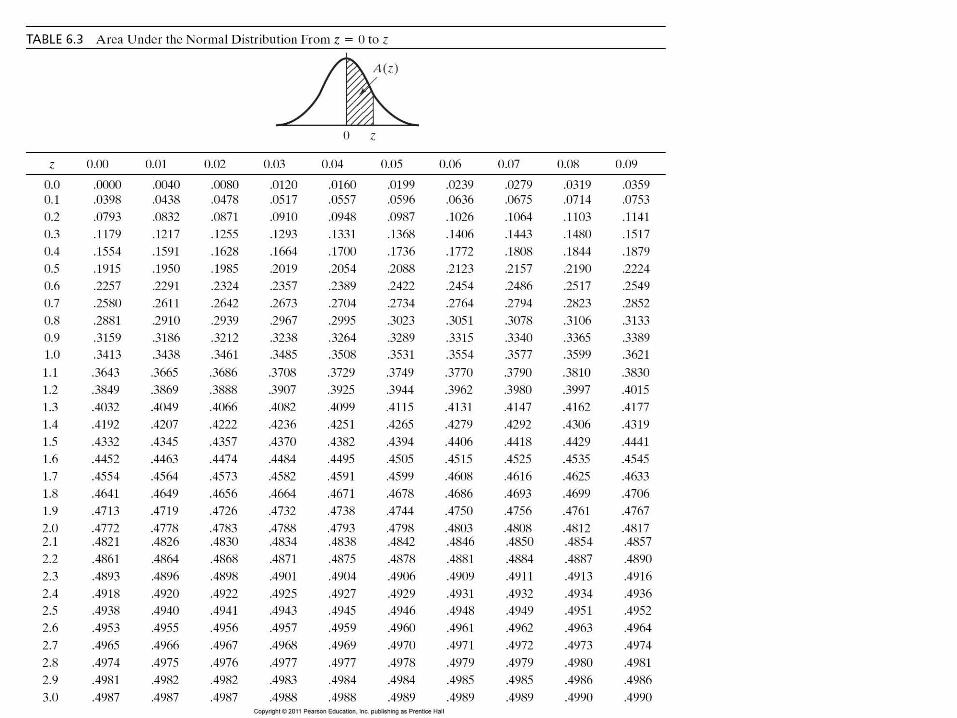
Confidence Level of Manufacture-Stated Uncertainty
• Find the probability a measurement is within 1.15 standard deviations of the mean
• Identify: Symmetric problem
• z1 = -1.15, z2 = 1.15
• Your confidence level may be different
𝑃 (−1.15<𝑧<1.15 )=𝐼 (1.15 )− 𝐼 (−1 .15 )= 𝐼 (1.15 )− [− 𝐼 (1 .15 ) ]=2 𝐼 (1 .15 )=2 ( 0.3749 )=75 %
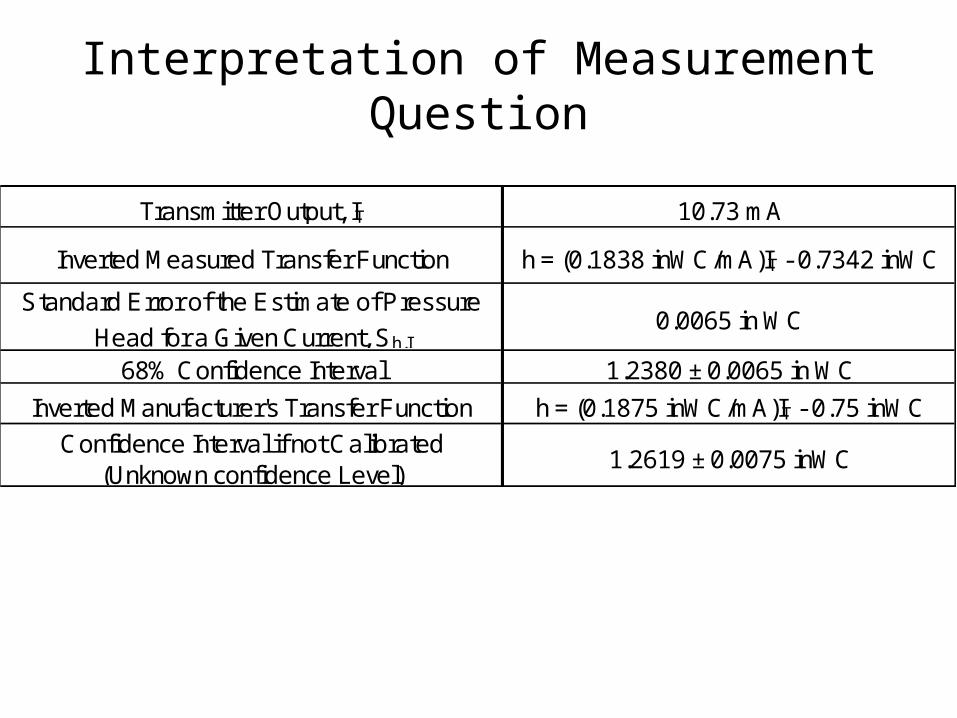
Interpretation of Measurement Question
Transmitter Output, IT 10.73 mA
Inverted Measured Transfer Function h = (0.1838 inWC/mA)IT - 0.7342 inWC
Standard Error of the Estimate of Pressure
Head for a Given Current, Sh,I0.0065 in WC
68% Confidence Interval 1.2380 ± 0.0065 in WC
Inverted Manufacturer's Transfer Function h = (0.1875 inWC/mA)IT - 0.75 inWC
Confidence Interval if not Calibrated (Unknown confidence Level)
1.2619 ± 0.0075 inWC
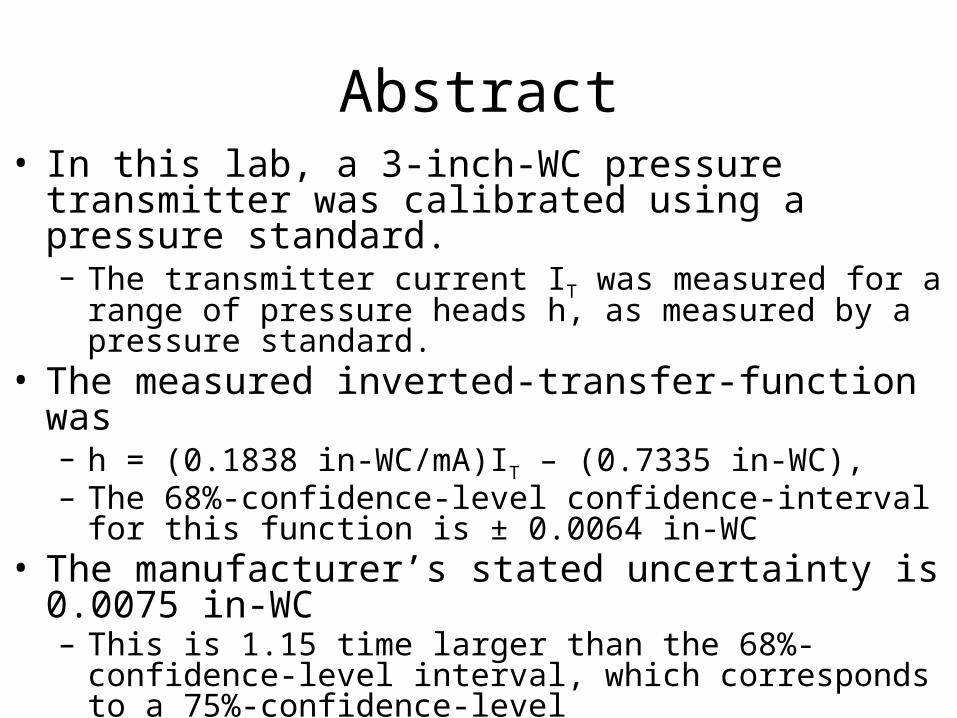
Abstract• In this lab, a 3-inch-WC pressure transmitter was calibrated
using a pressure standard.– The transmitter current IT was measured for a range of pressure
heads h, as measured by a pressure standard. • The measured inverted-transfer-function was
– h = (0.1838 in-WC/mA)IT – (0.7335 in-WC),– The 68%-confidence-level confidence-interval for this function is
± 0.0064 in-WC• The manufacturer’s stated uncertainty is 0.0075 in-WC
– This is 1.15 time larger than the 68%-confidence-level interval, which corresponds to a 75%-confidence-level
Lab 3 Static Calibration of Electronic Pressure
Transmitters
February 3, 2014
Group 0
Miles Greiner
Lab Instructors:
Josh McGuire, Şevki Çeşmeci, and Roberto Bejarano

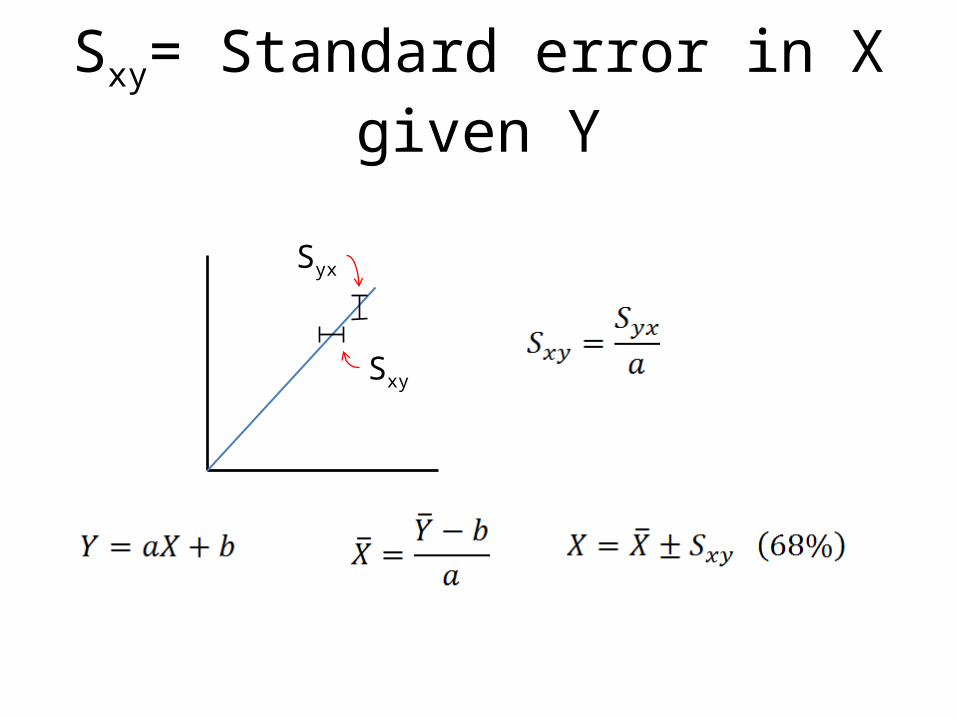
Sxy= Standard error in X given Y
Syx
Sxy
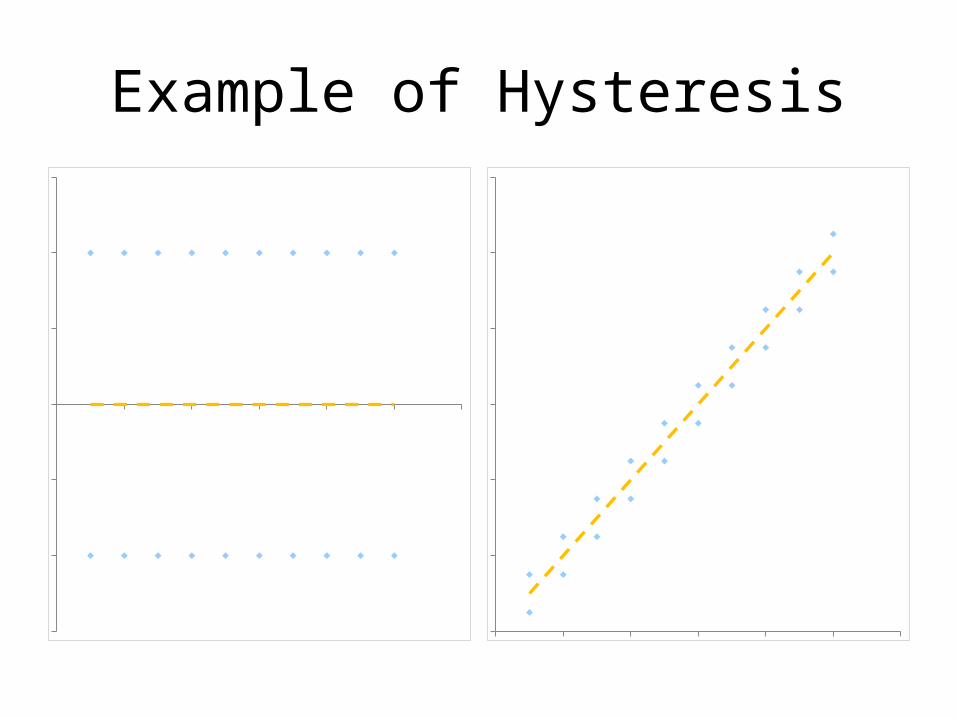
Example of Hysteresis