Embed Size (px)
DESCRIPTION
ME2151
Citation preview
10-1
C H A P T E R 1 0
K I N E T I C S O F P H A S E T R A N S F O R M A T I O N S
10.1 PHASE TRANSFORMATIONS 10.1.1 The Dr iv ing Force for
Transformat ion 10.1.2 Nucleat ion 10.1.3 Growth 10.1.4 K inet ics of Phase
Transformat ion
10.2 ISOTHERMAL TRANSFORMATION DIAGRAMS 10.2.1 Transformat ions in Eutecto id
Stee l 10.2.2 Hypoeutecto id and
Hypereutecto id Stee ls
10.3 CONTINUOUS COOLING TRANSFORMATION DIAGRAMS 10.3.1 Cont inuous Cool ing in Stee ls
10-2
10.1 PHASE TRANSFORMATIONS
• Phase transformations are not instantaneous. The
transformation from one phase to another involves a
change in composition, crystal structure and/or the
number of phases present. This is achieved through the
rearrangement of atoms (often via diffusion), which
requires a finite amount of time.
• The microstructures characterized by the equilibrium phase
diagrams are obtained only when the temperature is
changed extremely slowly, such that a state of equilibrium
is maintained at all times. The phase diagrams do not
indicate the time required for equilibrium microstructures
to develop.
• Under non-equilibrium conditions, the resultant micro-
structure depends on the rate of heating/cooling and the
actual temperature at which phase transformations occur.
These factors also determine the rate of phase
transformation (and hence, the time required).
• The desired microstructure may be therefore be tailored by
controlling the rate (kinetics) of phase transformations.

10-3
10.1.1 The Driving Force for Transformation
• The thermodynamic state of a system is defined by the
Gibbs free energy, G, which is a measure of the internal
energy, as well as the randomness in the system.
• Equilibrium is a state of no spontaneous change, at which
G is a minimum.
• Phase transformations are only possible if such changes
lower G, i.e. !G < 0.
• Consider the solidification of water into ice (Fig. 10.1-1).
Fig. 10.1-1 Gibbs free energy as a function of temperature for ice and water.
10-4
• At the equilibrium transformation temperature, TE = 0°C,
the free energy of ice and water are equal (Gice = Gwater "
!G = 0). A change from water to ice or vice versa would
not lower G, so no spontaneous change occurs.
• When T < TE, Gice < Gwater, so ice is the stable form. The
system can lower its free energy by changing water into
ice (Gice - Gwater < 0 " !G < 0). The decrease in free energy,
!G, becomes larger and larger as T falls further and further
below TE. TE – T = !T is known as the undercooling.
• !G may be thought of as the ‘driving force’ for the
transformation. The greater the degree of undercooling,
!T, the larger the magnitude of !G, and the higher the
driving force.
• Generally, a phase transformation begins with the
nucleation of the new phase within the parent phase,
followed by the growth of the new phase.

10-5
10.1.2 Nucleation
• Consider the nucleation of a solid in a liquid during
solidification. The atoms in a liquid are in a state of
continual random movement. From time to time, a small
group of atoms will, purely by chance, come together to
form a tiny crystal nucleus (Fig. 10.1-2).
Fig. 10.1-2 The random clustering of neighbouring atoms to form a crystal nucleus.
• The nucleus must be of critical size, r*, or larger, in order
to remain stable and grow; nuclei smaller than r* would
simply redissolve back into the liquid.
• An increase in the degree of undercooling, !T, decreases
the critical nucleus size, r*, required. Since there is a higher
probability of atoms randomly clustering in small groups
rather than large ones, nucleation becomes easier and the
nucleation rate is faster with larger !T.
10-6
• However, the random clustering of atoms requires the
local diffusion of atoms, the rate of which decreases with
temperature.
• The net nucleation rate is therefore a balance between the
ease of nucleation and atomic mobility (Fig. 10.1-3). The
maximum nucleation rate occurs in the temperature range
where the driving force for nucleation and diffusion are
both significant.
Fig. 10.1-3 Variation of the net nucleation rate with temperature.
• Nucleation occurs preferentially at sites such as walls of
containers or suspended impurities in a liquid. In solid-to-
solid phase transformations, preferential nucleation sites
include grain boundaries, dislocations, phase boundaries,
and the surfaces of impurities and precipitates.

10-7
10.1.3 Growth
• Once a nucleus of critical size or larger forms, spontaneous
and sustained growth of the nucleus occurs (Fig. 10.1-4).
Growth involves the transport of atoms to the nucleus and
the rearrangement of these atoms into the crystal structure
of the nucleus. These processes are diffusion-controlled,
and the growth rate increases with temperature.
Fig. 10.1-4 Growth of a stable nucleus.
10.1.4 Kinetics of Phase Transformation
• The overall rate (or kinetics) of phase transformation
depends on both nucleation and growth rates (Fig. 10.1-5).
Fig. 10.1-5 (a) Variation of rate of phase transformation with temperature. (b) Corresponding time-temperature-transformation curve or C-curve (Note: time, t #
1
Rate).
10-8
• The progress of a phase transformation with time at any
given temperature is described by a sigmoidal (S-shaped)
curve (Fig. 10.1-6).
Fig. 10.1-6 The fraction of transformed material as a function of time at any
given temperature.
• Characteristics of phase transformation:
1. An incubation period is required for nucleation. There is
no measurable phase transformation during this period.
2. Transformation is slow initially as nuclei form.
3. Once nucleated, the new phase begins to grow at the
expense of the parent phase, and there is a rapid
increase in the amount of new phase present.
4. The growth rate of the new phase decreases eventually
because of the depletion of solute atoms or physical
impingement of the growing phase.

10-9
10.2 ISOTHERMAL TRANSFORMATION DIAGRAMS • Equilibrium phase diagrams define only the microstructures
that develop under equilibrium conditions. In practical situations, the rate of heating/cooling and the actual temperature of transformation (undercooling) determine the resultant microstructure, which may be different from that characterized by the equilibrium phase diagrams.
• Isothermal transformation (IT) diagrams, or time-
temperature-transformation (TTT) diagrams, show the progress of transformation with time, and the final microstructure (including non-equilibrium phases).
• TTT diagrams are derived from a series of experimental
sigmoidal curves at different temperatures (Fig. 10.2-1); each diagram is valid for one alloy composition only.
Fig. 10.2-1
Construction of a TTT diagram from a series
ofexperimental sigmoidal curves at
different temperatures.
10-10
10.2.1 Transformations in Eutectoid Steel
• Recall the eutectoid reaction in steel:
! 727°C! " ! ! ! ! " + Fe3C
• The upper (high-temperature) portion of the TTT diagram
for eutectoid steels (0.76 wt% C) (Figs. 10.2-2 & 10.2-3) shows
the decomposition of austenite to pearlite with time, when
the steel is quenched (cooled rapidly) from the austenite
phase field and held isothermally at various temperatures
below the eutectoid transformation temperature.
Fig. 10.2-2 Isothermal transformation of austenite to pearlite
as a function of time and temperature.

10-11
• Above the eutectoid temperature, only austenite will exist;
transformation from austenite to pearlite will occur only if
the steel is cooled below the eutectoid temperature.
• The solid curves define the onset and completion of the
transformation of austenite to pearlite, while the dashed
curve represents 50% completion (Fig. 10.2-3).
• To the left of the start curve, only austenite (unstable) will
be present; to the right of the finish curve, only pearlite
will exist. In between, the austenite is in the process of
transforming to pearlite, thus both will be present.
Fig. 10.2-3 The isothermal transformation of austenite to pearlite, showing the development of microstructures.
10-12
• Since the transformation to pearlite during the eutectoid
reaction involves redistribution of carbon atoms via
diffusion, the morphology (size and shape) of pearlite
depends on the actual temperature of transformation.
• Near the eutectoid temperature, slow nucleation (few
grains) but fast diffusion (carbon atoms diffuse over long
distances quickly) produces coarse pearlite, consisting of
thick layers of ferrite and cementite with large
interlamellar spacing (Fig 10.2-4a).
• As undercooling increases, incubation becomes faster and
transformation to pearlite occurs earlier. Fast nucleation
(many grains) but slow diffusion (diffuse short distances
only) yields fine pearlite, with thin layers of ferrite and
cementite, and small interlamellar spacing (Fig 10.2-4b).
Fig. 10.2-4 (a) Coarse pearlite;
(b) fine pearlite.

10-13
• Further undercooling produces bainite (Fig. 10.2-5), which is
an even finer distribution of ferrite and cementite than in
fine pearlite. Unlike pearlite, which is lamellar, bainite
consists of extremely fine, elongated cementite particles
between ferrite plates or needles (Fig. 10.2-6).
Fig. 10.2-5 The TTT diagram for eutectoid
steel showing the transformation of
austenite to pearlite and austenite to bainite.
Fig. 10.2-6 Bainite formed at (a) 450°C, and (b) 260°C.
10-14
• The distribution and morphology (size and shape) of the
ferrite and cementite phases in pearlite and bainite differ
due to differences in the temperature at which their
transformations occur, which affect the nucleation and
growth kinetics of ferrite and cementite. However, both
pearlite and bainite are still physical mixtures of ferrite and
cementite, as indicated in the equilibrium phase diagram.
• Once a portion of austenite has transformed to pearlite or
bainite, the pearlite or bainite remains stable upon further
cooling (Fig. 10.2-7). It is not possible for the pearlite to
transform directly into bainite, or vice versa, without first
reheating to form austenite. Only austenite, which is
unstable below the eutectoid temperature, is able to
transform to other, more stable, phases upon cooling.
Fig. 10.2-7 Coarse pearlite remains stable upon cooling.

10-15
• Immediately prior to the eutectoid transformation,
austenite contains 0.76 wt% C, with carbon atoms
dissolved in the octahedral interstitial sites of the FCC
austenite lattice. The transformation of austenite to pearlite
or bainite requires the diffusion of carbon atoms to form
low-carbon ferrite (0.022 wt% C) and high-carbon
cementite (6.67 wt% C) simultaneously.
• When undercooling becomes so great (isothermal trans-
formation temperature below Ms) that carbon diffusion
cannot occur, the diffusive transformation to ferrite and
cementite is suppressed, and a diffusionless transformation
to non-eqiuilibrium martensite takes place (Fig. 10.2-8).
Fig. 10.2-8 The complete TTT diagram for eutectoid steel.
10-16
• Martensite has a BCT (body-centred tetragonal) structure
because carbon atoms remain trapped in the octahedral
interstitial positions of the original FCC austenite and distort
the BCC structure of ferrite into BCT (Figs. 10.2-9 and 10.2-10).
Fig. 10.2-9 The relationship between FCC
austenite and BCT martensite (c>a). Fig. 10.2-10 The BCT unit cell of
martensite produced by the distortion of the BCC unit cell by
interstitial carbon atoms.
• Since carbon atoms are trapped in the BCT structure,
martensite has the same composition as its parent
austenite (0.76 wt% C in the case of eutectoid steel).
• Unlike the transformation to pearlite and bainite, the
amount of austenite that transforms to martensite depends
solely on temperature, not time. Martensite begins to form
only when austenite is quenched to temperature Ms, while
the M50 isotherm indicates the temperature at which 50%
of austenite will transform to martensite (Fig. 10.2-11).

10-17
• The Ms, M50, M90 (or MF) temperatures are not fixed, but
decrease with increases in the carbon content of the steel.
In some steels, complete (100%) transformation to
martensite may require a subzero quench to below MF (Fig.
10.2-11); quenching to temperatures between Ms and MF in
these steels result in untransformed austenite remaining
amidst the martensite as retained austenite.
Fig. 10.2-11 The amount of martensite formed when steel is quenched to room temperature depends on Ms and MF.
• Martensite is metastable; i.e. it is stable with time at room
temperature, but upon reheating (in a process known as
tempering), martensite will decompose to the even more
stable phases of ferrite and cementite, known as tempered
martensite. 10-18
• Martensite is the hardest phase in steel (Fig. 10.2-12) as a result
of the lattice distortion caused by the trapped carbon
atoms. However, it tends to be brittle.
Fig. 10.2-12 Hardness of
martensite and pearlite as a function of carbon content.
• Bainite is generally harder and stronger than pearlite (Fig.
10.2-13) due to its much finer distribution (Sec. 6.3-5) of
cementite particles within ferrite.
Fig. 10.2-13 Hardness and strength of bainite and pearlite as a function of
isothermal transformation temperature.
10-19
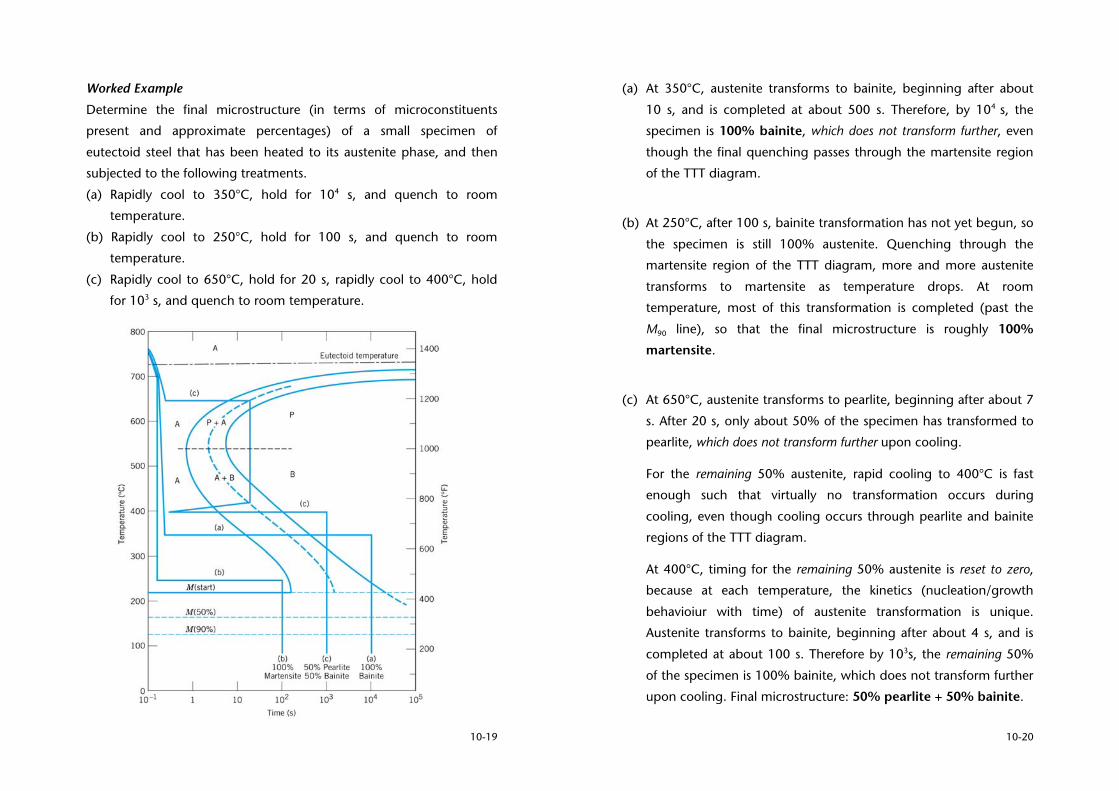
Worked Example
Determine the final microstructure (in terms of microconstituents
present and approximate percentages) of a small specimen of
eutectoid steel that has been heated to its austenite phase, and then
subjected to the following treatments.
(a) Rapidly cool to 350°C, hold for 104 s, and quench to room
temperature.
(b) Rapidly cool to 250°C, hold for 100 s, and quench to room
temperature.
(c) Rapidly cool to 650°C, hold for 20 s, rapidly cool to 400°C, hold
for 103 s, and quench to room temperature.
10-20
(a) At 350°C, austenite transforms to bainite, beginning after about
10 s, and is completed at about 500 s. Therefore, by 104 s, the
specimen is 100% bainite, which does not transform further, even
though the final quenching passes through the martensite region
of the TTT diagram.
(b) At 250°C, after 100 s, bainite transformation has not yet begun, so
the specimen is still 100% austenite. Quenching through the
martensite region of the TTT diagram, more and more austenite
transforms to martensite as temperature drops. At room
temperature, most of this transformation is completed (past the
M90 line), so that the final microstructure is roughly 100%
martensite.
(c) At 650°C, austenite transforms to pearlite, beginning after about 7
s. After 20 s, only about 50% of the specimen has transformed to
pearlite, which does not transform further upon cooling.
For the remaining 50% austenite, rapid cooling to 400°C is fast
enough such that virtually no transformation occurs during
cooling, even though cooling occurs through pearlite and bainite
regions of the TTT diagram.
At 400°C, timing for the remaining 50% austenite is reset to zero,
because at each temperature, the kinetics (nucleation/growth
behavioiur with time) of austenite transformation is unique.
Austenite transforms to bainite, beginning after about 4 s, and is
completed at about 100 s. Therefore by 103s, the remaining 50%
of the specimen is 100% bainite, which does not transform further
upon cooling. Final microstructure: 50% pearlite + 50% bainite.

10-21
10.2.2 Hypoeutectoid and Hypereutectoid Steels
• When hyporeutectoid and hypereutectoid steels are
cooled, austenite first transforms to proeutectoid ferrite
and cementite, respectively, before the eutectoid
transformation to pearlite. The formation of proeutectoid
ferrite or cementite adds an extra curve to the TTT
diagram above the pearlite “nose” (Figs 10.2-14 and 10.2-15).
Fig. 10.2-14 TTT diagram for a hypoeutectoid steel (0.5 wt% C) and its corresponding portion of the Fe-Fe3C phase diagram, showing an extra curve due to proeutectoid ferrite formation.
10-22
• Since the transformation of austenite to the proeutectoid
phases requires the diffusion of carbon atoms, the amount
of proeutectoid phase that forms depends on the
undercooling. More proeutectoid phase is formed when
the isothermal transformation temperature is high.
• When the undercooling is so large that bainite or
martensite is obtained, no proeutectoid phase is formed.
Fig. 10.2-15 TTT diagram for a hypereutectoid steel (1.13 wt% C).

10-23
10.3 CONTINUOUS COOLING TRANSFORMATION DIAGRAMS
• Strictly speaking, TTT diagrams are valid only for
isothermal transformations, in which the material is
assumed to be instantaneously quenched from a single-
phase field to a specific temperature and held isothermally
for various times to produce different amounts of the
transformed products.
• In practice, transformations occur during continuous
cooling to room temperature, in which the temperature is
constantly changing as the transformation progresses.
• Therefore, it is more accurate to use continuous-cooling-
transformation (CCT) diagrams.
• CCT diagrams are derived from a series of experimental
sigmoidal curves at different cooling rates. Like the TTT
diagrams, each CCT diagram is valid for one alloy
composition only.
10-24
10.3.1 Continuous Cooling in Steels
• Because the temperature is constantly decreasing when
the steel is cooled continuously, CCT curves are shifted to
longer times and lower temperatures when compared to
TTT diagrams (Fig. 10.3-1).
Fig. 10.3-1 Comparison of TTT and CCT diagrams for eutectoid steel.
• There is no longer any bainite formation when cooling
continuously at any given constant cooling rate because all
the austenite will have transformed to pearlite by the time
bainite transformation becomes possible.
10-25
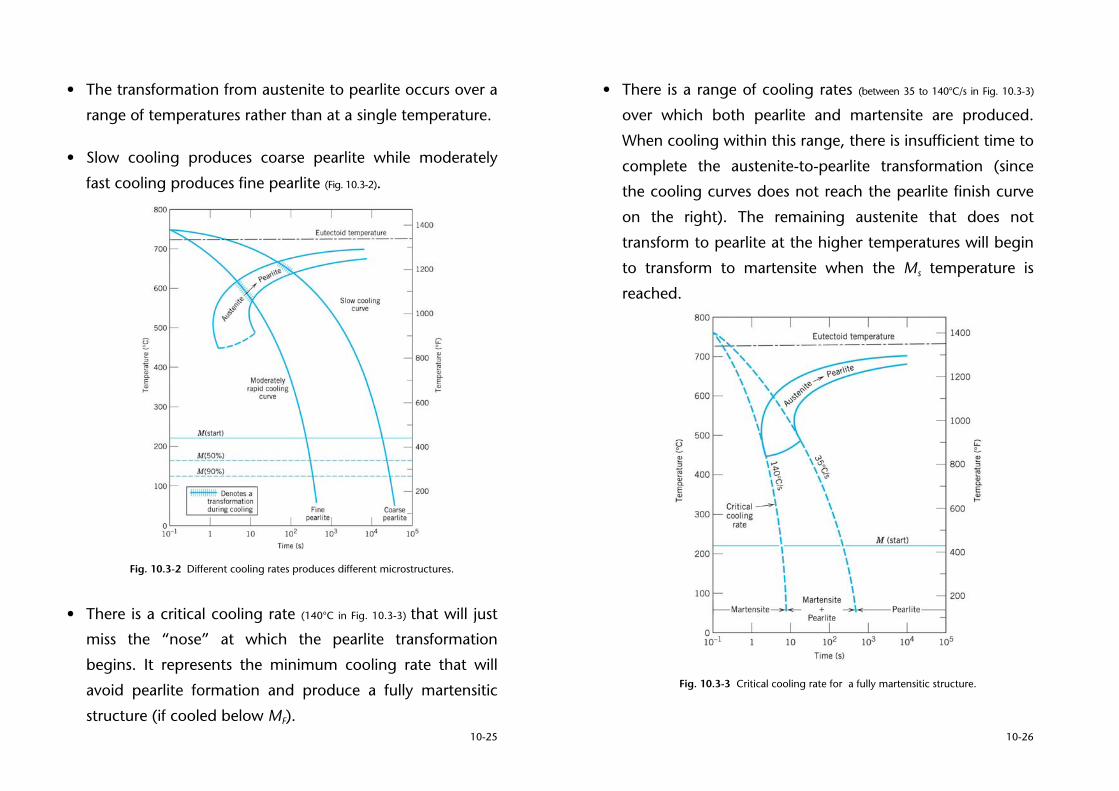
• The transformation from austenite to pearlite occurs over a
range of temperatures rather than at a single temperature.
• Slow cooling produces coarse pearlite while moderately
fast cooling produces fine pearlite (Fig. 10.3-2).
Fig. 10.3-2 Different cooling rates produces different microstructures.
• There is a critical cooling rate (140°C in Fig. 10.3-3) that will just
miss the “nose” at which the pearlite transformation
begins. It represents the minimum cooling rate that will
avoid pearlite formation and produce a fully martensitic
structure (if cooled below MF). 10-26
• There is a range of cooling rates (between 35 to 140°C/s in Fig. 10.3-3)
over which both pearlite and martensite are produced.
When cooling within this range, there is insufficient time to
complete the austenite-to-pearlite transformation (since
the cooling curves does not reach the pearlite finish curve
on the right). The remaining austenite that does not
transform to pearlite at the higher temperatures will begin
to transform to martensite when the Ms temperature is
reached.
Fig. 10.3-3 Critical cooling rate for a fully martensitic structure.

10-27
Worked Example
Determine the final microstructure of a small specimen of eutectoid
steel that has been cooled from its austenite phase to room
temperature at the following rates: (a) 1°C/s, (b) 20°C/s, (c) 50°C/s,
and (d) 175°C/s.
(a) From Fig. 10.3-3 1°C/s lies to the far right of the CCT diagram,
where nucleation is slow, but growth is fast; the final
microstructure is likely to be coarse pearlite.
(b) 20°C/s lies closer to the cooling curve of 35°C/s, which is the
fastest cooling rate possible in order to still obtain 100% pearlite.
For a faster cooling rate, nucleation is faster, but growth is slower;
the final microstructure is likely to be fine pearlite.
(c) 50°/s lies in the region of split transformation on the CCT diagram
– at high temperatures, pearlite nucleation and growth occurs, but
the rapid drop in temperature means that the transformation from
austenite to pearlite cannot be completed, because diffusion
becomes too slow at lower temperatures. The remaining austenite
transforms to martensite when cooled through the martensite
region of the CCT diagram. Final microstructure is a mixture of
fine pearlite and martensite.
(d) 175°C/s is faster than the critical cooling rate of 135°C/s, at which
there is no time for diffusion to occur, so the final microstructure is
approximately 100% martensite, assuming MF (or at least M90) is
reached.