Embed Size (px)
Citation preview
MEAM-446-2012-13 page 1 Copyright © 2012 by the authors
MEAM-446-2012-13 Senior Design Project - Final Report April 26, 2012
Department of Mechanical Engineering and Applied Mechanics School of Engineering and Applied Science
The University of Pennsylvania Philadelphia, Pennsylvania, USA
HYDRAULIC DRIVETRAIN WITH REGENERATIVE BRAKING
Andrew Brown Karan Desai
Andrew McGrath Alfred ‘Hurst’ Nuckols Grant Wilson
Dr. Andrew Jackson1
Robert L. Jeffcoat PhD1
faculty advisor instructor
1 Department of Mechanical Engineering and Applied Mechanics, University of Pennsylvania
ABSTRACT
Since their development in 2006, hydraulic
drivetrain systems have gained considerable attention as a
result of their high efficiencies. However, due to size and
weight constraints, their application has been exclusively
for large trucks and commercial vehicles. Our senior design
project investigates the use of hydraulic drivetrains on
small-scale vehicles. We have established two main project
goals: 1) to create a working model of a hydraulic system
on a go-kart, and 2) to assess the efficiency of our hydraulic
system in relation to other mechanical and hybrid
drivetrains. As with many hydraulic drivetrain systems, our
model incorporates regenerative braking in order to further
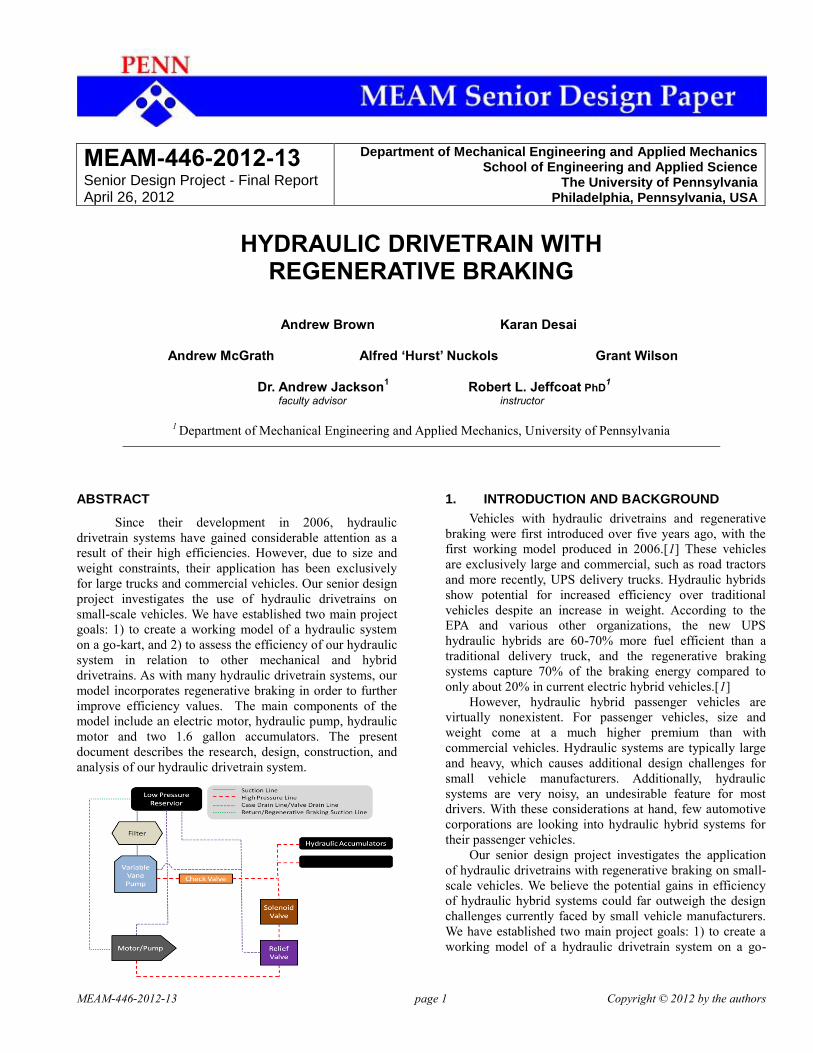
improve efficiency values. The main components of the
model include an electric motor, hydraulic pump, hydraulic
motor and two 1.6 gallon accumulators. The present
document describes the research, design, construction, and
analysis of our hydraulic drivetrain system.
1. INTRODUCTION AND BACKGROUND
Vehicles with hydraulic drivetrains and regenerative
braking were first introduced over five years ago, with the
first working model produced in 2006.[1] These vehicles
are exclusively large and commercial, such as road tractors
and more recently, UPS delivery trucks. Hydraulic hybrids
show potential for increased efficiency over traditional
vehicles despite an increase in weight. According to the
EPA and various other organizations, the new UPS
hydraulic hybrids are 60-70% more fuel efficient than a
traditional delivery truck, and the regenerative braking
systems capture 70% of the braking energy compared to
only about 20% in current electric hybrid vehicles.[1]
However, hydraulic hybrid passenger vehicles are
virtually nonexistent. For passenger vehicles, size and
weight come at a much higher premium than with
commercial vehicles. Hydraulic systems are typically large
and heavy, which causes additional design challenges for
small vehicle manufacturers. Additionally, hydraulic
systems are very noisy, an undesirable feature for most
drivers. With these considerations at hand, few automotive
corporations are looking into hydraulic hybrid systems for
their passenger vehicles.
Our senior design project investigates the application
of hydraulic drivetrains with regenerative braking on small-
scale vehicles. We believe the potential gains in efficiency
of hydraulic hybrid systems could far outweigh the design
challenges currently faced by small vehicle manufacturers.
We have established two main project goals: 1) to create a
working model of a hydraulic drivetrain system on a go-
MEAM-446-2012-13 page 2 Copyright © 2012 by the authors
kart, and 2) to assess the efficiency of our hydraulic
drivetrain system in relation to other mechanical and hybrid
drivetrains. The present paper outlines our research and
efforts towards the completion of these project goals.
2. REQUIREMENTS AND OBJECTIVES
We established the following project requirements:
The project must:
a) Exhibit a functional hydraulic drivetrain on
the go-kart model.
b) Demonstrate hydraulic regenerative braking
on the go-kart model.
c) Ensure the go-kart model operates safely
under normal driving conditions.
d) Show, through theoretical analysis, the
potential benefits of the hydraulic system.
The project should:
e) Optimize the system efficiency with regards to
the electric motor, hydraulic circuit and
regenerative braking.
f) Allow for the synchronous use of both the
hydraulic drivetrain and regenerative braking
system in the go-kart model.
g) Compare, through theoretical analysis, the
efficiency of the system as applied to full size
vehicles.
With an understanding of our qualitative goals, we
established quantitative measures in order to
objectively evaluate the success of our project. Table
2-1 illustrates these goals.
Table 2-1 Quantitative Project Goals
Feature Goal
Maximum Speed 10mph
Maximum Discharge Time 30 seconds
Regenerative Braking Efficiency >0%
Hydraulic Drivetrain Efficiency 60%
3. CANDIDATE CONCEPTS
The following concepts emerged as possible candidates
for our hybrid drivetrain system:
Full Closed Center Hydraulic – Incorporates a closed
center hydraulic pump to power hydraulic motor.
Allows for high efficiencies, although very
expensive.
Full Open Center Hydraulic – Incorporates an open
center hydraulic pump to power hydraulic motor.
Provides predictable control and is simple to build.
However, system efficiency is low.
Hydraulic-Over-Electric – Utilizes a conventional
electric hybrid drivetrain in combination with
hydraulic components. Allows for precise control
over braking and acceleration. Involves complex
circuitry and expensive components.
Full Pneumatic- Utilizes atmospheric air as the
working fluid. Simplifies the storage process of the
working fluid (no reservoir required). Components
are costly, bulky and relatively imprecise.
3.1 Comparison and Downselection
During the downselection process, these four candidate
concepts were evaluated on the following three measures:
cost – does the price of the concept components exceed
our budget?
complexity – is the concept feasible considering our
backgrounds in engineering?
performance – to what degree does the concept satisfy
our project requirements and objectives?
Table 3-1 compares the four candidate concepts using
these three measures. Furthermore, we have provided a
concise evaluation of each design concept:
The full closed center hydraulic system is appealing due
to its high efficiency and feasibility. The closed
center pump offers many desirable features for the
system, such as variable displacement operation.
However, the high cost of the closed center pump
poses a considerable challenge with our budget
constraints. With sufficient sponsorship and
donations, this design is optimal.
The greatest assets of the full open center hydraulic
system are its simplicity and low cost. Both of these
measures allow for a high degree of optimization
within the system (few variables and large remaining
budget). However, performance is still the greatest
concern. The lack of critical pump features may
make several of the project objectives unfeasible.
On the surface, the hydraulic-over-electric system is
attractive due to its precise control mechanism. The
added electronics allow for a high level of system
performance. Further consideration shows that the
system’s complexity makes it nearly unfeasible. A
strong background in both electronics and hydraulics
is required. Additionally, the high cost of the added
electronics poses a considerable project challenge.
One convenient feature of the full pneumatic system is
the fact that it utilizes atmospheric air as its working
MEAM-446-2012-13 page 3 Copyright © 2012 by the authors
fluid. The overall complexity of the candidate is low.
However, the components necessary for operation
are oversized for the intended small scale system.
Additionally, the cost of pneumatic devices is very
high.
Table 3-1 System Comparison
Closed Center
Open Center
Hydraulic-Over-
Electric
Full Pneumatic
Cost High Low Very High High
Complexity Medium Low Very High Low
Performance High Low High Medium
We chose to pursue the full closed center hydraulic
system as it offers the greatest balance between cost,
complexity and performance. There are several distinct
advantages to having a closed center pump over the other
three designs. The variable displacement property allows
for greater system efficiencies as well as smooth operation.
Both of these gains are fundamental to the success of our
project. Although the system is relatively complex, we felt
capable of the research and study necessary to design the
system. Furthermore, we planned to moderate the high cost
of the design by pursuing sponsorship and discounts from
various suppliers.
4. DESIGN DESCRIPTION
4.1 System Components
The final design utilizes a complete hydraulic
drivetrain with regenerative braking. The main components
are summarized thus:
Hydraulic Charge Pump: Charges the system to
1,000 psi using an external power source. Pump is pressure
compensated.
Hydraulic Accumulators: Precharged with nitrogen
gas. Incompressible hydraulic fluid enters one side;
nitrogen is compressed on other side; gas and fluid
separated by piston. Hydraulic potential energy stored as
pressurized hydraulic fluid volume.
Hydraulic Pump/Motor: Drives wheel/axle using
pressurized hydraulic flow. Can be backdriven by
wheel/axle to produce pressurized hydraulic flow during
regenerative braking. Utilizes a reversible variable
swashplate.
Check Valve: Located at the outlet of the charge pump.
Prevents backflow of pressurized hydraulic fluid into pump
when off or when pressure exceeds 1000 psi during
regenerative braking.
One-Way Solenoid Valve: Separates hydraulic
connection between accumulators and pump/motor. Allows
the easy repositioning of swashplate from neutral. Prevents
undesirable rotation of wheel during regenerative braking.
Pressure Relief Valve: Prevents hydraulic system
pressure from exceeding 1500psi. Necessary to prevent
damage to system components and unsafe operating
conditions.
Reservoir: Stores hydraulic fluid at ambient
conditions. Provides hydraulic fluid for the charge pump
and pump/motor.
Filter: Placed on suction side of charge pump.
Prevents particulate contamination from damaging
components.
Engine: Mechanically connected to hydraulic charge
pump. Supplies power to hydraulic charge pump.
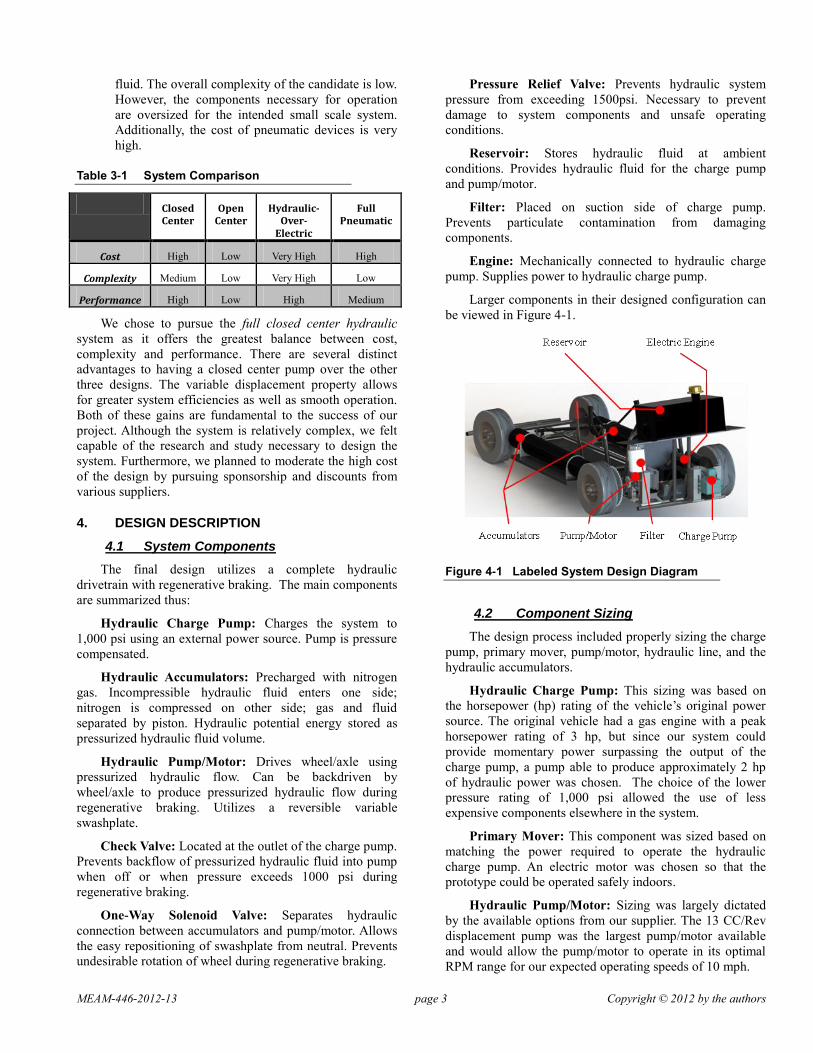
Larger components in their designed configuration can
be viewed in Figure 4-1.
Figure 4-1 Labeled System Design Diagram
4.2 Component Sizing
The design process included properly sizing the charge
pump, primary mover, pump/motor, hydraulic line, and the
hydraulic accumulators.
Hydraulic Charge Pump: This sizing was based on
the horsepower (hp) rating of the vehicle’s original power
source. The original vehicle had a gas engine with a peak
horsepower rating of 3 hp, but since our system could
provide momentary power surpassing the output of the
charge pump, a pump able to produce approximately 2 hp
of hydraulic power was chosen. The choice of the lower
pressure rating of 1,000 psi allowed the use of less
expensive components elsewhere in the system.
Primary Mover: This component was sized based on
matching the power required to operate the hydraulic
charge pump. An electric motor was chosen so that the
prototype could be operated safely indoors.
Hydraulic Pump/Motor: Sizing was largely dictated
by the available options from our supplier. The 13 CC/Rev
displacement pump was the largest pump/motor available
and would allow the pump/motor to operate in its optimal
RPM range for our expected operating speeds of 10 mph.
MEAM-446-2012-13 page 4 Copyright © 2012 by the authors
Hydraulic Line: The sizing of the hydraulic line was
determined by calculating inner diameter (ID) in order to
satisfy a target average fluid velocity based on Equation
4-1. The system required a line ID greater than 0.25” for the
pressure lines.
𝑇𝑢𝑏𝑒 𝐼. 𝐷. = 0.64√𝐹𝑙𝑜𝑤 𝑅𝑎𝑡𝑒
𝑉𝑒𝑙𝑜𝑐𝑖𝑡𝑦 Eq. 4-1
Hydraulic Accumulators: The configuration and
sizing of the accumulators were based on the physical space
of the system as well as simulations regarding discharge
behavior. Due to size constraints, two accumulators
connected in parallel were chosen rather than one large
accumulator. Simulations were performed predicting the
behavior of accumulator discharge at different precharge
pressures. Based on the results of the simulation and
physical constraints, two 1.6 gallon accumulators
precharged with nitrogen gas at 400 psi were chosen.
4.3 System Operation
Charging the System: For the system to operate, the
accumulators must be pressurized by the hydraulic charge
pump. The electric motor drives the hydraulic charge pump
which fills the accumulators to a pressure of 1,000 psi. The
pump is pressure compensated, so the flow rate will
decrease to zero as the system pressure approaches 1,000
psi. This process fills the accumulators with approximately
1.5 gallons of pressurized hydraulic fluid at 1,000 psi.
Figure 4-2 illustrates the flow diagram of the system while
it is charging.
Engine
Low Pressure Reservoir
Hydraulic Charge Pump
Solenoid Value
Wheel
Axle
Variable Displacement Hydraulic Pump/Motor
Relief Valve
Accumulators
Charging accumulators
Figure 4-2 System Charging Flow Diagram
Vehicle Propulsion: Following charging, the vehicle
can accelerate using the pressurized hydraulic fluid stored
in the accumulators. By changing the swashplate angle of
the pump/motor and energizing the solenoid valve, the
torque output of the pump/motor can be varied to
accommodate driving conditions. After the fluid flows
through the pump/motor, it is returned to the reservoir.
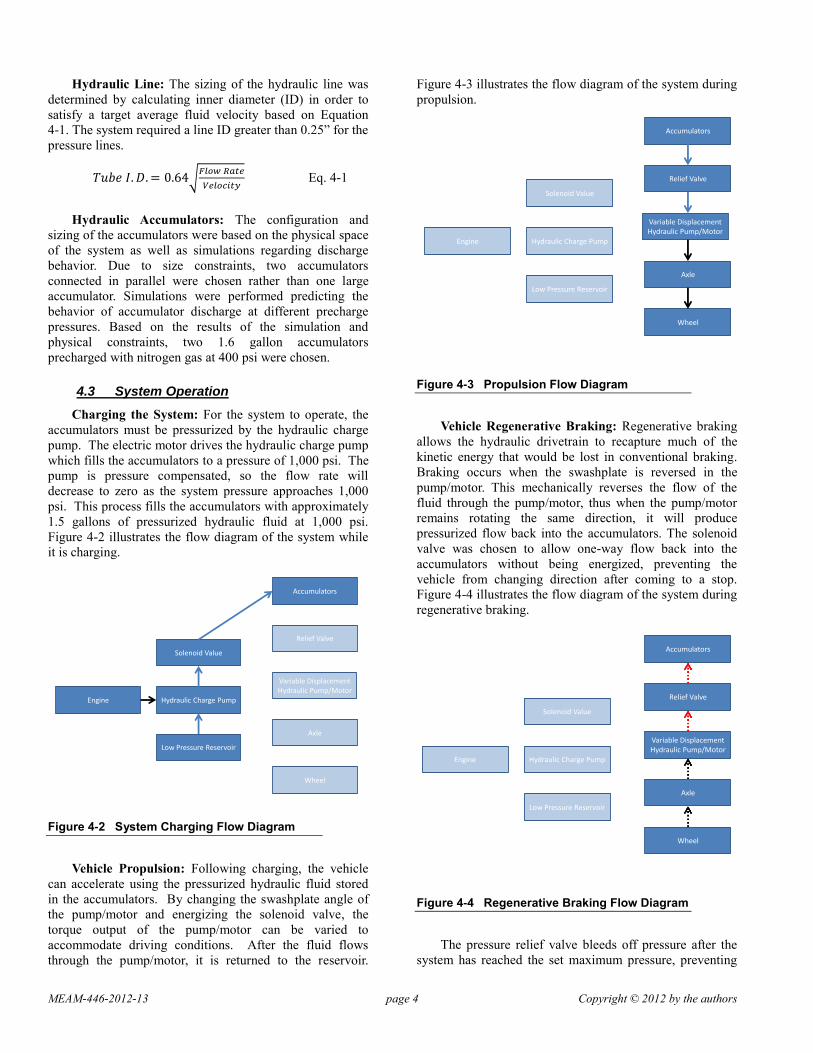
Figure 4-3 illustrates the flow diagram of the system during
propulsion.
Engine
Low Pressure Reservoir
Hydraulic Charge Pump
Solenoid Value
Wheel
Axle
Variable Displacement Hydraulic Pump/Motor
Relief Valve
Accumulators
Propulsion From Accumulators
Figure 4-3 Propulsion Flow Diagram
Vehicle Regenerative Braking: Regenerative braking
allows the hydraulic drivetrain to recapture much of the
kinetic energy that would be lost in conventional braking.
Braking occurs when the swashplate is reversed in the
pump/motor. This mechanically reverses the flow of the
fluid through the pump/motor, thus when the pump/motor
remains rotating the same direction, it will produce
pressurized flow back into the accumulators. The solenoid
valve was chosen to allow one-way flow back into the
accumulators without being energized, preventing the
vehicle from changing direction after coming to a stop.
Figure 4-4 illustrates the flow diagram of the system during
regenerative braking.
Engine
Low Pressure Reservoir
Hydraulic Charge Pump
Solenoid Value
Wheel
Axle
Variable Displacement Hydraulic Pump/Motor
Relief Valve
Accumulators
Figure 4-4 Regenerative Braking Flow Diagram
The pressure relief valve bleeds off pressure after the
system has reached the set maximum pressure, preventing
MEAM-446-2012-13 page 5 Copyright © 2012 by the authors
catastrophic failure and allowing non-regenerative
hydraulic braking. The flow diagram in Figure 4-5 further
illustrates the behavior of this component.
Engine
Low Pressure Reservoir
Hydraulic Charge Pump
Solenoid Value
Wheel
Axle
Variable Displacement Hydraulic Pump/Motor
Relief Valve
Accumulators
Regenerative Braking at or past
Figure 4-5 Non-Regenerative Braking Flow Diagram
4.4 Design Improvements
Several characteristics of the final prototype were
chosen due to outside constraints, including monetary
resources, readily available products, and ease/simplicity of
operation.
Hydraulic Charge Pump: The prototype utilizes a
variable vane hydraulic pump as the charge pump. This
pump lacks in operating efficiency compared to a similar
sized piston pump. Due to the small scale of our project, a
pressure compensated piston pump was not readily
available from suppliers that would satisfy our hydraulic
output requirements.
Additionally, the 1,000 psi system pressure was largely
a product of the maximum pressure of the vane pump and
other readily available pressure compensated hydraulic
pumps. By incorporating a piston pump operating at higher
pressures, higher efficiencies are possible as well as the use
of smaller accumulators.
Hydraulic Accumulators: The accumulators on the
final prototype were generously provided by Parker
Hannifin. While meeting the volume determined necessary
to satisfy the system performance goals, these accumulators
were under-utilized. Rated at 4,000 psi, the accumulators
were capable of much higher energy density than the
system could produce. Weight savings could have been
better utilized by these accumulators, decreasing the
required volume, and therefore component weight.
Hydraulic Pump/Motor: The prototype incorporates a
White Drive Products CP series variable displacement
hydraulic pump as the pump/motor. While White Drive
donated the CP pump to the project, their engineers were
unsure of its ability to perform as a variable displacement
hydraulic motor. The major concern was lack of efficiency,
especially at smaller swashplate angles (lower
displacements). Improvements in efficiency from further
pump/motor design would allow for higher overall system
efficiency (both in braking and propulsion).
5. PROTOTYPE REALIZATION
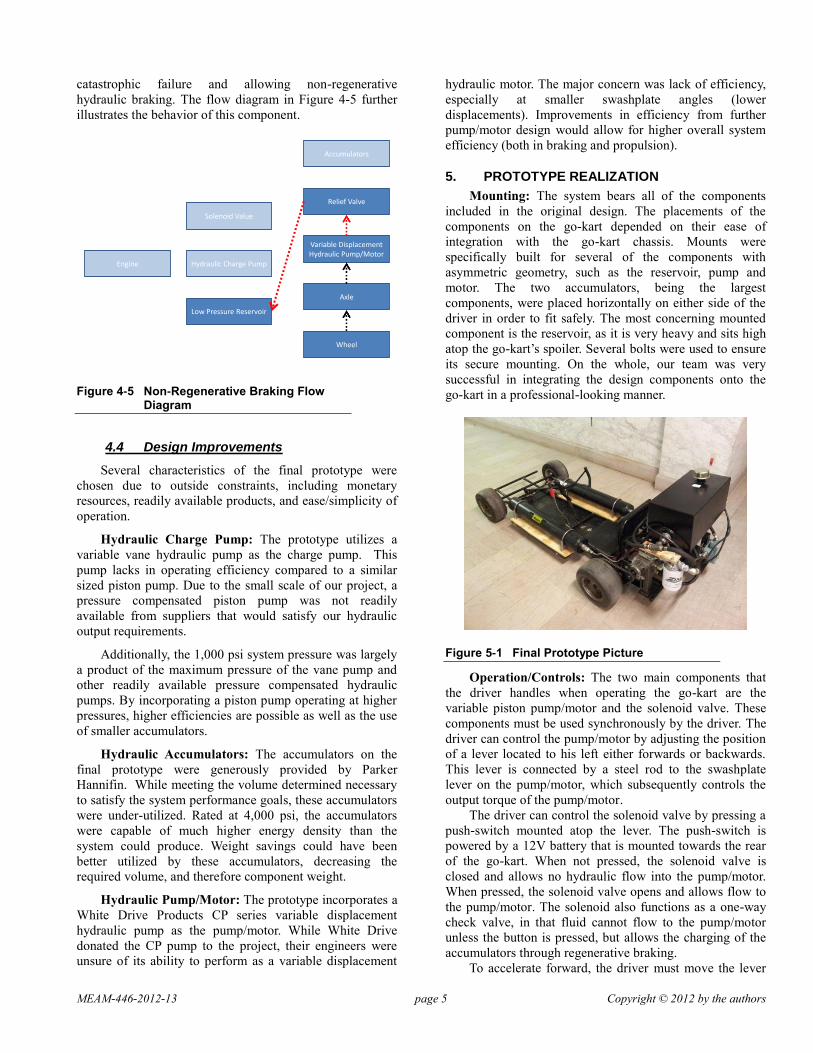
Mounting: The system bears all of the components
included in the original design. The placements of the
components on the go-kart depended on their ease of
integration with the go-kart chassis. Mounts were
specifically built for several of the components with
asymmetric geometry, such as the reservoir, pump and
motor. The two accumulators, being the largest
components, were placed horizontally on either side of the
driver in order to fit safely. The most concerning mounted
component is the reservoir, as it is very heavy and sits high
atop the go-kart’s spoiler. Several bolts were used to ensure
its secure mounting. On the whole, our team was very
successful in integrating the design components onto the
go-kart in a professional-looking manner.
Figure 5-1 Final Prototype Picture
Operation/Controls: The two main components that
the driver handles when operating the go-kart are the
variable piston pump/motor and the solenoid valve. These
components must be used synchronously by the driver. The
driver can control the pump/motor by adjusting the position
of a lever located to his left either forwards or backwards.
This lever is connected by a steel rod to the swashplate
lever on the pump/motor, which subsequently controls the
output torque of the pump/motor.
The driver can control the solenoid valve by pressing a
push-switch mounted atop the lever. The push-switch is
powered by a 12V battery that is mounted towards the rear
of the go-kart. When not pressed, the solenoid valve is
closed and allows no hydraulic flow into the pump/motor.
When pressed, the solenoid valve opens and allows flow to
the pump/motor. The solenoid also functions as a one-way
check valve, in that fluid cannot flow to the pump/motor
unless the button is pressed, but allows the charging of the
accumulators through regenerative braking.
To accelerate forward, the driver must move the lever
MEAM-446-2012-13 page 6 Copyright © 2012 by the authors
forward and press the push-switch, which allows fluid from
the accumulators to flow to the pump/motor. To brake, the
user must pull the lever back which reverses the swashplate
angle; the solenoid is open for flow in this direction
whether or not the button is pressed. In order to drive in
reverse, the driver must pull the lever backwards and press
the push-switch to allow flow from the accumulators to the
pump/motor. To brake during reverse, the driver must move
the lever forward.
Functionality: Having installed the control
mechanisms, the go-kart operates successfully in both
driving and regenerative braking. The go-kart can be driven
in two ways; either by using long extension cords to power
the electric motor, or by plugging in the electric motor
periodically to charge the accumulators. Additionally, due
to the continuous nature of the swashplate angle, the
drivability is similar to that of a passenger vehicle: the
driver does not experience violent accelerations.
6. EVALUATION AND TEST
Tests and evaluations were conducted to adjudicate the
overall success of the project as well as the accuracy of the
models. Tests were divided into three areas: propulsion
with accumulator, the efficiencies of the overall system, and
the regenerative braking.
6.1 Propulsion with Accumulator
To test the validity of the adiabatic assumption
pertaining to the accumulators, trials were run that isolated
the effects of the accumulators. Figure 6-1 shows the
difference between the experimental and theoretical
pressure versus time graphs of the accumulators.
Figure 6-1 Pressure Behavior During Discharge
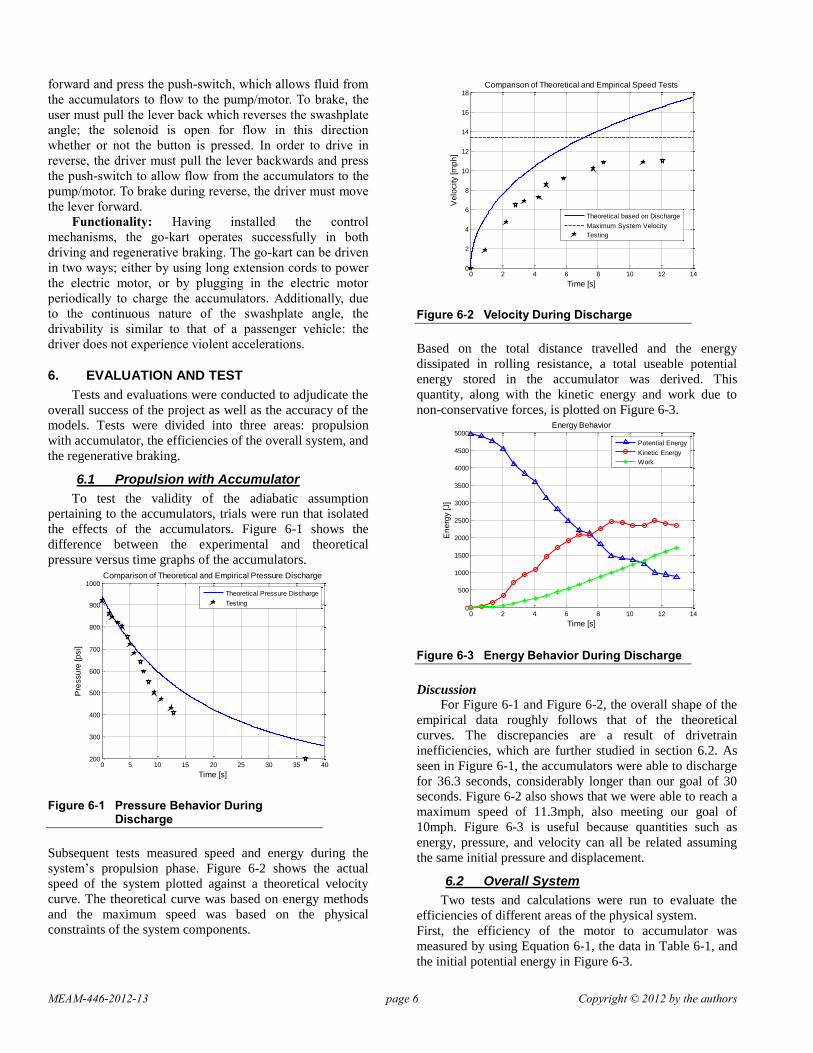
Subsequent tests measured speed and energy during the
system’s propulsion phase. Figure 6-2 shows the actual
speed of the system plotted against a theoretical velocity
curve. The theoretical curve was based on energy methods
and the maximum speed was based on the physical
constraints of the system components.
Figure 6-2 Velocity During Discharge
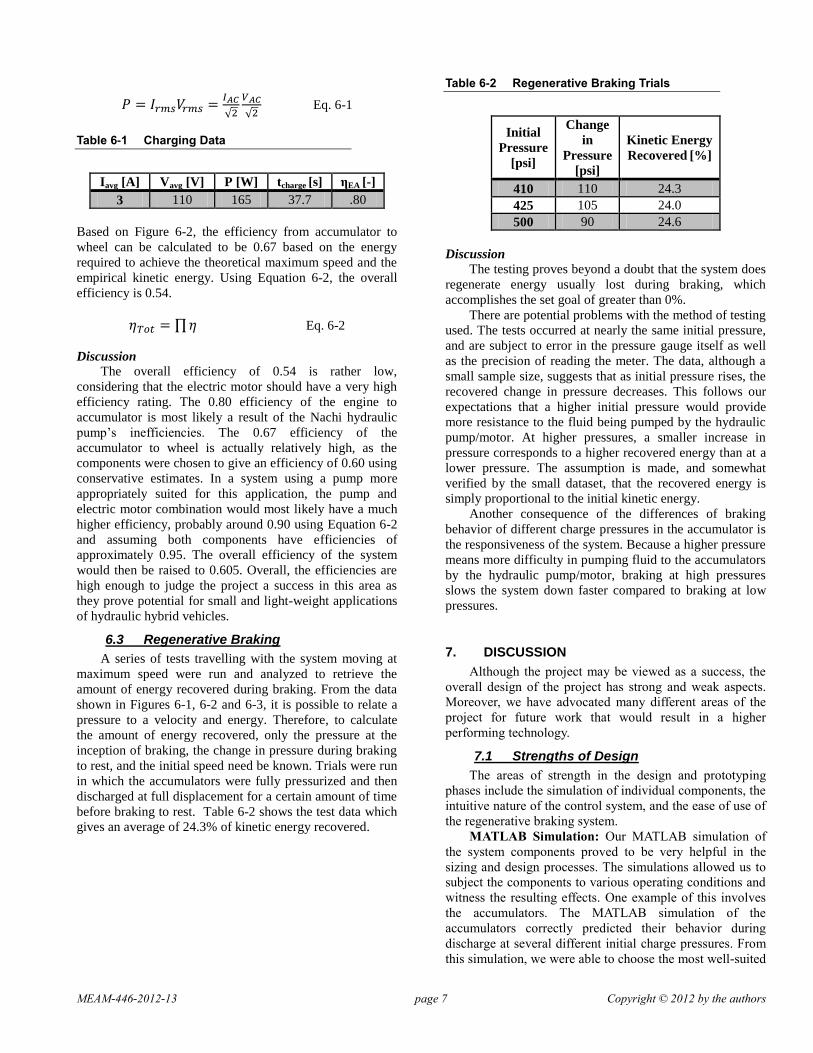
Based on the total distance travelled and the energy
dissipated in rolling resistance, a total useable potential
energy stored in the accumulator was derived. This
quantity, along with the kinetic energy and work due to
non-conservative forces, is plotted on Figure 6-3.
Figure 6-3 Energy Behavior During Discharge
Discussion
For Figure 6-1 and Figure 6-2, the overall shape of the
empirical data roughly follows that of the theoretical
curves. The discrepancies are a result of drivetrain
inefficiencies, which are further studied in section 6.2. As
seen in Figure 6-1, the accumulators were able to discharge
for 36.3 seconds, considerably longer than our goal of 30
seconds. Figure 6-2 also shows that we were able to reach a
maximum speed of 11.3mph, also meeting our goal of
10mph. Figure 6-3 is useful because quantities such as
energy, pressure, and velocity can all be related assuming
the same initial pressure and displacement.
6.2 Overall System
Two tests and calculations were run to evaluate the
efficiencies of different areas of the physical system.
First, the efficiency of the motor to accumulator was
measured by using Equation 6-1, the data in Table 6-1, and
the initial potential energy in Figure 6-3.
0 5 10 15 20 25 30 35 40200
300
400
500
600
700
800
900
1000
Time [s]
Pre
ssu
re [p
si]
Comparison of Theoretical and Empirical Pressure Discharge
Theoretical Pressure Discharge
Testing
0 2 4 6 8 10 12 140
2
4
6
8
10
12
14
16
18
Time [s]
Ve
locity [m
ph
]
Comparison of Theoretical and Empirical Speed Tests
Theoretical based on Discharge
Maximum System Velocity
Testing
0 2 4 6 8 10 12 140
500
1000
1500
2000
2500
3000
3500
4000
4500
5000
Time [s]
En
erg
y [J]
Energy Behavior
Potential Energy
Kinetic Energy
Work
MEAM-446-2012-13 page 7 Copyright © 2012 by the authors
= 𝐼 =
√
𝑉
√ Eq. 6-1
Table 6-1 Charging Data
Iavg [A] Vavg [V] P [W] tcharge [s] ηEA [-]
3 110 165 37.7 .80
Based on Figure 6-2, the efficiency from accumulator to
wheel can be calculated to be 0.67 based on the energy
required to achieve the theoretical maximum speed and the
empirical kinetic energy. Using Equation 6-2, the overall
efficiency is 0.54.
𝑜𝑡 = ∏ Eq. 6-2
Discussion
The overall efficiency of 0.54 is rather low,
considering that the electric motor should have a very high
efficiency rating. The 0.80 efficiency of the engine to
accumulator is most likely a result of the Nachi hydraulic
pump’s inefficiencies. The 0.67 efficiency of the
accumulator to wheel is actually relatively high, as the
components were chosen to give an efficiency of 0.60 using
conservative estimates. In a system using a pump more
appropriately suited for this application, the pump and
electric motor combination would most likely have a much
higher efficiency, probably around 0.90 using Equation 6-2
and assuming both components have efficiencies of
approximately 0.95. The overall efficiency of the system
would then be raised to 0.605. Overall, the efficiencies are
high enough to judge the project a success in this area as
they prove potential for small and light-weight applications
of hydraulic hybrid vehicles.
6.3 Regenerative Braking
A series of tests travelling with the system moving at
maximum speed were run and analyzed to retrieve the
amount of energy recovered during braking. From the data
shown in Figures 6-1, 6-2 and 6-3, it is possible to relate a
pressure to a velocity and energy. Therefore, to calculate
the amount of energy recovered, only the pressure at the
inception of braking, the change in pressure during braking
to rest, and the initial speed need be known. Trials were run
in which the accumulators were fully pressurized and then
discharged at full displacement for a certain amount of time
before braking to rest. Table 6-2 shows the test data which
gives an average of 24.3% of kinetic energy recovered.
Table 6-2 Regenerative Braking Trials
Initial
Pressure
[psi]
Change
in
Pressure
[psi]
Kinetic Energy
Recovered [%]
410 110 24.3
425 105 24.0
500 90 24.6
Discussion
The testing proves beyond a doubt that the system does
regenerate energy usually lost during braking, which
accomplishes the set goal of greater than 0%.
There are potential problems with the method of testing
used. The tests occurred at nearly the same initial pressure,
and are subject to error in the pressure gauge itself as well
as the precision of reading the meter. The data, although a
small sample size, suggests that as initial pressure rises, the
recovered change in pressure decreases. This follows our
expectations that a higher initial pressure would provide
more resistance to the fluid being pumped by the hydraulic
pump/motor. At higher pressures, a smaller increase in
pressure corresponds to a higher recovered energy than at a
lower pressure. The assumption is made, and somewhat
verified by the small dataset, that the recovered energy is
simply proportional to the initial kinetic energy.
Another consequence of the differences of braking
behavior of different charge pressures in the accumulator is
the responsiveness of the system. Because a higher pressure
means more difficulty in pumping fluid to the accumulators
by the hydraulic pump/motor, braking at high pressures
slows the system down faster compared to braking at low
pressures.
7. DISCUSSION
Although the project may be viewed as a success, the
overall design of the project has strong and weak aspects.
Moreover, we have advocated many different areas of the
project for future work that would result in a higher
performing technology.
7.1 Strengths of Design
The areas of strength in the design and prototyping
phases include the simulation of individual components, the
intuitive nature of the control system, and the ease of use of
the regenerative braking system.
MATLAB Simulation: Our MATLAB simulation of
the system components proved to be very helpful in the
sizing and design processes. The simulations allowed us to
subject the components to various operating conditions and
witness the resulting effects. One example of this involves
the accumulators. The MATLAB simulation of the
accumulators correctly predicted their behavior during
discharge at several different initial charge pressures. From
this simulation, we were able to choose the most well-suited
MEAM-446-2012-13 page 8 Copyright © 2012 by the authors
configuration for our application. This same process was
performed for many of the other system components.
Simple Control System: A simple and easily operated
control system was accomplished by making the lever
positions intuitive for the driver; that is, adjusting the lever
forward moves the go-kart forward, and adjusting the lever
backwards moves the go-kart backwards.
Simple Regenerative Braking Routine: Braking is
remarkably easy for the driver, requiring only one action.
As previously discussed, the solenoid was implemented
such that it can allow flow to reverse without requiring any
battery power. Consequently, the operator must only
position the control lever backwards in order to brake and
regenerate energy.
7.2 Weaknesses of Design
The project weaknesses include the lack of utilization
of the Simulink simulation, and the inconsistencies in
braking behavior.
Utilization of Simulink: A Simulink model was
devised in which two system designs were evaluated: our
system, and a traditional drivetrain system of similar size.
The model outputted only relative values and was not
wholly verified. For this reason, the Simulink model was
not applied in choosing the best configuration of
components as initially intended.
Inconsistent Braking Behavior: We discovered that
the intensity of the go-kart’s braking varied with the
pressure in the accumulators. At high accumulator
pressures, the braking is more severe as the flow encounters
more difficulty in reversing direction. At low accumulator
pressures, the braking is slow as the flow encounters less
pressure resistance. This inconsistency makes braking less
predictable and the system more difficult to drive.
7.3 Future Work
Our project and subsequent analysis show a large
amount of potential for hydraulic hybrids. Given that
potential, many areas of improvement are advocated by the
team:
Carbon Fiber Accumulators – Weight is at a
premium on passenger vehicles, and the heaviest
component of a hydraulic hybrid is the accumulator. Steel
accumulators offer better performance currently due to their
higher maximum pressure, but an effort to make these
carbon fiber accumulators stronger would greatly improve
the efficiency of the system.
Lightweight Components – Hydraulic components
are often very heavy parts because companies have little
incentive to produce lighter components. With results of our
and other concurrent projects, it is now obvious that
engineering lightweight components could help
revolutionize the hydraulic hybrid industry.
Turbines – Turbines are capable of high efficiencies,
but only in a very narrow range of rotational speeds and
loads. Because the axle is decoupled from the motor in our
system, it is possible to take advantage of the increased
efficiency of a turbine.
A Set Minimum Pressure in the Accumulators – The
accumulators behave most ideally and effectively at higher
pressures. For this reason, it would be best to set a high
minimum pressure for the accumulators. This would
increase efficiencies due to fewer losses during discharge as
well as mitigating the inconsistencies caused by differing
accumulator pressures.
8. CONCLUSIONS AND RECOMMENDATIONS
Our project demonstrated both the feasibility and
performance of hydraulic hybrids on a small scale. With
more time for research and an extensive budget, we are
confident the project would have further shown the
advantages of a series hydraulic hybrid system. In moving
forward, we believe that hydraulic hybrid systems have a
greater potential for performance in passenger vehicles than
current hybrid designs. We strongly recommend that further
research be conducted by universities and automotive
companies to explore this potential.
9. ACKNOWLEDGEMENTS
Our final product was made possible by the help of our
faculty advisor, Dr. Andrew Jackson, as well as the senior
design course instructor, Dr. Robert Jeffcoat and the
course’s teaching assistant, John Martin. Additionally, we
received assistance from the UPenn Formula SAE team.
We also received generous donations from several
companies. Parker Hannifin graciously donates two
accumulators, while White Drive Products donated the
variable piston pump/motor. SKF and Colonial Seal also
assisted our team by supplying a seal when one of our
components temporarily faltered.
10. NOMENCLATURE AND DEFINITIONS
A Amperes
AC Alternating Current
CC/Rev Cubic Centimeter Per Revolution
Displacement Volume of Hydraulic Fluid Transferred
Per Motor Revolution
ηEA Efficiency Between Engine and
Accumulators
I Current
P Power, in Watts
p Pressure, in psi
psi Pounds Per Square Inch, Unit of Pressure
rms Root Mean Squared
V Voltage
MEAM-446-2012-13 page 9 Copyright © 2012 by the authors
11. REFERENCES
1 Rensselar, Jean Van, ed. "Power to Spare: Hydraulic
Hybrids." Tribology and Lubrication Technology. Feb. 2012.
Web.
<http://onlinedigitalpublishing.com/publication/?i=97071>.
Additional references
"Energy Losses in a Vehicle." Consumer Energy Center.
California Energy Commission. Web. 2 Apr. 2012.
<http://www.consumerenergycenter.org/transportation/
consumer_tips/vehicle_energy_losses.html>.
Gray, Charles L. Hydraulic Hybrids. Houston: Houston
Advanced Research Center, 17 Oct. 2006. PDF.
Hansen, Alex, Tom Coletta, Ryan Weaver, Shawn Wilhelm,
Dan Mittelman, and Eric Weiland. Hydraulic Series
Hybrid Baja Car. Tech. WORCESTER
POLYTECHNIC INSTITUTE, 2010. Print.
Holmberg, Kenneth, Peter Andersson, and Ali Erdemir.
"Global Energy Consumption Due to Friction in
Passenger Cars." Tribology International 47 (2012):
221-34. SciVerse. Web. 4 Apr. 2012.
Industrial Hydraulic Service Inc. Tube Selection Chart.
Sherwood, Oregon: Industrial Hydraulic Service Inc.
PDF.
Nikkel, Cathy. "EPA Innovates Hydraulic Hybrid System."
Automedia.com. Automedia.com, 2006. Web. 26 Apr.
2012.
<http://www.automedia.com/EPA_Innovates_Hydrauli
c_Hybrid_System/dsm20060801eh/1>.
Van De Ven, James D., Michael W. Olson, and Perry Y. Li.
Development of a Hydro-Mechanical Hydraulic Hybrid
Drive Train with Independent Wheel Torque Control
for an Urban Passenger Vehicle. The Pennsylvania
State University. Web. 3 Apr. 2012.
<http://www.google.com/url?sa=t&rct=j&q=&esrc=s&
source=web&cd=2&ved=0CFwQFjAB&url=http%3A
%2F%2Fciteseerx.ist.psu.edu%2Fviewdoc%2Fdownlo
ad%3Fdoi%3D10.1.1.148.8237%26rep%3Drep1%26ty
pe%3Dpdf&ei=HJGYT6rmDaqX6AGLt8n1Bg&usg=
AFQjCNG2h7cJlOlJGE5RQkihZCgPuX-8IQ>.
Van Rensselar, Jean. "Power to Spare: Hydraulic Hybrids."
Tribology and Lubrication Technology (2012): 34-43.
Print.
INTELLECTUAL PROPERTY
This document, in whole or in part, in electronic or
other form, may be freely reproduced and modified, without
restriction, provided only that the source be properly
attributed.
CORRESPONDING AUTHOR
Inquiries should be addressed to Alfred ‘Hurst’
Nuckols at [email protected].
MEAM-446-2012-13 page 10 Copyright © 2012 by the authors
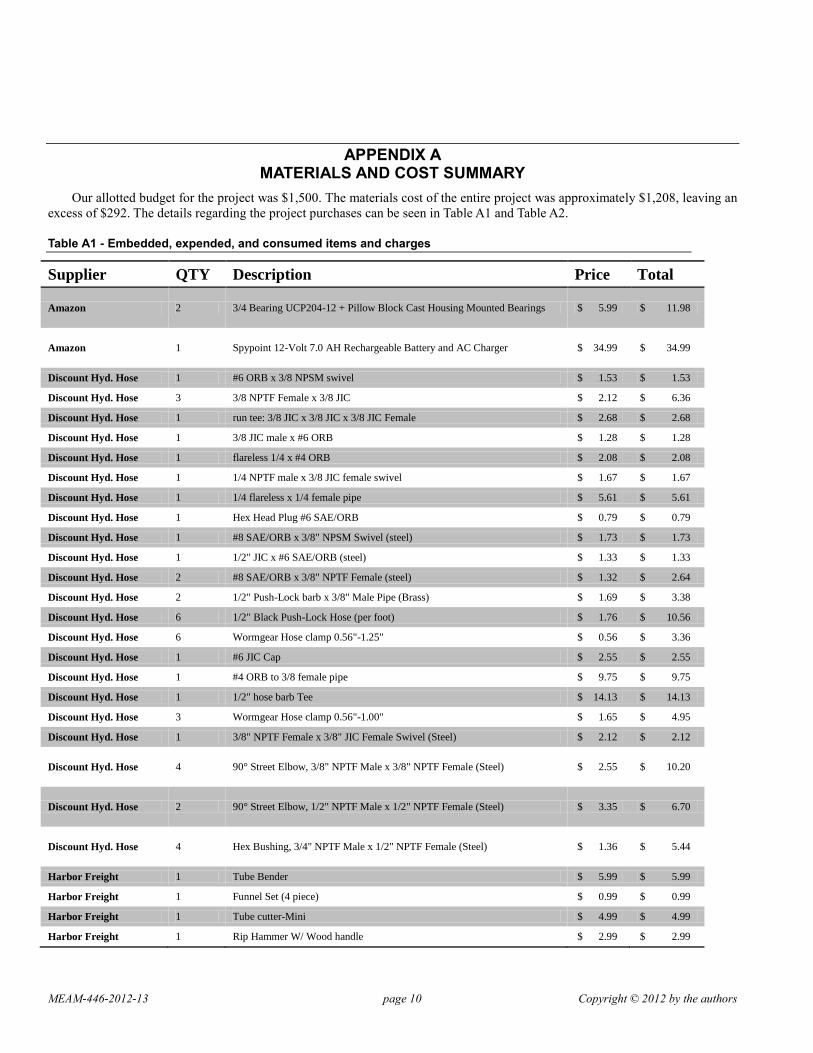
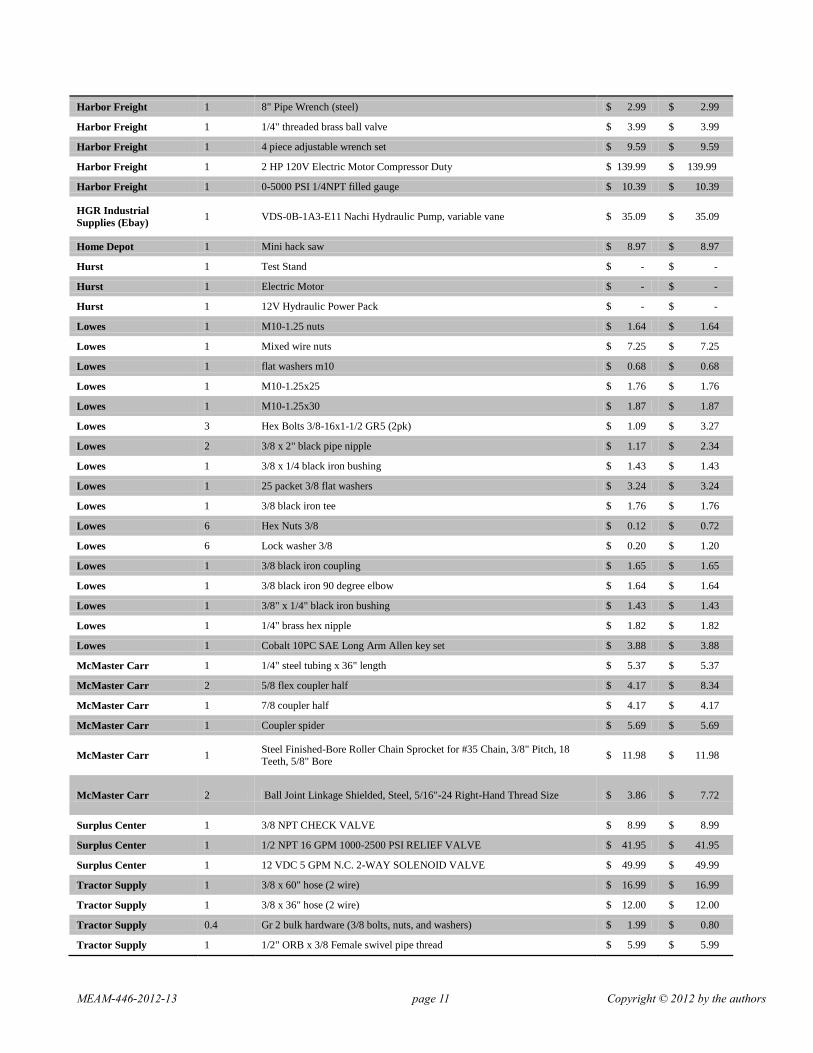
APPENDIX A MATERIALS AND COST SUMMARY
Our allotted budget for the project was $1,500. The materials cost of the entire project was approximately $1,208, leaving an
excess of $292. The details regarding the project purchases can be seen in Table A1 and Table A2.
Table A1 - Embedded, expended, and consumed items and charges
Supplier QTY Description Price Total
Amazon 2 3/4 Bearing UCP204-12 + Pillow Block Cast Housing Mounted Bearings $ 5.99 $ 11.98
Amazon 1 Spypoint 12-Volt 7.0 AH Rechargeable Battery and AC Charger $ 34.99 $ 34.99
Discount Hyd. Hose 1 #6 ORB x 3/8 NPSM swivel $ 1.53 $ 1.53
Discount Hyd. Hose 3 3/8 NPTF Female x 3/8 JIC $ 2.12 $ 6.36
Discount Hyd. Hose 1 run tee: 3/8 JIC x 3/8 JIC x 3/8 JIC Female $ 2.68 $ 2.68
Discount Hyd. Hose 1 3/8 JIC male x #6 ORB $ 1.28 $ 1.28
Discount Hyd. Hose 1 flareless 1/4 x #4 ORB $ 2.08 $ 2.08
Discount Hyd. Hose 1 1/4 NPTF male x 3/8 JIC female swivel $ 1.67 $ 1.67
Discount Hyd. Hose 1 1/4 flareless x 1/4 female pipe $ 5.61 $ 5.61
Discount Hyd. Hose 1 Hex Head Plug #6 SAE/ORB $ 0.79 $ 0.79
Discount Hyd. Hose 1 #8 SAE/ORB x 3/8" NPSM Swivel (steel) $ 1.73 $ 1.73
Discount Hyd. Hose 1 1/2" JIC x #6 SAE/ORB (steel) $ 1.33 $ 1.33
Discount Hyd. Hose 2 #8 SAE/ORB x 3/8" NPTF Female (steel) $ 1.32 $ 2.64
Discount Hyd. Hose 2 1/2" Push-Lock barb x 3/8" Male Pipe (Brass) $ 1.69 $ 3.38
Discount Hyd. Hose 6 1/2" Black Push-Lock Hose (per foot) $ 1.76 $ 10.56
Discount Hyd. Hose 6 Wormgear Hose clamp 0.56"-1.25" $ 0.56 $ 3.36
Discount Hyd. Hose 1 #6 JIC Cap $ 2.55 $ 2.55
Discount Hyd. Hose 1 #4 ORB to 3/8 female pipe $ 9.75 $ 9.75
Discount Hyd. Hose 1 1/2" hose barb Tee $ 14.13 $ 14.13
Discount Hyd. Hose 3 Wormgear Hose clamp 0.56"-1.00" $ 1.65 $ 4.95
Discount Hyd. Hose 1 3/8" NPTF Female x 3/8" JIC Female Swivel (Steel) $ 2.12 $ 2.12
Discount Hyd. Hose 4 90° Street Elbow, 3/8" NPTF Male x 3/8" NPTF Female (Steel) $ 2.55 $ 10.20
Discount Hyd. Hose 2 90° Street Elbow, 1/2" NPTF Male x 1/2" NPTF Female (Steel) $ 3.35 $ 6.70
Discount Hyd. Hose 4 Hex Bushing, 3/4" NPTF Male x 1/2" NPTF Female (Steel) $ 1.36 $ 5.44
Harbor Freight 1 Tube Bender $ 5.99 $ 5.99
Harbor Freight 1 Funnel Set (4 piece) $ 0.99 $ 0.99
Harbor Freight 1 Tube cutter-Mini $ 4.99 $ 4.99
Harbor Freight 1 Rip Hammer W/ Wood handle $ 2.99 $ 2.99
MEAM-446-2012-13 page 11 Copyright © 2012 by the authors
Harbor Freight 1 8" Pipe Wrench (steel) $ 2.99 $ 2.99
Harbor Freight 1 1/4" threaded brass ball valve $ 3.99 $ 3.99
Harbor Freight 1 4 piece adjustable wrench set $ 9.59 $ 9.59
Harbor Freight 1 2 HP 120V Electric Motor Compressor Duty $ 139.99 $ 139.99
Harbor Freight 1 0-5000 PSI 1/4NPT filled gauge $ 10.39 $ 10.39
HGR Industrial
Supplies (Ebay) 1 VDS-0B-1A3-E11 Nachi Hydraulic Pump, variable vane $ 35.09 $ 35.09
Home Depot 1 Mini hack saw $ 8.97 $ 8.97
Hurst 1 Test Stand $ - $ -
Hurst 1 Electric Motor $ - $ -
Hurst 1 12V Hydraulic Power Pack $ - $ -
Lowes 1 M10-1.25 nuts $ 1.64 $ 1.64
Lowes 1 Mixed wire nuts $ 7.25 $ 7.25
Lowes 1 flat washers m10 $ 0.68 $ 0.68
Lowes 1 M10-1.25x25 $ 1.76 $ 1.76
Lowes 1 M10-1.25x30 $ 1.87 $ 1.87
Lowes 3 Hex Bolts 3/8-16x1-1/2 GR5 (2pk) $ 1.09 $ 3.27
Lowes 2 3/8 x 2" black pipe nipple $ 1.17 $ 2.34
Lowes 1 3/8 x 1/4 black iron bushing $ 1.43 $ 1.43
Lowes 1 25 packet 3/8 flat washers $ 3.24 $ 3.24
Lowes 1 3/8 black iron tee $ 1.76 $ 1.76
Lowes 6 Hex Nuts 3/8 $ 0.12 $ 0.72
Lowes 6 Lock washer 3/8 $ 0.20 $ 1.20
Lowes 1 3/8 black iron coupling $ 1.65 $ 1.65
Lowes 1 3/8 black iron 90 degree elbow $ 1.64 $ 1.64
Lowes 1 3/8" x 1/4" black iron bushing $ 1.43 $ 1.43
Lowes 1 1/4" brass hex nipple $ 1.82 $ 1.82
Lowes 1 Cobalt 10PC SAE Long Arm Allen key set $ 3.88 $ 3.88
McMaster Carr 1 1/4" steel tubing x 36" length $ 5.37 $ 5.37
McMaster Carr 2 5/8 flex coupler half $ 4.17 $ 8.34
McMaster Carr 1 7/8 coupler half $ 4.17 $ 4.17
McMaster Carr 1 Coupler spider $ 5.69 $ 5.69
McMaster Carr 1 Steel Finished-Bore Roller Chain Sprocket for #35 Chain, 3/8" Pitch, 18 Teeth, 5/8" Bore
$ 11.98 $ 11.98
McMaster Carr 2 Ball Joint Linkage Shielded, Steel, 5/16"-24 Right-Hand Thread Size $ 3.86 $ 7.72
Surplus Center 1 3/8 NPT CHECK VALVE $ 8.99 $ 8.99
Surplus Center 1 1/2 NPT 16 GPM 1000-2500 PSI RELIEF VALVE $ 41.95 $ 41.95
Surplus Center 1 12 VDC 5 GPM N.C. 2-WAY SOLENOID VALVE $ 49.99 $ 49.99
Tractor Supply 1 3/8 x 60" hose (2 wire) $ 16.99 $ 16.99
Tractor Supply 1 3/8 x 36" hose (2 wire) $ 12.00 $ 12.00
Tractor Supply 0.4 Gr 2 bulk hardware (3/8 bolts, nuts, and washers) $ 1.99 $ 0.80
Tractor Supply 1 1/2" ORB x 3/8 Female swivel pipe thread $ 5.99 $ 5.99
MEAM-446-2012-13 page 12 Copyright © 2012 by the authors
Tractor Supply 1 5 Gallon Reservoir $ 89.99 $ 89.99
White Drives 1 CP Variable Drive pump $ - $ -
Total Cost
$ 681.33
Table A2 - Recoverable items
Supplier QTY Description Price Total
Advanced Auto Parts 1 AW46 Hydraulic Oil $ 47.48 $ 47.48
Advanced Auto Parts 1 Funnel $ 3.80 $ 3.80
Amazon 1 Koch 7435100 Roller Chain, #35, 10 Feet $ 12.70 $ 12.70
Amazon 1 Koch 7535040 Roller Chain Connector Link, 4-Pack, #35 $ 10.39 $ 10.39
Discount Hyd. Hose 1 1/2" Push-Lock x 3/8" Male Pipe (Brass) $ 1.69 $ 1.69
Discount Hyd. Hose 4 3/8" Flareless x 1/2" Male Pipe (Steel) $ 3.73 $ 14.92
Discount Hyd. Hose 2 3/8" Flareless Compression Tee (Steel) $ 8.42 $ 16.84
Discount Hyd. Hose 6 3/8" Flareless x 3/8" Male Pipe (Steel) $ 2.46 $ 14.76
Discount Hyd. Hose 4 1/2" Push-Lock x 1/2" Male Pipe (Brass) $ 2.31 $ 9.24
Discount Hyd. Hose 2 3/8" Flareless x 1/4" Female Pipe Tee (Steel) $ 7.51 $ 15.02
Discount Hyd. Hose 1 Bottom-Mounted Pressure Gauge, 0 to 2,000 psi $ 17.50 $ 17.50
Discount Hyd. Hose 2 #12 SAE/ORB x 3/4" NPTF Female (Steel) $ 2.57 $ 5.14
Harbor Freight 1 Miscellaneous Shipping Costs $ 6.99 $ 6.99
Harbor Freight 1 Hand-held Digital Scale $ 14.99 $ 14.99
Harbor Freight 1 5-Function Clamp on Multimeter $ 9.99 $ 9.99
Harbor Freight 1 50ft x 14GA Outdoor Extension Cord $ 21.99 $ 21.99
HGR Industrial Supplies
(Ebay) 1 shipping costs $ 11.75 $ 11.75
Home Depot 1 2x3 Stud $ 1.86 $ 1.86
Home Depot 3 Wood Screws $ 1.18 $ 3.54
Home Depot 2 Metal Screws $ 1.18 $ 2.36
Home Depot 1 3/4" x 1/16" x 36" angle aluminum $ 3.97 $ 3.97
Home Depot 1 Flat plain steel 1x3/16x36 $ 6.25 $ 6.25
Home Depot 1 Threaded rod zinc 5/16 x 36 $ 2.63 $ 2.63
Home Depot 1 1/2" 2x4 ft. handy panel plywood sheet $ 10.17 $ 10.17
Home Depot 1 9' black power tool cord $ 12.97 $ 12.97
Home Depot 2 5/16 nuts, washer, and lockwasher kit $ 2.47 $ 4.94
Home Depot 1 1/4 nuts, washer, and lockwasher kit $ 2.36 $ 2.36
Home Depot 1 Sheet metal screws $ 1.18 $ 1.18
Home Depot 1 Corner Brace 1" 4pk $ 2.27 $ 2.27
Home Depot 1 1/4" washers $ 1.18 $ 1.18
Home Depot 2 Hex bolt 1/4 x 1 $ 0.12 $ 0.24
Home Depot 4 Hex bolt 5/16 x 3/4 $ 0.16 $ 0.64
Home Depot 4 Hex bolt 5/16 x 1 $ 0.17 $ 0.68
MEAM-446-2012-13 page 13 Copyright © 2012 by the authors
Home Depot 4 Hex Bolt 1/4 x 1-1/2 $ 0.17 $ 0.68
Home Depot 4 Hex bolt 1/4 x 3/4 $ 0.11 $ 0.44
Lowes 1 Angle Iron (enough to make 2 mounts for the pump) $ 16.57 $ 16.57
Lowes 2 Roll of Teflon tape $ 1.07 $ 2.14
Lowes 1 Flat steel 3/16" x 3"-3' for pump mounting $ 17.64 $ 17.64
Lowes 1 1/4 SAE flat steel washer $ 1.18 $ 1.18
Lowes 1 3/8" black pipe plug $ 1.12 $ 1.12
McMaster Carr 1 Plain Steel Threaded Rod 5/16"-24 Thread, 3' Length $ 2.56 $ 2.56
McMaster Carr 1 Plain Grade 2 Steel Hex Nut 5/16"-24 Thread Size, 1/2" Width, 17/64" Height, packs of 100
$ 2.76 $ 2.76
McMaster Carr 4 Clamping U-Bolt Steel, 3/8"-16 Thread, for 5" Outside Diameter $ 2.97 $ 11.88
McMaster Carr 1 Zinc-Plated Steel Large-Diameter Flat Washer 5/16" Screw Size, 2" OD, .04"-.06" Thick, packs of 25
$ 9.01 $ 9.01
McMaster Carr 1 Zinc-Plated Steel U-Bolt W/Plate, 1/4"-20 X1-1/4" L Third, for 1-1/4" OD, 435#Wll, packs of 10
$ 8.40 $ 8.40
McMaster Carr 1 Slide-on Flat Grip Smooth Surface Fits Flat Bar 3/16" X 1", Red, packs of 6 $ 8.87 $ 8.87
McMaster Carr 1 Steel Drive Shaft 3/4" OD, 36" Length $ 35.50 $ 35.50
McMaster Carr 1 Forged Clevis Rod End Steel, 5/16"-24 Female Thread Size, 2-1/4" Length $ 4.98 $ 4.98
McMaster Carr 2 Carbon Steel seamless tubing 3/8" OD, .305" ID, .035 wall, 6' Length $ 10.08 $ 20.16
McMaster Carr 1 Steel Finished-Bore Roller Chain Sprocket for #35, 3/8" Pitch Chain, 35 Teeth, 5/8" bore
$ 27.95 $ 27.95
McMaster Carr 1 High DC Inrush Current Relay Standard, SPST-NO, 5 Terminals, 12V DC Control, W/Tab
$ 7.68 $ 7.68
McMaster Carr 1 Heat-Treatable Steel Standard Key Stock 3/16" X 3/16", 12" Length $ 2.74 $ 2.74
Surplus Center 1 3/4" NPT 9 GPM FA1100-25 SUCTION FILTER $ 19.95 $ 19.95
Surplus Center 1 Shipping costs $ 12.91 $ 12.91
Tractor Supply 1 2 gal tractor fluid $ 18.99 $ 18.99
Total Cost
$ 526.54
MEAM-446-2012-13 page 14 Copyright © 2012 by the authors
APPENDIX B ACCUMULATOR SIZING
Accumulator sizing and configuration was decided by
identifying which parameters could and could not be
modified, simulating the behavior of discharge, and
manually choosing the best attainable accumulator for the
application.
Parameter Identification
Parameters which cannot be modified are as follows:
1000 psi hydraulic charge pressure
25 psi difference between minimum working
pressure and initial charge pressure of accumulator
4:1 working pressure to initial charge pressure
ratio
0.8 cubic inch per revolution maximum variable
axial piston hydraulic motor displacement
700 rpm maximum variable axial piston motor
speed
150 kg net mass of go-kart, drivetrain system, and
operator
60% efficiency from accumulator to axle
Parameters to be set within the simulation are as follows:
Mode of heat transfer (isothermal or isentropic)
Size/Weight of accumulator
Initial charge pressure
Rolling resistance coefficient and aerodynamic
drag
The mode of heat transfer depends on the amount of
time the accumulator discharges. If the discharge time is
under one minute, heat transfer is approximated as fully
isentropic. If the discharge time is over two minutes, heat
transfer is approximated as fully isothermal. In between one
and two minutes, heat transfer is some hybridization of the
two modes.1 Next, the optimal size and weight
configuration of the accumulator is the largest viable
capacity with the lightest weight. The initial charge
pressure must be at least 250 psi because the working
pressure of the system is 1000 psi. Finally, the rolling
resistance coefficient and aerodynamic drag must be chosen
to best describe the system.
Research led to a coefficient of rolling resistance to be
approximated at a nominal value of 0.01, which is a
common value for car tires.2 Although a normal go-kart
1 Design Engineers Handbook. Cleveland: Parker Hannifin, 1979.
Print.
2 "Low Rolling Resistance Tires." Alternative Fuels and Advanced
likely has a rolling resistance coefficient lower than 0.01,
the additional weight of the drivetrain and accumulator
makes this comparison to car tires a valid approximation.
Based on the speed of the go-kart, calculations showed
aerodynamic drag to be negligible. It was later found that
the rolling resistance coefficient was actually closer to 0.02.
Simulation and Results
Two versions of code were produced, one for
isentropic discharge and the other for isothermal discharge
to use depending on the discharge duration. A Euler
integration scheme was developed to find a collection of
quantities including power provided and the conditions in
the accumulator at any given time. Given the power
provided by the accumulator, the speed of the go-kart can
be computed based on the weight, the coefficient of rolling
resistance and the efficiency of the drivetrain using another
integration scheme.
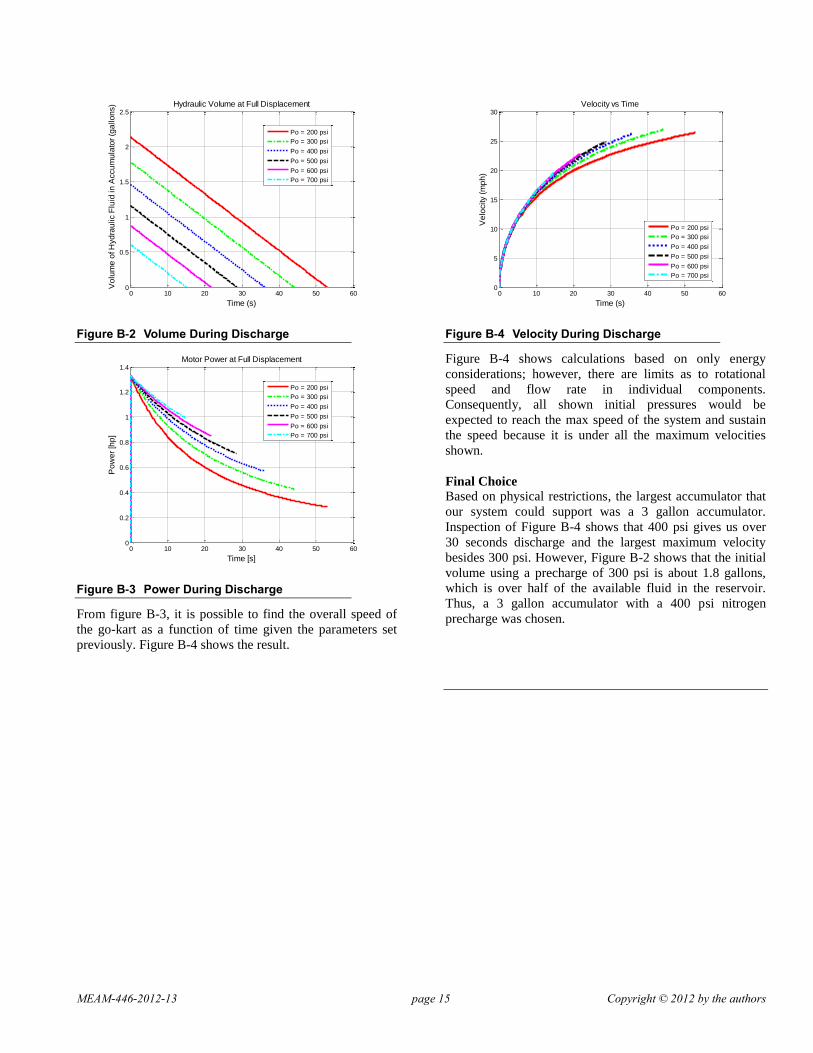
Figures B-1 through B-3 show the behavior of the
chosen accumulator at various initial charge pressures
between 200 and 700 psi.
Figure B-1 Pressure During Discharge
Vehicles Data Center:. Web.
<http://www.afdc.energy.gov/afdc/vehicles/fuel_economy_tir
es_light.html>.
0 10 20 30 40 50 60100
200
300
400
500
600
700
800
900
1000
Time (s)
Hyd
rau
lic P
ressu
re in
Accu
mu
lato
r (p
si)
Hydraulic Pressure at Full Displacement
Po = 200 psi
Po = 300 psi
Po = 400 psi
Po = 500 psi
Po = 600 psi
Po = 700 psi
MEAM-446-2012-13 page 15 Copyright © 2012 by the authors
Figure B-2 Volume During Discharge
Figure B-3 Power During Discharge
From figure B-3, it is possible to find the overall speed of
the go-kart as a function of time given the parameters set
previously. Figure B-4 shows the result.
Figure B-4 Velocity During Discharge
Figure B-4 shows calculations based on only energy
considerations; however, there are limits as to rotational
speed and flow rate in individual components.
Consequently, all shown initial pressures would be
expected to reach the max speed of the system and sustain
the speed because it is under all the maximum velocities
shown.
Final Choice
Based on physical restrictions, the largest accumulator that
our system could support was a 3 gallon accumulator.
Inspection of Figure B-4 shows that 400 psi gives us over
30 seconds discharge and the largest maximum velocity
besides 300 psi. However, Figure B-2 shows that the initial
volume using a precharge of 300 psi is about 1.8 gallons,
which is over half of the available fluid in the reservoir.
Thus, a 3 gallon accumulator with a 400 psi nitrogen
precharge was chosen.
0 10 20 30 40 50 600
0.5
1
1.5
2
2.5
Time (s)
Vo
lum
e o
f H
yd
rau
lic F
luid
in
Accu
mu
lato
r (g
allo
ns) Hydraulic Volume at Full Displacement
Po = 200 psi
Po = 300 psi
Po = 400 psi
Po = 500 psi
Po = 600 psi
Po = 700 psi
0 10 20 30 40 50 600
0.2
0.4
0.6
0.8
1
1.2
1.4
Time [s]
Po
we
r [h
p]
Motor Power at Full Displacement
Po = 200 psi
Po = 300 psi
Po = 400 psi
Po = 500 psi
Po = 600 psi
Po = 700 psi
0 10 20 30 40 50 600
5
10
15
20
25
30
Time (s)
Ve
locity (
mp
h)
Velocity vs Time
Po = 200 psi
Po = 300 psi
Po = 400 psi
Po = 500 psi
Po = 600 psi
Po = 700 psi