Embed Size (px)
Citation preview

Meanwhile, Jan 18, 2016
• New GOP ‘candidates:’ Romney, L. Graham; Ryan says no.
• 11 GOP debates scheduled– Aug ’15, Sept ‘15, Oct ‘15, Nov ‘15, Dec
‘15, Jan ‘16 (IA), Feb ‘16 (NH), Feb ‘16 (SC), Feb ‘16 (FL), Mar ’16, Mar ‘16
• Dems (May or June ‘15)?
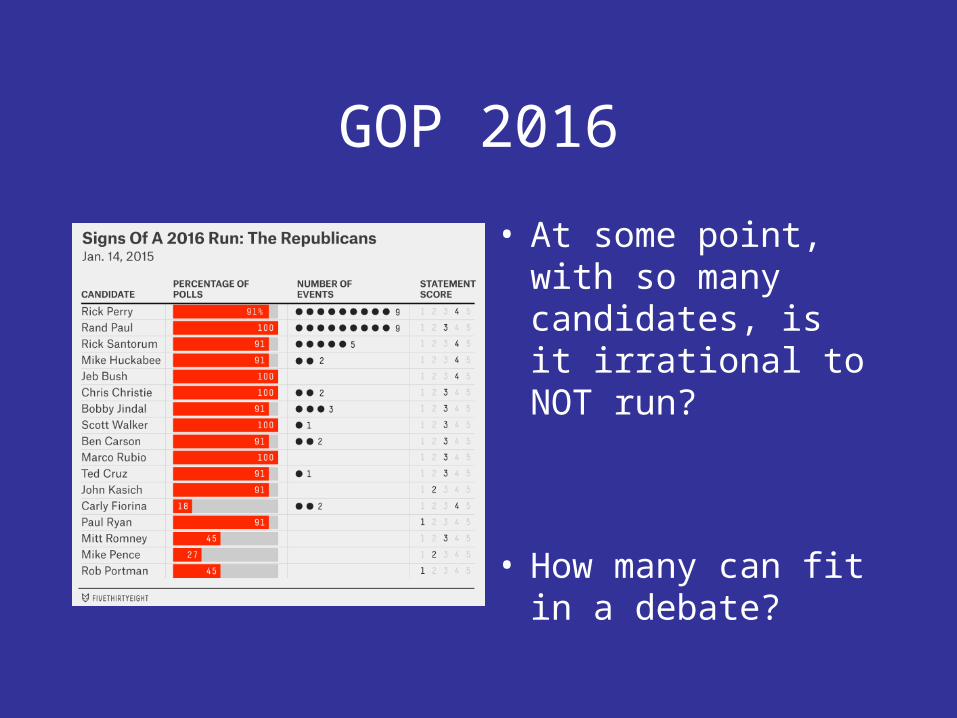
GOP 2016
• At some point, with so many candidates, is it irrational to NOT run?
• How many can fit in a debate?

Dems 2016
• Hillary not in IA, NH.
Yet.
No polls in 1 month

Election of Women
• Why so much variation
– across nations?
– across American states?

Election of Women
• How (much) is Hillary Clinton disadvantaged by gender?

Election of Women
• Major changes– In US Congress
• about 19%• “big” increase post 1990
– In State legislatures• steady gains post 1970• little change in last 10 years• frozen at about 23%

Election of Women


Election of Women
• Candidate recruitment– In US states, increase in # of candidates
tracked w/ increase in # of women elected
– Since 1992, pool of candidates has not increased much

Election of Women

Election of Women
• Major partisan differences– Since 1990, fewer GOP women elected in states
– More Dem women elected• 31% of D state legislators women• 15% of R state legislators women
– Same pattern in US Congress

Election of Women

Election of Women
• Regional variation– Women have made major gains in some
states• New England, WA, West
– Highest = 41% in CO & VT; 36% NM, 33% WA
– Little representation in many states• South
– lowest = 13% in LA, SC

Election of Women

Election of Women

Election of Women

Election of Women
•

Election of Women
• Questions– Why trends, why flattening in US?– Why partisan differences?– Why regional differences?– What effects of representation?

Election of Women
• Are voters biased against women candidates?
– continued sexism?
• How do we measure: ‘would you vote for a woman candidate’?
• Just ask...• List experiments

Would you vote a _____ for president?
• Gallup, 2012• Admitted bias
against– black (4%)– women (5%)– Hispanic (7%)– Mormons (18%)– GLBT (30%)– Muslims (40%)– atheists, (43%)
Social desirability effects?

Would you vote a woman for president?
• Gallup / GSS– 33% yes late 1940’s
– 92% yes “if your
party...” 2005– 86% yes (party not
stated)
– again, social desirability effects
• List experiments (Streb)– gas prices rising– athletes’ salaries– seat belt rules– corporations
polluting– a woman as
president

Would you vote a woman for president?
• Are “Americans” ready to elect a female president?
• Rather than asking “you” ask generically
• Support drops
• 60% yes, 2006

Would you vote a woman for president?
• Surveys: 5% to 10% admit they won’t vote for a woman
• List experiment results ->
• 26% expressed anger about a woman serving as president
• Largest:– South (32%)– 30-50 y/o (36%)– high income (29%)

Voting and Women as Candidates
• Stereotypes: women = honest government
• Gender as a voting cue in low information elections– Women Dem.
candidates do better than men among liberal voters
– worse among conservative voters

Election of Women
•Are there not enough viable women candidates?

Election of Women
• Major factors– Party recruitment
• Is this reason for party difference?• in US, local parties
– lower office route to
• other nations– Party list placement

Election of Women
• Major factors– Campaign finance
• Men and women have different networks
• Different opportunities for raising money– Women fewer opportunities to raise large sums of
money

Election of Women
• Major factors– quotas
• in Constitution
• in Party rules– In Europe, left parties started quotas earlier

Election of Women
• Single member vs. multi-member districts– WA, AZ....
– Voters more likely to vote for woman if also first have chance to vote for a man?
Australian Parliament
Election of Women
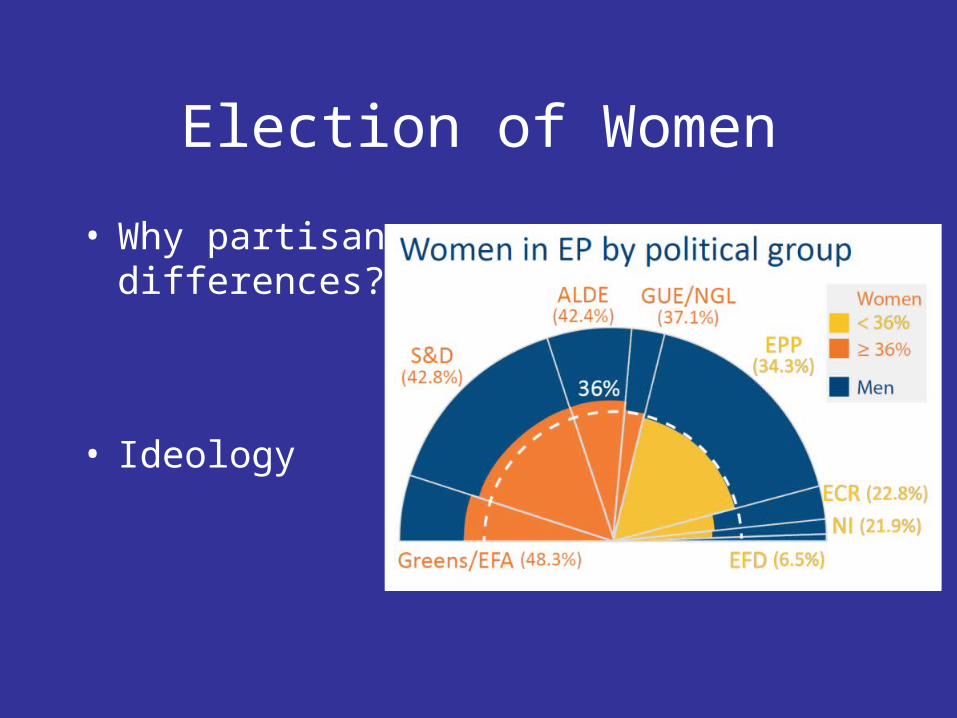
• Why partisan differences?
• Ideology

Election of Women
• Cultural factors?– Scandinavia vs. rest of Europe
• Gender roles different SP, IT than SWE...
– New England vs. US South

Election of Women
• Daniel Elazar’s US Political Culture thesis– Moralistic
• Government advance society, Scandinavians
– Individualistic• politics to advance personal economic goals
– Traditionalistic• hierarchy, authority

Election of Women

Election of Women

Election of Women
• Cultural v. Institutional factors– ‘Traditional’ political cultures =
• fewer women in ‘modern’ careers• fewer women candidates• conservative attitudes about women in
workplace, equality• less recruitment of women candidates

Gender gap: Obama vs. Clinton, Feb 5, 2008
• UT, Clinton +20• CT, Clinton +15• CA, Clinton +14*• MA, Clinton +14*• NY, Clinton +12*• TN, Clinton +11*• AZ, Clinton +10*• NJ, Clinton +10*
• NM, Clinton +9*• AR, Clinton +8*• DE, Clinton +7• GA, Clinton +6• IL, Clinton +6• MO, Clinton +1• AL, tie• OK, Obama +1

Clinton, 2016
• 10% higher turnout for women in presidential elections w/o HRC
• 10,000,000 more women voted in 2004, 2008, 2012 than men
• Women lean Dem in presidential voting since 1992– unmarried women
70% Obama ‘08

Clinton, latest Dem polls
Iowa
• Clinton 57• Bidden 11• Warren 10
New Hampshire• Clinton 56• Warren 15• Sanders 7
National
• Clinton 62• Warren 12• Bidden 10

General election matchups
• Clinton +8 vs. Ryan (not running)
• Clinton +9 vs. J. Bush
• Clinton +10 vs. Christie
• Clinton +11 vs. Rubio (old)
• Clinton +12 vs. Paul
• Clinton +13 vs. Huckabee
• Clinton +15 vs. Cruz

General Election Polls ‘16
• Clinton 56% Huckabee 39%
• Clinton 52% Cruz 36%
• Clinton 51% Paul 39%
• Clinton 49% Christie 39%
• Clinton 49% Bush 40%
• Clinton 49% Rubio 37% June ’14
• Clinton 51% Romney 45% (Nov ’12)