Embed Size (px)
Citation preview

Hemingway Manual p. 1
Copyright © 2011 Michael J. Karcher, Ed.D., Ph.D. [email protected]
THE HEMINGWAY©:
MEASURE OF ADOLESCENT CONNECTEDNESS
(Adolescent Version 5.5
and Child "Pre-Adolescent" Version 5)
May 2000
A Manual for Scoring and Interpretation
Michael Justin Karcher, Ed.D., Ph.D.
College of Education and Human Development
The University of Texas San Antonio
501 West Durango Blvd., Office 4.338
San Antonio, Texas 78207 www.adolescentconnectedness.com [email protected] 210-458-2671
Future
oriented
Present
oriented
Last updated 10/31/11

Hemingway Manual p. 2
Copyright © 2011 Michael J. Karcher, Ed.D., Ph.D. [email protected]
TABLE OF CONTENTS I. SECTION I ORGANIZATION OF THIS MANUAL P. 4 INTRODUCTION TO CONNECTEDNESS THEORY P. 5 THE HEMINGWAY'S ORIGINS P. 5 SCALE DEVELOPMENT P. 6 FOCUS GROUPS WITH YOUTH RESULTING SCALES HYPOTHESIZED WAYS OF CONNECTING: COGNITION, CONDUCT, CARING CONNECTEDNESS CORRELATES AND STRENGTHS OF THE HEMINGWAY P. 8 TERMS OF CONDITION FOR USE OF THE HEMINGWAY p. 9-10 FOR EVALUATION FOR PROFIT (AND SCANNING SERVICES) II. WORLDS OF CONNECTION: FAMILY, FRIENDS, SCHOOL, PEERS AND SELF P. 11 III. SUBSCALES FOR WORLDS OF ADOLESCENT CONNECTEDNESS P. 12 SUBSCALE DESCRIPTIONS A LISTING OF ITEMS IN EACH SUBSCALE (SCORING GUIDELINES FOR VERSION 5 OF THE ADOLESCENT MEASURE) P. 15 V. ALTERNATIVE WAYS OF SCORING ASSESSMENTS OF CONNECTEDNESS P. 18 GENERAL 15 SUBSCALES CONCEPTUAL GROUPINGS (NOT FACTOR ANALYTICAL GROUPINGS) VI. UNDERSTANDING THE STRUCTURE OF ADOLESCENT CONNECTEDNESS P. 20 TOWARD A DEFINITION OF ADOLESCENT CONNECTEDNESS P. 20
ATTACHMENT THEORY: AS AFFECTIONAL BONDS IN ACTIVITY CONTEXTS. P. 21 PROBLEM-BEHAVIOR THEORY: CONVENTIONAL OR UNCONVENTIONAL P. 22 COMBINED FIGURE: FIT INDICES FOR TWO AND THREE FACTOR MODELS P. 24
MEANS (AND GENDER AND ETHNIC GROUP DIFFERENCES) P. 25 VII. RELIABILITY ESTIMATES FOR SUBSCALES (FOR GROUPS AND METHODS) P. 29 RELIABILITY ESTIMATES FOR SCALES IN LONG FORM P. 30 VIII. VALIDITY EVIDENCE (KARCHER, 2003 STUDY) EVIDENCE OF CONVERGENT AND DISCRIMINANT VALIDITY P. 37 DEVELOPMENTAL DIFFERENCES P. 38 ESTIMATES FOR EFFECTS OF SEX AND DELINQUENCY ON CONNECTEDNESS P. 40 IX THE HYPOTHESIZED ROLE OF SOCIAL COGNITION IN CONNECTEDNESS P. 43 X. REFERENCES P. 44 XI. SCORING THE HEMINGWAY MEASURE OF ADOLESCENT CONNECTEDNESS P. 47

Hemingway Manual p. 3
Copyright © 2011 Michael J. Karcher, Ed.D., Ph.D. [email protected]
ADOLESCENT VERSION 5.5 P. 48 SPSS SYNTAX FOR SCORING ADOLESCENT VERSION P. 51 REVERSE CODING RELIABILITY SUBSCALE COMPUTATION PRE AND POST-TEST XII. CHILD/PRE-ADOLESCENT VERSION 5 P. 60 RELIABILITY EVIDENCE P. 64 SPSS SYNTAX FOR SCORING CHILD VERSION P. 65 XIII. DESCRIPTIONS OF SCORING APPROACHES & EVIDENCE OF INVARIANCE P. 69 XIV. XIV. PARENT AND TEACHER REPORT FORMS AND INFORMATION P. 77 XV. TEACHING CONNECTEDNESS DIMENSIONS--CHARTING CONNECTEDNESS P. 86 XVI. FORMS P. 88 SCANTRON FORMS FOR ADOLESCENT VERSION (LONG AND SHORT FORMS) (AVAILABLE FOR PURCHASE AND RAPID SCORING) ENGLISH (LONG SHORT FORMS) SPANISH (US AND CHILEAN) CHINESE FRENCH LITHUANIAN COLLEGE (LATE ADOLESCENT VERSION) XVII. PUBLISHED PAPERS DESCRIBING ENGLISH, CHINESE, AND SPANISH VERSIONS AND
FACTORIAL VALIDITY EVIDENCE FOR EACH Karcher, M. J., & Sass, D. (2010). A multicultural assessment of adolescent connectedness: Testing
measurement invariance across gender and ethnicity. Journal of Counseling Psychology, 57(3), 274-289. doi: 10.1037/a0019357
McWhirter, B. T., & McWhirter, E. H. (2011). Connectedness among Chilean adolescents: Factor analysis of the Hemingway Measure of Adolescent Connectedness. PSYKHE, 20(1), 45-62.
Karcher, M. J., & Lee, Y. (2002). Connectedness among Taiwanese Middle School Students: A Validation Study of the Hemingway Measure of Adolescent Connectedness. [080 s; 143 Reports: Research]. Asia Pacific Education Review, 3(1), 92-114.
Karcher, M. J., Holcomb, M., & Zambrano, E. (2008). Measuring adolescent connectedness: A guide for school-based assessment and program evaluation. In H. L. K. Coleman & C. Yeh (Eds.), Handbook of school counseling (pp. 649-669). Mahwah: Lawrence Erlbaum. (These are the uncorrected proofs--pardon errors and typos, but this is a much smaller file than the final scanned version I have).
Hemingway Manual p. 4
Copyright © 2011 Michael J. Karcher, Ed.D., Ph.D. [email protected]
SECTION I. INTRODUCTION TO CONNECTEDNESS THEORY, THE HEMINGWAY'S ORIGIN, AND
SCALE DEVELOPMENT & THE BENEFITS OF STUDYING CONNECTEDNESS
ORGANIZATION OF THIS MANUAL This manual provides information on a measure of adolescent connectedness. The 78 item Measure of Adolescent Connectedness, version 5.5 full, has fifteen subscales, including connectedness to religion, romantic partners, mother, father, and kids from other cultures. The second version is the 57 item Adolescent, version 5.5 short. The short version does not include those extra fives scales, which some schools have preferred to not include in their surveys (fearing parents would not like to have their children asked about religion, dating, race, or about each parent specifically). Otherwise the two scales are the same. The items in the measure were empirically derived. These scales have undergone a regional norming to establish base rates for youth across grades, sexes, and ethnic groups; the scale means and both latent and observed means differences are reported. In addition, basic information on subscale reliability and validity is presented in this manual. Information from studies describing the development of the scale and the factor structure of previous versions of the scale have been incorporated into this manual as well (see Karcher 2003; Karcher & Sass, 2010).
The manual introduces the theory of adolescent connectedness, which reflects the integration of three very useful concepts for understanding adolescent development and delinquency. The theories from which these concepts are taken are introduced in the first part of this manual, and a series of studies leading up to the current versions are presented. In the second part of the manual, the scales are reviewed and each item is assigned to its respective subscale. Descriptions of each subscale, its reliability in previous studies, and its interpretation precede the presentation of the two measures.
In addition, and in contrast with prior versions of this manual, included now are several translations (Spanish, North and South American; Chinese; French, and Lithuanian), the child and college versions, and parent and teacher report versions. Less psychometric info is provided on these alternative forms, age groups, and reporters, but the scales and scoring information are present.
Also useful may be the SPSS syntax which is provided to ease the use of the scale. The measure is conceptually based on self psychology. Kohut (1977; 1978) argues that two
specific experiences are needed throughout life for self-development. The first is the experience of empathy, praise, and attention within dyadic relationships. Adolescents, like infants, need and seek out these experiences to validate their developing sense of self. The second experience is the experience of being in a relationship with someone whom the individual sees as competent, protecting, and consistent. When sufficient praise, empathy, and attention are provided consistently by significant others, youth learn to praise, esteem, and soothe themselves--the hallmark of self-development and mature forms of connectedness. Therefore, the scales are primarily relational and contextual.
Yet, the Hemingway scales were developed to be used as tools to estimate the effects of interventions, specifically those designed to promote social development and to lessen problem behaviors. As a result, some of the subscales include dimensions (e.g., reading) not described explicitly in the literature upon which the theory is built (e.g., Baumeister & Leary, 1995; Hirschi, 1969; Jessor, 1984, 1993; Kohut, 1977), but which have proven to be of interest to parents, teachers, and administrators who develop such programs. This is because the measures were developed to aid in the study of the consequences of disconnection (e.g., substance use, violence, and depression; see Hawkins, Catalano, & Miller, 1992; Karcher, 2002b, 2003; Karcher & Jensen, 2002), as well as of the activities and attitudes that inform positive social development and reflect strengths in individuals and in communities (Bonny et al., 2000; Clark & Ladd, 2000; Grotevant & Cooper, 1998; Lynch & Cicchetti, 1998; Karcher & Stone, 2002).
Hemingway Manual p. 5
Copyright © 2011 Michael J. Karcher, Ed.D., Ph.D. [email protected]
INTRODUCTION TO CONNECTEDNESS THEORY Adolescent connectedness theory explains adolescents' need for belongingness and relatedness. The theory was built initially upon an interpretive-hermeneutic framework, and was structured according to developmental principles, ecological structures, and prevention research. It draws from Nakkula and Selman's (1991) hermeneutical idea that "human being" is best understood as reflecting youths' interpretations of connectedness to the world over time. Their interpretive framework suggests that researchers and prevention program developers should attend to adolescent worlds and how experiences in these worlds are shaped by time—the past, present, and future. Thus, a time orientation—namely present and future—is reflected in the measure's subscales. Conceptually the model extends Baumeister & Leary’s (1996) belongingness hypothesis from adults to adolescents. The Hemingway is structured by Jessor’s (1984; 1992) distinction between conventional and unconventional worlds in the ecology of adolescents. Therefore, the measure can be viewed as assessing present versus future orientation, connectedness to conventional worlds (family, religion, school) and unconventional worlds (peers, neighborhood, self) in two forms of connectedness—action and caring. The measure assesses how these important ecological worlds are experienced by youth. While these basic mechanisms of connectedness are drawn from abstract self psychology, dynamic psychology, and developmental psychology literatures, the goal for this measure was the fairly pragmatic and concrete explanation of behavior in terms of adolescents’ ability to satisfy their need to belong through their multiple opportunities for connectedness with people and places.
THE ORIGINS OF "THE HEMINGWAY" In 1994 Brad Powell and Father Patrick Gahan, at Saint Stephen's Episcopal School in Austin, Texas, asked the measure's creator, Michael Karcher, to develop an instrument that could help them assess changes resulting from a mentoring program they were developing in their school. As a result of their encouragement, a six year project of measurement development began. The measure's items were derived from two literatures, one describing antecedents of academic achievement and the other one reviewing risk-taking and problem behaviors. The main concept of connectedness was derived from a 1991 paper by Michael Nakkula and Robert Selman, both of whom were Karcher's academic mentors at Harvard. Nakkula's notion of youth development suggests that programs serve to promote the youth's "interpretation of his or her connectedness to the world over time." This suggestion served as the basis of the Hemingway and guided the development of adolescent connectedness theory (Karcher, 2000b).
The name, Hemingway, also has its origin in the biography of Michael Nakkula. The first son of a blue collar family in the upper peninsula of Michigan, Michael Nakkula was the first person in his family to go to college. Nakkula's subsequent attainment of a professorship at Harvard led Karcher to ask him how he understood his academic achievements. Nakkula explained his connectedness to academe through a story about a high school teacher, who, after reading a paper Nakkula wrote for a class assignment, told Nakkula that he wrote like Hemingway. This interpretation of Nakkula's potential, in addition to Nakkula's family support, intellectual strengths, and ability to develop meaningful connections with others, seemed to explain his achievement very well. In honor of that high school teacher's impact, this measure of adolescent connectedness was named the Hemingway.
Hemingway Manual p. 6
Copyright © 2011 Michael J. Karcher, Ed.D., Ph.D. [email protected]
Scale development The scale was developed systematically using grounded theory approaches, item response theory, and factor analytic studies. This section of the manual overviews this process. Briefly, the measurement development began with focus groups of two kinds: first with youth in schools and second with graduate students familiarized with the concept of connectedness. Then versions one and two were developed, each of which attempted to tap into connectedness with appropriate language and in ways consistent with the goal of serving as an assessment of intervention effectiveness. Once this goal was achieved, (see Karcher, Davis, and Powell, 2002) two more developments occurred, leading to the third version of the measure: 1) the theoretical lens was broadened to include the work of Hirschi (1969)(on ecological attachment), Jessor (1984)(on the conventionality of adolescent worlds), and Baumeister and Leary (1996)(on relatedness and the need to belong); and 2) a factor analysis confirmed the underlying structure of the phenomenon. It became clear that connectedness through “knowing” (which is, by the way, the most common form of prevention intervention—knowledge-based curriculum) did hold together with the questions tapping into action and caring. These theoretical models further honed the focus of the measure and allowed previously unsuccessful or poor scales to be re-developed. These steps towards version four are described more fully in the section below (also see Karcher, 2003). FOCUS GROUPS WITH YOUTH: The scale initially was developed in response to the psychological literature on risk taking, but also took into account direct input from high school youth who described what made them feel connected. Two focus groups, with 12 adolescents each, were convened at two points in time to review items after they had been generated from the literature on antecedents of problem behaviors and academic achievement.
A set of items reflecting worlds of connectedness were developed for the measure based on research about adolescent risk taking and achievement motivation which identified the worlds of family, school, friends, reading, religion, and self (identity, self-esteem, and temperament/coping ability). Ecological theory (Bronfenbrenner, 1979) and achievement research (Miller, 1995) identified both neighborhood/community and ethnicity/culture as important worlds of connection. Hermeneutic theory revealed the importance of a future world by providing the originating framework of "connectedness to the world over time" (Gadamer 1975; 1993). These 15 worlds were presented to the two focus groups of youth, who differentiated three more worlds: teachers, peers and siblings. Items referring to “kids” were broken into friends and peers. Family items were broken into parents and siblings. Additional items for connectedness to teachers were developed and written to parallel the affective quality of connectedness to parents. Although one third of the students in both focus groups contested the importance of religion, culture, and neighborhood/community, more than half were adamant that these were important constructs. A group of several adolescents (drawn from the two prior focus groups) convened to help fit the wording to match the theory- and research-based definitions of connectedness.
Resulting items were subjected to content analysis and a construct validity study by graduate students at Harvard University led by John Harris and Michael Nakkula. Two groups of graduate students took Nakkula and Selman's original model, with which they were familiar, and tried to link items to subscales. They then discussed the likely interpretations of different items by youth of different age and ethnic groups, and provided this feedback, which led to an expanded version two that was subsequently explored using item response theory methods and factor analytic techniques.

Hemingway Manual p. 7
Copyright © 2011 Michael J. Karcher, Ed.D., Ph.D. [email protected]
RESULTING SCALES: In the end, 15 subscales were developed that fell into three dimensions of connectedness: self, others, and society. Connectedness to self includes three scales: (1) positive feelings about the self (self-esteem DuBois, 1993; Harter, 1999) and a consistent sense of self over time and across relationships (Erikson, 1967); (2) the ability to be alone and to tolerate rejection and criticism (Kohut and Elson, 1987); and (3) a sense of self-in-the-future (Nakkula and Selman 1991). Connectedness to others included five scales: (4) parents; (5) friends; (6) teachers; (7) siblings; and (8) peers. (The peer scale was not developed satisfactorily until version 5). Connectedness to society includes scales: (9) school; (10) neighborhood/community; (11) culturally different others; (12) reading (also a part of the self world); and (13) religion. HYPOTHESIZED WAYS OF CONNECTING: COGNITION, CONDUCT, CARING For each of the 15 subscales, items representing knowledge, conduct, and caring for the construct were developed. Developmental theory was used to develop all items, especially the knowledge items. For example, where cognitive-developmental research explained a construct, items were worded to reflect greater cognitive maturity. The item “Good friends always agree” reflected a connectedness to friends through knowledge about friends, and was an item based on the cognitive-developmental literature indicating that kids who think more maturely about friendship know that one part of friendship is being able to weather disagreements. Conduct and caring items written for each of the 15 constructs were straightforward and accepted by adolescents in the focus groups with little debate. They directly reflected the underlying constructs of "belongingness theory" (Baumeister & Leary, 1996). Conduct has to do with the frequency of action or activity in a world. For example, “For fun, I read a book or magazine on my own at least once a week.” and “I attend a religious service (like church) at least once a month.” Caring items reflect the degree of importance of each of the 15 constructs. Examples include “I love to read.” and “My religion is very important to me.” Caring for others items reflect enjoyment of being with others, and self items reflect positive attitudes and valuation of the self, or self-esteem (“I really like who I am”). The present Hemingway scales were developed out of three separate scale development factor analytic studies—versions 1 through 3. Neither the connectedness through cognition dimension nor the peers subscale could be satisfactorily developed. Connectedness to peers items did not hold together across ethnic groups. Therefore, it is not included in the present version. The items reflecting connectedness through cognition—the knowledge or cognitive developmental component of the model—were not reliable across subscales. In the first two factor analytic studies, the conduct (or action) and the caring subscales in each world clustered together consistently, and came to represent the majority of all subscales but the two "self" subscales. Thus it was decided to exclude the cognitive-developmental component in the measurement's development as the third "way" of connecting (in addition to through caring and action). In the end, 15 world scales were developed. They included mostly questions asking about the degree of activity (conduct) and the positive feelings (caring) toward each world. Some scales were divided into two subscales, such as family (parents and siblings) and self (present and future) which include a present and a future dimension of connectedness.

Hemingway Manual p. 8
Copyright © 2011 Michael J. Karcher, Ed.D., Ph.D. [email protected]
CONNECTEDNESS CORRELATES AND STRENGTHS OF THE HEMINGWAY To date, three studies have used the Hemingway to examine the relationships between connectedness and several important psychological constructs among adolescents. Connectedness subscales have been found to correlate with self-esteem, resiliency, protective factors, social interest, and school attitude. Other studies of disconnection have found it to correlate positively with depression, violence, substance use, academic underachievement, risk-factors, and social skills deficits. Thus, the Hemingway offers the promise of helping professionals work with kids in schools by capturing important correlates of adolescent achievement and risk-taking. The following list presents a few of the measure's unique characteristics and strengths.
• Connectedness versus resiliency: Resiliency is often characterized as either an internal quality (e.g., temperament, sense of humor, independence, genetic influence) or macrosystemic position (e.g., experiencing poverty, stressors at home). Connectedness reflects actions, which can be increased or decreased through intervention and attitudes which can be shaped or developed through intervention. Thus, connectedness may be more amenable to intervention than is resiliency, and it's predictors and consequences are thoroughly studied in the literature on adolescent risk-taking and social development.
• There are many determinants or predictors of academic achievement and of problem behaviors. These include self-development (e.g., self-control/reaction to anger; self-esteem), interpersonal relationships and attachments, and opportunities in and attitudes towards institutions in society. The most successful interventions address an ecologically broad set of targets, many of which are measurable aspects of connectedness that can be assessed with the HEMINGWAY.
• Time is limited and kids resist completing multiple measurements. The HEMINGWAY provides one assessment of many important areas of intervention, and serves as a good measure for assessing a prevention program's effectiveness in affecting connectedness.
• Adolescent connectedness is theory-driven but also is appealing because it focuses on strengths. Using domains of connectedness as targets of intervention makes sense to both parents and youth alike. It provides a non-pathologizing measure of variables that are important predictors of success. The concept usually is well received by the public (e.g., in evaluation reports) as well as by public and private funding agencies. Scales can identify opportunities for engagement.
• The measure was developed with ethnically and economically diverse samples of youth. Items not representative of connectedness across diverse groups were abandoned.
• The measure provides 3 different ways to interpret connectedness (described later in the manual) which allows great flexibility in the use of the measure and data.
• The HEMINGWAY is ecologically sensitive and reduces the risk of reporting findings that locate problems solely in the child. It is easy for children to understand and is non-reactive. The more reactive scales (race and religion in the adolescent version) are optional and are placed in the last section (items 58-78) so they can easily be eliminated.
• The HEMINGWAY is easy to administer, analyze, and interpret. It is free of charge.
I DO ASK THAT USERS OF THE HEMINGWAY REPORT FINDINGS TO ME & CONSIDER SHARING THEIR DATA TO HELP ME FURTHER DEVELOP AND VALIDATE THE SCALE.
THE TERMS OF USE ARE ON THE NEXT PAGE

Hemingway Manual p. 9
Copyright © 2011 Michael J. Karcher, Ed.D., Ph.D. [email protected]
TERMS OF CONDITION FOR USE OF THE HEMINGWAY: MEASURE OF ADOLESCENT CONNECTEDNESS
MEASURE OR SUBSCALES Thank you for your interest in the Hemingway: Measure of Adolescent Connectedness (pre-adolescent, adolescent, and college versions). You have my permission to use the subscales, under the conditions described below. In most cases there is no cost to use the subscales. I ask that you reply in an email to acknowledge your agreement with these conditions. However, I ask that the following terms be abided:
(a) use only for stated research purposes (e.g., not for fee-based assessments or diagnostic uses, such as private pay mental health treatment or for-profit evaluation services*);
(b) do not distribute to others outside of your research team without first securing my permission;
(c) do not make financial profit from its use* (e.g., similar to “(a)” above, the scale may be used freely for research and grant-funded evaluations or projects only);
(d) allow me to view (not to “approve” or to censure) any manuscript before it is submitted for publication so that I may gauge (and potentially provide comments on) the nature in which the subscale were used;
(e) notify me of any publications or reports related to its use; (f) use only complete subscales (e.g., don’t pull items from subscales for use in other ad
hoc scales created by the research/scale-user; don’t use subsets of items from a given subscale. One exception, for cross-cultural comparisons of elementary aged youth, the negatively worded items maybe be omitted from the scale, although these should remain in the items provided in the survey to decrease response bias);
(g) provide me with access to the connectedness subscale data that is collected, along with basic demographic information (age, sex, race/ethnicity, clinical diagnosis), but blinded to exclude identifying information about the individuals who completed the measures, and also share other measures that could prove useful in tests of discriminant or convergent validity);
(h) allow Michael Karcher to utilize the data provided (under g above) for possible secondary data analysis, for scale norming, for tests of construct validity, and possibly for publication.
Please let me know if these terms are acceptable via email at [email protected]
More information on for profit use, or the need for scanning services follows:

Hemingway Manual p. 10
Copyright © 2011 Michael J. Karcher, Ed.D., Ph.D. [email protected]
For profit/diagnostic/individual report use, or for scanning services * For those who wish to use the scale in the private sector or in a for-profit venture
(e.g., for clinical diagnosis in private treatment or for an evaluation in which one or more Hemingway subscale is used once or regularly as part of an evaluation for which the scale user is compensated directly), a nominal fee will be required (to avoid breaking copyright law). Typically a fee of $.95 per individual use of 3 or more subscales at a time and $.75 for 2 or fewer subscales per use will be requested each time the survey is administered. A discounted rate for large samples or surveys used more than 200 times (e.g., used once with 200 individuals), the fees are $.85 for use of 3 or more scales and $.70 for use of two or fewer scales. Payment may be made to a paypal account with the identifying address of [email protected]. These funds will be used to offset time I provide groups or individuals pro-bono to help them score, interpret, or analyze their Hemingway data. Minimum order $450.
For those who plan regular use of the scale, quarterly payments are appropriate.
Simply communicate to me in writing (e.g., via email) your plans and purposes. Scantron forms also are available for .30 each. For $1.25 one will receive the sheet and
scanning of the form into a dbf file. Please contact me at the address below if you would like to order forms or scanning services. The scantron forms are available in short (57 item, 10-subscales) or long (78 items, 15 subscales) and are available in Spanish and English. Minimum order $450.
Translated copies of the form also may be retrieved from
www.adolescentconnectedness.com . Currently we have versions in Korean, Chinese, French, North-American Spanish, South-American Spanish (Chile), and Lithuanian.
Please let me know if these terms are acceptable via email at
Hemingway Manual p. 11
Copyright © 2011 Michael J. Karcher, Ed.D., Ph.D. [email protected]
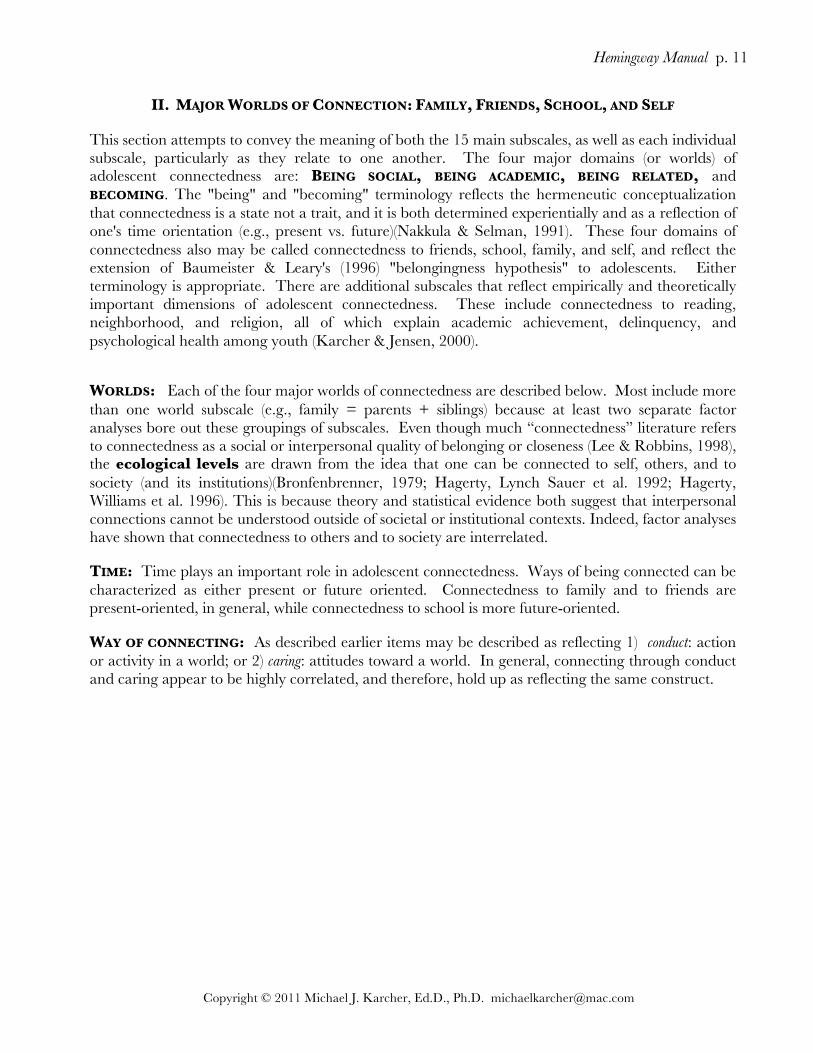
II. MAJOR WORLDS OF CONNECTION: FAMILY, FRIENDS, SCHOOL, AND SELF
This section attempts to convey the meaning of both the 15 main subscales, as well as each individual subscale, particularly as they relate to one another. The four major domains (or worlds) of adolescent connectedness are: BEING SOCIAL, BEING ACADEMIC, BEING RELATED, and
BECOMING. The "being" and "becoming" terminology reflects the hermeneutic conceptualization that connectedness is a state not a trait, and it is both determined experientially and as a reflection of one's time orientation (e.g., present vs. future)(Nakkula & Selman, 1991). These four domains of connectedness also may be called connectedness to friends, school, family, and self, and reflect the extension of Baumeister & Leary's (1996) "belongingness hypothesis" to adolescents. Either terminology is appropriate. There are additional subscales that reflect empirically and theoretically important dimensions of adolescent connectedness. These include connectedness to reading, neighborhood, and religion, all of which explain academic achievement, delinquency, and psychological health among youth (Karcher & Jensen, 2000).
WORLDS: Each of the four major worlds of connectedness are described below. Most include more than one world subscale (e.g., family = parents + siblings) because at least two separate factor analyses bore out these groupings of subscales. Even though much “connectedness” literature refers to connectedness as a social or interpersonal quality of belonging or closeness (Lee & Robbins, 1998), the ecological levels are drawn from the idea that one can be connected to self, others, and to society (and its institutions)(Bronfenbrenner, 1979; Hagerty, Lynch Sauer et al. 1992; Hagerty, Williams et al. 1996). This is because theory and statistical evidence both suggest that interpersonal connections cannot be understood outside of societal or institutional contexts. Indeed, factor analyses have shown that connectedness to others and to society are interrelated.
TIME: Time plays an important role in adolescent connectedness. Ways of being connected can be characterized as either present or future oriented. Connectedness to family and to friends are present-oriented, in general, while connectedness to school is more future-oriented.
WAY OF CONNECTING: As described earlier items may be described as reflecting 1) conduct: action or activity in a world; or 2) caring: attitudes toward a world. In general, connecting through conduct and caring appear to be highly correlated, and therefore, hold up as reflecting the same construct.

Hemingway Manual p. 12
Copyright © 2011 Michael J. Karcher, Ed.D., Ph.D. [email protected]
SECTION III: THE SUBSCALES FOR WORLDS OF ADOLESCENT CONNECTEDNESS
Hemingway’s 15 Ecological Subscales
Neighborhood (6 items) This connectedness need not be unconventional and related to risk-taking behaviors, but it usually is, especially among older adolescents. It focuses on the time youths’ spend in their neighborhood, the quality of their relationships with other kids in their neighborhood, and the degree to which they find their neighborhoods a comfortable, supportive, interesting place to be. Friends (6 items) This scale correlates with unconventional, sometimes risk-taking behaviors. When this scale score is high, and the conventional subscales of connectedness to family and school are low, the youth is at risk for underachievement, engaging in problem behaviors, and other forms of risky behaviors. The scale asks about how much time youth spend with their friends, how much they trust their friends, and how actively they communicate with friends about personal issues. Self-in-the-present (6 items) (SELF-ESTEEM; IDENTITY): This self-esteem component is not fettered by any one institution or any vision of the future. It is based on experiences in current relationships, a sense of continuity in their behavior across people and places, and an self-awareness of skills, talents, and unique interests that make them interesting and liked by others. This is a positive scale, suggesting that youth are benefiting emotionally from their close relationships and feel good about themselves. However, high scores on this scale, when coupled with low connection scores on becoming, being academic or being related, may suggest that the youth is getting most of his or her self-development and belongingness needs through friends, which can predict risk-taking and underachievement. Parents (6 items) This scale taps the dimensions of involvement in and caring for their families. Questions measure the amount of time youth spend with their parents, how well they get along with their parents, and their degree of caring for their parents. It is not specific to either parents. Siblings (5 items) This scale measures youths' involvement with and caring for their siblings. Time spent with siblings tends to be unconventional in nature, but being housed within the conventional confines of the family, it also relates strongly to the conventional worlds of connectedness to parents, father, mother, and peers. There tends to be modest correlation with connectedness to friends and neighborhood as well due to the unconventional qualities of playful engagement of siblings in the neighborhood. School (6 items) This scale asks about how hard youth work at school, how much they enjoy school, and how successful they feel at school. It focuses on the importance youth place in school (i.e., how much they care for school) and the degree to which youth become actively involved in being successful in school.
Hemingway Manual p. 13
Copyright © 2011 Michael J. Karcher, Ed.D., Ph.D. [email protected]
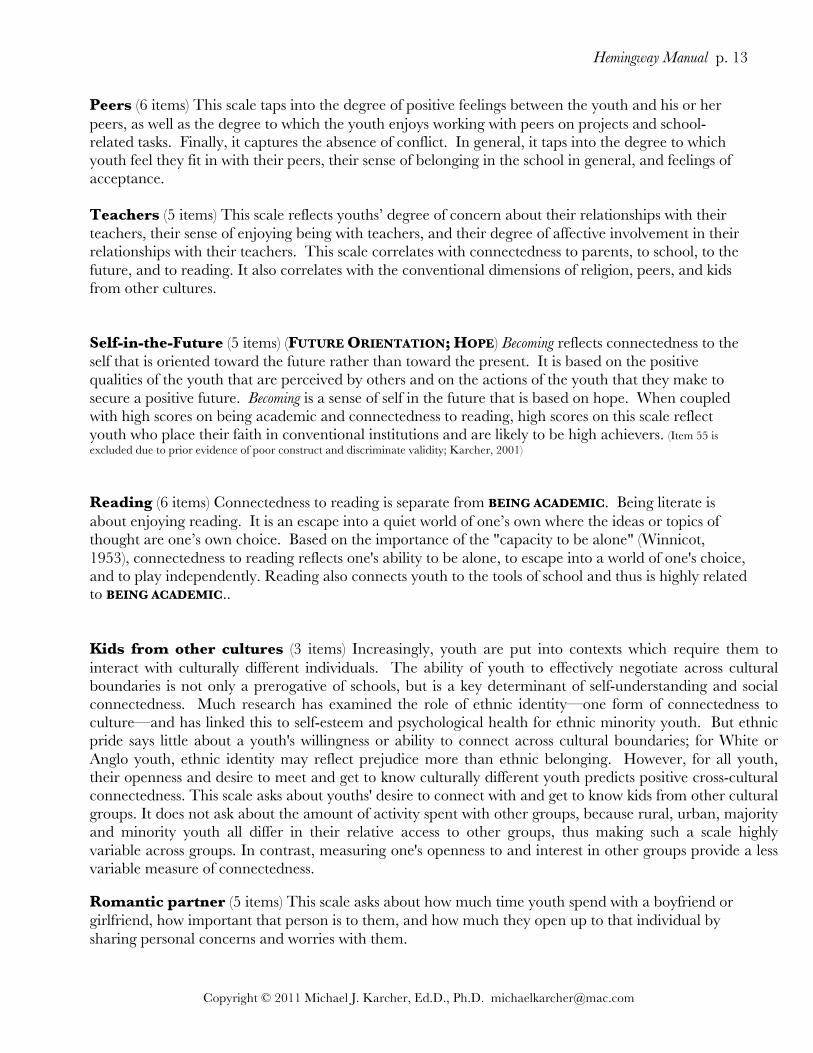
Peers (6 items) This scale taps into the degree of positive feelings between the youth and his or her peers, as well as the degree to which the youth enjoys working with peers on projects and school-related tasks. Finally, it captures the absence of conflict. In general, it taps into the degree to which youth feel they fit in with their peers, their sense of belonging in the school in general, and feelings of acceptance. Teachers (5 items) This scale reflects youths’ degree of concern about their relationships with their teachers, their sense of enjoying being with teachers, and their degree of affective involvement in their relationships with their teachers. This scale correlates with connectedness to parents, to school, to the future, and to reading. It also correlates with the conventional dimensions of religion, peers, and kids from other cultures. Self-in-the-Future (5 items) (FUTURE ORIENTATION; HOPE) Becoming reflects connectedness to the self that is oriented toward the future rather than toward the present. It is based on the positive qualities of the youth that are perceived by others and on the actions of the youth that they make to secure a positive future. Becoming is a sense of self in the future that is based on hope. When coupled with high scores on being academic and connectedness to reading, high scores on this scale reflect youth who place their faith in conventional institutions and are likely to be high achievers. (Item 55 is excluded due to prior evidence of poor construct and discriminate validity; Karcher, 2001)
Reading (6 items) Connectedness to reading is separate from BEING ACADEMIC. Being literate is about enjoying reading. It is an escape into a quiet world of one’s own where the ideas or topics of thought are one’s own choice. Based on the importance of the "capacity to be alone" (Winnicot, 1953), connectedness to reading reflects one's ability to be alone, to escape into a world of one's choice, and to play independently. Reading also connects youth to the tools of school and thus is highly related to BEING ACADEMIC.. Kids from other cultures (3 items) Increasingly, youth are put into contexts which require them to interact with culturally different individuals. The ability of youth to effectively negotiate across cultural boundaries is not only a prerogative of schools, but is a key determinant of self-understanding and social connectedness. Much research has examined the role of ethnic identity—one form of connectedness to culture—and has linked this to self-esteem and psychological health for ethnic minority youth. But ethnic pride says little about a youth's willingness or ability to connect across cultural boundaries; for White or Anglo youth, ethnic identity may reflect prejudice more than ethnic belonging. However, for all youth, their openness and desire to meet and get to know culturally different youth predicts positive cross-cultural connectedness. This scale asks about youths' desire to connect with and get to know kids from other cultural groups. It does not ask about the amount of activity spent with other groups, because rural, urban, majority and minority youth all differ in their relative access to other groups, thus making such a scale highly variable across groups. In contrast, measuring one's openness to and interest in other groups provide a less variable measure of connectedness. Romantic partner (5 items) This scale asks about how much time youth spend with a boyfriend or girlfriend, how important that person is to them, and how much they open up to that individual by sharing personal concerns and worries with them.

Hemingway Manual p. 14
Copyright © 2011 Michael J. Karcher, Ed.D., Ph.D. [email protected]
Religion (3 items) Connectedness to religion reflects faith in an external power, a larger sense of community connection, and an appreciation of conventional worlds. This faith usually accompanies BEING RELATED (i.e., positive experiences in the family), regardless of the family's religiosity. It tends to be low in contexts that do not allow youth religious autonomy—for example, when youth are forced to attend religious services—because being religious is one of the unique situations in which a youth may choose (rather than be provided) a conventional world. Mother (5 items) This scale is different from the connectedness to parents scale in that it is parent specific, and it includes more of the dimensions of parenting that have been found predictive of successful youth development: communication with parents, limited conflict, and closeness. Father (5 items) This scale is different from the connectedness to parents scale in that is parent specific, and it includes more of the dimensions of parenting that have been found predictive of successful youth development: communication with parents, limited conflict, and closeness.

Hemingway Manual p. 15
Copyright © 2011 Michael J. Karcher, Ed.D., Ph.D. [email protected]
IV SPECIFIC ITEMS IN THE 15 WORLDS OF ADOLESCENT CONNECTEDNESS: A LISTING OF ITEMS IN EACH SUBSCALE IN GROUPS THAT REFLECT THE THEORETICAL
CONCEPTS OF TIME, CHOICE/CONVENTIONALITY, AND MODALITY OF EACH WORLD
15 WORLDS CONNECTEDNESS SUBSCALES: These scales are grouped according to present versus future worlds, and as reflecting an unconventional world (that youth choose to engage in) or a conventional world (that youth are provided and must engage in). Neighborhood, Friends, Romantic Partner, and Self-esteem/Identity tend to cluster together and reflect connectedness to chosen, unconventional (youth) worlds in the present. Teachers, School-in-present, Family, Kids from Other Cultures, and Religion reflect conventional worlds in the present. Self-in-the-future, School-in-the-future, and Reading reflect conventional worlds in the future. A balance of items reflecting connection through caring and connection through activity are presented (when supported by factor analyses). Attempts to balance the number of reversed (negatively worded) items were made, but only items with factor loadings of .50 or greater were maintained. Similarly, five items were used in the more reliable scales, while six items were included in scales that were more difficult to assess reliably. Items in bold and italics are those to be reverse scored prior to the assessment of scale means. 2, 7, 13, 18, 26, 30, 34, 45, 51, 55, 64, 70, 71
WORLDS IN THE ADOLESCENT SOCIAL ECOLOGY—MAC VERSION 5.5 UTSA Reverse score items 2, 7, 13, 18, 26, 30, 34, 45, 51, "55," 70, 72, 73
Neighborhood (6 items) (1) I like hanging out around where I live (like my neighborhood). (11) I spend a lot of time with kids around where I live. (21) I get along with the kids in my neighborhood. (31) I often spend time playing or doing things in my neighborhood. (41) I hang out a lot with kids in my neighborhood. (51) My neighborhood is boring. Friends (6 items) (2) Spending time with friends is not so important to me. (12) I have friends I'm really close to and trust completely. (22) Spending time with my friends is a big part of my life. (32) My friends and I talk openly with each other about personal things. (42) I spend as much time as I can with my friends. (52) My friends and I spend a lot of time talking about things. Self-in-the-present (6 items) (3) I can name 5 things that others like about me. (13) There is not much that is unique or special about me. (23) I can name 3 things that other kids like about me. (33) I really like who I am. (43) I have special hobbies, skills, or talents. (53) I have unique interests or skills that make me interesting.

Hemingway Manual p. 16
Copyright © 2011 Michael J. Karcher, Ed.D., Ph.D. [email protected]
Parents (6 items) (4) My family has fun together. (14) It is important that my parents trust me. (24) I enjoy spending time with my parents. (34) My parents and I disagree about many things. (44) My parents and I get along well. (54) I care about my parents very much. Siblings (5 items) (5) I have a lot of fun with my brother(s) or sister(s). (15) I feel close to my brother(s) or sister(s). (25) I enjoy spending time with my brothers/sisters. (35) I try to spend time with my brothers/sisters when I can. (45) I try to avoid being around my brother/sister(s). School (6 items) (6) I work hard at school. (16) I enjoy being at school. (26) I get bored in school a lot. (36) I do well in school. (46) I feel good about myself when I am at school. (56) Doing well in school is important to me. Peers (6 items) (7) My classmates often bother me. (17) I like pretty much all of the other kids in my grade. (27) I like working with my classmates. (37) I get along well with the other students in my classes. (47) I am liked by my classmates. (57) I rarely fight or argue with the other kids at school. Teachers (6 items) (8) I care what my teachers think of me. (18) I do not get along with some of my teachers. (28) I want to be respected by my teachers. (38) I try to get along with my teachers. (48) I always try hard to earn my teachers’ trust. (50) I usually like my teachers. Future (6 items) (9) I will have a good future. (19) Doing well in school will help me in the future. (29) I do things outside of school to prepare for my future. (39) I do lots of things to prepare for my future. (49) I think about my future often. (55) What I do now will not affect my future. (Item 55 is excluded due to poor construct/discriminate validity)

Hemingway Manual p. 17
Copyright © 2011 Michael J. Karcher, Ed.D., Ph.D. [email protected]
Reading (4 items) (10) I enjoy spending time by myself reading. (20) I like to read. (30) I never read books in my free time. (40) I often read when I have free time. Kids from other cultures (3 items) (60) I like getting to know kids from other cultural or racial groups. (65) I would like to know more people from different cultural groups. (69) I like getting to know people who are culturally different from me. Religion (3 items) (62) My religion is very important to me. (71) I attend a religious service (like church) regularly. (75) I am a religious or faithful person. Romantic partner (5 items) (61) I spend a lot of time with a boyfriend/girlfriend. (66) I have a boyfriend/girlfriend who is very important to me. (70) I don’t really care about having a boyfriend/girlfriend. (74) I share my worries and concerns with a boyfriend/girlfriend. (76) I spend as much time as I can with a girlfriend/boyfriend. Mother (5 items) (59) I enjoy spending time with my mother. (63) My mother and I are pretty close. (68) My mother cares a lot about me. (73) My mother and I argue a lot. (77) I talk with my mother about very personal things and my problems. Father (5 items) (58) I enjoy spending time with my father. (64) My father and I are pretty close. (67) My father cares a lot about me. (72) My father and I argue a lot. (78) I talk with my father about very personal things and my problems.
Hemingway Manual p. 18
Copyright © 2011 Michael J. Karcher, Ed.D., Ph.D. [email protected]
V. ALTERNATIVE WAYS OF SCORING ASSESSMENTS OF CONNECTEDNESS
GENERAL 15 SUBSCALES OF ADOLESCENT CONNECTEDNESS
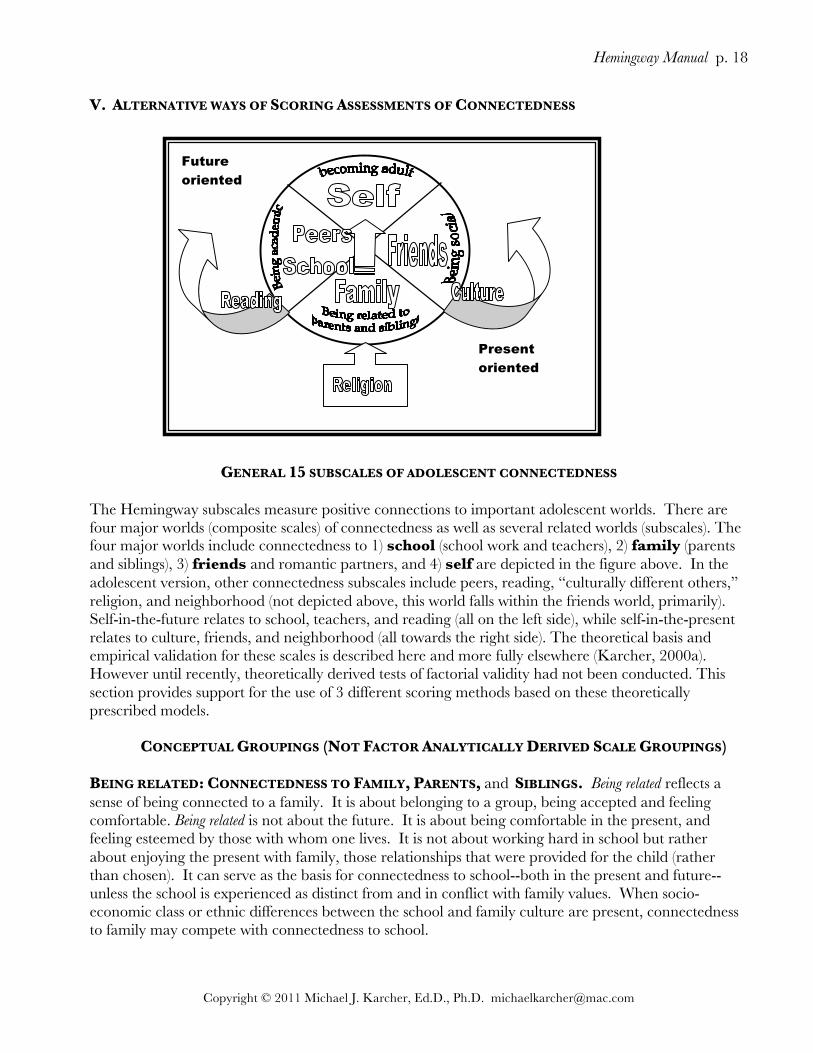
The Hemingway subscales measure positive connections to important adolescent worlds. There are four major worlds (composite scales) of connectedness as well as several related worlds (subscales). The four major worlds include connectedness to 1) school (school work and teachers), 2) family (parents and siblings), 3) friends and romantic partners, and 4) self are depicted in the figure above. In the adolescent version, other connectedness subscales include peers, reading, “culturally different others,” religion, and neighborhood (not depicted above, this world falls within the friends world, primarily). Self-in-the-future relates to school, teachers, and reading (all on the left side), while self-in-the-present relates to culture, friends, and neighborhood (all towards the right side). The theoretical basis and empirical validation for these scales is described here and more fully elsewhere (Karcher, 2000a). However until recently, theoretically derived tests of factorial validity had not been conducted. This section provides support for the use of 3 different scoring methods based on these theoretically prescribed models.
CONCEPTUAL GROUPINGS (NOT FACTOR ANALYTICALLY DERIVED SCALE GROUPINGS)
BEING RELATED: CONNECTEDNESS TO FAMILY, PARENTS, and SIBLINGS. Being related reflects a sense of being connected to a family. It is about belonging to a group, being accepted and feeling comfortable. Being related is not about the future. It is about being comfortable in the present, and feeling esteemed by those with whom one lives. It is not about working hard in school but rather about enjoying the present with family, those relationships that were provided for the child (rather than chosen). It can serve as the basis for connectedness to school--both in the present and future--unless the school is experienced as distinct from and in conflict with family values. When socio-economic class or ethnic differences between the school and family culture are present, connectedness to family may compete with connectedness to school.
Future
oriented
Present
oriented

Hemingway Manual p. 19
Copyright © 2011 Michael J. Karcher, Ed.D., Ph.D. [email protected]
BEING SOCIAL: CONNECTEDNESS TO NEIGHBORHOOD AND FRIENDS. Being social reflects connectedness to friends in their unique space and time. The adolescent’s connectedness to this social world takes place in the neighborhood (usually after school) with friends (as opposed to peers) in the present. When adolescents are being social they are not concerned about the future. They are not thinking about doing what will make their families proud or what is best for them academically. It is a present-oriented playful time with people whom they have chosen (as opposed to the conventional relationships they are provided in other contexts). Being social is positive, because it provides opportunities to feel esteemed, to learn about oneself, and to exercise social skills and interests not always found in to school and family relationships. Therefore, connectedness to friends and neighborhood correlates most highly with connectedness to self (self-esteem and identity). It is not, however, an unquestionably positive dimension. For example, when being social is high and being academic is low, being social usually competes with the conventional worlds of school and family in problematic ways. But the relationship is tricky. Being social is the best predictor of self-esteem among delinquent youth; yet, not being academic is a better predictor of substance use among delinquents than is being social. Interventions should focus on developing connection to future-oriented, conventional worlds like school to offset the degree to which the youth is getting self-development needs (i.e., for praise, empathy, attention, and excitement) in unconventional and risky ways through being social. BEING ACADEMIC: CONNECTEDNESS TO SCHOOL and TEACHERS. Being academic is about being future-oriented, pleasing teachers, and working hard in school to secure one's future. Those who report high levels of being academic see the connection between doing well in school and succeeding in life. They believe that doing well in school will secure their future in the workplace. Adolescents who are connected to school report being connected through hard work and through a sense of reciprocal pay-off: if they work hard in school, the system will take care of them in the future. This group of scales correlates with BEING RELATED and SELF IN THE FUTURE because connectedness to TEACHERS is an extension of a conventional connectedness to PARENTS. BEING SOCIAL: CONNECTEDNESS TO PEERS and CONNECTEDNESS TO OTHER CULTURES. The nature of this group reflects both conventional connectedness through its correlations with connectedness to TEACHERS, SCHOOL, and to PARENTS. But it also is an extension of an unconventional connectedness in that it shares some relationships with connectedness to friends, neighborhood, and siblings. Most likely this relationship to unconventional domains is a function of the degree to which positive peer relationships reflect positive self-esteem. BECOMING ONESELF: CONNECTEDNESS TO SELF-IN-THE-PRESENT and SELF–IN-THE-FUTURE. This group falls neither in the domain of conventional or unconventional. Given that self in the future is clearly conventional, and self in the present tends to be unconventional, this should more directly be seen as a global sense of self for youth across the whole social ecology. If a computed composite factor or scale including both scales is used but is not reliable (i.e., when pooling items from both scales) then the youth within the sample likely feel both conventional and unconventional but just one, and separate self scales should be used in analyses. For example, a highly deviant youth may score high on self-in-the-present but low on self-in-the-future, such that the items in each scale will not be highly correlated.
Hemingway Manual p. 20
Copyright © 2011 Michael J. Karcher, Ed.D., Ph.D. [email protected]
VI. UNDERSTANDING THE STRUCTURE OF ADOLESCENT CONNECTEDNESS
The above descriptions are conceptual, not theoretical and not empirically based. For most research and evaluation purposes, using the separate subscales as described above makes the most sense, and it is on those separate scales that most validity evidence has been garnered. However, in the section that follows, we provide alternative scoring methods. Based on three studies using the Hemingway, a consistent structure of adolescent connectedness has been found which reflects the three main aspects of the theory. Each of these supports alternative subscale descriptions and computations, which are provided below. Actual tests of the underlying factor structure follow, in which tests of ecological (10 subscales), attachment (3-4 factors), and conventionality (2 factors) are presented in the following section, with supporting statistics in the appendix. Toward a Definition of Adolescent Connectedness
The general definition of adolescent connectedness reflected in the Hemingway is of connectedness as the degree of activity and positive affect youth report that they direct toward people, places and things. This definition was developed empirically, rather than theoretically, yet it is consistent with the definition provided by Townsend and McWhirter (2005) above. This definition was identified as the result of an iterative process of scale development that enlisted focus groups of adolescents, followed by a series of exploratory and confirmatory factor analyses, which resulted in the creation of ten separate scales for the Hemingway: Measure of Adolescent Connectedness (Karcher, 2003). Regarding “people,” the Hemingway includes connectedness to parents, siblings, peers, friends, and teachers subscales. Regarding “places,” the Hemingway includes connectedness to school and neighborhood subscales. Regarding “things,” the Hemingway includes connectedness to reading, self-in-the-present, and self-in-the future subscales.
What is not clear, either from the measurement development study (Karcher, 2003) or from
subsequent validation (Karcher & Lee, 2002) and research studies (Karcher, 2002), is whether these subscales should be grouped into higher order factors. In a study with Taiwanese high school students, Karcher and Lee (2002) reported a factor model in which the separate subscales were indicators of three higher order factors (i.e., academic, familial, and social connectedness). With a multiethnic U.S. sample including both adjudicated youth and preparatory school students, Karcher (2003) found that the best fitting model included a subset of the connectedness scales under two higher order factors, one reflecting peer connectedness and one reflecting adult connectedness. Yet, research on adult describes social connectedness as unidimensional (Lee & Robbins, 1998).
Identifying the Best Model: Testing for Construct Multi- and Unidimensionality
Hoyt, Warbasse, and Chu (2006) suggest the lack of adequate theory-based measures in counseling psychology is problematic. That problem is made worse when purportedly multidimensional scales demonstrate no evidence of subscale discriminant validity. Hoyt et al. argue that even theory-based measures may suffer from “construct underrepresentation” when theoretical constructs measured in a multidimensional scale lack sufficient evidence of discriminant validity. They suggest “one should not consider subscale scores as indicators of distinct constructs unless there is evidence of discriminant validity among subscales” (p. 783).

Hemingway Manual p. 21
Copyright © 2011 Michael J. Karcher, Ed.D., Ph.D. [email protected]
Most other measures of adolescent connectedness have yet to be tested empirically to determine if the underlying structure of adolescent connectedness is unidimensional or multidimensional. For the Hemingway, it is unclear whether its ten separate subscales are truly distinct (i.e., evidence of discriminant validity) or whether these ten separate subscales more appropriately should be pooled into one overall connectedness construct (e.g., like Robins and Lee’s adult social connectedness scale). In addition, there are two theories that suggest there are two or four higher order connectedness constructs under which all ten of the Hemingway subscales (short form) should be represented. These are attachment theory and problem-behavior theory.
Attachment theory: Connectedness as affectional bonds in activity contexts. The empirically based definition of adolescent connectedness as affect and action was not derived specifically to conform with attachment theory, but it is consistent with the two main elements of the attachment behavioral system: proximity seeking and experiencing pleasure and security in specific relationships and contexts. The person- and place-specific nature of the Hemingway adolescent connectedness scales also is consistent with the proposition that “attachment tendencies” become more differentiated between childhood and adolescence (Ainsworth, 1989). It is generally assumed that by the elementary school years the family is no longer their only source of reference or “home base.” Middle school aged youth form “affectional bonds” to other places and relationships that take on these functions (Ainsworth, 1989; Allen, & Land, 1999). Attachment theorists and adolescence researchers commonly characterize this differentiation of childhood attachment tendencies into somewhat distinct forms of familial, academic, and social affectional bonds or connections (Ainsworth, 1989; Allen & Land, 1999; Bretherton & Mulholland, 1999; Cooper, 1999). This ecological differentiation is consistent with the fact that Armsden and Greenberg (1987), after years of research on adolescents (Greenberg, Siegel & Leitch, 1983), chose to measure adolescent attachment in specific relationships (mother, father, peers) rather than as one unitary classification.
A view of connectedness as affectional bonds that differentiate into consistent modes of relating
to others in the contexts of home, school, and peer/social worlds provides a theoretical model for testing a higher order structure for adolescent connectedness. This theory suggests the presence of four higher order factors of academic, familial, and social connectedness, along with connectedness to self. Each connectedness subscale serves as an indicator of one of these factors. From this theoretical perspective, the Hemingway’s connectedness to parents and peers scales would load on one higher order family connectedness factor. The connectedness to peers, teachers, and school scales would load on a second higher-order academic connectedness factor. Connectedness to neighborhood and friends scales would load on a third social connectedness higher-order factor.
In addition to these three higher order factors representing interpersonal connectedness, the
Hemingway includes two intrapersonal connectedness-to-self scales that would load onto a fourth higher order factor. These connectedness-to-self scales are quite consistent with Bowlby’s belief that working models of the self are inseparable from working models for others (for discussion of working models of the self, see Bretherton & Munholland, 1999, p. 102-103; Bowlby, 1973, p. 203; Bowlby, 1969/1982, pp. 710-713). Given this proposition, the two connectedness to self-in-the-present and self-in-the-future scales should load on a higher order connectedness to self-factor that represents Bowlby’s working models of the self.

Hemingway Manual p. 22
Copyright © 2011 Michael J. Karcher, Ed.D., Ph.D. [email protected]
Yet, this conceptualization may not prove to be the most useful way to organize the adolescent connectedness constructs for the purpose of developing and evaluating intervention programs. An alternate conceptualization of adolescent employs problem-behavior theory.
Problem-behavior theory: Connectedness as conventional or unconventional behavior.
Because improvements in connectedness often are targets of prevention and counseling efforts,
the use of problem-behavior theory to explain patterns of connectedness also holds promise. Problem-behavior theory (Jessor & Jessor, 1977) draws upon research on factors that contribute to delinquency (Hirschi, 1969). It proposes that there are two primary forms of interpersonal and ecological engagement during adolescence: conventional and unconventional.
“Conventional behavior [e.g., church attendance or working hard in school] is behavior that is socially approved, normatively expected, and codified and institutionalized as appropriate for adolescents and youth” (Jessor & Jessor, 1980, p. 107). Conventional connections, then, are those behaviors that are condoned and governed by adults
and mainstream society. Hemingway scales that reflect conventional connections are the connectedness to parents, school, teachers, and self-in-the-future scales. One study found that most positive youth development programs were designed explicitly to facilitate these forms of conventional connections (Roth & Brooks-Gunn, 1998). This is because conventional connectedness predicts abstinence, prosocial behavior, and other developmental assets (Blum, 2003; Scales, 2005) thereby making their promotion an important intervention goal. Yet the positive effects of adult-driven conventional connectedness may actually derive from the way conventional connectedness limits the influence of youth-driven unconventional connectedness.
Unconventional connections are those emotional and physical engagements that are promoted and structured primarily by youth themselves (Karcher et al., 2008). Jessor and Jessor (1980) suggest that, at their extreme, unconventional behaviors are problem behaviors whose
“function may be to express opposition to conventional society… Its meaning may lie in defining, for self and others, important attributes of personal identity…It can also function to establish solidary [sic] relations with peers, or to enable access to youth subgroups, or to permit identification with the youth subculture” (p. 107).
Given this definition, an unconventional connectedness higher order factor should include the Hemingway connectedness to peers, friends, neighborhood and self-in-the-present scales.
Unconventional connections are not always problematic and are, arguably, necessary from a developmental point of view. Time spent by youth with friends in their neighborhoods does not necessarily lead to misbehavior; however, problem behaviors, risk taking and deviancy do tend to increase when unconventional connectedness is not reigned in by a sufficient degree of conventional connectedness to adult-governed worlds. Disproportionately high levels of unconventional connectedness relative to conventional connectedness have been found to predict higher levels of substance use, violence, dropout and substance issues (Jessor, 1993; Karcher, 2002; Karcher & Finn, 2005). For this reason, Jessor and Jessor (1980) suggest that “a single summarizing dimension underlying the differences between [adolescent drug] users and nonusers might be termed conventionality-unconventionality.”
Hemingway Manual p. 23
Copyright © 2011 Michael J. Karcher, Ed.D., Ph.D. [email protected]
In summary, attachment theory and problem-behavior theory propose different structural
models of adolescent connectedness. Attachment theory supports the idea that internal working models and working models of the self interact with subsequent experiences in specific contexts and result in four distinct factors reflecting familial, academic, and social connectedness, with self connectedness as a separate but related factor (see Figure 2, right side). More parsimonious, however, would be to characterize adolescent connectedness along the conventional-unconventional continuum using two (not four) higher-order factors reflecting conventional and unconventional connectedness (see Figure 2 on the left side).
The result of analyses presented in the appendix suggest all three approaches reflect coherent factor structure, and so their use should be driven my theory or research purposes. However these groupings usually include redundant items from the 15 separate subscales described above. The factors from one scoring methods should not be correlated with factors or scales from another or with the 15 individual subscales, because in most cases these scales will be linearly dependent on one another and will produce artificially high correlations because of shared items. Such a lack of independence would prohibit any interpretation of their relationships. For example, the connectedness to the "family" world consists items from both of the “family” and “school” subscales which also appear in the conventional factor; thus, arguing that connectedness to family best predicts conventional connectedness would reflect a spurious correlation based on a statistical redundancy. Therefore, interpretation these scales should be done carefully. It is best to choose to use either the 15 subscales described earlier, or the other scoring methods, and ensure that scales are carefully intercorrelated and interpreted.

Hemingway Manual p. 24
Copyright © 2011 Michael J. Karcher, Ed.D., Ph.D. [email protected]
COMBINED FIGURE: FIT INDICES FOR TWO AND THREE FACTOR MODELS
Hemingway Manual p. 25
Copyright © 2011 Michael J. Karcher, Ed.D., Ph.D. [email protected]
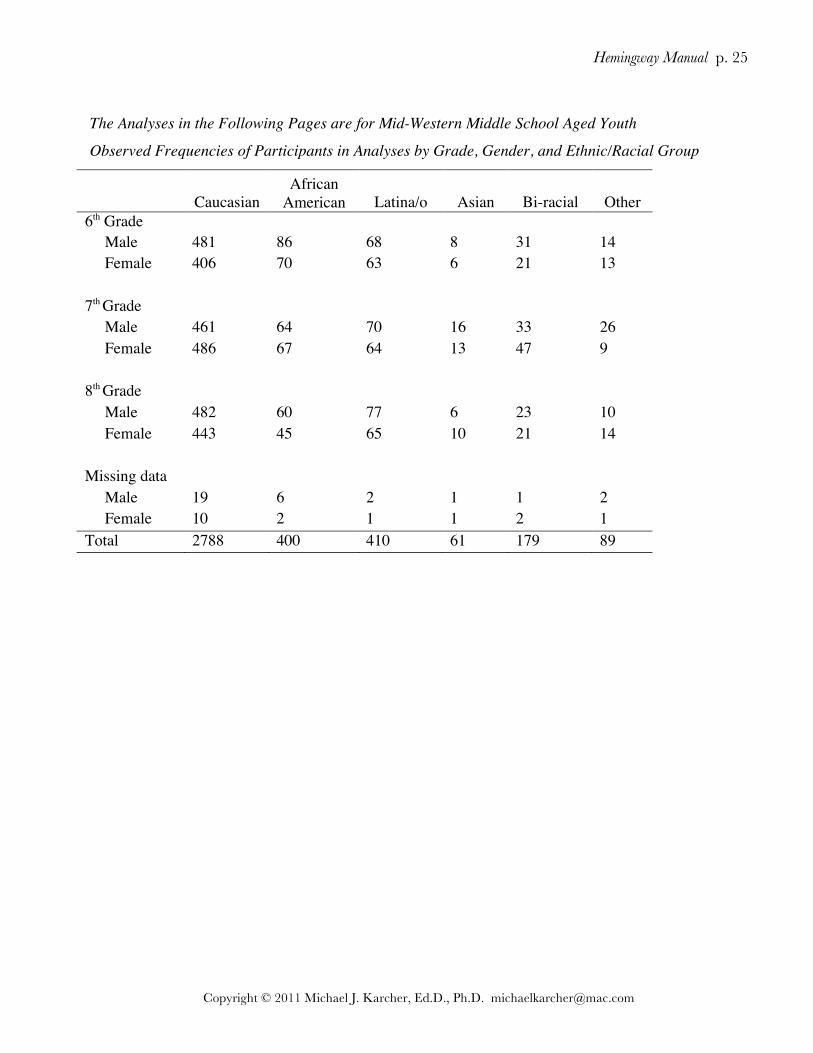
The Analyses in the Following Pages are for Mid-Western Middle School Aged Youth
Observed Frequencies of Participants in Analyses by Grade, Gender, and Ethnic/Racial Group
Caucasian
African American Latina/o Asian Bi-racial Other
6th Grade Male 481 86 68 8 31 14 Female 406 70 63 6 21 13 7th Grade Male 461 64 70 16 33 26 Female 486 67 64 13 47 9 8th Grade Male 482 60 77 6 23 10 Female 443 45 65 10 21 14 Missing data Male 19 6 2 1 1 2 Female 10 2 1 1 2 1 Total
Ethnicity
2788 400 410 61 179 89

Hemingway Manual p. 26
Copyright © 2011 Michael J. Karcher, Ed.D., Ph.D. [email protected]
Connectedness 2nd-Order Observed Scale Means & Standard Deviations By Gender and Ethnicity Attachment Theory Factors Problem-Behavior Theory Factors Social Familial Academic Self Conventional Unconventional Gender Female 3.50(.68) 3.77(.76) 3.67(.64) 3.94(.66) 3.62(.54) 3.82(.64) Male 3.36(.70) 3.74(.74) 3.45(.66) 3.90(.69) 3.51(.56) 3.68(.66) African American All 3.25(.71) 3.85(.74) 3.48(.65) 4.10(.62) 3.55(.56) 3.75(.62) Female 3.19(.68) 3.84(.74) 3.55(.65) 4.06(.60) 3.51(.56) 3.80(.60) Male 3.31(.73) 3.87(.74) 3.42(.64) 4.12(.64) 3.58(.56) 3.71(.63) Caucasian All 3.48(.68) 3.73(.76) 3.56(.67) 3.91(.69) 3.58(.56) 3.75(.67) Female 3.59(.65) 3.76(.77) 3.69(.65) 3.95(.67) 3.66(.54) 3.83(.65) Male 3.39(.70) 3.71(.76) 3.45(.68) 3.88(.70) 3.50(.57) 3.68(.68) Latina/o All 3.21(.70) 3.85(.66) 3.55(.57) 3.81(.63) 3.49(.48) 3.72(.56) Female 3.20(.70) 3.83(.71) 3.62(.60) 3.75(.65) 3.47(.50) 3.76(.58) Male 3.22(.69) 3.86(.61) 3.48(.54) 3.86(.60) 3.51(.47) 3.68(.55)
Note. These are the observed means, not the latent means. These are provided to give information about the variability of observed scale scores.
Hemingway Manual p. 27
Copyright © 2011 Michael J. Karcher, Ed.D., Ph.D. [email protected]
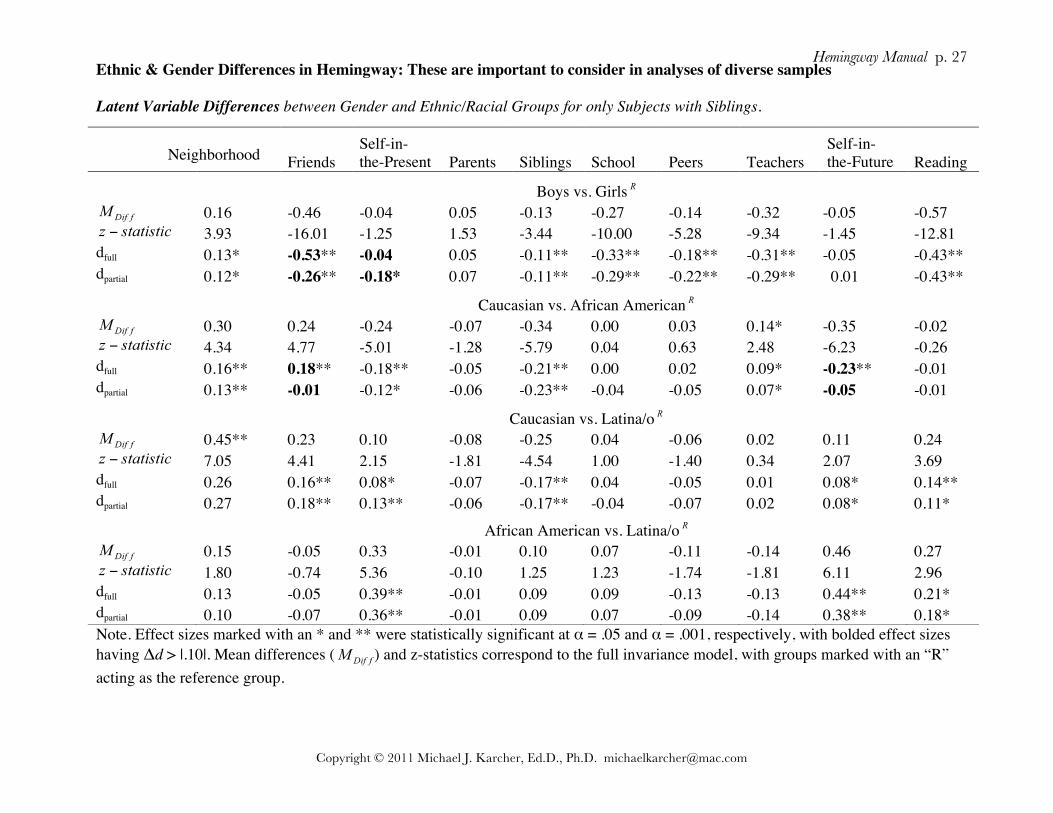
Note. Effect sizes marked with an * and ** were statistically significant at α = .05 and α = .001, respectively, with bolded effect sizes having Δd > |.10|. Mean differences ( ) and z-statistics correspond to the full invariance model, with groups marked with an “R” acting as the reference group.
Ethnic & Gender Differences in Hemingway: These are important to consider in analyses of diverse samples Latent Variable Differences between Gender and Ethnic/Racial Groups for only Subjects with Siblings.
Neighborhood Friends
Self-in- the-Present Parents Siblings School Peers Teachers
Self-in-the-Future Reading
Boys vs. Girls 0.16 -0.46 -0.04 0.05 -0.13 -0.27 -0.14 -0.32 -0.05 -0.57
3.93 -16.01 -1.25 1.53 -3.44 -10.00 -5.28 -9.34 -1.45 -12.81 dfull 0.13* -0.53** -0.04 0.05 -0.11** -0.33** -0.18** -0.31** -0.05 -0.43** dpartial 0.12* -0.26** -0.18* 0.07 -0.11** -0.29** -0.22** -0.29** 0.01 -0.43** Caucasian vs. African American
0.30 0.24 -0.24 -0.07 -0.34 0.00 0.03 0.14* -0.35 -0.02 4.34 4.77 -5.01 -1.28 -5.79 0.04 0.63 2.48 -6.23 -0.26
dfull 0.16** 0.18** -0.18** -0.05 -0.21** 0.00 0.02 0.09* -0.23** -0.01 dpartial 0.13** -0.01 -0.12* -0.06 -0.23** -0.04 -0.05 0.07* -0.05 -0.01 Caucasian vs. Latina/o
0.45** 0.23 0.10 -0.08 -0.25 0.04 -0.06 0.02 0.11 0.24 7.05 4.41 2.15 -1.81 -4.54 1.00 -1.40 0.34 2.07 3.69
dfull 0.26 0.16** 0.08* -0.07 -0.17** 0.04 -0.05 0.01 0.08* 0.14** dpartial 0.27 0.18** 0.13** -0.06 -0.17** -0.04 -0.07 0.02 0.08* 0.11* African American vs. Latina/o
0.15 -0.05 0.33 -0.01 0.10 0.07 -0.11 -0.14 0.46 0.27 1.80 -0.74 5.36 -0.10 1.25 1.23 -1.74 -1.81 6.11 2.96
dfull 0.13 -0.05 0.39** -0.01 0.09 0.09 -0.13 -0.13 0.44** 0.21* dpartial 0.10 -0.07 0.36** -0.01 0.09 0.07 -0.09 -0.14 0.38** 0.18*
Hemingway Manual p. 28
Copyright © 2011 Michael J. Karcher, Ed.D., Ph.D. [email protected]
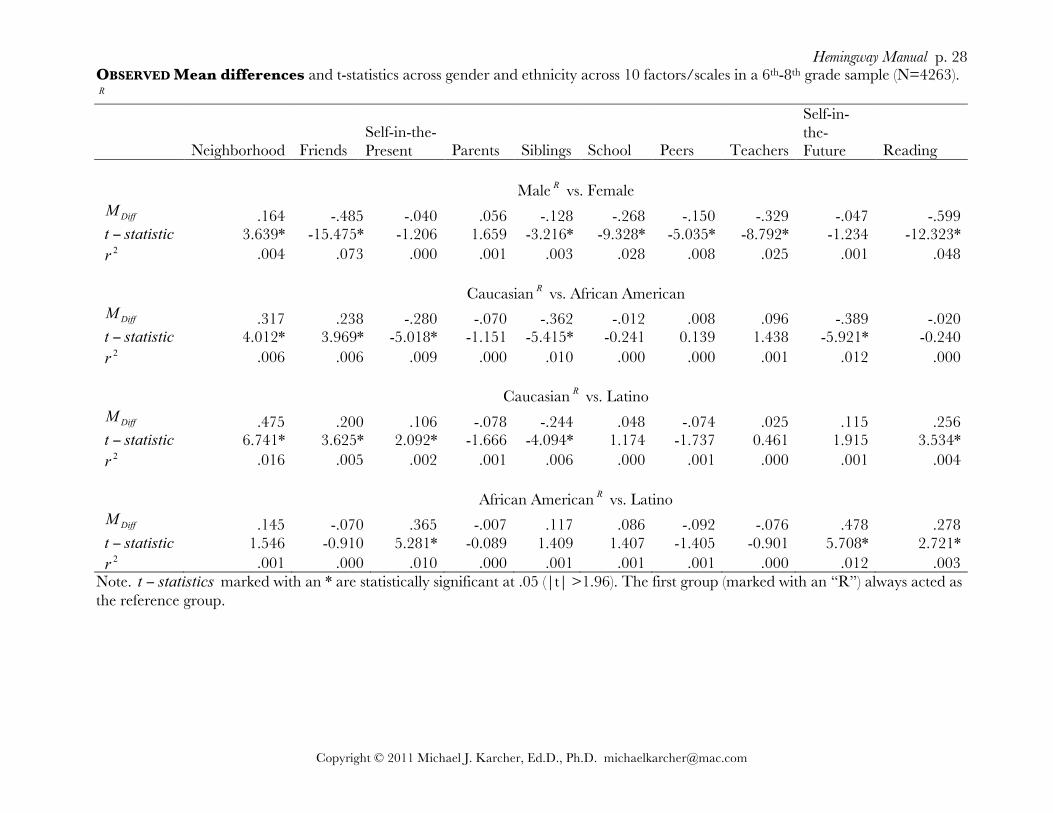
OBSERVED Mean differences and t-statistics across gender and ethnicity across 10 factors/scales in a 6th-8th grade sample (N=4263). R
Neighborhood Friends Self-in-the-Present Parents Siblings School Peers Teachers
Self-in-the-Future Reading
Male R vs. Female
DiffM .164 -.485 -.040 .056 -.128 -.268 -.150 -.329 -.047 -.599 statistict − 3.639* -15.475* -1.206 1.659 -3.216* -9.328* -5.035* -8.792* -1.234 -12.323*
2r .004 .073 .000 .001 .003 .028 .008 .025 .001 .048 Caucasian R vs. African American
DiffM .317 .238 -.280 -.070 -.362 -.012 .008 .096 -.389 -.020 statistict − 4.012* 3.969* -5.018* -1.151 -5.415* -0.241 0.139 1.438 -5.921* -0.240
2r .006 .006 .009 .000 .010 .000 .000 .001 .012 .000 Caucasian R vs. Latino
DiffM .475 .200 .106 -.078 -.244 .048 -.074 .025 .115 .256 statistict − 6.741* 3.625* 2.092* -1.666 -4.094* 1.174 -1.737 0.461 1.915 3.534*
2r .016 .005 .002 .001 .006 .000 .001 .000 .001 .004 African American R vs. Latino
DiffM .145 -.070 .365 -.007 .117 .086 -.092 -.076 .478 .278 statistict − 1.546 -0.910 5.281* -0.089 1.409 1.407 -1.405 -0.901 5.708* 2.721*
2r .001 .000 .010 .000 .001 .001 .001 .000 .012 .003 Note. statisticst − marked with an * are statistically significant at .05 (|t| >1.96). The first group (marked with an “R”) always acted as the reference group.

Hemingway Manual p. 29
Copyright © 2011 Michael J. Karcher, Ed.D., Ph.D. [email protected]
VII. THE MOST RECENT AND COMPREHENSIVE RELIABILITY AND VALIDITY ESTIMATES (see Karcher and Sass, 2010, in appendix)
Internal Consistency ( ) Coefficients for Scales Across the Three Models For Both Genders, All Ethnic Groups, and Total Sample Reliability Estimates for Middle School Sample using the Latest Version, 5.5 of the Adolescent Scale.
Overall Male Female Caucasian African
American Latino Asian Bi-racial Other
First-order Factors Neighborhood .86 .85 .86 .86 .80 .83 .87 .83 .84 Friends .78 .76 .79 .79 .73 .81 .78 .80 .80 Self-in-the-Present .76 .76 .77 .78 .65 .70 .80 .76 .73 Parents .81 .80 .82 .82 .75 .74 .84 .79 .78 Siblings .90 .88 .90 .90 .82 .85 .86 .90 .87 School .79 .78 .80 .81 .74 .75 .81 .81 .70 Peers .70 .68 .72 .72 .65 .62 .75 .71 .61 Teachers .84 .83 .84 .85 .77 .78 .85 .84 .73 Self-in-the-Future .75 .76 .74 .76 .68 .71 .78 .78 .74 Reading .90 .88 .91 .91 .79 .84 .94 .89 .86
Second-order factors: Attachment Theory Social .82 .83 .82 .82 .77 .82 .84 .83 .84 Familial .88 .87 .88 .88 .84 .84 .89 .88 .87 Academic .89 .88 .89 .89 .85 .85 .92 .89 .83 Self .83 .83 .83 .84 .77 .79 .83 .85 .84
Second-order factors: Problem-behavior Theory Unconventional .88 .88 .88 .89 .86 .83 .88 .88 .89 Conventional .91 .91 .92 .92 .88 .89 .93 .92 .88 Sample size 3598 2047 1880 2788 400 410 61 179 89

The Hemingway: Measure of Adolescent Connectedness Scoring Manual p. 30
Copyright © 2011 Michael J. Karcher, Ed.D., Ph.D. [email protected]
VI. RELIABILITY ESTIMATES FOR SUBSCALES IN THE LONG VERSION CONNECTEDNESS TO SELF Connectedness to self is based on Kohut's self-development model, Erikson's model of identity development, and Winnicot's concept about the capacity to be alone. Kohut describes the angry reaction to disconnection (especially in the form of criticism) when self-development has resulted in a fragmented self. Conversely, Winnicot describes the capacity to be alone, which supports one's interest in reading and one's ability to feel cohesive when alone. Reading reflects that capacity to be alone and to be content when connected only to oneself. Lastly, connectedness to self through self-esteem and identity reflects one's self-assessment of him/herself as a worthy, likeable, and unique person is consistent with Erikson's landmark work. SOCIAL CONNECTEDNESS Connectedness to others (5 subscales on the short form and an additional 4 on the long form) is based on Baumeister & Leary's (1995) "need to belong" theory, which emphasizes affective commitment and contact or engagement with others as a primary human need. Trust, pride, time spent together, and enjoyment of time spent with others constitute "social connectedness."
CONNECTEDNESS TO OTHERS ("BEING RELATED") • Long version: Connectedness to a boyfriend/girlfriend (Alpha=N/A) • Long version: Connectedness to culturally different others (Alpha=.82) • Long version: Connectedness to mother (Alpha=.83) • Long version: Connectedness to father (Alpha=.92) • Long version: Connectedness to parents (Factor, combing mother and father) (Alpha=.87) CONNECTEDNESS TO SOCIETY Connectedness to society reflects concepts from ecological and problem-behavior theories. Bronfenbrenner's ecological model of human development suggests that both the self and one's relationships ("microsystems") are embedded within larger systems of reciprocal influence. Jessor's problem behavior theory suggests that institutions are seen by youth as conventional or non-conventional. Engagement in each predicts problem behaviors among youth and can distinguish between disconnected (i.e., delinquent) and connected youth. CONNECTEDNESS TO SCHOOL (FACTOR SCALE, COMBING SCHOOL AND TEACHERS) (Alpha=.86) CONNECTEDNESS TO FAMILY (Short Form Factor Combining Parents and siblings: Alpha=.85) Long version: Connectedness to religion (Alpha=.91)

The Hemingway: Measure of Adolescent Connectedness Scoring Manual p. 31
Copyright © 2011 Michael J. Karcher, Ed.D., Ph.D. [email protected]
VIII. Validity Evidence From Karcher 2003: Studies 3 and 4 are reproduced below. For full paper, see www.adolescentconnectedness.com
Study Three: Cross-Validating the Conventionality Factors and Predicting Substance Use
The goals of study three were to cross-validate the model in study two that revealed the factors of conventionality and to explore the use of the connectedness subscales in explaining adolescent substance use. Conventionality is derived from problem behavior theory (Jessor, 1993; 1984) and social control theory (Hirschi, 1969), both of which suggest that unconventional relationships contribute to delinquent behaviors. To test whether this model would hold as well for delinquent youths as for preparatory school students, the model in study one was cross-validated with a sample comprised of delinquent youth. The second goal was to examine the use of the measure of connectedness scales, specifically those reflecting the conventional and unconventional dimensions, to explain patterns of substance use among delinquent and non-delinquent youth. A hypothesized model was developed to test hypotheses three that risk-taking behavior, like substance use, can be explained in terms of involvement in the conventional and unconventional domains of school, family, and friends. Design Confirmatory factor analysis was conducted using the factor structure from study one which loaded all scales on the conventional or the unconventional latent variables (see Figure 1). As in study one, each scale was loaded directly on one of the two latent variables according to descriptions by Jessor (1993) and Hirschi (1969). Family, School, Religion and Reading were loaded on the conventional factor; Friends and Self were loaded on the unconventional factor. For the prediction of substance use, a hybrid, latent variable model based on tetrachoric correlations for dichotomous variables (e.g., alcohol use: yes/no) was constructed using procedures for categorical analyses as recommended for EQS 5.7b for Windows (Bentler & Wu, 1995). The advantage of using this structural model instead of regression techniques is that the structural model tests the effects of both the separate indicators (subscales) and the latent variables (conventional connectedness; substance use) simultaneously as predictors of substance use. The chi-squared statistic tests the exclusion of any direct paths between the connectedness and substance use variables in model. The model was constructed to test the hypothesis that separate, ecologically-specific connectedness effects (or paths) are required to fully explain substance use (hypothesis one and three). In model I (see Figure 2), connectedness to family and to school were loaded on the latent variable called conventional connectedness, which was used to predict a latent variable for substance use. Connectedness to friends, which alone represented unconventional connectedness, was used to predict the latent variable for substance use independently. This model tested the hypothesis that both conventional and unconventional connectedness make unique contributions to the prediction of substance use. Covariances between the connectedness to school and to family were included to account for correlated error variance. Participants Two samples were included. Institutional or parental consent, and youths’ assent to participate, were obtained prior to data collection. A incarcerated delinquent sample included 148 high school aged youths (34% Caucasian, 23% African-American, and 43% Hispanic), 34% of whom were female. This sample of delinquent youth included detainees in a juvenile detention unit

The Hemingway: Measure of Adolescent Connectedness Scoring Manual p. 32
Copyright © 2011 Michael J. Karcher, Ed.D., Ph.D. [email protected]
in the Southwest. Eighty-one percent were Hispanic, 12 percent White, and 7 percent Black. Thirty three percent were female. The rural sample included 209 adolescents in grades 9, 10, and 11 from a midwestern high school. This sample was 66% female and only 5% were ethnic minority (Hispanic, Native American). Measures
Measure of Adolescent Connectedness (version 2). The same measure and subscales and composite scales described in study two were used.
Measures of Adolescent Connectedness (versions 3). Version 3 included 50 items across the 13 domains of connectedness. Study one revealed ways to improve construct validity and subscale reliability by indicating the types of items that should be included a third version of the measure. Scale revisions were conducted to increase the reliability of the subscale measures. Items were added to balance the number of conduct and caring items and to include a reverse scored item for each subscale to lessen response bias. Study one also indicated that the revised Connectedness to Friends composite scale was not sufficiently reliable. Revisions to the connectedness to friends and neighborhood were made based on this information by adding four new items. Composite scales were computed as the means of all pooled items from related subscales (Family, School, Self and Friend) as in study one. Coefficient alpha for the items in each of the composite scales included in the rural sample were School (α = .80), Teachers (α = .73), Parents (α = .81), Siblings (α = .76), and Friends (α = .66). Based on the timing of the scale revisions and data collection the revised version 3 was administered to the sample of 209 rural midwestern youths.
Risk & Prevention Questionnaire-Revised (RAP-Q) (Nakkula & Karcher, 1999; Way, Stauber, Nakkula, & London, 1994). Three dichotomously scored items were chosen from this questionnaire which asked about the use of three substances: cigarettes, alcohol, and tobacco. The questions asked whether youths had ever used each of the substances (no = 0; yes = 1).
Procedures Data were collected from the rural youth through classwide administrations, but were administered to the detained youth in small groups so that the researchers could read the connectedness items aloud to the youth and answer any questions the youth had. For the delinquent youth, the connectedness scale was administered in groups of five to six youth and was read aloud. The substance use data was collected in a face-to-face interview. For the rural youth, both connectedness and substance use data were collected during one homeroom period. Institutional/school approval, parental consent, and youths’ assent to participate in the survey were collected prior to data collection. Ninety-three percent of the delinquent youth, and 96% of the rural youth who were invited to participate completed both assessments.
Results The dimensions of conventionality were replicated with this divergent adolescent sample and provided further support for hypothesis three that conventionality is an important dimension of adolescent connectedness. For the delinquent youth, the model similar factor loadings to those in study 1 with non-delinquent youth. However, the smaller sample of delinquent youths had a nonsignificant Chi-squared estimate and the best fit indices (see Figure 1). Although the significance of the Chi-squared estimate for the preparatory school students may reflect the larger sample, it also may be that the conventionality dimension is more distinct and important in characterizing delinquent youths’ connectedness.
The Hemingway: Measure of Adolescent Connectedness Scoring Manual p. 33
Copyright © 2011 Michael J. Karcher, Ed.D., Ph.D. [email protected]
Using the hybrid structural model, connectedness was found to explain substance use in both samples, though to fully explain marijuana use additional paths were required. Table 4 presents Goodness of Fit indices for the theorized model (I), in which conventional and unconventional connectedness alone explained substance use, as well as for the two respecified models (II, III)(see Figure 2). The results of the Multivariate LM Test for the hypothesized model (I) suggested that a direct effect of connectedness to friends on marijuana use would increase model fit for the delinquent youths, so the theorized model (I) was respecified by adding this path. Model II, which included this direct path from connectedness to friends to marijuana use, provided a far better fit for the delinquent youths. Model II illustrated that the higher the level of conventional connectedness, the less likely the delinquent youths were to have used alcohol, marijuana, or tobacco. In addition, there was a direct effect of connectedness to friends on marijuana use but not on substance use in general.
The relationship between conventional connectedness and substance use among the delinquent youth was similar for the rural youths, but the relationship between connectedness to friends and substance use differed. The hypothesized model (I) did not provide a good fit for the rural youths, and although model II provided a better fit for the rural youths, considerable variance was unaccounted for by model II (see RMSEA estimate in Table 4). The Multivariate LM Test suggested that an additional path from conventional connectedness to marijuana use would increase model fit. Indeed, model III provided an excellent fit to the data. This model suggested that, for the rural youths, conventional connectedness was negatively related to overall substance use. In addition there was an added, negative effect of conventional connectedness on marijuana use (beyond its effect on substance use in general). Unlike the delinquent youths, for the rural youths, increased connectedness to friends resulted in a significant increase in the likelihood of all substance use but not of marijuana uniquely. The path from connectedness to friends to marijuana use was nonsignificant for the rural youth.
Discussion
These findings suggest that for diverse groups of youths, connectedness is a significant predictor of substance use, but that the specific relationships between connectedness and substance use may differ across groups. As suggested by Jessor and Jessor (1977) conventionality is an important predictor of substance use in general. Conventional connectedness reduced the likelihood of substance use for both groups, but for delinquent urban youths, connectedness to friends only predicted marijuana use. Once the delinquents’ connectedness to family and to school were accounted for, greater connectedness to friends increased their odds of marijuana use. This was not the case for the rural youth, for whom connectedness to friends did not have a unique effect on marijuana use, but rather conventional connectedness had an added effect on marijuana use. For the rural youths, greater connectedness to friends increased the odds of all three forms of substance use.
One considerable limitation of this study was that connectedness may have shared with substance use a common effect of age. Based on what was found in study one, conventional connectedness appears to be lower among older adolescents. Thus, without age in the model, these models should be considered underspecified because the effects of age cannot be ruled out. Another limitation is that the rural youth used a more reliable measure of connectedness (one with the original items plus additional ones) which may mean that the error in the model for the delinquent youth reflects attenuated estimates that are less accurate than for the rural youth.
The Hemingway: Measure of Adolescent Connectedness Scoring Manual p. 34
Copyright © 2011 Michael J. Karcher, Ed.D., Ph.D. [email protected]
Despite this limitation, the study provided qualified support for the third hypothesis in the framework, suggesting that conventional connectedness is negatively related to substance use and unconventional connectedness is positively related to substance use. The qualifier is that the relationships between connectedness to friends and specific forms of substance use may depend on the type of youth and the context (i.e., rural or urban). Specifically, among delinquent youth connectedness to friends may be positively related only to more elicit substances, like marijuana use. For rural youth, connectedness to friends may increase the risk for all substance use.
Study Four: Final Measurement Development and Estimates of Psychometric Properties
The present study focused on the psychometric properties of the fourth version of the measure of adolescent connectedness. The first purpose was to estimate the revised subscales' and composite scales' internal consistency, test-retest reliability, and convergent validity. The second purpose was to test the hypothesized connectedness model through a confirmatory factor analysis that included all 13 subscales to test the ecological distinctiveness of the subscales. Design. A latent variable, confirmatory factor analysis was conducted using EQS 5.7b. Pearson correlations were used to estimate convergent validity of the subscales and composite scales. Participants
The sample included (N = 427) youths from separate geographical regions and ethnic/racial groups. The sample included (a) 183 multiethnic high school students in grades 9 and 10 from an urban Midwestern city of approximately 290,000; (b) 153 youths in grades 8 through 12 at a college preparatory school in the Southwest (80 of whom served as mentors to children); and (c) 91 high school students in a rural school in a Midwest town of 15,000 (also mentors). The sample included 257 females and 170 males; 298 Caucasian, 47 African-American, 36 Hispanic, 17 Asian-American, and 29 bi-racial or "other" youths. The sample included balanced numbers of youths in grades 9 (32%), 10 (26%), 11 (23%), and 12 (19%).
Measures
Measure of Adolescent Connectedness (version 4). Several changes were made from version three to four. Four items with poor interitem correlations in study two were replaced, and additional items were added so that there were six items per subscale. Based on study one, two changes were made in scale content. The future scale was revised to reflect a self-in-the-future subscale because of its high correlation with the connectedness to self scale. In the connectedness to culture subscale, items about knowledge of prejudice were removed based on their low item-total correlations, and additional items were added which asked only about interest in getting to know youths from other cultures or in making friends with youths from other cultures. Peer items were added to focus the scale more on youth’s enjoyment of and cooperation with their peers on school-related tasks. Interitem and test-retest reliability estimates for the subscales and composite scales are presented in Table 5.
School & Family Connectedness Scales (Jacobson & Rowe, 1999). Two additional scales used in published studies of connectedness were included. The purpose of their inclusion was to the estimate convergent validity of the items in fourth revision of the Hemingway connectedness measure. Cronbach’s alpha reliability for the five items in the family connectedness scale (JR Family; α = .78) and for the four items in the school connectedness scale (JR School; α = .72) were good. JR was added to designate these connectedness subscales.

The Hemingway: Measure of Adolescent Connectedness Scoring Manual p. 35
Copyright © 2011 Michael J. Karcher, Ed.D., Ph.D. [email protected]
Reason for Living Inventory for Adolescents (Osman, et al., 1998). The 7-item Future Optimism subscale was chosen as a measure of future orientation. It was used to estimate the convergent validity of the Self-in-the-future subscale. Cronbach’s alpha was good (α = .83).
Family, Friends, Self Form (Simpson & McBride, 1992). This 60 item questionnaire assesses psychological adjustment as indicated by family relations, peer involvement, and self perceptions. The friends scale (FFFriends) measures one’s level of activity with friends. The conventional involvement scale asks how many of one’s friends engage in conventional behaviors, like reading, doing homework after school, wanting to go to college. Simpson and McBride reported internal consistency estimates between .73 and .92. Cronbach’s alpha for the six conventional items (α = .69) and five FFFriends (α = .76) items was adequate in this sample.
Social Connectedness Scale II (Lee & Robbins, 1998). This 20-item scale measures a self-reported need for belongingness. The measure is based on research with college students and measures the absence of connectedness as indicated by difficulties in maintaining closeness with others in general. Cronbach’s alpha reliability for the 20 items was high (α = .93).
Inventory of Parent and Peer Attachment (Armsden & Greenberg, 1987; revised scale reported in Corcoran & Fischer, 2000). The full 75 item scale measures trust, communication, and alienation in parent and peer relationships. The seven items comprising the Alienation from Peers subscale were used in the current study. The authors report adequate three-week test-retest reliability (r = .86) and internal consistency (α = .72) estimates for adolescent samples. In the present study the interitem reliability was adequate as well (α = .75).
Results The final measure appeared to have good properties of reliability. The data from the revised connectedness measure fit the hypothesized (ecologically distinct subscale factor structure) model reasonably well with minor modifications. Correlations between other measures and the connectedness subscales and composite scales provided evidence of construct validity. The theorized ecological model was conducted using confirmatory factor analysis. Based on the exploratory factor analysis presented in study one, the data were fit to the hypothesized model including five composite constructs for family, school, peers, self, and friends. In an attempt to include all subscales in the model, subscales for family related activities (i.e., religion) and school related activities (i.e., reading) were considered indicators of their respective factor. Finally, in this model, subscale error estimates (ε = 1 - α) were used, based on Cronbach’s alpha estimates presented in Table 2, to correct for attenuation due to subscale measurement error. Initially the hypothesized cross-validation model did not provide a satisfactory fit for the data. The standardized solution parameter estimates are presented in parentheses in Figure 3. One estimate of model fit with complex models, the χ2/df statistic, tested the hypothesis that the model does indeed fit the data well. The χ2/df was 213/41 = 3.60, which is inside the typically accepted cutoff range of 3 to 5 (Mueller, 1996), which in combination with the other goodness of fit indices suggests the need to reject the hypothesis that the model fit the data well enough. The NFI = .85, NNFI = .84, CFI = .87, GFI = .93, and AGFI = .89 also provided evidence that the model provided an marginal fit for the data. In addition, the residual variance was not ideal, having a RMSEA = .08 with a confidence interval range of .068 to .091.
The Lagrange Multiplier test indicated that two respecifications could achieve a satisfactory model fit. The new Self-in-the-future scale should also be loaded onto the School factor. The Connectedness to Neighborhood scale should also be loaded onto the Family factor. Unfortunately,
The Hemingway: Measure of Adolescent Connectedness Scoring Manual p. 36
Copyright © 2011 Michael J. Karcher, Ed.D., Ph.D. [email protected]
these two additional paths undermined the orthogonality of the factor structure, even though each of the other subscales remained indicators of only one factor. The respecified model, in which neighborhood connectedness and self-in-the-future were allowed to load on two factors, provided a good fit to the data. The standardized solution parameter estimates are presented outside of parentheses in Figure 3. The χ2/df was 2.27, which was below the typical cutoff range of 3 to 5 for complex models (Mueller, 1996). The goodness of fit indices and reduced residual variance provided consistent evidence that the respecified model fit the data well (see Figure 3). The five factors had indicator subscales with moderate to large factor loadings (.34 to .82), except for the double-loaded subscales (neighborhood and self-in-the-future), which no longer loaded as heavily on their primary factors. Psychometric properties of the measure were explored through a correlation matrix, which provided consistent evidence of convergent validity. Evidence of convergent validity (Campbell & Fiske, 1959) was gathered by asking 60 of the 9th and 10th graders in the Midwest school (sample group c) to complete an additional battery of measures including connectedness to school and family, activity with friends, social connectedness, conventionality, future optimism, and peer alienation. The complete data from 57 of the youths are presented in Table 2. Bolded coefficients provide evidence of convergent validity. Evidence of convergent validity was found for most of the revised scales, the composite scales, and for the dimension of conventionality. The JRFamily, JRSchool, and FFFriends composite scales correlated positively with ecologically related subscales from the measure of adolescent connectedness (MAC). The MAC family connectedness subscales and composite scale correlated highly with the JRFamily connectedness and the Conventional Activities scales with the exception that the MAC sibling connectedness subscale did not correlate with Conventional Activities. The JRSchool Connectedness scale correlated with the MAC conventional scales of connectedness to school, to teachers, and to self-in-the-future, but also with the unconventional MAC self-esteem, connectedness to friends, and connectedness to other cultures subscales. The Future Orientation convergence scale correlated highly with MAC self-in-the-future and other conventional connectedness scales. The Social Connectedness and Peer Alienation scales, which should reflect one’s self-assessment based on perceived social support, correlated in the hypothesized directions with those MAC connectedness scales related to close interpersonal relationships and connectedness to self. Using the more conservative significance level of .002, based on a Bonferroni adjustment of the conventional .05 level by the number of scales in the correlation matrix (.05/25 = .002), convergent validity remained significant for several scales. The Connectedness to Family, Friends, and Self composite scales correlated with their respective convergent validity scales, as did the Connectedness to Parents, School, Self-Esteem, and Self-in-the-Future subscales. There were other correlations that did not support the hypothesized distinctions between MAC subscales. The MAC Connectedness to Reading subscale did not correlate with JRSchool but rather with JRFamily. The MAC Connectedness to Self subscales (self-esteem and self-in-the-future) correlated with the JRFamily Connectedness, Future Orientation, and Conventional Activities scales but not with FFFriends. Neither the MAC Connectedness to Religion or Self-cohesion strongly correlated with any of the other scales rendering their validity unclear.
Test-retest and interitem reliability estimates were satisfactory. From the same 57 youths, the revised connectedness measure was collected twice, one month apart, to examine test-retest reliability (presented in Table 5). Also in Table 5 are estimates of internal consistency based on the total sample of 439 youths included in the confirmatory factor analysis. All but two of the scales demonstrated estimates of reliability in the good (.70 - .80) to very good (.80 - 90) range.
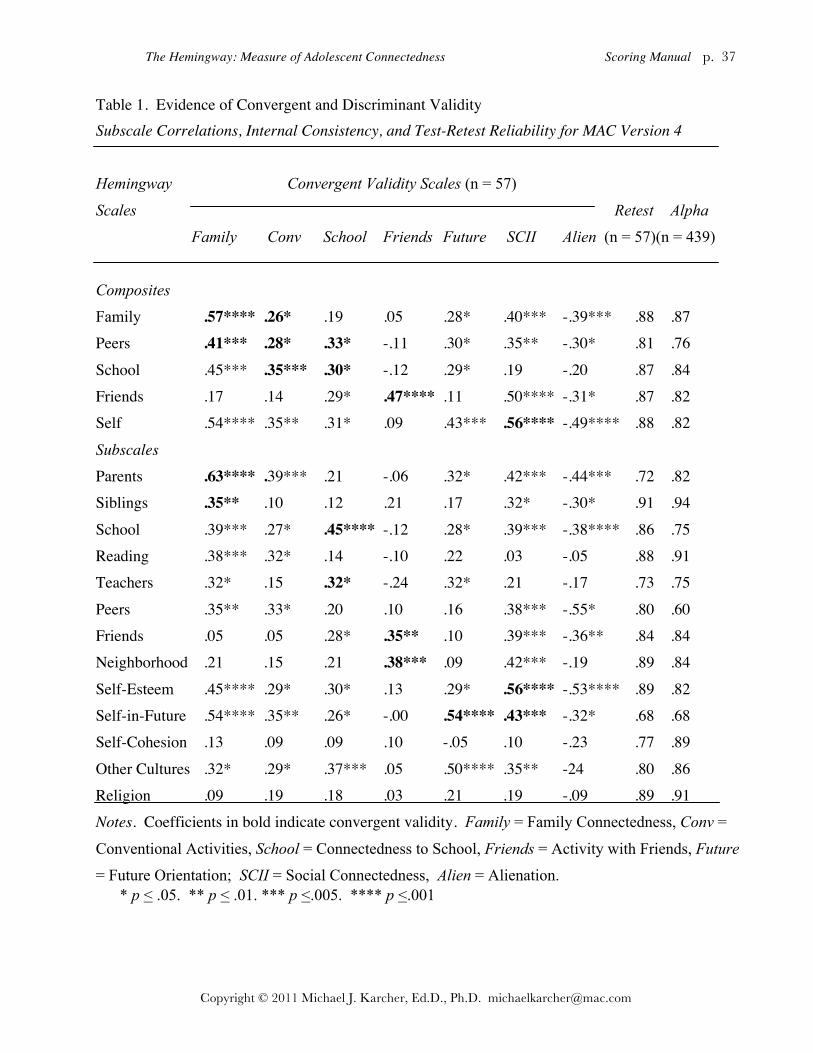
The Hemingway: Measure of Adolescent Connectedness Scoring Manual p. 37
Copyright © 2011 Michael J. Karcher, Ed.D., Ph.D. [email protected]
Table 1. Evidence of Convergent and Discriminant Validity
Subscale Correlations, Internal Consistency, and Test-Retest Reliability for MAC Version 4 Hemingway Convergent Validity Scales (n = 57)
Scales Retest Alpha
Family Conv School Friends Future SCII Alien (n = 57)(n = 439)
Composites Family .57**** .26* .19 .05 .28* .40*** -.39*** .88 .87 Peers .41*** .28* .33* -.11 .30* .35** -.30* .81 .76
School .45*** .35*** .30* -.12 .29* .19 -.20 .87 .84 Friends .17 .14 .29* .47**** .11 .50**** -.31* .87 .82 Self .54**** .35** .31* .09 .43*** .56**** -.49**** .88 .82
Subscales
Parents .63**** .39*** .21 -.06 .32* .42*** -.44*** .72 .82 Siblings .35** .10 .12 .21 .17 .32* -.30* .91 .94
School .39*** .27* .45**** -.12 .28* .39*** -.38**** .86 .75 Reading .38*** .32* .14 -.10 .22 .03 -.05 .88 .91 Teachers .32* .15 .32* -.24 .32* .21 -.17 .73 .75
Peers .35** .33* .20 .10 .16 .38*** -.55* .80 .60 Friends .05 .05 .28* .35** .10 .39*** -.36** .84 .84 Neighborhood .21 .15 .21 .38*** .09 .42*** -.19 .89 .84
Self-Esteem .45**** .29* .30* .13 .29* .56**** -.53**** .89 .82 Self-in-Future .54**** .35** .26* -.00 .54**** .43*** -.32* .68 .68 Self-Cohesion .13 .09 .09 .10 -.05 .10 -.23 .77 .89
Other Cultures .32* .29* .37*** .05 .50**** .35** -24 .80 .86 Religion .09 .19 .18 .03 .21 .19 -.09 .89 .91 Notes. Coefficients in bold indicate convergent validity. Family = Family Connectedness, Conv =
Conventional Activities, School = Connectedness to School, Friends = Activity with Friends, Future
= Future Orientation; SCII = Social Connectedness, Alien = Alienation. * p < .05. ** p < .01. *** p <.005. **** p <.001

The Hemingway: Measure of Adolescent Connectedness Scoring Manual p. 38
Copyright © 2011 Michael J. Karcher, Ed.D., Ph.D. [email protected]
Table 2. Developmental Differences
Two Discriminant Analyses for the Effect of Age on Connectedness Subscales
Discriminant Function—Subscale Correlations
Connectedness Scale Sample A Sample B
Friends .46 .43
School - .46 - .48
Religion - .33 - .26
Peers .31 .15
Parents - .22 - .18
Siblings .19 .29
Self-Cohesion .11 .05
Reading - .09 - .08
Neighborhood .08 - .16
Other Cultures .07 .08
Teachers - .06 - .06
Future - .05 .09
Self-Esteem .02 - .17
Statistical Criterion
Sample (n = Younger/ n = Older) 146/132 142/122
χ2 (df = 13) 44.22 *** 74.61***
Lambda (Λ) .85 .75
Percent Correctly Identified 69% 73%
*** p <.005.

The Hemingway: Measure of Adolescent Connectedness Scoring Manual p. 39
Copyright © 2011 Michael J. Karcher, Ed.D., Ph.D. [email protected]
Table 3.
Goodness of Fit Indices for Cross-Validating Connectedness Models Explaining Substance Use
Goodness of Fit Indices for Basic and Alternative Models
Model Sample A (n = 169) Sample B (n = 209)
Urban Delinquents Rural Students
I: Theorized Model (df = 6)
Yuan-Bentler Corrected AGLS χ2 (p-value) 15.53 (.010) 26.70 (.001)
CFI (AGFI) .966 (.897) .959 (.856)
NFI (NNFI) .950 (.916) .948 (.898)
RMSEA (Confidence Interval) .102 (.045 - .161) .127 (.079 - .178)
II: Model I Plus Direct Path from Connectedness to Friends to Marijuana Use (df = 5)
Yuan-Bentler Corrected AGLS χ2 (p-value) 3.69 (.594) 16.88 (.005)
CFI (AGFI) .994 (.944) .966 (.926)
NFI (NNFI) .979 (.981) .975 (.881)
RMSEA (Confidence Interval) .049 (.000 - .125) .107 (.054 - .165)
III: Model II Plus Path From Conventional Connectedness to Marijuana Use (df = 4)
Yuan-Bentler Corrected AGLS χ2 (p-value) (N/A) .557 (.968)
CFI (AGFI) (N/A) .998 (1.00)
NFI (NNFI) (N/A) 1.00 (.990)
RMSEA (Confidence Interval) (N/A) .000 (.000 - .048)
CFI = Comparative fit index. AGFI = Adjusted GFI. NFI = Bentler-Bonnett normed fit index. NNFI
= Nonnormed fit index. GFI = Lisrel goodness of fit index. RMSEA = Root mean square error of
approximation. 90% Confidence Interval = 90% confidence interval of RMSEA.

The Hemingway: Measure of Adolescent Connectedness Scoring Manual p. 40
Copyright © 2011 Michael J. Karcher, Ed.D., Ph.D. [email protected]
Table 4. Means, Standard Deviations, and Multiple Analyses of Covariance Estimates for Effects of Sex and Delinquency on Adolescent
Connectedness
Sex Group (N = 269) Boys’ Delinquency Status (N = 79) Adolescent
Connectedness Females Males Non-delinquent Delinquent
Scale (n = 160) (n = 109) (n = 54) (n = 35) F (eta2) M SD M SD F (eta2) M SD M SD
Conventional
Parents 4.68* (.02) 3.99 .65 3.81 .77 .12 (.00) 3.78 .61 3.71 1.04 Siblings .56 (.00) 3.70 1.05 3.60 1.02 10.73*** (.13) 3.33 .96 4.13 .76
Teachers 17.43*** (.06) 3.93 .61 3.57 .76 7.54** (.09) 3.69 .71 3.12 .79 Peers .04 (.00) 3.64 .59 3.63 .66 .67 (.01) 3.66 .65 3.50 .78 Reading 1.72 (.02) 3.43 1.14 3.25 1.09 2.83 (.04) 2.98 1.08 3.46 1.01
School 4.73* (.02) 3.52 .66 3.32 .82 4.80* (.06) 3.45 .65 2.95 1.10 Self-in-Future 1.43 (.01) 4.07 .65 3.97 .68 .04 (.00) 3.91 .59 3.87 .85
Unconventional
Self-Esteem .00 (.00) 4.13 .67 4.13 .57 .32 (.00) 4.16 .49 4.08 .66 Friends 25.92***(.09) 4.29 .63 3.87 .70 .77 (.01) 3.84 .70 3.67 .72 Neighborhood 3.74* (.02) 3.18 .92 3.39 .87 4.33* (.05) 3.27 .84 3.72 .95
Note. F ratios are Wilks's approximation of Fs. Analyses used age as a covariate. * p < .05. ** p < .01. *** p <.005.
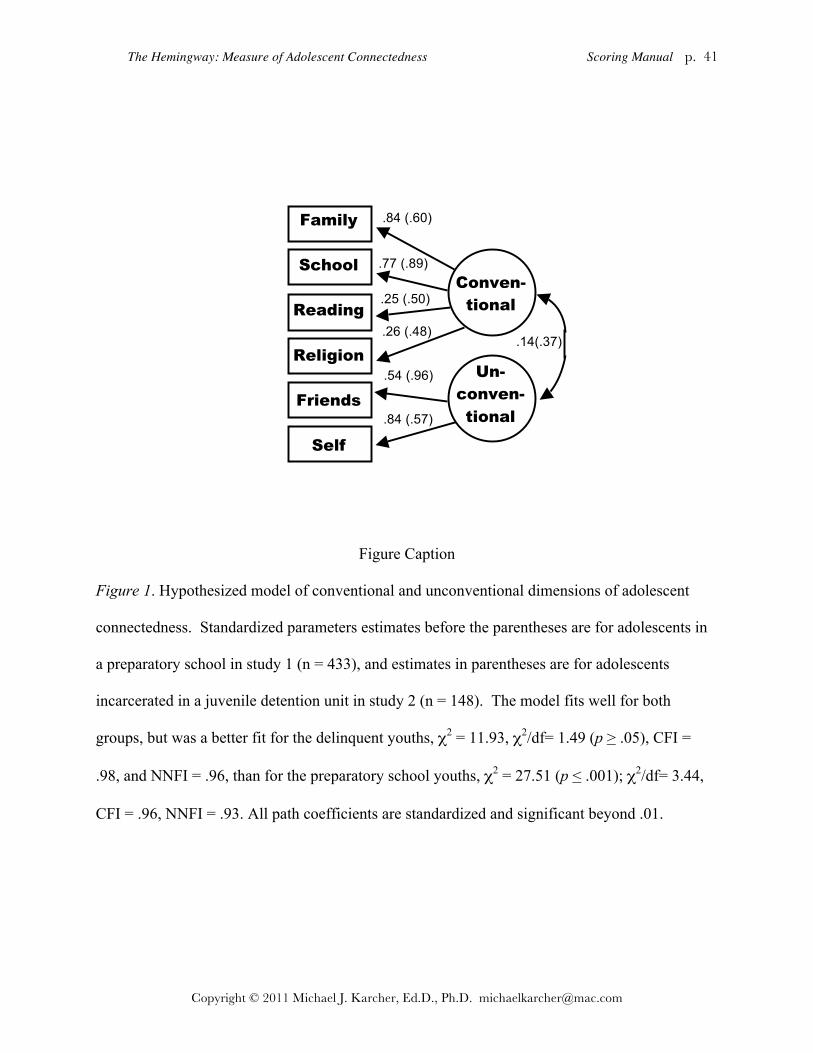
The Hemingway: Measure of Adolescent Connectedness Scoring Manual p. 41
Copyright © 2011 Michael J. Karcher, Ed.D., Ph.D. [email protected]
Figure Caption
Figure 1. Hypothesized model of conventional and unconventional dimensions of adolescent
connectedness. Standardized parameters estimates before the parentheses are for adolescents in
a preparatory school in study 1 (n = 433), and estimates in parentheses are for adolescents
incarcerated in a juvenile detention unit in study 2 (n = 148). The model fits well for both
groups, but was a better fit for the delinquent youths, χ2 = 11.93, χ2/df= 1.49 (p > .05), CFI =
.98, and NNFI = .96, than for the preparatory school youths, χ2 = 27.51 (p < .001); χ2/df= 3.44,
CFI = .96, NNFI = .93. All path coefficients are standardized and significant beyond .01.
Conven-tional
Un- conven-
tional
Family
School
Reading
Religion
Friends
Self
.77 (.89)
.26 (.48)
.25 (.50)
.54 (.96)
.84 (.57)
.84 (.60)
.14(.37)
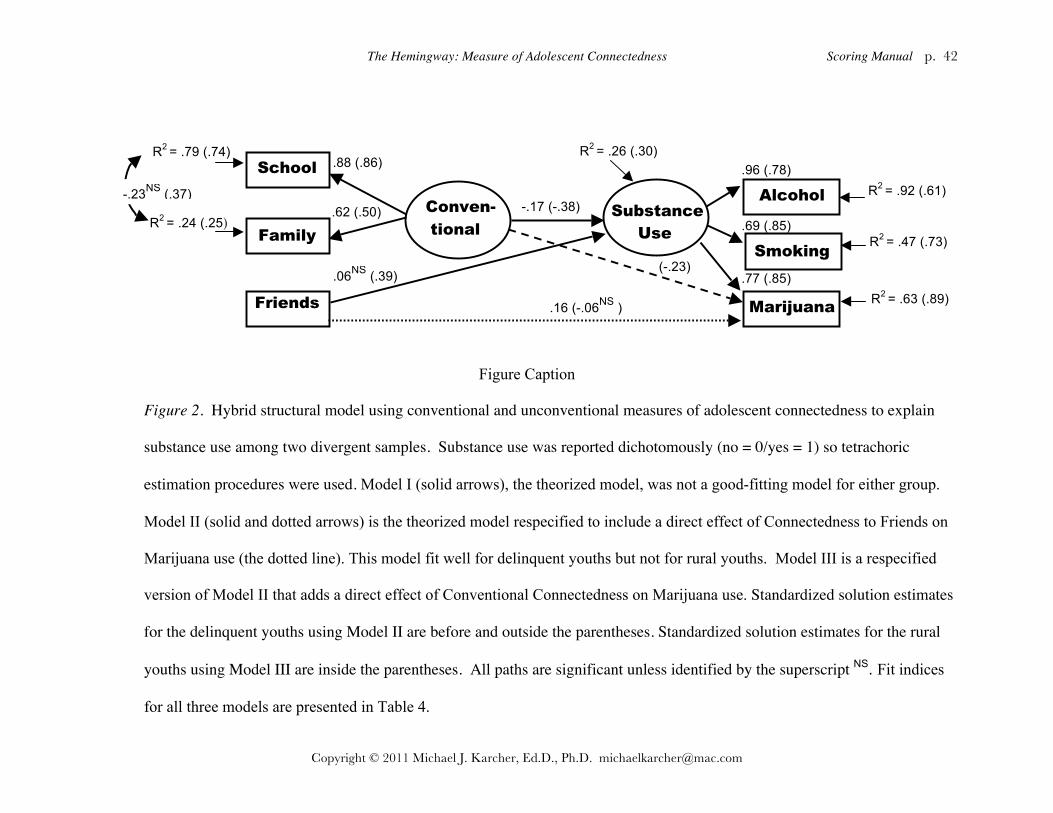
The Hemingway: Measure of Adolescent Connectedness Scoring Manual p. 42
Copyright © 2011 Michael J. Karcher, Ed.D., Ph.D. [email protected]
Figure Caption
Figure 2. Hybrid structural model using conventional and unconventional measures of adolescent connectedness to explain
substance use among two divergent samples. Substance use was reported dichotomously (no = 0/yes = 1) so tetrachoric
estimation procedures were used. Model I (solid arrows), the theorized model, was not a good-fitting model for either group.
Model II (solid and dotted arrows) is the theorized model respecified to include a direct effect of Connectedness to Friends on
Marijuana use (the dotted line). This model fit well for delinquent youths but not for rural youths. Model III is a respecified
version of Model II that adds a direct effect of Conventional Connectedness on Marijuana use. Standardized solution estimates
for the delinquent youths using Model II are before and outside the parentheses. Standardized solution estimates for the rural
youths using Model III are inside the parentheses. All paths are significant unless identified by the superscript NS. Fit indices
for all three models are presented in Table 4.
Conven-
tional
.88 (.86)
.06NS (.39)
.62 (.50) Substance Use
.96 (.78)
.69 (.85)
.77 (.85)
-.17 (-.38)
(-.23)
.16 (-.06NS )
R2 = .92 (.61)
R2 = .47 (.73)
R2 = .63 (.89)
R2 = .26 (.30)
Alcohol
Smoking
Marijuana
School
Family
Friends
R2 = .24 (.25)
R2 = .79 (.74)
-.23NS (.37)

The Hemingway: Measure of Adolescent Connectedness Scoring Manual p. 43
Copyright © 2011 Michael J. Karcher, Ed.D., Ph.D. [email protected]
IX. THE HYPOTHESIZED ROLE OF SOCIAL COGNITION IN CONNECTEDNESS Cognition Interpretations Caring of connectedness Conduct The two primary ways of connecting measured by the Hemingway are connection through conduct (activity) and caring (positive affect towards). Most other scales of "connectedness" refer only to the affective bond or sense of belonging--they do not measure active involvement in relationships, places or views of oneself. But, the degree to which one is physically and temporally active in a world reflects an important element of connection--one can feel positively toward siblings, for example, but if one has not contact with them, one's overall connection is clearly diminished. That may be why, when coupled with positive experiences (conduct), caring in that world is a stronger predictor of many real-world phenomenon, such as violence (negatively; Karcher, 2000b; Karcher, 2002). The inclusion of indicators active engagement (e.g., in reading, in school, in forming positive relationships with teachers) may partly explain why the Hemingway scales are so useful as outcome measures of social and psychological interventions. Behaviors change more quickly than attitudes or self-perceptions. For example, a program might discourage substance use or foster more positive peer interactions, that those behavioral changes may be observed (and self-reported) well before one's attitudes about (and affect toward) self and others change (see Karcher, 2005, 2008). While the Hemingway does not well capture the social cognitive aspects of connectedness that are the hallmark of Grotevant and Cooper's work (1998; also see Cooper, Grotevant, and Condon, 1983), we still believe social cognition is an important part of connection, as illustrated in the hypothesized model above. One's social cognition shapes his or her interpretations of connection (e.g., a teen with complex perspective-taking can factor in others' views of her in her sense of connection, where a more cognitively limited child cannot). Clearly, cognition or knowledge is another way of connecting to a world—through knowledge about self, others, or society. However, its omission from the Hemingway is not all bad. For example, in many domains, knowledge is not a good predictor of behavior or attitudes. In many cases, it serves as a mediator or moderator of the relationship between connection and caring, and given its developmental nature, requires developmentally sophisticated means of measuring it as it develops across childhood and adolescence. Cognitive-developmental stages are useful predictors of caring, but are not easily measurable by a few questionnaire items (Schultz and Selman 1998). From an intervention point of view, either action (conduct) in a world or information about a world can be promoted. Both are forms of connectedness that can be targeted to promote caring through interventions. Nevertheless, depending on the target of intervention, activity-based connectedness efforts may be more effective than didactic information-based interventions.

The Hemingway: Measure of Adolescent Connectedness Scoring Manual p. 44
Copyright © 2011 Michael J. Karcher, Ed.D., Ph.D. [email protected]
X. REFERENCES Baumeister, R. F., & Leary, M. R. (1995). The need to belong: Desire for interpersonal attachments
as a fundamental motivation. Psychological Bulletin, 117, 497-529. Bonny, A. E., Britto, M. T., Klostermann, B. K., Hornung, R. W., & Slap, G. B. (2000). School
disconnectedness: Identifying adolescents at risk. Pediatrics, 106(5), 1017-1021. Bronfenbrenner, U. (1979). The ecology of human development: Experiments by nature and design. Cambridge,
Massachusetts: Harvard University Press. Clark, K. E., & Ladd, G. W. (2000). Connectedness and autonomy support in parent-child
relationships: Links to children’s socioemotional orientation and peer relationships. Developmental Psychology, 36 (4), 485-498.
Cooper, C. R., Grotevant, H. D., & Condon, S. M. (1983). Individuality and connectedness in the family as a context for adolescent identity formation and role-taking skill. New Directions for Child Development, 22, 43-59.
DuBois, D. (1996). Early adolescent self-esteem: A developmental-ecological framework and assessment strategy. Journal of Research on Adolescence 6(4) 543-579.
Erikson, E. H. (1967). Identity: Youth in crisis. New York: Norton. Gadamer, H. G. (1975). Truth and method. New York, Continuum. Gadamer, H. G. (1993). Reason in the age of science. Cambridge, MA, MIT Press. Grotevant, H. D., & Cooper, C. R. (1998). Individuality and connectedness in adolescent
development: Review and prospects for research on identity, relationships, and context. In E. Skoe & A. von der Lippe (Eds.), Personality development in adolescence: A cross national and life span perspective (pp. 3-37). New York: Routledge.
Guisinger, S., & Blatt, S. J. (1994). Individuality and relatedness: Evolution of a fundamental dialectic. American Psychologist, 49(2), 104-111.
Hagerty, B. M. K., Lynch-Sauer, J., Patusky, K. L., & Bouwsema, M. (1993). An emerging theory of human relatedness. IMAGE: Journal of Nursing Scholarship, 25(4), 291-295.
Harter, S., Waters, P. L., Pettitt, N. W., Kofkin, J., & Jordan, J. (1997). Autonomy and connectedness dimensions of relationship styles in men and women. Journal of Social and Personal Relationships, 14(2), 147-164.
Harter, S. (1999). The construction of the self: A developmental perspective. NY: Guilford. Hawkins, J. D., Catalano, R. F., & Miller, J. Y. (1992). Risk and protective factors for alcohol and other
drug problems in adolescence and early adulthood: Implications for substance abuse prevention. Psychological Bulletin, 112(1), 64-105.
Hirschi, T. (1969). Causes of delinquency. Berkeley: University of California Press. Jacobson, K. C., & Rowe, D. C. (1999). Genetic and environmental influences on the relationships
between family connectedness, school connectedness, and adolescent depressed mood: Sex differences. Developmental Psychology, 35(4), 926-939.
Jessor, R. (1984). Adolescent development and behavioral health. In J. D. Matarazzo & S. M. Weiss & J. A. Herd & N. E. Miller & S. M. Weiss (Eds.), Behavioral health: A handbook of health enhancement and disease prevention (pp. 69-90). New York: Wiley.
Jessor, R. (1993). Successful adolescent development among youth in high-risk settings. American Psychologist, 48, 117-126.
Jessor, R., & Jessor, S. L. (1977). Problem behavior and psychological development: A longitudinal study of youth. New York: Academic Press.
Karcher, M. J. (2003). The Hemingway: Measure of Adolescent Connectedness: Validation studies. ERIC no. ED477969; ERIC/CASS no. CG032433.
The Hemingway: Measure of Adolescent Connectedness Scoring Manual p. 45
Copyright © 2011 Michael J. Karcher, Ed.D., Ph.D. [email protected]
Karcher, M. J. (2002b). The cycle of violence and disconnection among rural middle school students: Teacher disconnection as a consequence of violence. The Journal of School Violence, 1.
Karcher, M. J. (2004). Connectedness and school violence: A framework for developmental interventions. In E. Gerler (Ed.), Handbook of school violence (pp. 7-42). Binghamton, NY: Haworth Press.
Karcher, M. J. & L. Finn. (2005). How connectedness contributes to experimental smoking among rural youth: Developmental and ecological analyses. Journal of Primary Prevention, 26, 25-36.
Karcher, M. J. (2005). The effects of school-based developmental mentoring and mentors' attendance on mentees' self-esteem, behavior, and connectedness. Psychology in the Schools, 42, 65-77.
Karcher, M. J. (2008). The Cross-Age Mentoring Program (CAMP): A developmental intervention for promoting students' connectedness across grade levels. Professional School Counseling, 12(2), 137.
Karcher, M. (2009). Increases in academic connectedness and self-esteem among high school students who serve as cross-age peer mentors. Professional School Counseling, 12(4), 292-299.
Karcher, M. J. & Benne, K. (2008). Erik and Joan Eriksons’ approach to human development in counseling. In K. Kraus (Ed.), Lifespan development in action: A case study approach for counseling professionals (pp. 199-238). Lahaska Press.
Karcher, M.J., Davis, C., & Powell, B. (2002). Developmental mentoring in the schools: Testing connectedness as a mediating variable in the promotion of academic achievement. The School Community Journal, Spring.
Karcher, M. J., Holcomb, M. & Zambrano, E. (2008). Measuring adolescent connectedness: A guide for school-based assessment and program evaluation. In H. L. K. Coleman & C. Yeh (Eds.), Handbook of School Counseling (pp. 649-669). Mahwah: Lawrence Erlbaum.
Karcher, M. J, & Lee, Y. (2002). Connectedness among Taiwanese middle school students: A validation study of the Hemingway Measure of Adolescent Connectedness. Asia Pacific Education Review, 3(1), 95-114.
Karcher, M. J. & Jensen, A. (2002). Depression and connectedness in adolescence. Manuscript submitted for publication.
Karcher, M. J., & Santos, K. (2011). Promoting connectedness through developmental interventions: Adapting the Cross-Age Mentoring Program (CAMP) for youth in Asia. Asian Journal of Counseling, 18 (1/2), 125-147.
Karcher, M. J., & Sass, D. (2010). A multicultural assessment of adolescent connectedness: Testing measurement invariance across gender and ethnicity. Journal of Counseling Psychology, 57(3), 274-289. doi: 10.1037/a0019357
Karcher, M. J. & Stone, C. (2002). Promoting connectedness to prevent dropout: The developmental approach of the Work and Learn Program. Manuscript submitted for publication.
Kohut, H. (1977). Restoration of the self. New York, International Universities Press. Kohut, H., & Elson, M. (1987). The Kohut seminars on self psychology and psychotherapy with adolescents and
young adults. New York: W. W. Norton & Co, Inc. Kohut, H. and E. S. Wolf (1978). The disorders of the self and their treatment: An outline.
International Journal of Psycho-Analysis 59(4): 413-425. Lee, R. M., & Robbins, S. B. (1995). Measuring belongingness: The Social Connectedness and the
Social Assurance scales. Journal of Counseling Psychology, 42(2), 232-241. Lee, R. M., & Robbins, S. B. (1998). The relationship between social connectedness and anxiety,
self-esteem, and social identity. Journal of Counseling Psychology, 45(3), 338-345. Lynch, M., & Cicchetti, D. (1997). Children's relationships with adults and peers: An examination
of elementary and junior high school students. Journal of School Psychology, 35(1), 81-89.
The Hemingway: Measure of Adolescent Connectedness Scoring Manual p. 46
Copyright © 2011 Michael J. Karcher, Ed.D., Ph.D. [email protected]
Miller, L. S. (1995). An American imperative: Accelerating minority educational advancement. New Haven: Yale University Press.
Nakkula, M., & Selman, R. (1991). How people "treat" each other: Pair therapy as a context for the development of interpersonal ethics. In J. L. Gewirtz and W. M. Kurtines (Ed.), Handbook of moral behavior and development, Vol. 3: Application (pp. 179-211). Hillsdale, NJ: Erlbaum.
Resnick, M. D., Bearman, P. S., Blum, Robert, W., Bauman, K. E., Harris, K. M., Jones, J., Tabor, J., Beuhring, T., Sieving, R. E., Shew, M., Ireland, M., Bearinger, L. H., & Udry, J. R. (1997). Protecting adolescents from harm: Findings from the National Longitudinal Study on Adolescent Health. Journal of the American Medical Association, 278 (10), 823-832.
Sass, D. A., Castro-Villarreal, F., McWhirter, B. T., McWhirter, E. H., & Karcher, M. J. (2011). A cross-cultural assessment of school connectedness: Testing measurement invariance with United States and Chilean adolescents. Journal of Psychoeducational Assessment, 29(5), doi:10.1177/0734282910391067
Schultz, L. and R. Selman (1998). Toward the Construction of Two Developmental Social Competence Measures: The GSID Relationship Questionnaires. Unpublished manual. Cambridge, MA: Harvard Graduate School of Education.
Schultz, L. H., Barr, D. J., & Selman, R. L. (2001). The value of a developmental approach to evaluating character development programmes: An outcome study of Facing History and Ourselves. Journal of Moral Education, 30(1), 3-27.
Schultz, L. H., Selman, R. L., & LaRusso, M. D. (2003). The assessment of psychosocial maturity in children and adolescents: Implications for the evaluation of school-based character education programs. Journal of Research in Character Education, 1(2), 67-87.
Winnicot, D. W. (1953). The capacity to be alone. In The maturational processes and the facilitating environment. New York: International Universities Press.
Youniss, J., & Smollar, J. (1985). Adolescent relations with mothers, fathers, and friends. Chicago: University of Chicago Press.

The Hemingway: Measure of Adolescent Connectedness Scoring Manual p. 47
Copyright © 2011 Michael J. Karcher, Ed.D., Ph.D. [email protected]
XI. Scoring the Hemingway Measures of Adolescent Connectedness Subsequent pages include the HEMINGWAY Measures of Connectedness MAC5 1. Adolescent Long version (includes race, religion, romantic partner, and parent scales) 2. Adolescent Short version ends with item 57 (so just omit last 20 questions) 3. Pre-Adolescent (Child version 4) with scoring instructions Scoring syntax is provided as well. To use it, copy this text into an SPSS syntax file. Save the syntax file. Highlight all of the text in the file after opening the data file you have created (using the variable names shown in the syntax files) and then click he sideways arrow in the syntax menu bar. An output file will be generated with reliability estimates (after the negatively worded items have been reversed) and subscales will be created in your spss data file.

The Hemingway: Measure of Adolescent Connectedness Scoring Manual p. 48
Copyright © 2011 Michael J. Karcher, Ed.D., Ph.D. [email protected]
The Hemingway Measure of Adolescent Name/Number:____________ Date:_____ Connectedness (MAC 5 Adolescent, grades 6-12) Sex: Male___ Female__ Grade:___ Age:____
M. J. Karcher, Ed.D., Ph.D., Cultural & Developmental Institute Race/ethnicity: White__ Black__ Hispanic__
Who do you live with? mother father Asian__ Bi-racial__ Native American__ Other: _____ both other: _____________ Please use this survey to tell us about yourself. Read each statement. CIRCLE the number that best describes how true that statement is for you or how much you agree with it. If a statement is unclear to you, ask for an explanation. If it still unclear, put a " ?". “How TRUE about you is each sentence?" Not at all1 Not really2 Sort of true3 True4 Very true5
Not at all Not really Sort of True Very true
(1) I like hanging out around where I live (like my neighborhood). 1 2 3 4 5
(2) Spending time with friends is not so important to me. 1 2 3 4 5
(3) I can name 5 things that others like about me. 1 2 3 4 5
(4) My family has fun together. 1 2 3 4 5
(5) I have a lot of fun with my brother(s) or sister(s).
(leave blank if you have none.) 1 2 3 4 5
(6) I work hard at school. 1 2 3 4 5
(7) My classmates often bother me. 1 2 3 4 5
(8) I care what my teachers think of me. 1 2 3 4 5
(9) I will have a good future. 1 2 3 4 5
(10) I enjoy spending time by myself reading. 1 2 3 4 5
Not at all Not really Sort of True Very true (11) I spend a lot of time with kids around where I live. 1 2 3 4 5
(12) I have friends I'm really close to and trust completely. 1 2 3 4 5
(13) There is not much that is unique or special about me. 1 2 3 4 5
(14) It is important that my parents trust me. 1 2 3 4 5
(15) I feel close to my brother(s) or sister(s). 1 2 3 4 5 (leave blank if you have none.) (16) I enjoy being at school. 1 2 3 4 5
(17) I like pretty much all of the other kids in my grade. 1 2 3 4 5
(18) I do not get along with some of my teachers. 1 2 3 4 5
(19) Doing well in school will help me in the future. 1 2 3 4 5
(20) I like to read. 1 2 3 4 5
Not at all Not really Sort of True Very true

The Hemingway: Measure of Adolescent Connectedness Scoring Manual p. 49
Copyright © 2011 Michael J. Karcher, Ed.D., Ph.D. [email protected]
Not at all Not really Sort of True Very true
(21) I get along with the kids in my neighborhood. 1 2 3 4 5
(22) Spending time with my friends is a big part of my life. 1 2 3 4 5
(23) I can name 3 things that other kids like about me. 1 2 3 4 5
(24) I enjoy spending time with my parents. 1 2 3 4 5
(25) I enjoy spending time with my brothers/sisters. 1 2 3 4 5 (leave blank if you have none.) (26) I get bored in school a lot. 1 2 3 4 5
(27) I like working with my classmates. 1 2 3 4 5
(28) I want to be respected by my teachers. 1 2 3 4 5
(29) I do things outside of school to prepare for my future. 1 2 3 4 5
(30) I never read books in my free time. 1 2 3 4 5
(31) I often spend time playing or doing things in my neighborhood. 1 2 3 4 5
(32) My friends and I talk openly with each other about personal things. 1 2 3 4 5
(33) I really like who I am. 1 2 3 4 5
Not at all Not really Sort of True Very true
(34) My parents and I disagree about many things. 1 2 3 4 5
(35) I try to spend time with my brothers/sisters when I can. 1 2 3 4 5
(36) I do well in school. 1 2 3 4 5
(37) I get along well with the other students in my classes. 1 2 3 4 5
(38) I try to get along with my teachers. 1 2 3 4 5
(39) I do lots of things to prepare for my future. 1 2 3 4 5
(40) I often read when I have free time. 1 2 3 4 5
(41) I hang out a lot with kids in my neighborhood. 1 2 3 4 5
(42) I spend as much time as I can with my friends. 1 2 3 4 5
(43) I have special hobbies, skills, or talents. 1 2 3 4 5
(44) My parents and I get along well. 1 2 3 4 5
(45) I try to avoid being around my brother/sister(s). 1 2 3 4 5
(leave blank if you have none.)
(46) I feel good about myself when I am at school. 1 2 3 4 5
(47) I am liked by my classmates. 1 2 3 4 5
(48) I always try hard to earn my teachers’ trust. 1 2 3 4 5
Not at all Not really Sort of True Very true
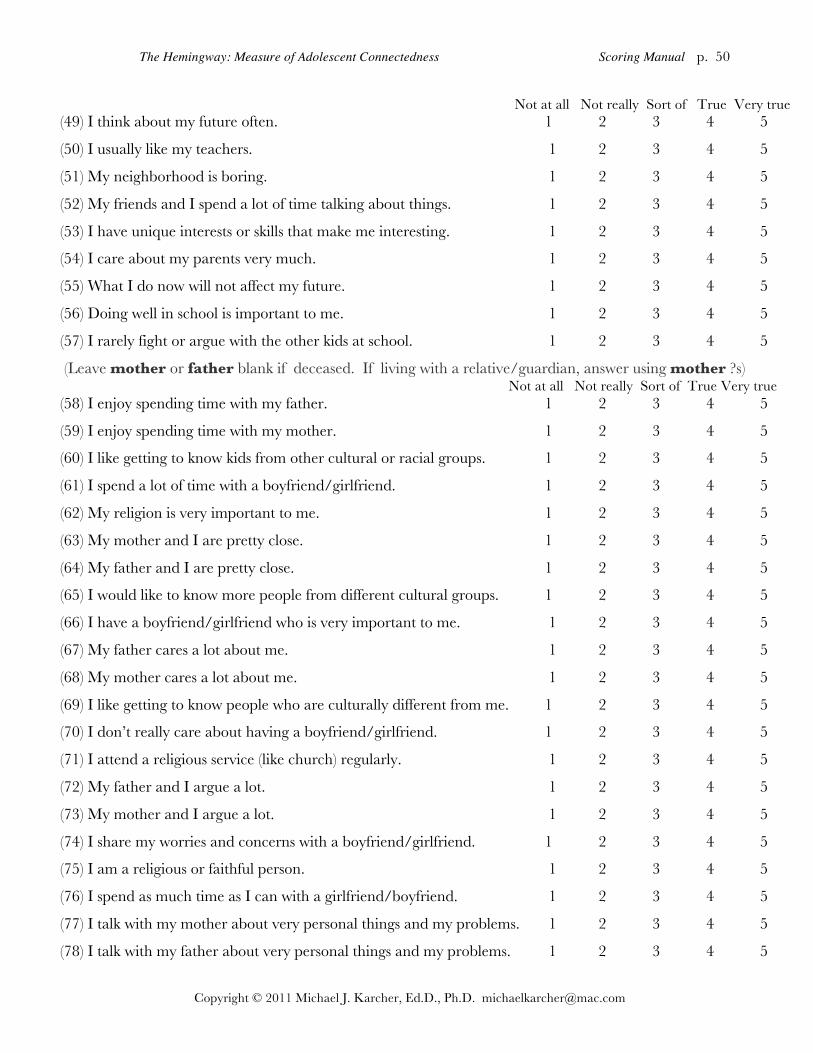
The Hemingway: Measure of Adolescent Connectedness Scoring Manual p. 50
Copyright © 2011 Michael J. Karcher, Ed.D., Ph.D. [email protected]
Not at all Not really Sort of True Very true (49) I think about my future often. 1 2 3 4 5
(50) I usually like my teachers. 1 2 3 4 5
(51) My neighborhood is boring. 1 2 3 4 5
(52) My friends and I spend a lot of time talking about things. 1 2 3 4 5
(53) I have unique interests or skills that make me interesting. 1 2 3 4 5
(54) I care about my parents very much. 1 2 3 4 5
(55) What I do now will not affect my future. 1 2 3 4 5
(56) Doing well in school is important to me. 1 2 3 4 5
(57) I rarely fight or argue with the other kids at school. 1 2 3 4 5
(Leave mother or father blank if deceased. If living with a relative/guardian, answer using mother ?s) Not at all Not really Sort of True Very true (58) I enjoy spending time with my father. 1 2 3 4 5
(59) I enjoy spending time with my mother. 1 2 3 4 5
(60) I like getting to know kids from other cultural or racial groups. 1 2 3 4 5
(61) I spend a lot of time with a boyfriend/girlfriend. 1 2 3 4 5
(62) My religion is very important to me. 1 2 3 4 5
(63) My mother and I are pretty close. 1 2 3 4 5
(64) My father and I are pretty close. 1 2 3 4 5
(65) I would like to know more people from different cultural groups. 1 2 3 4 5
(66) I have a boyfriend/girlfriend who is very important to me. 1 2 3 4 5
(67) My father cares a lot about me. 1 2 3 4 5
(68) My mother cares a lot about me. 1 2 3 4 5
(69) I like getting to know people who are culturally different from me. 1 2 3 4 5
(70) I don’t really care about having a boyfriend/girlfriend. 1 2 3 4 5
(71) I attend a religious service (like church) regularly. 1 2 3 4 5
(72) My father and I argue a lot. 1 2 3 4 5
(73) My mother and I argue a lot. 1 2 3 4 5
(74) I share my worries and concerns with a boyfriend/girlfriend. 1 2 3 4 5
(75) I am a religious or faithful person. 1 2 3 4 5
(76) I spend as much time as I can with a girlfriend/boyfriend. 1 2 3 4 5
(77) I talk with my mother about very personal things and my problems. 1 2 3 4 5
(78) I talk with my father about very personal things and my problems. 1 2 3 4 5
The Hemingway: Measure of Adolescent Connectedness Scoring Manual p. 51
Copyright © 2011 Michael J. Karcher, Ed.D., Ph.D. [email protected]
SPSS Syntax for the Adolescent Version—Recoding, Reliability Estimates, Scale Creation:
Couple of notes: If you omit any scales from your survey, then you need to omit their corresponding variables from the syntax. For example, if you don’t ask about connectedness to romantic partners, then you won’t have a v70, so when you run the syntax as you see it below to recode the variables, it will stall. You will see in your output that you are missing a variable that is noted in your syntax, so the reversal or recoding did not take place for any variables. So be sure to check your output to be sure you recoded (though, if you did not, you will see the negative loadings of these items on the scale in your alpha estimate output, which is generated from the next set of syntax). So, be sure to omit from your syntax code any variables you do not have data for before running the syntax. If you use all of the items in the survey, then you should be able to copy the syntax below, paste it into a new syntax window file, highlight it, and click on the “run” (triangle) icon on the menu bar. If you are copying this syntax from a pdf version of this manual, you will see that you may “capture” the page headers (e.g., “Hemingway Manual p. 30”). So you will need to delete this text from the syntax before running it. Finally, make sure that the names of the variables in your SPSS file are exactly the same as these below or else the syntax will not work. For example, you must use v2 for variable 2, not “preV2” or “V_2”. Be sure they are exact. If you use a pdf scantron version that has an “unsure” response option (that is coded as 6), then you need to leave these blank in your data set. Empty cells will be considered missing data, whether they are the 6 that you delete or a non-response by the youth. Make sure you have gotten rid of all 6s (and that you entered the data correctly) by running descriptives for your variables and making sure the range on the scales and variables does not go above 5.
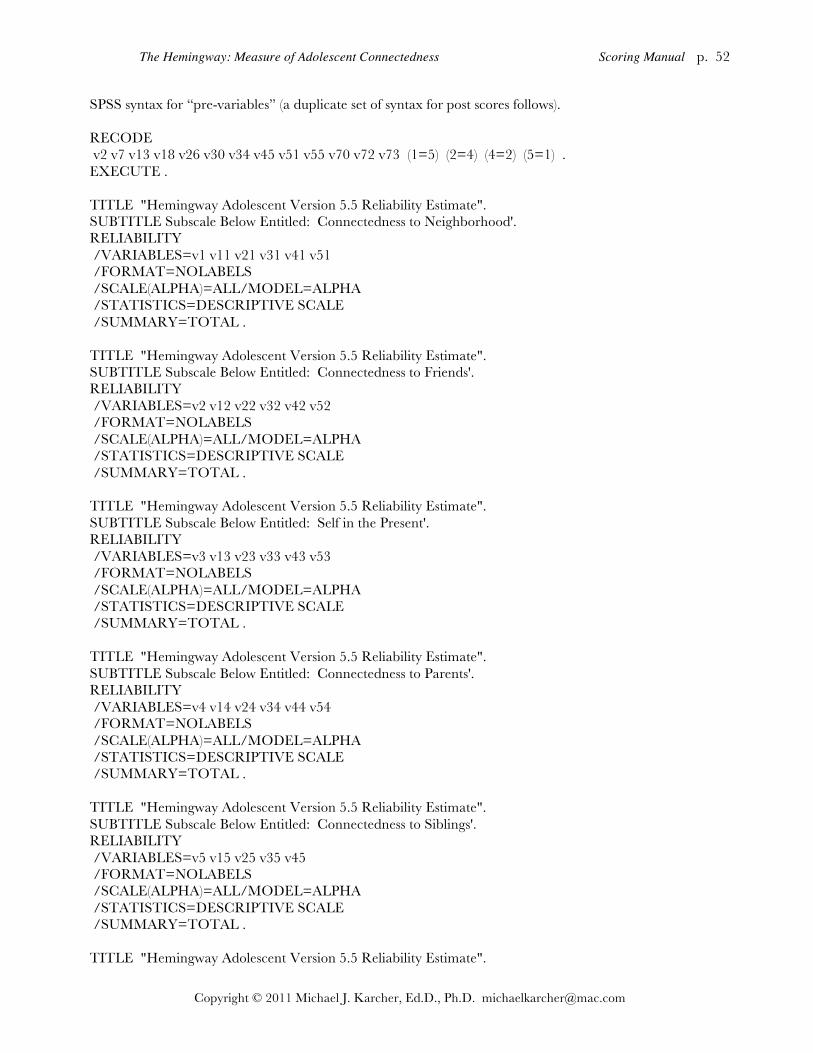
The Hemingway: Measure of Adolescent Connectedness Scoring Manual p. 52
Copyright © 2011 Michael J. Karcher, Ed.D., Ph.D. [email protected]
SPSS syntax for “pre-variables” (a duplicate set of syntax for post scores follows). RECODE v2 v7 v13 v18 v26 v30 v34 v45 v51 v55 v70 v72 v73 (1=5) (2=4) (4=2) (5=1) . EXECUTE . TITLE "Hemingway Adolescent Version 5.5 Reliability Estimate". SUBTITLE Subscale Below Entitled: Connectedness to Neighborhood'. RELIABILITY /VARIABLES=v1 v11 v21 v31 v41 v51 /FORMAT=NOLABELS /SCALE(ALPHA)=ALL/MODEL=ALPHA /STATISTICS=DESCRIPTIVE SCALE /SUMMARY=TOTAL . TITLE "Hemingway Adolescent Version 5.5 Reliability Estimate". SUBTITLE Subscale Below Entitled: Connectedness to Friends'. RELIABILITY /VARIABLES=v2 v12 v22 v32 v42 v52 /FORMAT=NOLABELS /SCALE(ALPHA)=ALL/MODEL=ALPHA /STATISTICS=DESCRIPTIVE SCALE /SUMMARY=TOTAL . TITLE "Hemingway Adolescent Version 5.5 Reliability Estimate". SUBTITLE Subscale Below Entitled: Self in the Present'. RELIABILITY /VARIABLES=v3 v13 v23 v33 v43 v53 /FORMAT=NOLABELS /SCALE(ALPHA)=ALL/MODEL=ALPHA /STATISTICS=DESCRIPTIVE SCALE /SUMMARY=TOTAL . TITLE "Hemingway Adolescent Version 5.5 Reliability Estimate". SUBTITLE Subscale Below Entitled: Connectedness to Parents'. RELIABILITY /VARIABLES=v4 v14 v24 v34 v44 v54 /FORMAT=NOLABELS /SCALE(ALPHA)=ALL/MODEL=ALPHA /STATISTICS=DESCRIPTIVE SCALE /SUMMARY=TOTAL . TITLE "Hemingway Adolescent Version 5.5 Reliability Estimate". SUBTITLE Subscale Below Entitled: Connectedness to Siblings'. RELIABILITY /VARIABLES=v5 v15 v25 v35 v45 /FORMAT=NOLABELS /SCALE(ALPHA)=ALL/MODEL=ALPHA /STATISTICS=DESCRIPTIVE SCALE /SUMMARY=TOTAL . TITLE "Hemingway Adolescent Version 5.5 Reliability Estimate".
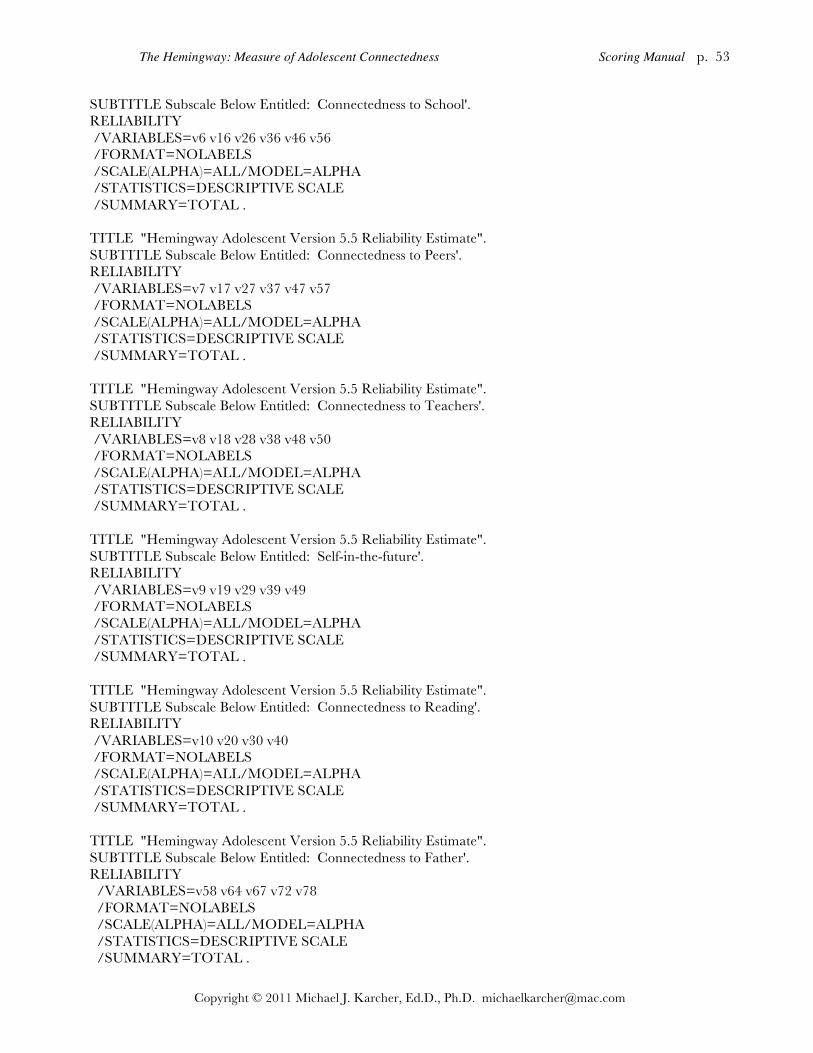
The Hemingway: Measure of Adolescent Connectedness Scoring Manual p. 53
Copyright © 2011 Michael J. Karcher, Ed.D., Ph.D. [email protected]
SUBTITLE Subscale Below Entitled: Connectedness to School'. RELIABILITY /VARIABLES=v6 v16 v26 v36 v46 v56 /FORMAT=NOLABELS /SCALE(ALPHA)=ALL/MODEL=ALPHA /STATISTICS=DESCRIPTIVE SCALE /SUMMARY=TOTAL . TITLE "Hemingway Adolescent Version 5.5 Reliability Estimate". SUBTITLE Subscale Below Entitled: Connectedness to Peers'. RELIABILITY /VARIABLES=v7 v17 v27 v37 v47 v57 /FORMAT=NOLABELS /SCALE(ALPHA)=ALL/MODEL=ALPHA /STATISTICS=DESCRIPTIVE SCALE /SUMMARY=TOTAL . TITLE "Hemingway Adolescent Version 5.5 Reliability Estimate". SUBTITLE Subscale Below Entitled: Connectedness to Teachers'. RELIABILITY /VARIABLES=v8 v18 v28 v38 v48 v50 /FORMAT=NOLABELS /SCALE(ALPHA)=ALL/MODEL=ALPHA /STATISTICS=DESCRIPTIVE SCALE /SUMMARY=TOTAL . TITLE "Hemingway Adolescent Version 5.5 Reliability Estimate". SUBTITLE Subscale Below Entitled: Self-in-the-future'. RELIABILITY /VARIABLES=v9 v19 v29 v39 v49 /FORMAT=NOLABELS /SCALE(ALPHA)=ALL/MODEL=ALPHA /STATISTICS=DESCRIPTIVE SCALE /SUMMARY=TOTAL . TITLE "Hemingway Adolescent Version 5.5 Reliability Estimate". SUBTITLE Subscale Below Entitled: Connectedness to Reading'. RELIABILITY /VARIABLES=v10 v20 v30 v40 /FORMAT=NOLABELS /SCALE(ALPHA)=ALL/MODEL=ALPHA /STATISTICS=DESCRIPTIVE SCALE /SUMMARY=TOTAL . TITLE "Hemingway Adolescent Version 5.5 Reliability Estimate". SUBTITLE Subscale Below Entitled: Connectedness to Father'. RELIABILITY /VARIABLES=v58 v64 v67 v72 v78 /FORMAT=NOLABELS /SCALE(ALPHA)=ALL/MODEL=ALPHA /STATISTICS=DESCRIPTIVE SCALE /SUMMARY=TOTAL .
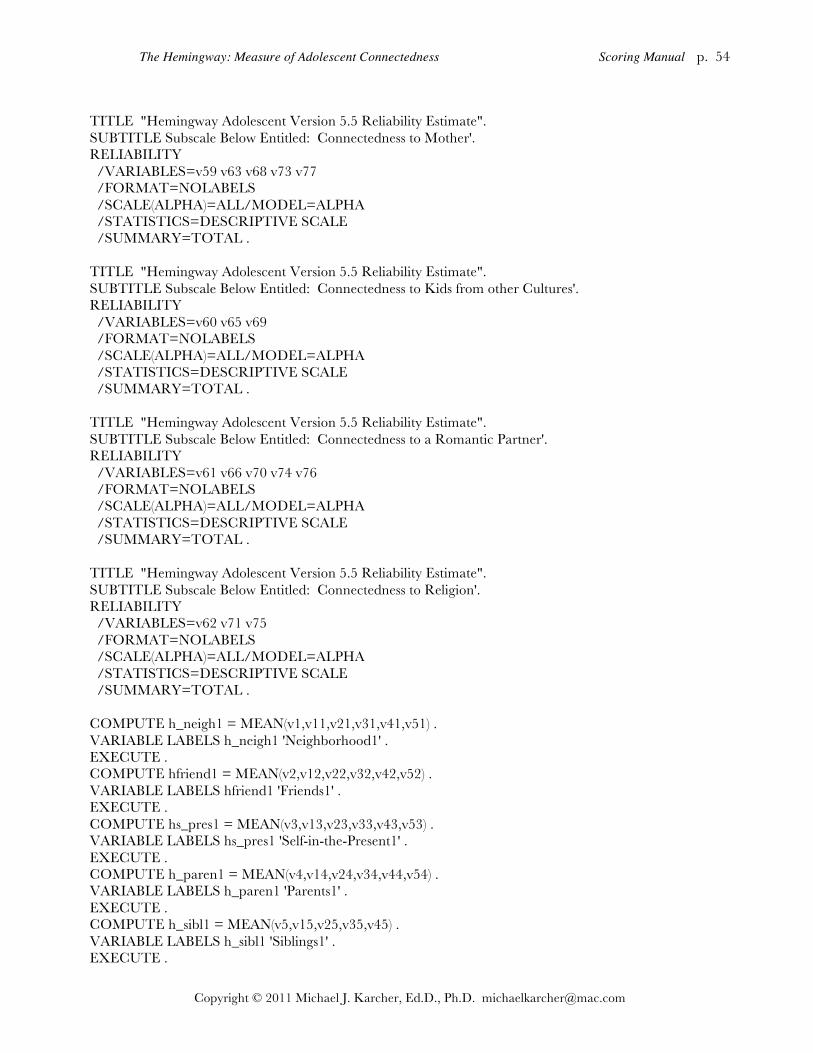
The Hemingway: Measure of Adolescent Connectedness Scoring Manual p. 54
Copyright © 2011 Michael J. Karcher, Ed.D., Ph.D. [email protected]
TITLE "Hemingway Adolescent Version 5.5 Reliability Estimate". SUBTITLE Subscale Below Entitled: Connectedness to Mother'. RELIABILITY /VARIABLES=v59 v63 v68 v73 v77 /FORMAT=NOLABELS /SCALE(ALPHA)=ALL/MODEL=ALPHA /STATISTICS=DESCRIPTIVE SCALE /SUMMARY=TOTAL . TITLE "Hemingway Adolescent Version 5.5 Reliability Estimate". SUBTITLE Subscale Below Entitled: Connectedness to Kids from other Cultures'. RELIABILITY /VARIABLES=v60 v65 v69 /FORMAT=NOLABELS /SCALE(ALPHA)=ALL/MODEL=ALPHA /STATISTICS=DESCRIPTIVE SCALE /SUMMARY=TOTAL . TITLE "Hemingway Adolescent Version 5.5 Reliability Estimate". SUBTITLE Subscale Below Entitled: Connectedness to a Romantic Partner'. RELIABILITY /VARIABLES=v61 v66 v70 v74 v76 /FORMAT=NOLABELS /SCALE(ALPHA)=ALL/MODEL=ALPHA /STATISTICS=DESCRIPTIVE SCALE /SUMMARY=TOTAL . TITLE "Hemingway Adolescent Version 5.5 Reliability Estimate". SUBTITLE Subscale Below Entitled: Connectedness to Religion'. RELIABILITY /VARIABLES=v62 v71 v75 /FORMAT=NOLABELS /SCALE(ALPHA)=ALL/MODEL=ALPHA /STATISTICS=DESCRIPTIVE SCALE /SUMMARY=TOTAL . COMPUTE h_neigh1 = MEAN(v1,v11,v21,v31,v41,v51) . VARIABLE LABELS h_neigh1 'Neighborhood1' . EXECUTE . COMPUTE hfriend1 = MEAN(v2,v12,v22,v32,v42,v52) . VARIABLE LABELS hfriend1 'Friends1' . EXECUTE . COMPUTE hs_pres1 = MEAN(v3,v13,v23,v33,v43,v53) . VARIABLE LABELS hs_pres1 'Self-in-the-Present1' . EXECUTE . COMPUTE h_paren1 = MEAN(v4,v14,v24,v34,v44,v54) . VARIABLE LABELS h_paren1 'Parents1' . EXECUTE . COMPUTE h_sibl1 = MEAN(v5,v15,v25,v35,v45) . VARIABLE LABELS h_sibl1 'Siblings1' . EXECUTE .
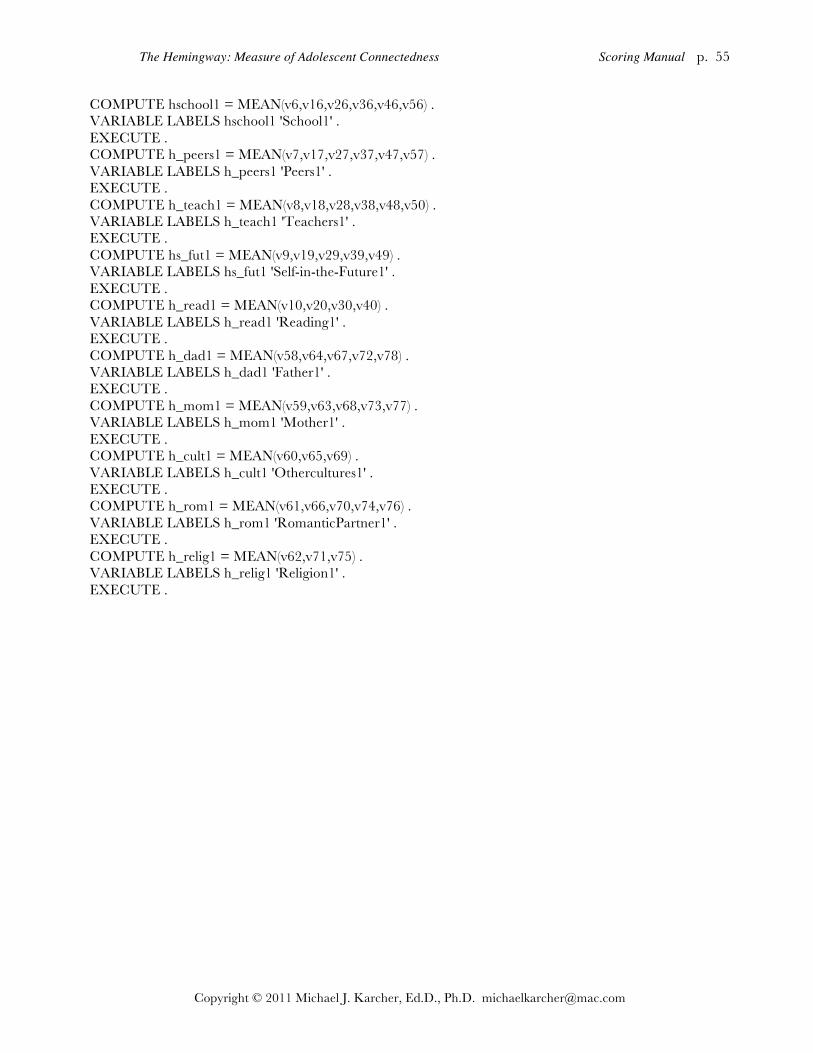
The Hemingway: Measure of Adolescent Connectedness Scoring Manual p. 55
Copyright © 2011 Michael J. Karcher, Ed.D., Ph.D. [email protected]
COMPUTE hschool1 = MEAN(v6,v16,v26,v36,v46,v56) . VARIABLE LABELS hschool1 'School1' . EXECUTE . COMPUTE h_peers1 = MEAN(v7,v17,v27,v37,v47,v57) . VARIABLE LABELS h_peers1 'Peers1' . EXECUTE . COMPUTE h_teach1 = MEAN(v8,v18,v28,v38,v48,v50) . VARIABLE LABELS h_teach1 'Teachers1' . EXECUTE . COMPUTE hs_fut1 = MEAN(v9,v19,v29,v39,v49) . VARIABLE LABELS hs_fut1 'Self-in-the-Future1' . EXECUTE . COMPUTE h_read1 = MEAN(v10,v20,v30,v40) . VARIABLE LABELS h_read1 'Reading1' . EXECUTE . COMPUTE h_dad1 = MEAN(v58,v64,v67,v72,v78) . VARIABLE LABELS h_dad1 'Father1' . EXECUTE . COMPUTE h_mom1 = MEAN(v59,v63,v68,v73,v77) . VARIABLE LABELS h_mom1 'Mother1' . EXECUTE . COMPUTE h_cult1 = MEAN(v60,v65,v69) . VARIABLE LABELS h_cult1 'Othercultures1' . EXECUTE . COMPUTE h_rom1 = MEAN(v61,v66,v70,v74,v76) . VARIABLE LABELS h_rom1 'RomanticPartner1' . EXECUTE . COMPUTE h_relig1 = MEAN(v62,v71,v75) . VARIABLE LABELS h_relig1 'Religion1' . EXECUTE .
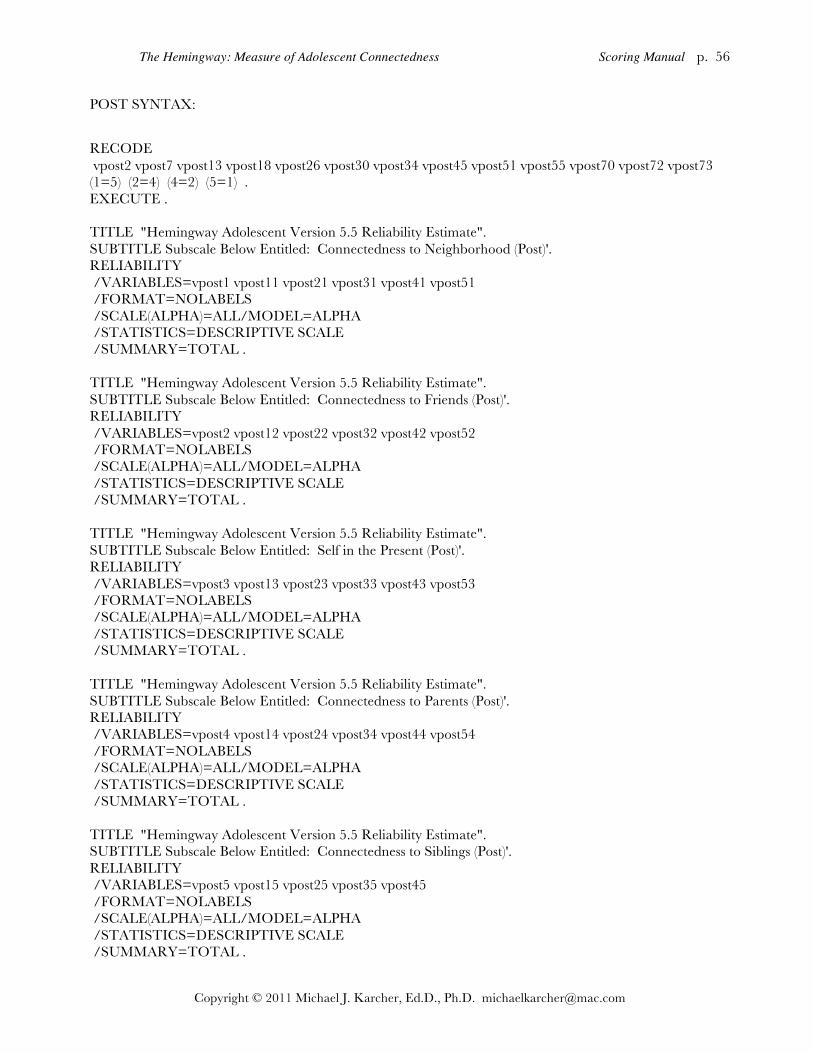
The Hemingway: Measure of Adolescent Connectedness Scoring Manual p. 56
Copyright © 2011 Michael J. Karcher, Ed.D., Ph.D. [email protected]
POST SYNTAX:
RECODE vpost2 vpost7 vpost13 vpost18 vpost26 vpost30 vpost34 vpost45 vpost51 vpost55 vpost70 vpost72 vpost73 (1=5) (2=4) (4=2) (5=1) . EXECUTE . TITLE "Hemingway Adolescent Version 5.5 Reliability Estimate". SUBTITLE Subscale Below Entitled: Connectedness to Neighborhood (Post)'. RELIABILITY /VARIABLES=vpost1 vpost11 vpost21 vpost31 vpost41 vpost51 /FORMAT=NOLABELS /SCALE(ALPHA)=ALL/MODEL=ALPHA /STATISTICS=DESCRIPTIVE SCALE /SUMMARY=TOTAL . TITLE "Hemingway Adolescent Version 5.5 Reliability Estimate". SUBTITLE Subscale Below Entitled: Connectedness to Friends (Post)'. RELIABILITY /VARIABLES=vpost2 vpost12 vpost22 vpost32 vpost42 vpost52 /FORMAT=NOLABELS /SCALE(ALPHA)=ALL/MODEL=ALPHA /STATISTICS=DESCRIPTIVE SCALE /SUMMARY=TOTAL . TITLE "Hemingway Adolescent Version 5.5 Reliability Estimate". SUBTITLE Subscale Below Entitled: Self in the Present (Post)'. RELIABILITY /VARIABLES=vpost3 vpost13 vpost23 vpost33 vpost43 vpost53 /FORMAT=NOLABELS /SCALE(ALPHA)=ALL/MODEL=ALPHA /STATISTICS=DESCRIPTIVE SCALE /SUMMARY=TOTAL . TITLE "Hemingway Adolescent Version 5.5 Reliability Estimate". SUBTITLE Subscale Below Entitled: Connectedness to Parents (Post)'. RELIABILITY /VARIABLES=vpost4 vpost14 vpost24 vpost34 vpost44 vpost54 /FORMAT=NOLABELS /SCALE(ALPHA)=ALL/MODEL=ALPHA /STATISTICS=DESCRIPTIVE SCALE /SUMMARY=TOTAL . TITLE "Hemingway Adolescent Version 5.5 Reliability Estimate". SUBTITLE Subscale Below Entitled: Connectedness to Siblings (Post)'. RELIABILITY /VARIABLES=vpost5 vpost15 vpost25 vpost35 vpost45 /FORMAT=NOLABELS /SCALE(ALPHA)=ALL/MODEL=ALPHA /STATISTICS=DESCRIPTIVE SCALE /SUMMARY=TOTAL .

The Hemingway: Measure of Adolescent Connectedness Scoring Manual p. 57
Copyright © 2011 Michael J. Karcher, Ed.D., Ph.D. [email protected]
TITLE "Hemingway Adolescent Version 5.5 Reliability Estimate". SUBTITLE Subscale Below Entitled: Connectedness to School (Post)'. RELIABILITY /VARIABLES=vpost6 vpost16 vpost26 vpost36 vpost46 vpost56 /FORMAT=NOLABELS /SCALE(ALPHA)=ALL/MODEL=ALPHA /STATISTICS=DESCRIPTIVE SCALE /SUMMARY=TOTAL . TITLE "Hemingway Adolescent Version 5.5 Reliability Estimate". SUBTITLE Subscale Below Entitled: Connectedness to Peers (Post)'. RELIABILITY /VARIABLES=vpost7 vpost17 vpost27 vpost37 vpost47 vpost57 /FORMAT=NOLABELS /SCALE(ALPHA)=ALL/MODEL=ALPHA /STATISTICS=DESCRIPTIVE SCALE /SUMMARY=TOTAL . TITLE "Hemingway Adolescent Version 5.5 Reliability Estimate". SUBTITLE Subscale Below Entitled: Connectedness to Teachers (Post)'. RELIABILITY /VARIABLES=vpost8 vpost18 vpost28 vpost38 vpost48 vpost50 /FORMAT=NOLABELS /SCALE(ALPHA)=ALL/MODEL=ALPHA /STATISTICS=DESCRIPTIVE SCALE /SUMMARY=TOTAL . TITLE "Hemingway Adolescent Version 5.5 Reliability Estimate". SUBTITLE Subscale Below Entitled: Self-in-the-future (Post)'. RELIABILITY /VARIABLES=vpost9 vpost19 vpost29 vpost39 vpost49 /FORMAT=NOLABELS /SCALE(ALPHA)=ALL/MODEL=ALPHA /STATISTICS=DESCRIPTIVE SCALE /SUMMARY=TOTAL . TITLE "Hemingway Adolescent Version 5.5 Reliability Estimate". SUBTITLE Subscale Below Entitled: Connectedness to Reading (Post)'. RELIABILITY /VARIABLES=vpost10 vpost20 vpost30 vpost40 /FORMAT=NOLABELS /SCALE(ALPHA)=ALL/MODEL=ALPHA /STATISTICS=DESCRIPTIVE SCALE /SUMMARY=TOTAL . TITLE "Hemingway Adolescent Version 5.5 Reliability Estimate". SUBTITLE Subscale Below Entitled: Connectedness to Father (Post)'. RELIABILITY /VARIABLES=vpost58 vpost64 vpost67 vpost72 vpost78 /FORMAT=NOLABELS /SCALE(ALPHA)=ALL/MODEL=ALPHA

The Hemingway: Measure of Adolescent Connectedness Scoring Manual p. 58
Copyright © 2011 Michael J. Karcher, Ed.D., Ph.D. [email protected]
/STATISTICS=DESCRIPTIVE SCALE /SUMMARY=TOTAL . TITLE "Hemingway Adolescent Version 5.5 Reliability Estimate". SUBTITLE Subscale Below Entitled: Connectedness to Mother (Post)'. RELIABILITY /VARIABLES=vpost59 vpost63 vpost68 vpost73 vpost77 /FORMAT=NOLABELS /SCALE(ALPHA)=ALL/MODEL=ALPHA /STATISTICS=DESCRIPTIVE SCALE /SUMMARY=TOTAL . TITLE "Hemingway Adolescent Version 5.5 Reliability Estimate". SUBTITLE Subscale Below Entitled: Connectedness to Kids from other Cultures (Post)'. RELIABILITY /VARIABLES=vpost60 vpost65 vpost69 /FORMAT=NOLABELS /SCALE(ALPHA)=ALL/MODEL=ALPHA /STATISTICS=DESCRIPTIVE SCALE /SUMMARY=TOTAL . TITLE "Hemingway Adolescent Version 5.5 Reliability Estimate". SUBTITLE Subscale Below Entitled: Connectedness to a Romantic Partner (Post)'. RELIABILITY /VARIABLES=vpost61 vpost66 vpost70 vpost74 vpost76 /FORMAT=NOLABELS /SCALE(ALPHA)=ALL/MODEL=ALPHA /STATISTICS=DESCRIPTIVE SCALE /SUMMARY=TOTAL . TITLE "Hemingway Adolescent Version 5.5 Reliability Estimate". SUBTITLE Subscale Below Entitled: Connectedness to Religion (Post)'. RELIABILITY /VARIABLES=vpost62 vpost71 vpost75 /FORMAT=NOLABELS /SCALE(ALPHA)=ALL/MODEL=ALPHA /STATISTICS=DESCRIPTIVE SCALE /SUMMARY=TOTAL . COMPUTE h_neigh2 = MEAN(vpost1,vpost11,vpost21,vpost31,vpost41,vpost51) . VARIABLE LABELS h_neigh2 'Neighborhood2' . EXECUTE . COMPUTE hfriend2 = MEAN(vpost2,vpost12,vpost22,vpost32,vpost42,vpost52) . VARIABLE LABELS hfriend2 'Friends2' . EXECUTE . COMPUTE hs_pres2 = MEAN(vpost3,vpost13,vpost23,vpost33,vpost43,vpost53) . VARIABLE LABELS hs_pres2 'Self-in-the-Present2' . EXECUTE . COMPUTE h_paren2 = MEAN(vpost4,vpost14,vpost24,vpost34,vpost44,vpost54) . VARIABLE LABELS h_paren2 'Parents2' . EXECUTE . COMPUTE h_sibl2 = MEAN(vpost5,vpost15,vpost25,vpost35,vpost45) .

The Hemingway: Measure of Adolescent Connectedness Scoring Manual p. 59
Copyright © 2011 Michael J. Karcher, Ed.D., Ph.D. [email protected]
VARIABLE LABELS h_sibl2 'Siblings2' . EXECUTE . COMPUTE hschool2 = MEAN(vpost6,vpost16,vpost26,vpost36,vpost46,vpost56) . VARIABLE LABELS hschool2 'School2' . EXECUTE . COMPUTE h_peers2 = MEAN(vpost7,vpost17,vpost27,vpost37,vpost47,vpost57) . VARIABLE LABELS h_peers2 'Peers2' . EXECUTE . COMPUTE h_teach2 = MEAN(vpost8,vpost18,vpost28,vpost38,vpost48,vpost50) . VARIABLE LABELS h_teach2 'Teachers2' . EXECUTE . COMPUTE hs_fut2 = MEAN(vpost9,vpost19,vpost29,vpost39,vpost49) . VARIABLE LABELS hs_fut2 'Self-in-the-Future2' . EXECUTE . COMPUTE h_read2 = MEAN(vpost10,vpost20,vpost30,vpost40) . VARIABLE LABELS h_read2 'Reading2' . EXECUTE . COMPUTE h_dad2 = MEAN(vpost58,vpost64,vpost67,vpost72,vpost78) . VARIABLE LABELS h_dad2 'Father2' . EXECUTE . COMPUTE h_mom2 = MEAN(vpost59,vpost63,vpost68,vpost73,vpost77) . VARIABLE LABELS h_mom2 'Mother2' . EXECUTE . COMPUTE h_cult2 = MEAN(vpost60,vpost65,vpost69) . VARIABLE LABELS h_cult2 'Othercultures2' . EXECUTE . COMPUTE h_rom2 = MEAN(vpost61,vpost66,vpost70,vpost74,vpost76) . VARIABLE LABELS h_rom2 'RomanticPartner2' . EXECUTE . COMPUTE h_relig2 = MEAN(vpost62,vpost71,vpost75) . VARIABLE LABELS h_relig2 'Religion2' . EXECUTE .
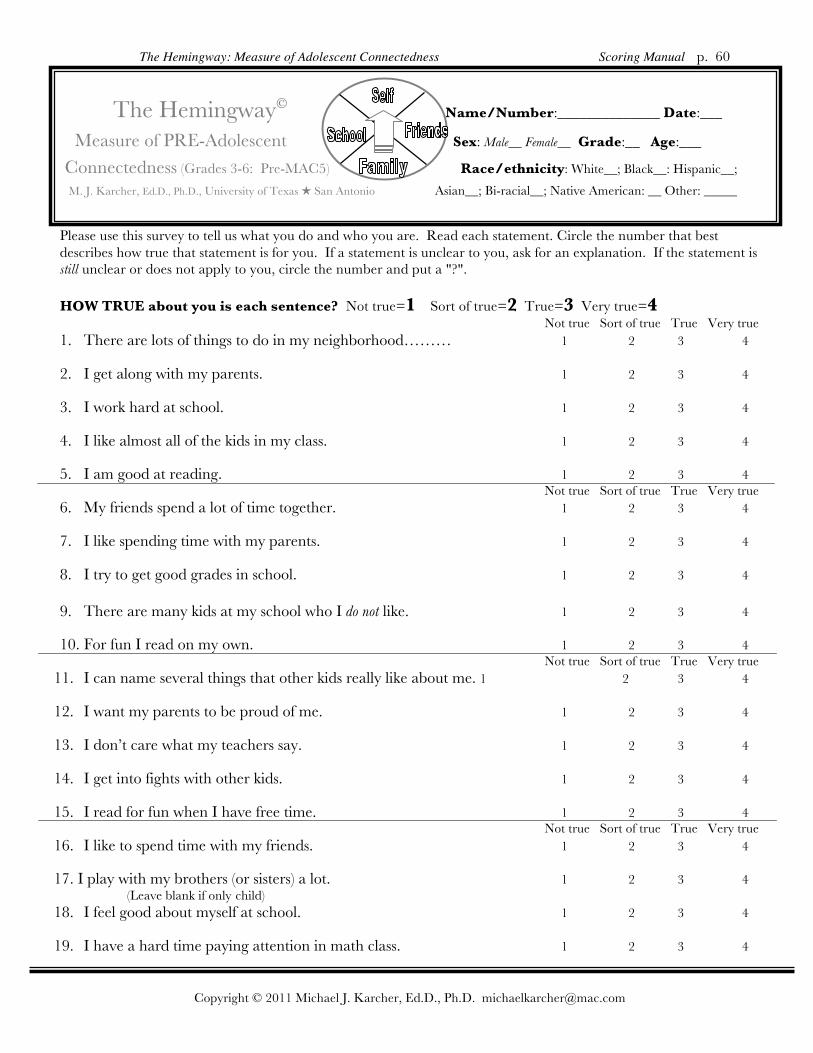
The Hemingway: Measure of Adolescent Connectedness Scoring Manual p. 60
Copyright © 2011 Michael J. Karcher, Ed.D., Ph.D. [email protected]
The Hemingway Name/Number:______________ Date:___
Measure of PRE-Adolescent Sex: Male__ Female__ Grade:__ Age:___
Connectedness (Grades 3-6: Pre-MAC5) Race/ethnicity: White__; Black__: Hispanic__;
M. J. Karcher, Ed.D., Ph.D., University of Texas San Antonio Asian__; Bi-racial__; Native American: __ Other: _____
Please use this survey to tell us what you do and who you are. Read each statement. Circle the number that best describes how true that statement is for you. If a statement is unclear to you, ask for an explanation. If the statement is still unclear or does not apply to you, circle the number and put a "?". HOW TRUE about you is each sentence? Not true=1 Sort of true=2 True=3 Very true=4 Not true Sort of true True Very true 1. There are lots of things to do in my neighborhood……… 1 2 3 4 2. I get along with my parents. 1 2 3 4 3. I work hard at school. 1 2 3 4 4. I like almost all of the kids in my class. 1 2 3 4 5. I am good at reading. 1 2 3 4 Not true Sort of true True Very true 6. My friends spend a lot of time together. 1 2 3 4 7. I like spending time with my parents. 1 2 3 4 8. I try to get good grades in school. 1 2 3 4 9. There are many kids at my school who I do not like. 1 2 3 4 10. For fun I read on my own. 1 2 3 4 Not true Sort of true True Very true
11. I can name several things that other kids really like about me. 1 2 3 4 12. I want my parents to be proud of me. 1 2 3 4 13. I don’t care what my teachers say. 1 2 3 4 14. I get into fights with other kids. 1 2 3 4 15. I read for fun when I have free time. 1 2 3 4 Not true Sort of true True Very true 16. I like to spend time with my friends. 1 2 3 4 17. I play with my brothers (or sisters) a lot. 1 2 3 4 (Leave blank if only child) 18. I feel good about myself at school. 1 2 3 4 19. I have a hard time paying attention in math class. 1 2 3 4
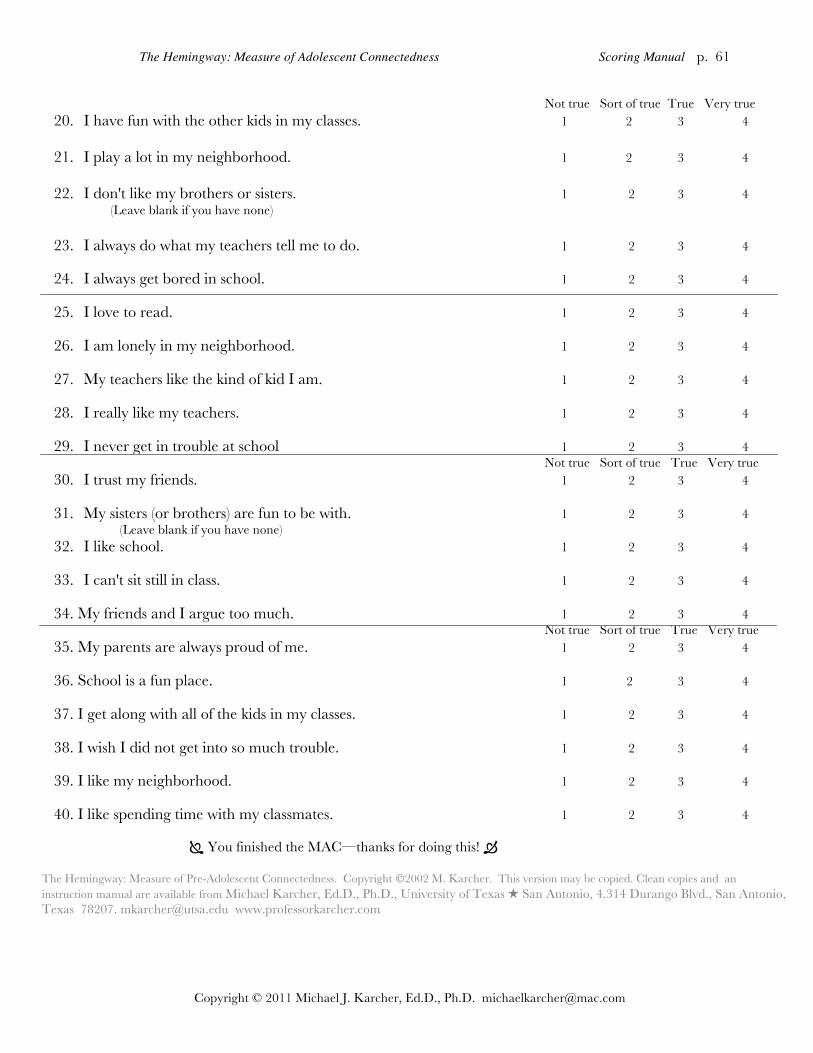
The Hemingway: Measure of Adolescent Connectedness Scoring Manual p. 61
Copyright © 2011 Michael J. Karcher, Ed.D., Ph.D. [email protected]
Not true Sort of true True Very true 20. I have fun with the other kids in my classes. 1 2 3 4 21. I play a lot in my neighborhood. 1 2 3 4 22. I don't like my brothers or sisters. 1 2 3 4 (Leave blank if you have none) 23. I always do what my teachers tell me to do. 1 2 3 4 24. I always get bored in school. 1 2 3 4 25. I love to read. 1 2 3 4 26. I am lonely in my neighborhood. 1 2 3 4 27. My teachers like the kind of kid I am. 1 2 3 4 28. I really like my teachers. 1 2 3 4 29. I never get in trouble at school 1 2 3 4 Not true Sort of true True Very true 30. I trust my friends. 1 2 3 4 31. My sisters (or brothers) are fun to be with. 1 2 3 4 (Leave blank if you have none) 32. I like school. 1 2 3 4 33. I can't sit still in class. 1 2 3 4 34. My friends and I argue too much. 1 2 3 4 Not true Sort of true True Very true 35. My parents are always proud of me. 1 2 3 4 36. School is a fun place. 1 2 3 4 37. I get along with all of the kids in my classes. 1 2 3 4 38. I wish I did not get into so much trouble. 1 2 3 4 39. I like my neighborhood. 1 2 3 4 40. I like spending time with my classmates. 1 2 3 4
You finished the MAC—thanks for doing this!
The Hemingway: Measure of Pre-Adolescent Connectedness. Copyright 2002 M. Karcher. This version may be copied. Clean copies and an instruction manual are available from Michael Karcher, Ed.D., Ph.D., University of Texas San Antonio, 4.314 Durango Blvd., San Antonio, Texas 78207. [email protected] www.professorkarcher.com
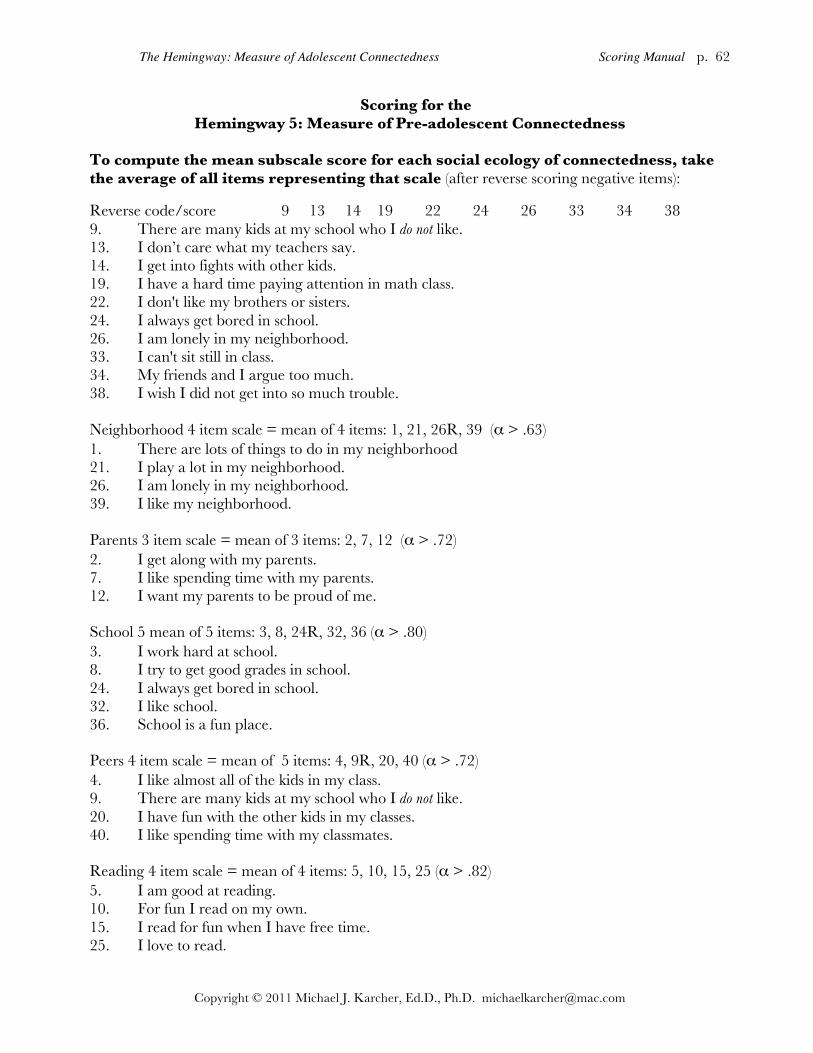
The Hemingway: Measure of Adolescent Connectedness Scoring Manual p. 62
Copyright © 2011 Michael J. Karcher, Ed.D., Ph.D. [email protected]
Scoring for the Hemingway 5: Measure of Pre-adolescent Connectedness
To compute the mean subscale score for each social ecology of connectedness, take the average of all items representing that scale (after reverse scoring negative items):
Reverse code/score 9 13 14 19 22 24 26 33 34 38 9. There are many kids at my school who I do not like. 13. I don’t care what my teachers say. 14. I get into fights with other kids. 19. I have a hard time paying attention in math class. 22. I don't like my brothers or sisters. 24. I always get bored in school. 26. I am lonely in my neighborhood. 33. I can't sit still in class. 34. My friends and I argue too much. 38. I wish I did not get into so much trouble. Neighborhood 4 item scale = mean of 4 items: 1, 21, 26R, 39 (α > .63) 1. There are lots of things to do in my neighborhood 21. I play a lot in my neighborhood. 26. I am lonely in my neighborhood. 39. I like my neighborhood. Parents 3 item scale = mean of 3 items: 2, 7, 12 (α > .72) 2. I get along with my parents. 7. I like spending time with my parents. 12. I want my parents to be proud of me. School 5 mean of 5 items: 3, 8, 24R, 32, 36 (α > .80) 3. I work hard at school. 8. I try to get good grades in school. 24. I always get bored in school. 32. I like school. 36. School is a fun place. Peers 4 item scale = mean of 5 items: 4, 9R, 20, 40 (α > .72) 4. I like almost all of the kids in my class. 9. There are many kids at my school who I do not like. 20. I have fun with the other kids in my classes. 40. I like spending time with my classmates. Reading 4 item scale = mean of 4 items: 5, 10, 15, 25 (α > .82) 5. I am good at reading. 10. For fun I read on my own. 15. I read for fun when I have free time. 25. I love to read.
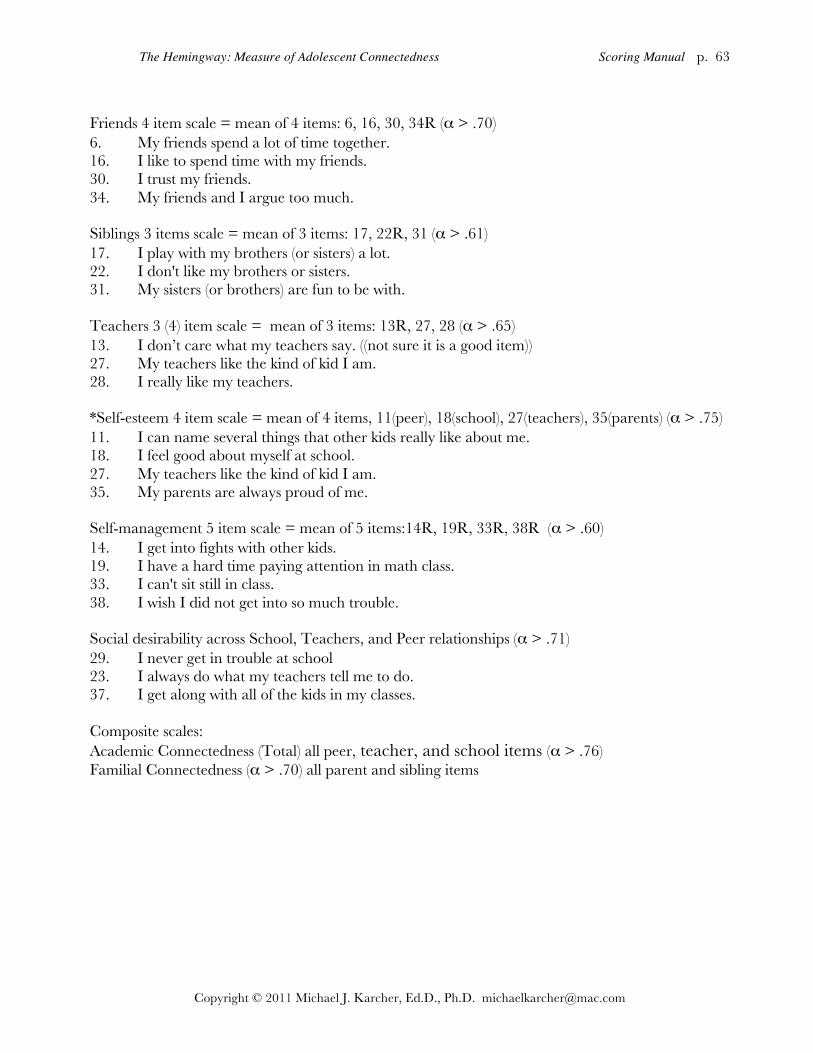
The Hemingway: Measure of Adolescent Connectedness Scoring Manual p. 63
Copyright © 2011 Michael J. Karcher, Ed.D., Ph.D. [email protected]
Friends 4 item scale = mean of 4 items: 6, 16, 30, 34R (α > .70) 6. My friends spend a lot of time together. 16. I like to spend time with my friends. 30. I trust my friends. 34. My friends and I argue too much. Siblings 3 items scale = mean of 3 items: 17, 22R, 31 (α > .61) 17. I play with my brothers (or sisters) a lot. 22. I don't like my brothers or sisters. 31. My sisters (or brothers) are fun to be with. Teachers 3 (4) item scale = mean of 3 items: 13R, 27, 28 (α > .65) 13. I don’t care what my teachers say. ((not sure it is a good item)) 27. My teachers like the kind of kid I am. 28. I really like my teachers. *Self-esteem 4 item scale = mean of 4 items, 11(peer), 18(school), 27(teachers), 35(parents) (α > .75) 11. I can name several things that other kids really like about me. 18. I feel good about myself at school. 27. My teachers like the kind of kid I am. 35. My parents are always proud of me. Self-management 5 item scale = mean of 5 items:14R, 19R, 33R, 38R (α > .60) 14. I get into fights with other kids. 19. I have a hard time paying attention in math class. 33. I can't sit still in class. 38. I wish I did not get into so much trouble. Social desirability across School, Teachers, and Peer relationships (α > .71) 29. I never get in trouble at school 23. I always do what my teachers tell me to do. 37. I get along with all of the kids in my classes. Composite scales: Academic Connectedness (Total) all peer, teacher, and school items (α > .76) Familial Connectedness (α > .70) all parent and sibling items

The Hemingway: Measure of Adolescent Connectedness Scoring Manual p. 64
Copyright © 2011 Michael J. Karcher, Ed.D., Ph.D. [email protected]
Reliability of the Pre-Adolescent Version Sometimes a reversed item reduces the reliability. If it reduces the reliability a lot, then take the mean without that item. However, if the reversed items reduce the reliability of all of the subscales, then most likely a considerable number of the youth completing the scale were not paying attention (responding positively to negatively worded items), which may compromise the validity of the data and conclusions drawn from the data. Below reliability estimates (Cronbach’s alpha) are presented, but I put a * next to those that also provide reliability estimates when I omitted the reversed item. To interpret these reliability assessments, consider those above .65 okay, above .70 good, and above .80 excellent. A reliability level of .80 is unusual for scales completed by young children (grades 3-6) with subscales including only a few (4 or 5) items. So I think .65 to .75 is good for this scale with young children when the measure is administered in a group/classroom format. Prior estimates of reliability from three samples: Coefficient alphas listed (α ) for subscale (and subscale without the reversed item) among an ethnically diverse sample of 145 4th and 5th graders are presented first. Then, designated by the sign, †, are reliability estimates for a study with 213 Caucasian 4th through 6th grade youth. Designated by the sign,§, are reliability estimates for a study with 470 Latino 4th through 7th grade youth (with reversed items). Neighborhood (α = .62)* († α = .70) (§ α = .69) Parents (α = .62) († α = .74) (§ α = .73) School (α = .72) († α = .82) (§ α = .75) Peers (α = .66) (†α = .69) (§ α = .62) Reading (α = .73) († α = .83) (§ α = .82) Friends (α = .65) († α = .72) (§ α = .57) Self-in-the-Present (Self-esteem) (§ α = .66) Self-management (a = .63) (†α = .68) (§ α = .56; 5 items: .58) Teachers (α = .75) († α = .71) (§ α = .79) Siblings (α = .82) (†α = .86) (§ α = .63) *Note: If the reliability of the subscales does not reach .65 on the peer, school, teacher, and parent scales, discard the Self-Esteem subscale, and include each item in its respective scales (see below).

The Hemingway: Measure of Adolescent Connectedness Scoring Manual p. 65
Copyright © 2011 Michael J. Karcher, Ed.D., Ph.D. [email protected]
SPSS SYNTAX FOR SCORING CHILD VERSION SPSS Syntax: Simply cut and paste the syntax below into the SPSS Syntax window, and (assuming you have labeled the variables similarly), reliability estimates will be generated. NOTICE: Only run the “RECODE” and additional 3 lines one time to reverse score the negatively worded items. If you do it a second time, you will undo the reverse scoring and see negative loadings in the item analysis. RECODE hc_9 hc_13 hc_14 hc_19 hc_22 hc_24 hc_26 hc_33 hc_34 hc_38 (1=4) (2=3) (3=2) (4=1) . EXECUTE . *Neighborhood 1 21 26R 39 TITLE "Hemingway Child Version 4 Reliability Estimate". SUBTITLE Subscale Below Entitled: Connectedness to Neighborhood'. RELIABILITY /VARIABLES=hc_1 hc_21 hc_26 hc_39 /FORMAT=NOLABELS /SCALE(ALPHA)=ALL/MODEL=ALPHA /STATISTICS=DESCRIPTIVE SCALE /SUMMARY=TOTAL . *Parents 2 7 12 TITLE "Hemingway Child Version 4 Reliability Estimate". SUBTITLE Subscale Below Entitled: Connectedness to Parents'. RELIABILITY /VARIABLES=hc_2 hc_7 hc_12 /FORMAT=NOLABELS /SCALE(ALPHA)=ALL/MODEL=ALPHA /STATISTICS=DESCRIPTIVE SCALE /SUMMARY=TOTAL . *School 3 8 24R 32 36 TITLE "Hemingway Child Version 4 Reliability Estimate". SUBTITLE Subscale Below Entitled: Connectedness to School'. RELIABILITY /VARIABLES=hc_3 hc_8 hc_24 hc_32 hc_36 /FORMAT=NOLABELS /SCALE(ALPHA)=ALL/MODEL=ALPHA /STATISTICS=DESCRIPTIVE SCALE /SUMMARY=TOTAL . *Peers 4 9R 20 40 TITLE "Hemingway Child Version 4 Reliability Estimate". SUBTITLE Subscale Below Entitled: Connectedness to Peers'. RELIABILITY /VARIABLES=hc_4 hc_9 hc_20 hc_40 /FORMAT=NOLABELS
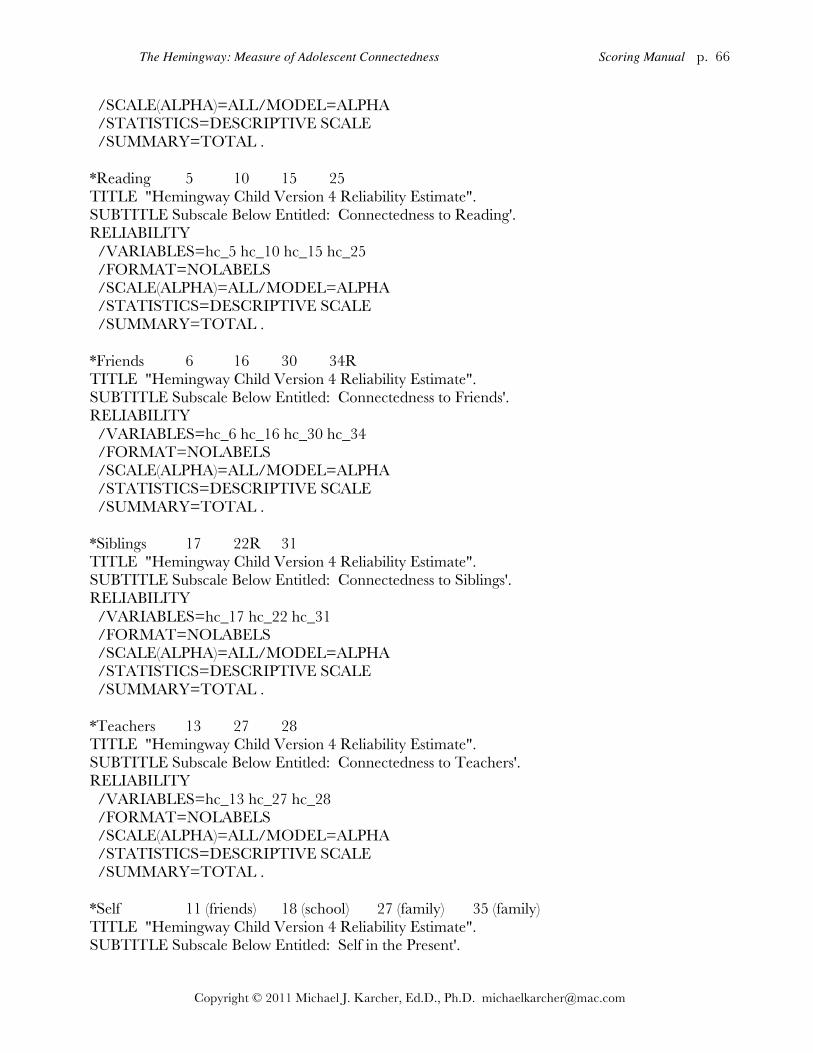
The Hemingway: Measure of Adolescent Connectedness Scoring Manual p. 66
Copyright © 2011 Michael J. Karcher, Ed.D., Ph.D. [email protected]
/SCALE(ALPHA)=ALL/MODEL=ALPHA /STATISTICS=DESCRIPTIVE SCALE /SUMMARY=TOTAL . *Reading 5 10 15 25 TITLE "Hemingway Child Version 4 Reliability Estimate". SUBTITLE Subscale Below Entitled: Connectedness to Reading'. RELIABILITY /VARIABLES=hc_5 hc_10 hc_15 hc_25 /FORMAT=NOLABELS /SCALE(ALPHA)=ALL/MODEL=ALPHA /STATISTICS=DESCRIPTIVE SCALE /SUMMARY=TOTAL . *Friends 6 16 30 34R TITLE "Hemingway Child Version 4 Reliability Estimate". SUBTITLE Subscale Below Entitled: Connectedness to Friends'. RELIABILITY /VARIABLES=hc_6 hc_16 hc_30 hc_34 /FORMAT=NOLABELS /SCALE(ALPHA)=ALL/MODEL=ALPHA /STATISTICS=DESCRIPTIVE SCALE /SUMMARY=TOTAL . *Siblings 17 22R 31 TITLE "Hemingway Child Version 4 Reliability Estimate". SUBTITLE Subscale Below Entitled: Connectedness to Siblings'. RELIABILITY /VARIABLES=hc_17 hc_22 hc_31 /FORMAT=NOLABELS /SCALE(ALPHA)=ALL/MODEL=ALPHA /STATISTICS=DESCRIPTIVE SCALE /SUMMARY=TOTAL . *Teachers 13 27 28 TITLE "Hemingway Child Version 4 Reliability Estimate". SUBTITLE Subscale Below Entitled: Connectedness to Teachers'. RELIABILITY /VARIABLES=hc_13 hc_27 hc_28 /FORMAT=NOLABELS /SCALE(ALPHA)=ALL/MODEL=ALPHA /STATISTICS=DESCRIPTIVE SCALE /SUMMARY=TOTAL . *Self 11 (friends) 18 (school) 27 (family) 35 (family) TITLE "Hemingway Child Version 4 Reliability Estimate". SUBTITLE Subscale Below Entitled: Self in the Present'.

The Hemingway: Measure of Adolescent Connectedness Scoring Manual p. 67
Copyright © 2011 Michael J. Karcher, Ed.D., Ph.D. [email protected]
RELIABILITY /VARIABLES=hc_11 hc_18 hc_27 hc_35 /FORMAT=NOLABELS /SCALE(ALPHA)=ALL/MODEL=ALPHA /STATISTICS=DESCRIPTIVE SCALE /SUMMARY=TOTAL . *Self-Manage 14R 19R 33R 38R TITLE "Hemingway Child Version 4 Reliability Estimate". SUBTITLE Subscale Below Entitled: Self-Management'. RELIABILITY /VARIABLES=hc_14 hc_19 hc_33 hc_38 /FORMAT=NOLABELS /SCALE(ALPHA)=ALL/MODEL=ALPHA /STATISTICS=DESCRIPTIVE SCALE /SUMMARY=TOTAL . TITLE "Hemingway Child Version 4 Reliability Estimate". SUBTITLE Subscale Below Entitled: Social Desirability (Parents, school, peers)’. RELIABILITY /VARIABLES=hc_23 hc_29 hc_37 /FORMAT=NOLABELS /SCALE(ALPHA)=ALL/MODEL=ALPHA /STATISTICS=DESCRIPTIVE SCALE /SUMMARY=TOTAL . *Family 2 7 12 17 22R 31 TITLE "Hemingway Child Version 4 Reliability Estimate". SUBTITLE Subscale Below Entitled: Family Connectedness'. RELIABILITY /VARIABLES=hc_2 hc_7 hc_12 hc_17 hc_22 hc_31 /FORMAT=NOLABELS /SCALE(ALPHA)=ALL/MODEL=ALPHA /STATISTICS=DESCRIPTIVE SCALE /SUMMARY=TOTAL . *Academic 13 27 28 4 9R 20 40 3 8 24R 32 36 TITLE "Hemingway Child Version 4 Reliability Estimate". SUBTITLE Subscale Below Entitled: Academic Connectedness (Total)'. RELIABILITY /VARIABLES=hc_13 hc_27 hc_28 hc_4 hc_9 hc_20 hc_40 hc_3 hc_8 hc_24 hc_32 hc_36 /FORMAT=NOLABELS /SCALE(ALPHA)=ALL/MODEL=ALPHA /STATISTICS=DESCRIPTIVE SCALE /SUMMARY=TOTAL .
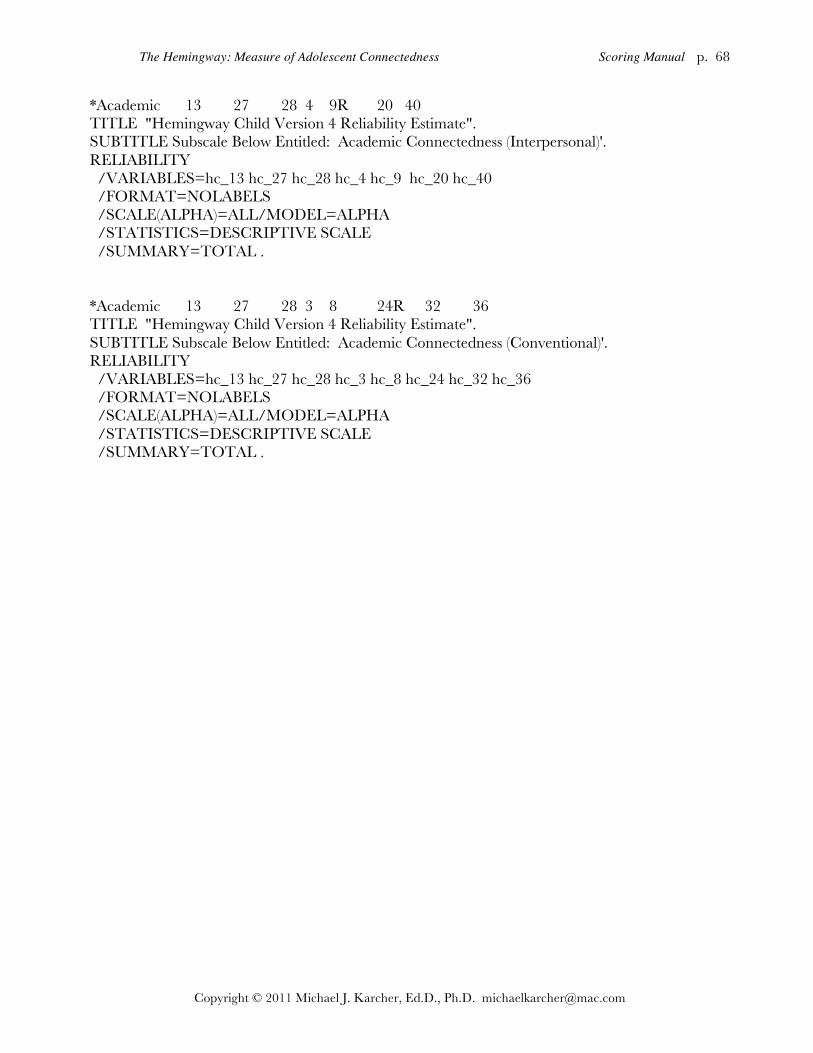
The Hemingway: Measure of Adolescent Connectedness Scoring Manual p. 68
Copyright © 2011 Michael J. Karcher, Ed.D., Ph.D. [email protected]
*Academic 13 27 28 4 9R 20 40 TITLE "Hemingway Child Version 4 Reliability Estimate". SUBTITLE Subscale Below Entitled: Academic Connectedness (Interpersonal)'. RELIABILITY /VARIABLES=hc_13 hc_27 hc_28 hc_4 hc_9 hc_20 hc_40 /FORMAT=NOLABELS /SCALE(ALPHA)=ALL/MODEL=ALPHA /STATISTICS=DESCRIPTIVE SCALE /SUMMARY=TOTAL . *Academic 13 27 28 3 8 24R 32 36 TITLE "Hemingway Child Version 4 Reliability Estimate". SUBTITLE Subscale Below Entitled: Academic Connectedness (Conventional)'. RELIABILITY /VARIABLES=hc_13 hc_27 hc_28 hc_3 hc_8 hc_24 hc_32 hc_36 /FORMAT=NOLABELS /SCALE(ALPHA)=ALL/MODEL=ALPHA /STATISTICS=DESCRIPTIVE SCALE /SUMMARY=TOTAL .
The Hemingway: Measure of Adolescent Connectedness Scoring Manual p. 69
Copyright © 2011 Michael J. Karcher, Ed.D., Ph.D. [email protected]
Descriptions of Theory-based Scoring Approaches and Evidence of Invariance: There are 3 ways to create subscales: Average items only for their own subscale: Results in 10 subscales (15 in long version) Average items in Academic, Social, Familial and Self Factors: Results in 4 scales. Average items assigned to Conventional and Unconventional Factors: Results in 2 scales. Ecological Theory: Separate subscales by connectedness context and relationship. Depending on the goal of the survey’s use, it may be most helpful to get information on all 10 (15 in long version) subscales, such as connectedness to teachers, siblings, friends. If this level of connectedness is useful, then the six items in each subscale (some scales have 3) can be averaged. Reliability estimates for a middle school sample are provided in Appendix Table 8. This appears to be a valid approach. Validity evidence is presented in the Appendix wherein correlations with similar and dissimilar scales are in the direction and magnitude expected. Model fit indices for confirmatory factor analyses suggest the data fit this method of scoring well and tests of equivalence suggest this approach worked equally well in a large sample for boys and girls as well as for African-American, Caucasian, and Latino youth. Attachment (Cultural) Theory: Familial, Academic, and Social Connectedness. When the goal of an evaluation or study is to get the best estimate of overall connectedness to school, family, and same-age peers, then using higher order factor subscales should result in more reliable scale estimates (see Appendix 8). This may be particularly useful with small samples. This appears to be a valid approach. Model fit indices for confirmatory factor analyses testing “Attachment (Cultural) Theory” constructs suggest the data fit this method of scoring well and tests of equivalence suggest this approach worked equally well in a large sample for boys and girls as well as for African-American, Caucasian, and Latino youth. Problem Behavior Theory: Conventional and Unconventional Connectedness. When the goal of an evaluation or study is to use connectedness assessments to predict risk-taking or problem behaviors, then the unconventional connectedness composite scale should provide the best estimate. Unconventional connectedness measured this way captures the youth’s overall engagement with peers in non-adult-sanctioned contexts. If predicting overall resilience, future success in conventional efforts (work, school) then the conventional composite scale may be best. When trying to predict risk-taking or achievement, using higher order unconventional and conventional subscales should result in the most reliable scale estimates (see Appendix 8). This may be particularly useful with small samples. This appears to be a valid approach. Model fit indices for confirmatory factor analyses testing “Problem Behavior Theory” constructs suggest the data fit this method of scoring well and tests of equivalence suggest this approach worked equally well in a large sample for boys and girls as well as for African-American, Caucasian, and Latino youth. Although model fit indices are adequate across groups, this approach works best for Caucasian and least well for Latinos. Note: While composite scales are “more reliable,” this is somewhat a function of the larger number of items used in computing these composite scores. Doing so, however, requires collecting data on items 1-55 (this takes more time than collecting data only on some subscales).

The Hemingway: Measure of Adolescent Connectedness Scoring Manual p. 70
Copyright © 2011 Michael J. Karcher, Ed.D., Ph.D. [email protected]
Model fit statistics for the 10-factor "Ecological Theory," first-order model across gender in a 6th-8th grade sample (N = 4263).
2χ df 2χΔ dfΔ RMSEA ∆RMSE SRMR ∆SRMR CFI ∆CFI
Fit for Males 6354.47 1439 0.051 0.051 0.963 Fit for Females 6236.69 1439 0.051 0.052 0.964 Configural = All 12591.16 2878 0.051 0.052 0.964 Factor Loadings 12800.05 2924 208.88** 46 0.051 0.000 0.052 0.000 0.963 0.001 Factor Intercepts 13482.66 2970 682.61** 46 0.053 0.001 0.024 0.028 0.961 0.002 Item Residuals 14216.20 3026 733.55** 56 0.054 0.001 0.052 -0.028 0.958 0.003 Variance/Covariance 14330.01 3081 113.80** 55 0.054 0.000 0.054 -0.002 0.958 0.000
Note. Sample sizes for males, females, and combined were 1568, 1474, and 3042, respectively. 2χΔ values marked with an * and ** were statistically significant at .05 and .001, respectively. FL, intercepts, TD, and GA refer to the first-order factor loadings, observed variable intercepts, observed variable residuals or disturbance of the first-order factors (theta-deltas), and the variance/covariance matrix for the first-order factors, respectively.
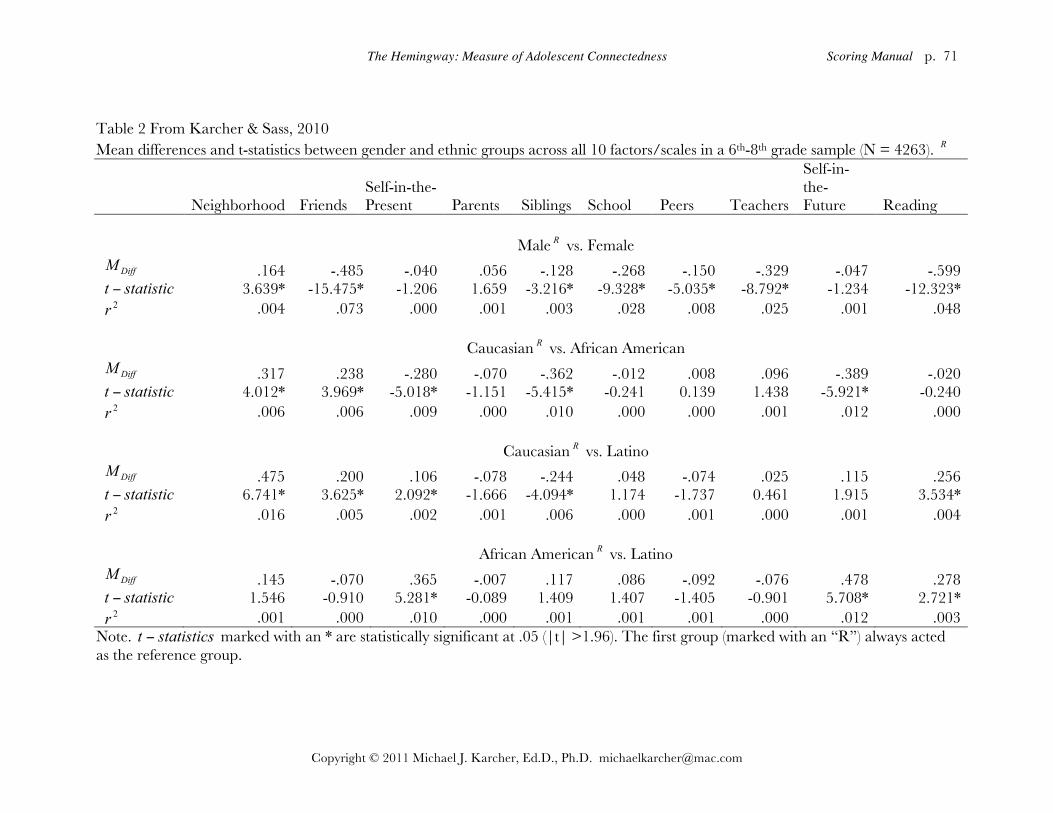
The Hemingway: Measure of Adolescent Connectedness Scoring Manual p. 71
Copyright © 2011 Michael J. Karcher, Ed.D., Ph.D. [email protected]
Table 2 From Karcher & Sass, 2010 Mean differences and t-statistics between gender and ethnic groups across all 10 factors/scales in a 6th-8th grade sample (N = 4263). R
Neighborhood Friends Self-in-the-Present Parents Siblings School Peers Teachers
Self-in-the-Future Reading
Male R vs. Female
DiffM .164 -.485 -.040 .056 -.128 -.268 -.150 -.329 -.047 -.599 statistict − 3.639* -15.475* -1.206 1.659 -3.216* -9.328* -5.035* -8.792* -1.234 -12.323*
2r .004 .073 .000 .001 .003 .028 .008 .025 .001 .048 Caucasian R vs. African American
DiffM .317 .238 -.280 -.070 -.362 -.012 .008 .096 -.389 -.020 statistict − 4.012* 3.969* -5.018* -1.151 -5.415* -0.241 0.139 1.438 -5.921* -0.240
2r .006 .006 .009 .000 .010 .000 .000 .001 .012 .000 Caucasian R vs. Latino
DiffM .475 .200 .106 -.078 -.244 .048 -.074 .025 .115 .256 statistict − 6.741* 3.625* 2.092* -1.666 -4.094* 1.174 -1.737 0.461 1.915 3.534*
2r .016 .005 .002 .001 .006 .000 .001 .000 .001 .004 African American R vs. Latino
DiffM .145 -.070 .365 -.007 .117 .086 -.092 -.076 .478 .278 statistict − 1.546 -0.910 5.281* -0.089 1.409 1.407 -1.405 -0.901 5.708* 2.721*
2r .001 .000 .010 .000 .001 .001 .001 .000 .012 .003 Note. statisticst − marked with an * are statistically significant at .05 (|t| >1.96). The first group (marked with an “R”) always acted as the reference group.

The Hemingway: Measure of Adolescent Connectedness Scoring Manual p. 72
Copyright © 2011 Michael J. Karcher, Ed.D., Ph.D. [email protected]
Table 3--Testing for Model Invariance Across Three Ethnic Groups in a Large Mid-Western Middle School Population Model fit statistics for the first-order, Ecological Theory, factor across the different ethnic groups in a 6th-8th grade sample (N = 4263).
2χ df 2χΔ dfΔ RMSEA ∆RMSE SRMR ∆SRMR CFI ∆CFI
Fit for Caucasian 8360.40 1439 0.051 0.052 0.968 Fit for African American 2754.29 1439 0.056 0.066 0.935 Fit for Latino 2707.48 1439 0.054 0.065 0.921 Configural = All 13822.17 4317 0.052 0.065 0.962 Factor Loadings 14010.20 4409 188.03** 92 0.052 0.000 0.068 0.003 0.962 0.000 Factor Intercepts 14794.17 4455 783.97** 46 0.053 -0.002 0.068 0.000 0.959 0.003 Item Residuals 15707.26 4567 913.09** 112 0.060 -0.007 0.072 0.004 0.955 0.003 Variance/Covariance 15937.88 4677 230.62** 110 0.060 0.000 0.106 0.034 0.955 0.001
Note. Sample sizes for Caucasians, African Americans, Latinos, and combined were 2195, 279, 323, and 2797, respectively. 2χΔ values marked with an * and ** were statistically significant at .05 and .001, respectively. FL, intercepts, TD, and GA refer to the first-order factor loadings, observed variable intercepts, observed variable residuals or disturbance of the first-order factors (theta-deltas), and the variance/covariance matrix for the first-order factors, respectively.

The Hemingway: Measure of Adolescent Connectedness Scoring Manual p. 73
Copyright © 2011 Michael J. Karcher, Ed.D., Ph.D. [email protected]
Table 4 Model fit statistics for the Problem Behavior Theory (Conventional & Unconventional) 2 factor across genders in a 6th-8th grade sample.
2χ df 2χΔ dfΔ RMSEA ∆RMSE SRMR ∆SRMR CFI ∆CFI
Fit for Males 6975.18 1473 0.054 0.060 0.959 Fit for Females 6846.32 1473 0.054 0.063 0.959 Configural: Full 13821.49 2946 0.054 0.063 0.959 Factor Loadings (1st Order) 14043.69 2992 222.20** 46 0.054 0.000 0.063 0.000 0.959 0.001 Factor Loadings (2nd Order) 14063.97 3000 20.28** 8 0.054 0.000 0.066 -0.002 0.959 0.000 Intercepts of Measured Variables 14739.81 3046 675.84** 46 0.055 0.001 0.086 -0.021 0.956 0.002 Intercepts of First-order Factors 15278.44 3054 538.63** 8 0.056 0.001 0.068 0.018 0.954 0.002 1st Order Factor Disturbances 15303.39 3064 24.95** 10 0.056 0.000 0.069 -0.001 0.954 0.000 Item Residual 16032.47 3120 729.08** 56 0.057 0.001 0.068 0.001 0.952 0.003 2nd Order Variance/Covariance 16041.74 3123 9.27** 3 0.057 0.000 0.067 0.000 0.952 0.000 Note. Sample sizes for males, females, and combined were 1568, 1474, and 3042, respectively. 2χΔ values marked with an * and ** were statistically significant at .05 and .001, respectively.

The Hemingway: Measure of Adolescent Connectedness Scoring Manual p. 74
Copyright © 2011 Michael J. Karcher, Ed.D., Ph.D. [email protected]
Table 5 Model fit statistics for the second-order, Problem Behavior Theory, 2 factors across the different ethnic groups in a 6th-8th grade sample.
2χ df 2χΔ dfΔ RMSEA ∆RMSE SRMR ∆SRMR CFI ∆CFI
Fit for Caucasian 9183.20 1473 0.054 0.061 0.964 Fit for African American 2877.77 1473 0.058 0.072 0.931 Fit for Latino 2900.36 1473 0.057 0.076 0.911 Configural: Full 14961.34 4419 0.055 0.076 0.958 Factor Loadings (1st Order) 15137.05 4511 175.71** 92 0.054 0.000 0.078 0.003 0.957 0.000 Factor Loadings (2nd Order) 15163.38 4527 26.33** 16 0.054 0.000 0.079 0.001 0.957 0.000 Intercepts of Measured Variables 15793.07 4619 629.69** 92 0.055 -0.001 0.079 0.000 0.955 0.002 Intercepts of First-order Factors 16083.90 4637 290.84** 18 0.056 -0.001 0.084 0.004 0.954 0.001 1st Order Factor Disturbances 16148.18 4657 64.27** 20 0.056 0.000 0.086 0.003 0.954 0.000 Item Residuals 17487.13 4769 1338.95** 112 0.063 -0.007 0.092 0.006 0.949 0.005 2nd Order Variance/Covariance 17520.43 4775 33.30** 6 0.063 0.112 0.020 0.949 0.000
Note. Sample sizes for Caucasians, African Americans, Latinos, and combined were 2195, 279, 323, and 2797, respectively. 2χΔ values marked with an * and ** were statistically significant at .05 and .001, respectively.

The Hemingway: Measure of Adolescent Connectedness Scoring Manual p. 75
Copyright © 2011 Michael J. Karcher, Ed.D., Ph.D. [email protected]
Table 6 Model fit statistics for the second-order, Attachment Theory, 3-factor across genders in a 6th-8th grade sample.
2χ df 2χΔ dfΔ RMSEA ∆RMSE SRMR ∆SRMR CFI ∆CFI
Fit for Males 6924.92 1471 0.054 0.059 0.959 Fit for Females 6686.06 1471 0.054 0.061 0.961 Configural: Full 13610.97 2942 0.054 0.061 0.960 Factor Loadings (1st Order) 13822.89 2988 211.92** 46 0.054 0.000 0.061 0.000 0.959 0.001 Factor Loadings (2nd Order) 13838.79 2995 15.90** 7 0.054 0.000 0.061 -0.001 0.959 0.000 Intercepts of Measured Variables 14512.83 3041 674.04** 46 0.055 0.001 0.061 0.000 0.957 0.002 Intercepts of First-order Factors 14987.62 3048 474.79** 7 0.056 0.001 0.062 -0.001 0.955 0.002 1st Order Factor Disturbances 15006.82 3058 19.20** 10 0.056 0.000 0.062 0.000 0.955 0.000 Item Residuals 15745.98 3114 739.16** 56 0.057 0.001 0.062 0.001 0.953 0.003 2nd Order Variance/Covariance 15755.22 3120 9.23 NS 6 0.057 0.000 0.062 0.000 0.953 0.000
Note. Sample sizes for males, females, and combined were 1568, 1474, and 3042, respectively. 2χΔ values marked
with an * and ** were statistically significant at .05 and .001, respectively. The 2χΔ value marked with an NS was non-significant at an alpha of .05.
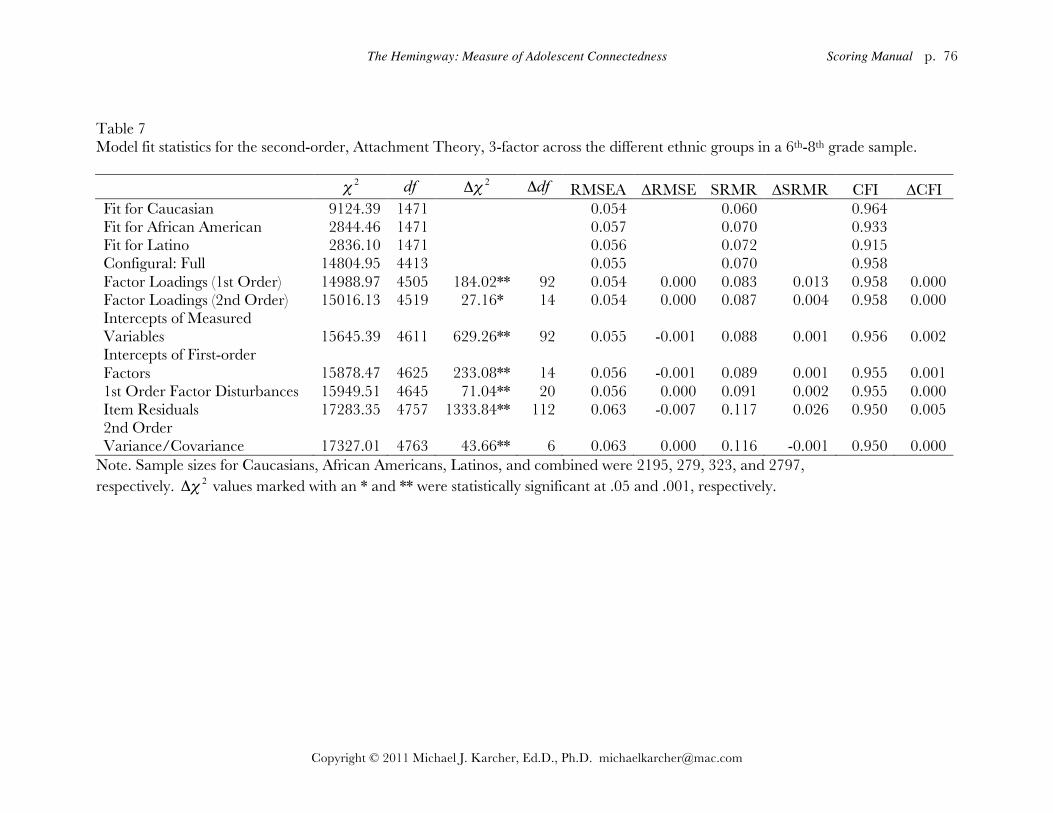
The Hemingway: Measure of Adolescent Connectedness Scoring Manual p. 76
Copyright © 2011 Michael J. Karcher, Ed.D., Ph.D. [email protected]
Table 7 Model fit statistics for the second-order, Attachment Theory, 3-factor across the different ethnic groups in a 6th-8th grade sample.
2χ df 2χΔ dfΔ RMSEA ∆RMSE SRMR ∆SRMR CFI ∆CFI
Fit for Caucasian 9124.39 1471 0.054 0.060 0.964 Fit for African American 2844.46 1471 0.057 0.070 0.933 Fit for Latino 2836.10 1471 0.056 0.072 0.915 Configural: Full 14804.95 4413 0.055 0.070 0.958 Factor Loadings (1st Order) 14988.97 4505 184.02** 92 0.054 0.000 0.083 0.013 0.958 0.000 Factor Loadings (2nd Order) 15016.13 4519 27.16** 14 0.054 0.000 0.087 0.004 0.958 0.000 Intercepts of Measured Variables 15645.39 4611 629.26** 92 0.055 -0.001 0.088 0.001 0.956 0.002 Intercepts of First-order Factors 15878.47 4625 233.08** 14 0.056 -0.001 0.089 0.001 0.955 0.001 1st Order Factor Disturbances 15949.51 4645 71.04** 20 0.056 0.000 0.091 0.002 0.955 0.000 Item Residuals 17283.35 4757 1333.84** 112 0.063 -0.007 0.117 0.026 0.950 0.005 2nd Order Variance/Covariance 17327.01 4763 43.66** 6 0.063 0.000 0.116 -0.001 0.950 0.000
Note. Sample sizes for Caucasians, African Americans, Latinos, and combined were 2195, 279, 323, and 2797, respectively. 2χΔ values marked with an * and ** were statistically significant at .05 and .001, respectively.

The Hemingway: Measure of Adolescent Connectedness Scoring Manual p. 77
Copyright © 2011 Michael J. Karcher, Ed.D., Ph.D. [email protected]
XIV. PARENT AND TEACHER REPORT THE HEMINGWAY©:
MEASURE OF ADOLESCENT CONNECTEDNESS
(Hemingway Adolescent Version 5.5)
May 2000
A Manual for Scoring and Interpretation
the Parent and Teachers Surveys
Michael Justin Karcher, Ed.D., Ph.D. College of Education and Human Development The University of Texas San Antonio 501 West Durango Blvd., Office 4.314 San Antonio, Texas 78207
[email protected] 210-458-2671
Future
oriented
Present
oriented
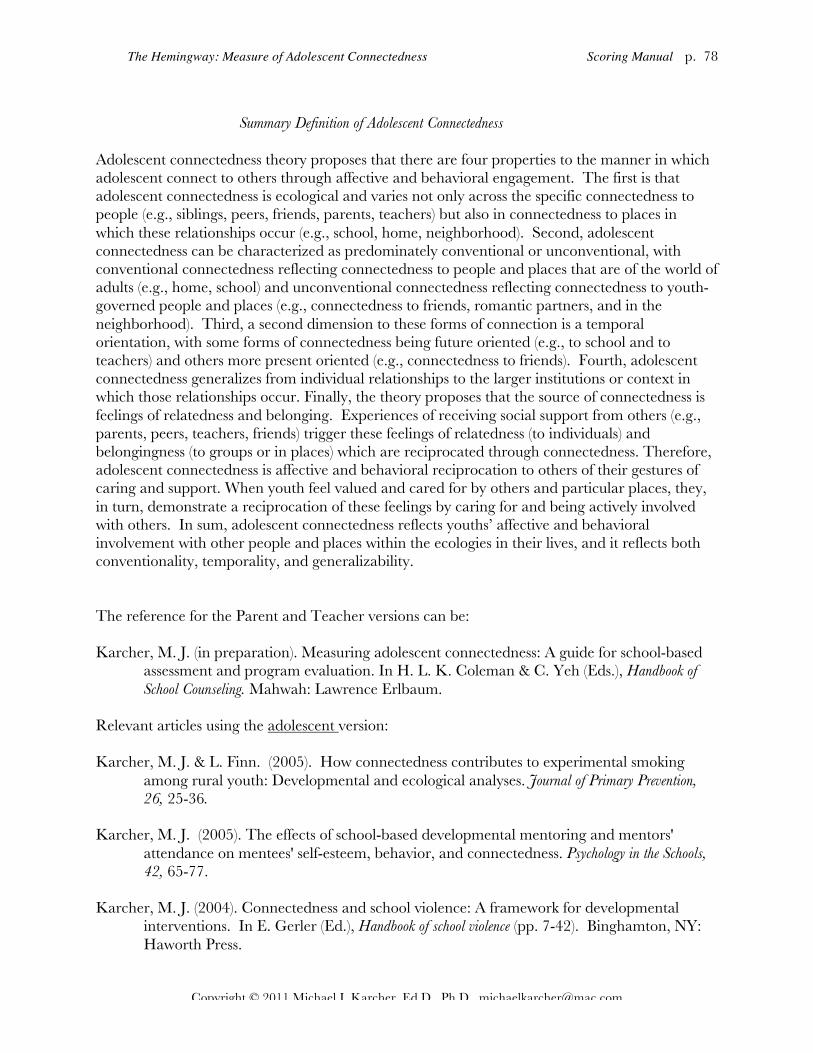
The Hemingway: Measure of Adolescent Connectedness Scoring Manual p. 78
Copyright © 2011 Michael J. Karcher, Ed.D., Ph.D. [email protected]
Summary Definition of Adolescent Connectedness Adolescent connectedness theory proposes that there are four properties to the manner in which adolescent connect to others through affective and behavioral engagement. The first is that adolescent connectedness is ecological and varies not only across the specific connectedness to people (e.g., siblings, peers, friends, parents, teachers) but also in connectedness to places in which these relationships occur (e.g., school, home, neighborhood). Second, adolescent connectedness can be characterized as predominately conventional or unconventional, with conventional connectedness reflecting connectedness to people and places that are of the world of adults (e.g., home, school) and unconventional connectedness reflecting connectedness to youth-governed people and places (e.g., connectedness to friends, romantic partners, and in the neighborhood). Third, a second dimension to these forms of connection is a temporal orientation, with some forms of connectedness being future oriented (e.g., to school and to teachers) and others more present oriented (e.g., connectedness to friends). Fourth, adolescent connectedness generalizes from individual relationships to the larger institutions or context in which those relationships occur. Finally, the theory proposes that the source of connectedness is feelings of relatedness and belonging. Experiences of receiving social support from others (e.g., parents, peers, teachers, friends) trigger these feelings of relatedness (to individuals) and belongingness (to groups or in places) which are reciprocated through connectedness. Therefore, adolescent connectedness is affective and behavioral reciprocation to others of their gestures of caring and support. When youth feel valued and cared for by others and particular places, they, in turn, demonstrate a reciprocation of these feelings by caring for and being actively involved with others. In sum, adolescent connectedness reflects youths’ affective and behavioral involvement with other people and places within the ecologies in their lives, and it reflects both conventionality, temporality, and generalizability. The reference for the Parent and Teacher versions can be: Karcher, M. J. (in preparation). Measuring adolescent connectedness: A guide for school-based
assessment and program evaluation. In H. L. K. Coleman & C. Yeh (Eds.), Handbook of School Counseling. Mahwah: Lawrence Erlbaum.
Relevant articles using the adolescent version: Karcher, M. J. & L. Finn. (2005). How connectedness contributes to experimental smoking
among rural youth: Developmental and ecological analyses. Journal of Primary Prevention, 26, 25-36.
Karcher, M. J. (2005). The effects of school-based developmental mentoring and mentors'
attendance on mentees' self-esteem, behavior, and connectedness. Psychology in the Schools, 42, 65-77.
Karcher, M. J. (2004). Connectedness and school violence: A framework for developmental
interventions. In E. Gerler (Ed.), Handbook of school violence (pp. 7-42). Binghamton, NY: Haworth Press.

The Hemingway: Measure of Adolescent Connectedness Scoring Manual p. 79
Copyright © 2011 Michael J. Karcher, Ed.D., Ph.D. [email protected]
Karcher, M. J., & Lindwall, J. (2003). Social interest, connectedness, and challenging
experiences. What makes high school mentors persist? Journal of Individual Psychology, 59, 293-315.
Karcher, M. J. (2003a). The Hemingway: Measure of Adolescent Connectedness: Validation
studies. ERIC no. ED477969; ERIC/CASS no. CG032433. Karcher, M. J. (2003b). The Hemingway—Measure of Adolescent Connectedness: A manual for interpretation
and scoring. Unpublished manuscript, University of Texas at San Antonio. Karcher, M. J. (2002). The cycle of violence and disconnection among rural middle school
students: Teacher disconnection as a consequence of violence. The Journal of School Violence, 1, 35-51
Karcher, M. J., Davis, C., & Powell, B. (2002). Developmental mentoring in the schools: Testing
connectedness as a mediating variable in the promotion of academic achievement. The School Community Journal, 12, 36-52.

The Hemingway: Measure of Adolescent Connectedness Scoring Manual p. 80
Copyright © 2011 Michael J. Karcher, Ed.D., Ph.D. [email protected]
Parent Hemingway items for subscales: Parents, siblings, school, peers, and teacher.
4c My child would say “Our family has fun together.”
5c My child has a lot of fun with his/her brother(s) or sister(s).
6c My child works hard at school.
7c My child’s classmates often bother him/her.
8c My child cares what his/her teachers think of him/her.
14c My child feels we (his/her parents/guardians) trust him/her.
15c My child feels close to his/her brother(s) or sister(s).
16c My child enjoys being at school.
17c My child likes most of the other kids at school.
18c My child does not get along with some of his/her teachers.
24c My child enjoys spending time with us (parent/guardians).
25c My child enjoys spending time with his/her brothers/sisters.
26c My child gets bored at school.
27c My child likes working with classmates.
28c My child wants to be respected by his/her teachers.
34c My child would say we disagree about many things.
35c My child wants to spend time with his/her brothers/sisters.
36c My child currently does well in school.
37c My child gets along well with other students in class.
38c My child tries to get along with his/her teachers.
44c My child would say she/he and we (parents) get along well.
45c My child avoids his/her brother/sister(s).
46c My child feels good about him/herself at school.
47c My child is liked by other students.
48c My child always tries hard to earn his/her teachers’ trust.
54c My child would say we care about him/her very much.
56c Doing well in school is important to my child.
50c My child usually likes his/her teachers. Sentences 7, 18, 26, 34, and 45 in italics and bolded are to be reversed scored (and not italicized in actual survey, of course).

The Hemingway: Measure of Adolescent Connectedness Scoring Manual p. 81
Copyright © 2011 Michael J. Karcher, Ed.D., Ph.D. [email protected]
Teacher Hemingway items for subscales: Connectedness to school, peers, and teachers 6c This child works hard at school. 7c This child’s classmates often bother him/her. 8c This child cares what his/her teachers think of him/her. 16c This child enjoys being at school. 17c This child likes most of the other kids at school. 18c This child does not get along with some of his/her
teachers. 26c This child gets bored at school. 27c This child likes working with classmates. 28c This child wants to be respected by his/her teachers. 36c This child currently does well in school. 37c This child gets along well with other students in class. 38c This child tries to get along with his/her teachers. 46c This child feels good about him/herself at school. 47c This child is liked by other students. 48c This child always tries hard to earn his/her teachers’ trust. 56c Doing well in school is important to this child. 57c This child rarely fights or argues with other students. 50c This child usually likes his/her teachers. Sentences 7, 18, and 26 in italics and bolded are to be reversed scored (and not italicized in actual survey, of course).
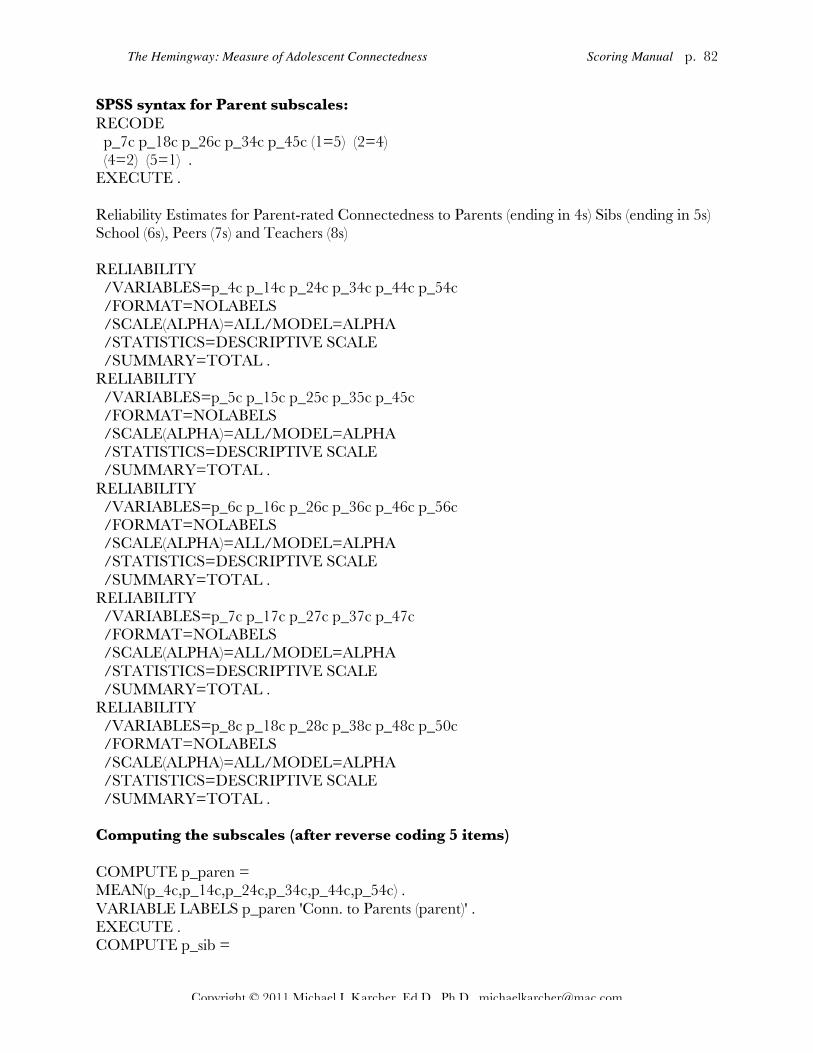
The Hemingway: Measure of Adolescent Connectedness Scoring Manual p. 82
Copyright © 2011 Michael J. Karcher, Ed.D., Ph.D. [email protected]
SPSS syntax for Parent subscales: RECODE p_7c p_18c p_26c p_34c p_45c (1=5) (2=4) (4=2) (5=1) . EXECUTE . Reliability Estimates for Parent-rated Connectedness to Parents (ending in 4s) Sibs (ending in 5s) School (6s), Peers (7s) and Teachers (8s) RELIABILITY /VARIABLES=p_4c p_14c p_24c p_34c p_44c p_54c /FORMAT=NOLABELS /SCALE(ALPHA)=ALL/MODEL=ALPHA /STATISTICS=DESCRIPTIVE SCALE /SUMMARY=TOTAL . RELIABILITY /VARIABLES=p_5c p_15c p_25c p_35c p_45c /FORMAT=NOLABELS /SCALE(ALPHA)=ALL/MODEL=ALPHA /STATISTICS=DESCRIPTIVE SCALE /SUMMARY=TOTAL . RELIABILITY /VARIABLES=p_6c p_16c p_26c p_36c p_46c p_56c /FORMAT=NOLABELS /SCALE(ALPHA)=ALL/MODEL=ALPHA /STATISTICS=DESCRIPTIVE SCALE /SUMMARY=TOTAL . RELIABILITY /VARIABLES=p_7c p_17c p_27c p_37c p_47c /FORMAT=NOLABELS /SCALE(ALPHA)=ALL/MODEL=ALPHA /STATISTICS=DESCRIPTIVE SCALE /SUMMARY=TOTAL . RELIABILITY /VARIABLES=p_8c p_18c p_28c p_38c p_48c p_50c /FORMAT=NOLABELS /SCALE(ALPHA)=ALL/MODEL=ALPHA /STATISTICS=DESCRIPTIVE SCALE /SUMMARY=TOTAL . Computing the subscales (after reverse coding 5 items) COMPUTE p_paren = MEAN(p_4c,p_14c,p_24c,p_34c,p_44c,p_54c) . VARIABLE LABELS p_paren 'Conn. to Parents (parent)' . EXECUTE . COMPUTE p_sib =

The Hemingway: Measure of Adolescent Connectedness Scoring Manual p. 83
Copyright © 2011 Michael J. Karcher, Ed.D., Ph.D. [email protected]
MEAN(p_5c,p_15c,p_25c,p_35c,p_45c) . VARIABLE LABELS p_sib 'Conn. to Siblings (parent)' . EXECUTE . COMPUTE p_schol = MEAN(p_6c,p_16c,p_26c,p_36c,p_46c,p_56c) . VARIABLE LABELS p_schol 'Conn. to School (parent)' . EXECUTE . COMPUTE p_peer = MEAN(p_7c,p_17c,p_27c,p_37c,p_47c) . VARIABLE LABELS p_peer 'Conn. to Peers (parent)' . EXECUTE . COMPUTE p_teach = MEAN(p_8c,p_18c,p_28c,p_38c,p_48c,p_50c) . VARIABLE LABELS p_teach 'Conn. to Teachers (parent)' . EXECUTE . SPSS syntax for Teacher subscales: RECODE t_7c t_18c t_26c (1=5) (2=4) (4=2) (5=1) . EXECUTE . Reliability Estimates for Teacher-rated Connectedness to School (6s), Peers (7s) and Teachers (8s) COMPUTE t_schol = MEAN(t_6c,t_16c,t_26c,t_36c,t_46c,t_56c) . VARIABLE LABELS t_schol 'Conn. to School (teacher)' . EXECUTE . COMPUTE t_peer = MEAN(t_7c,t_17c,t_27c,t_37c,t_47c,t_57c) . VARIABLE LABELS t_peer 'Conn. to Peers (teacher)' . EXECUTE . COMPUTE t_teach = MEAN(t_8c,t_18c,t_28c,t_38c,t_48c,t_50c) . VARIABLE LABELS t_teach 'Conn. to Teachers (teacher)' . EXECUTE . COMPUTE t_schol = MEAN(t_6c,t_16c,t_26c,t_36c,t_46c,t_56c) . VARIABLE LABELS t_schol 'Conn. to School (teacher)' . EXECUTE . COMPUTE t_peer = MEAN(t_7c,t_17c,t_27c,t_37c,t_47c,t_57c) . VARIABLE LABELS t_peer 'Conn. to Peers (teacher)' . EXECUTE . COMPUTE t_teach = MEAN(t_8c,t_18c,t_28c,t_38c,t_48c,t_50c) . VARIABLE LABELS t_teach 'Conn. to Teachers (teacher)' . EXECUTE .

The Hemingway: Measure of Adolescent Connectedness Scoring Manual p. 84
Copyright © 2011 Michael J. Karcher, Ed.D., Ph.D. [email protected]
Reliability estimates from three groups of Hispanic parents and from two groups of teachers who were 2/5 Hispanic 2/5 White, and less than 1/5 Black: Parent ratings of Connectedness to School N of Cases = 295.0 N of Items = 6 Alpha = .8018 Parent ratings of Connectedness to Parents N of Cases = 218.0 N of Items = 6 Alpha = .8101 Parents N of Cases = 186.0 N of Items = 6 Alpha = .8456 Parents Parent ratings of Connectedness to Siblings N of Cases = 288.0 N of Items = 5 Alpha = .8554 N of Cases = 213.0 N of Items = 5 Alpha = .8551 Siblings N of Cases = 181.0 N of Items = 5 Alpha = .8489 Siblings by parents Parent ratings of Connectedness to School N of Cases = 298.0 N of Items = 6 Alpha = .8185 N of Cases = 209.0 N of Items = 6 Alpha = .8361 School N of Cases = 183.0 N of Items = 6 Alpha = .8470 School by Parents Parent ratings of Connectedness to Peers N of Cases = 293.0 N of Items = 5 Alpha = .7345 N of Cases = 209.0 N of Items = 5 Alpha = .7590 of Cases = 181.0 N of Items = 5 Alpha = .7298 Peers by parents Parent ratings of Connectedness to Teachers
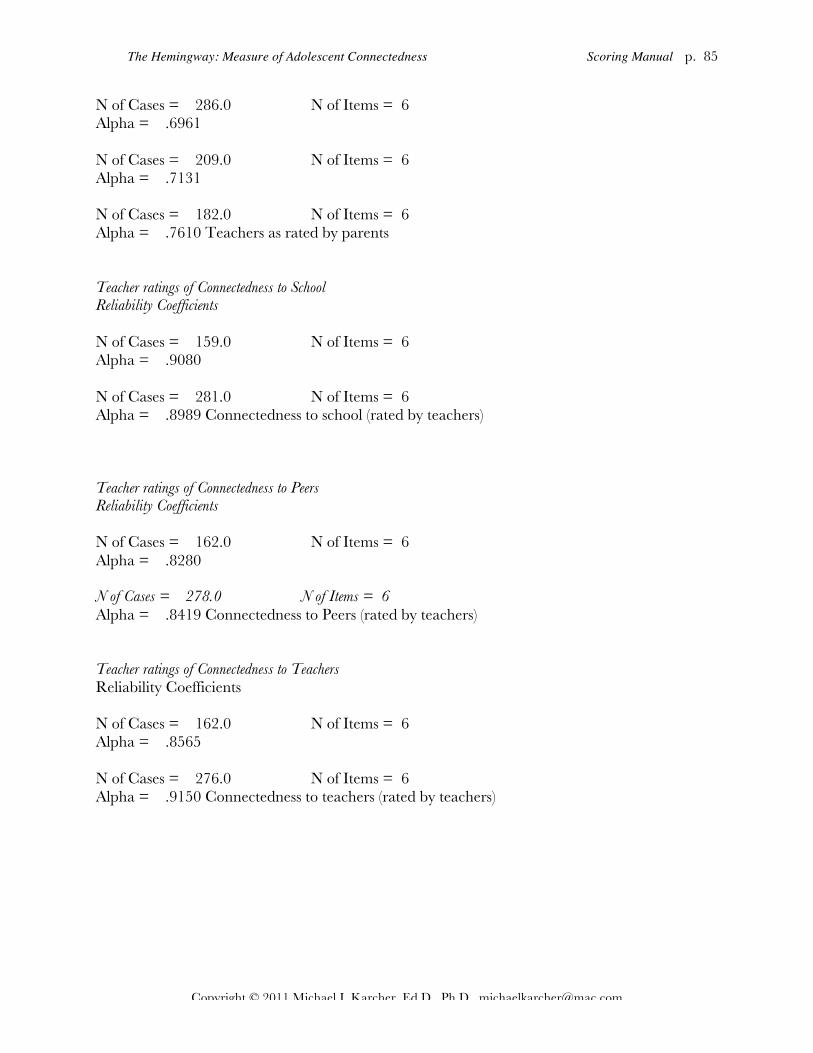
The Hemingway: Measure of Adolescent Connectedness Scoring Manual p. 85
Copyright © 2011 Michael J. Karcher, Ed.D., Ph.D. [email protected]
N of Cases = 286.0 N of Items = 6 Alpha = .6961 N of Cases = 209.0 N of Items = 6 Alpha = .7131 N of Cases = 182.0 N of Items = 6 Alpha = .7610 Teachers as rated by parents Teacher ratings of Connectedness to School Reliability Coefficients N of Cases = 159.0 N of Items = 6 Alpha = .9080 N of Cases = 281.0 N of Items = 6 Alpha = .8989 Connectedness to school (rated by teachers) Teacher ratings of Connectedness to Peers Reliability Coefficients N of Cases = 162.0 N of Items = 6 Alpha = .8280 N of Cases = 278.0 N of Items = 6 Alpha = .8419 Connectedness to Peers (rated by teachers) Teacher ratings of Connectedness to Teachers Reliability Coefficients N of Cases = 162.0 N of Items = 6 Alpha = .8565 N of Cases = 276.0 N of Items = 6 Alpha = .9150 Connectedness to teachers (rated by teachers)
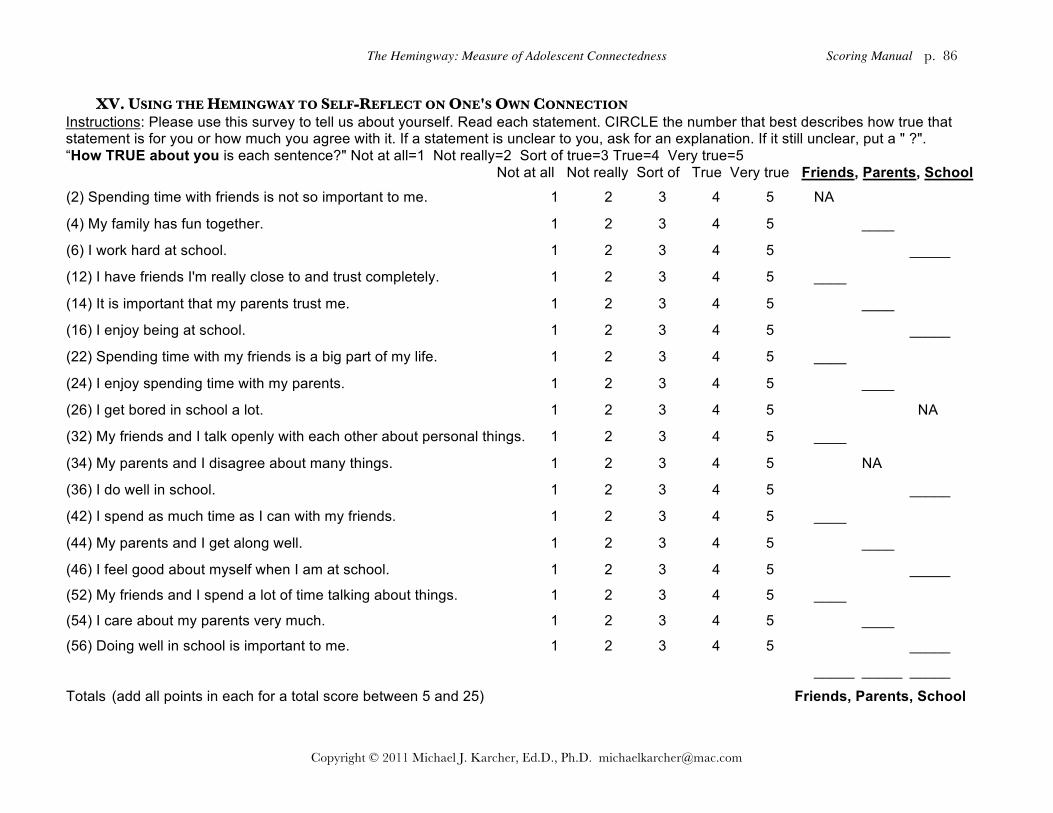
The Hemingway: Measure of Adolescent Connectedness Scoring Manual p. 86
Copyright © 2011 Michael J. Karcher, Ed.D., Ph.D. [email protected]
XV. USING THE HEMINGWAY TO SELF-REFLECT ON ONE'S OWN CONNECTION Instructions: Please use this survey to tell us about yourself. Read each statement. CIRCLE the number that best describes how true that statement is for you or how much you agree with it. If a statement is unclear to you, ask for an explanation. If it still unclear, put a " ?". “How TRUE about you is each sentence?" Not at all=1 Not really=2 Sort of true=3 True=4 Very true=5 Not at all Not really Sort of True Very true Friends, Parents, School (2) Spending time with friends is not so important to me. 1 2 3 4 5 NA
(4) My family has fun together. 1 2 3 4 5 ____
(6) I work hard at school. 1 2 3 4 5 _____
(12) I have friends I'm really close to and trust completely. 1 2 3 4 5 ____
(14) It is important that my parents trust me. 1 2 3 4 5 ____
(16) I enjoy being at school. 1 2 3 4 5 _____
(22) Spending time with my friends is a big part of my life. 1 2 3 4 5 ____
(24) I enjoy spending time with my parents. 1 2 3 4 5 ____
(26) I get bored in school a lot. 1 2 3 4 5 NA
(32) My friends and I talk openly with each other about personal things. 1 2 3 4 5 ____
(34) My parents and I disagree about many things. 1 2 3 4 5 NA
(36) I do well in school. 1 2 3 4 5 _____
(42) I spend as much time as I can with my friends. 1 2 3 4 5 ____
(44) My parents and I get along well. 1 2 3 4 5 ____
(46) I feel good about myself when I am at school. 1 2 3 4 5 _____
(52) My friends and I spend a lot of time talking about things. 1 2 3 4 5 ____
(54) I care about my parents very much. 1 2 3 4 5 ____
(56) Doing well in school is important to me. 1 2 3 4 5 _____
_____ _____ _____
Totals (add all points in each for a total score between 5 and 25) Friends, Parents, School
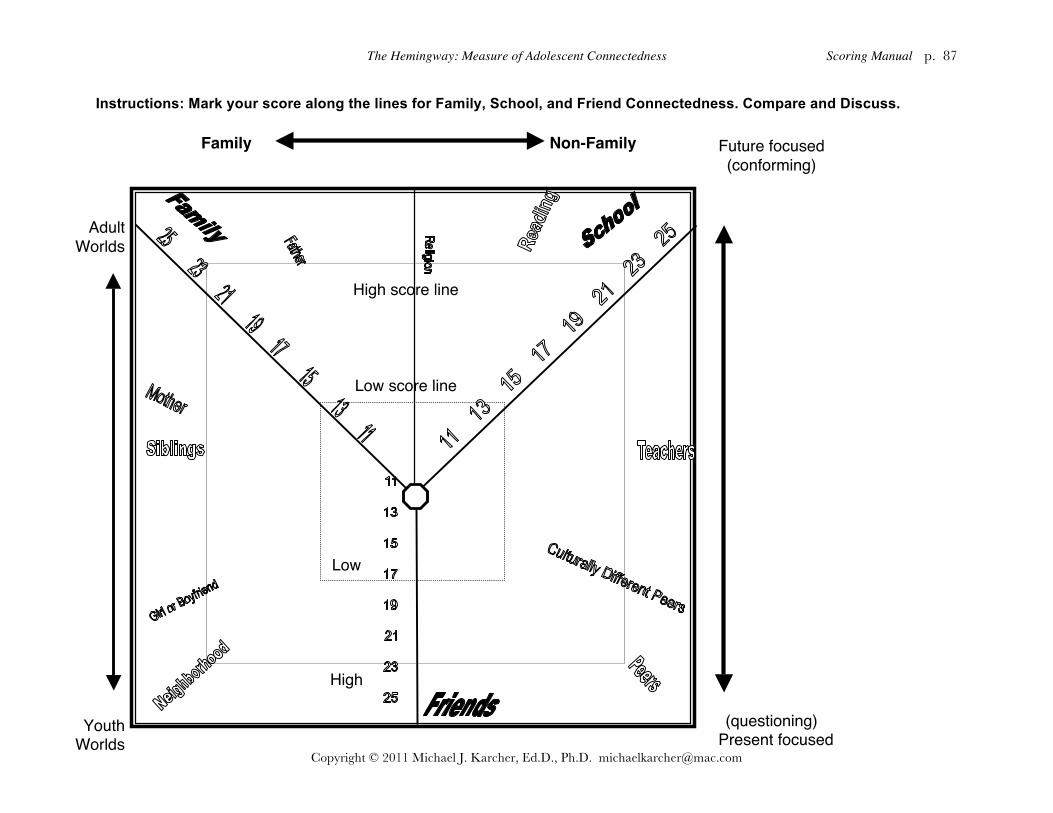
The Hemingway: Measure of Adolescent Connectedness Scoring Manual p. 87
Copyright © 2011 Michael J. Karcher, Ed.D., Ph.D. [email protected]
Instructions: Mark your score along the lines for Family, School, and Friend Connectedness. Compare and Discuss.
Family Non-Family
Adult Worlds
Youth Worlds
Future focused (conforming)
(questioning)
Present focused
High score line
Low score line
Low
High

The Hemingway: Measure of Adolescent Connectedness Scoring Manual p. 88
Copyright © 2011 Michael J. Karcher, Ed.D., Ph.D. [email protected]
XVI. FORMS SCANTRON FORMS FOR ADOLESCENT VERSION (Long and Short Forms are available for
purchase and rapid scoring or can be downloaded from www.adolescentconnectedness.com) SPANISH (US, on website as locked pdf, AND CHILEAN) CHINESE (Mainland, Korean scale in article by Karcher and Lee below) FRENCH ADOLESCENT VERSION 5.5 (in Karcher and Sass, 2010 article below and p. 48 of manual) CHILD/PRE-ADOLESCENT VERSION 5 (p. 60 of manual) COLLEGE 4 (Late Adolescent Version in manual, last "translation" before below articles) XVII. PUBLISHED PAPERS DESCRIBING ENGLISH, CHINESE, AND SPANISH VERSIONS AND
FACTORIAL VALIDITY EVIDENCE FOR EACH Karcher, M. J., & Sass, D. (2010). A multicultural assessment of adolescent connectedness:
Testing measurement invariance across gender and ethnicity. Journal of Counseling Psychology, 57(3), 274-289. doi: 10.1037/a0019357
McWhirter, B. T., & McWhirter, E. H. (2011). Connectedness among Chilean adolescents:
Factor analysis of the Hemingway Measure of Adolescent Connectedness. PSYKHE, 20(1), 45-62.
Karcher, M. J., & Lee, Y. (2002). Connectedness among Taiwanese Middle School Students: A
Validation Study of the Hemingway Measure of Adolescent Connectedness. Asia Pacific Education Review, 3(1), 92-114.
Karcher, M. J., Holcomb, M., & Zambrano, E. (2008). Measuring adolescent connectedness: A
guide for school-based assessment and program evaluation. In H. L. K. Coleman & C. Yeh (Eds.), Handbook of school counseling (pp. 649-669). Mahwah: Lawrence Erlbaum. (These are the uncorrected proofs--pardon errors and typos, but this is a much smaller file than the final scanned version I have).


![Psychological test descriptions revised 6 - ntschools.org · Web view3.7] (MMPI-A) Minnesota Multiphasic Personality Inventory-Adolescent: An empirically based measure of adolescent](https://img.pdfslide.net/doc/110x75/5ca1a42a88c993eb5d8cb1b4/psychological-test-descriptions-revised-6-web-view37-mmpi-a-minnesota-multiphasic.jpg)


![Financial and Macroeconomic Connectedness [Dr.soc]](https://img.pdfslide.net/doc/110x75/577c7c781a28abe0549ab7a8/financial-and-macroeconomic-connectedness-drsoc.jpg)