Embed Size (px)
Citation preview
APPLIED ANALYTICS IN MARKETING
MEASURE TOMORROW
NOVEMBER 2019

TABLE OF CONTENTS˃ About WITSIDE
˃ Marketing Today
˃ Top Challenges
˃ Identifying the Right Analytics Solution
˃ Applied Analytics in Marketing
˃ Real-World Impact of Marketing Analytics
˃ Success Stories
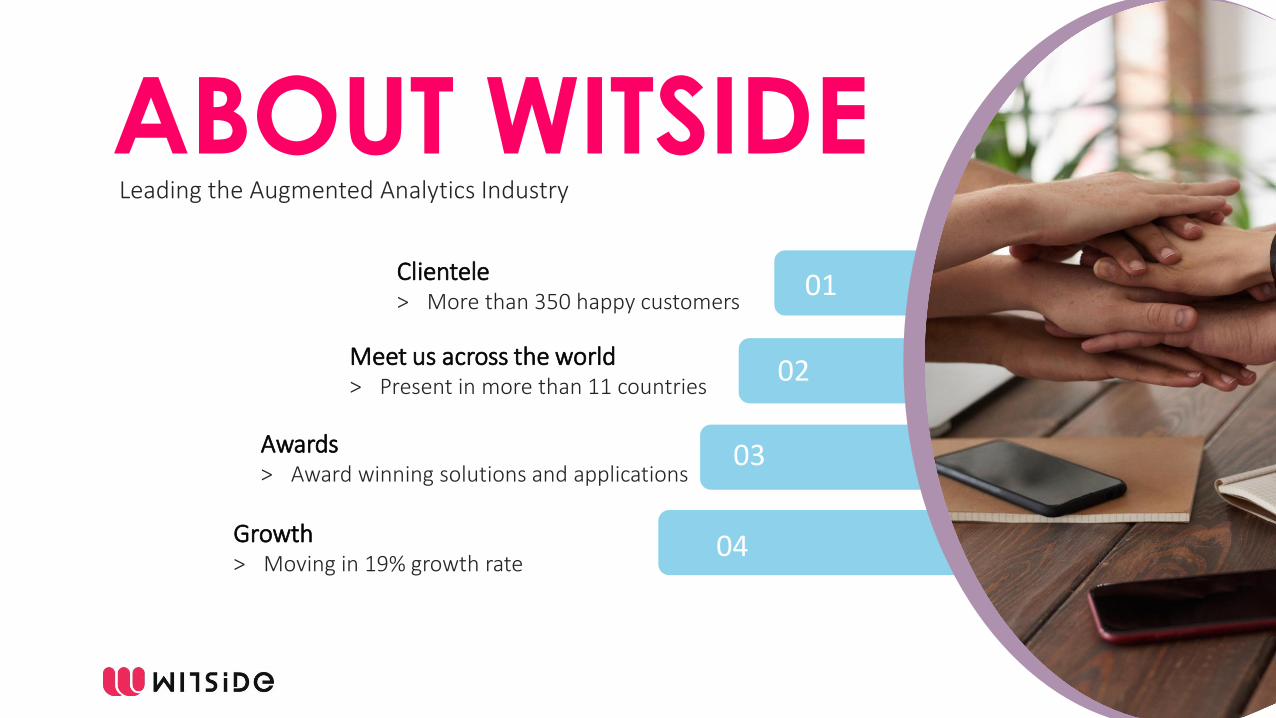
ABOUT WITSIDELeading the Augmented Analytics Industry
Clientele> More than 350 happy customers
01
02
03
04
Meet us across the world> Present in more than 11 countries
Awards> Award winning solutions and applications
Growth> Moving in 19% growth rate
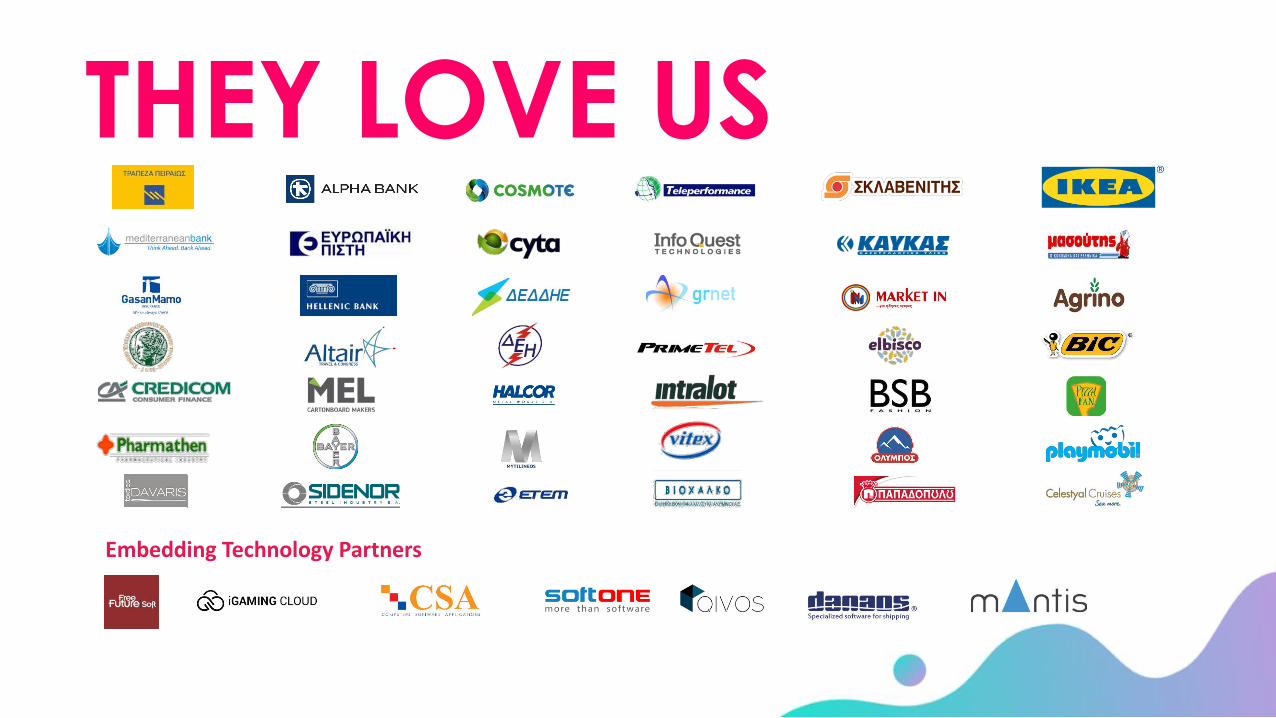
THEY LOVE US
Embedding Technology Partners
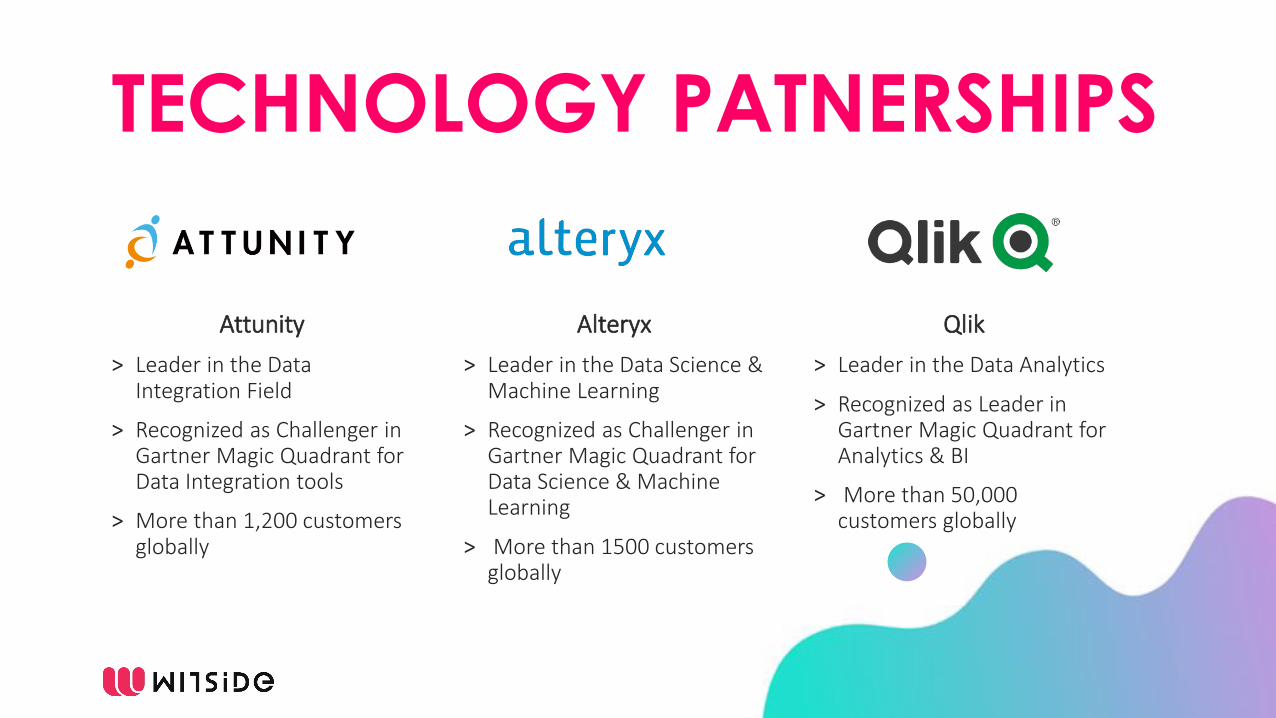
TECHNOLOGY PATNERSHIPS
Attunity
˃ Leader in the Data Integration Field
˃ Recognized as Challenger in Gartner Magic Quadrant for Data Integration tools
˃ More than 1,200 customers globally
Alteryx
˃ Leader in the Data Science & Machine Learning
˃ Recognized as Challenger in Gartner Magic Quadrant for Data Science & Machine Learning
˃ More than 1500 customers globally
Qlik
˃ Leader in the Data Analytics
˃ Recognized as Leader in Gartner Magic Quadrant for Analytics & BI
˃ More than 50,000 customers globally
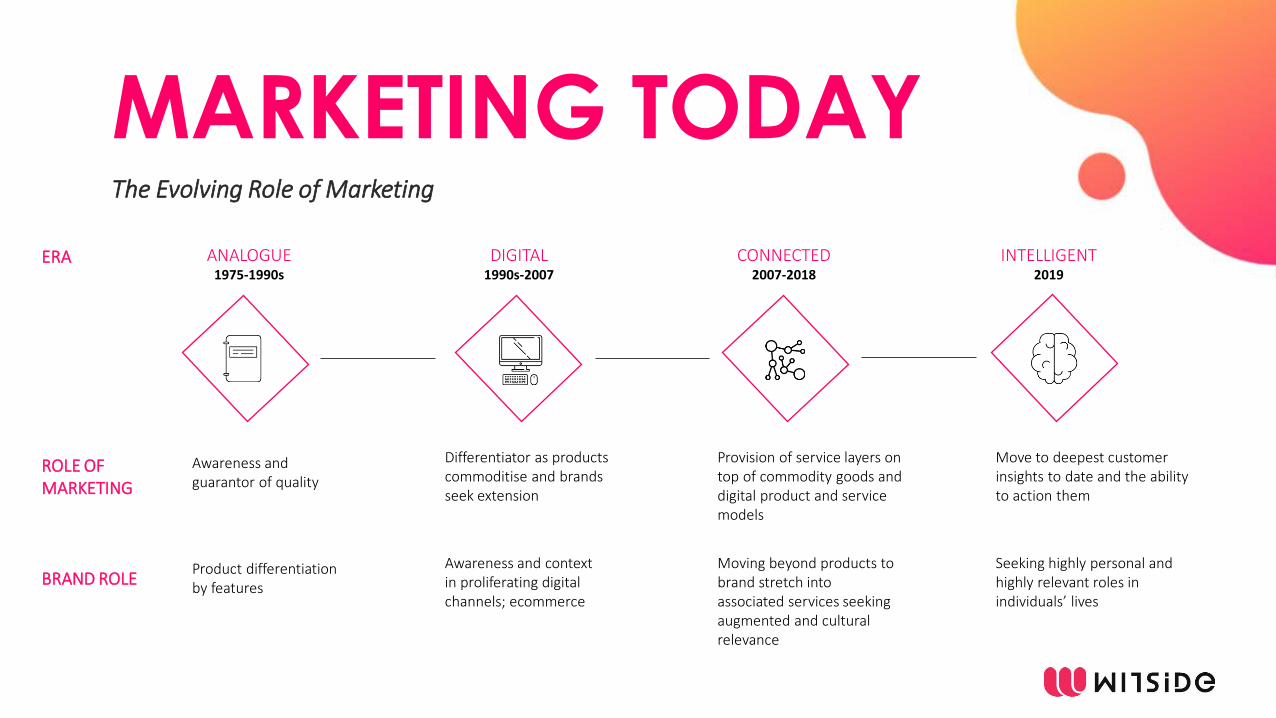
The Evolving Role of Marketing
MARKETING TODAY
ERA
ROLE OF
MARKETING
BRAND ROLE
ANALOGUE1975-1990s
DIGITAL1990s-2007
CONNECTED2007-2018
INTELLIGENT2019
Product differentiation
by features
Awareness and
guarantor of quality
Awareness and context
in proliferating digital
channels; ecommerce
Differentiator as products
commoditise and brands
seek extension
Moving beyond products to
brand stretch into
associated services seeking
augmented and cultural
relevance
Provision of service layers on
top of commodity goods and
digital product and service
models
Seeking highly personal and
highly relevant roles in
individuals’ lives
Move to deepest customer
insights to date and the ability
to action them
The Rise of Data Driven Marketing
˃ Multiple touchpoints (physical, digital) creating a huge data volume
˃ Digital marketing is taking over the field significantly contributing in the increase of data gathering
˃ Personalization (personalized content, communication, products) powered by the data availability
˃ Omni-channel marketing requiring the usage of multiple platforms
˃ User - generated content, encouraging the audience to generate their own content by offering an incentive
MARKETING TODAY

IN SHORT, MARKETING ANALYTICS IN DECISION MAKING WILL BE USED DRASTICALLY
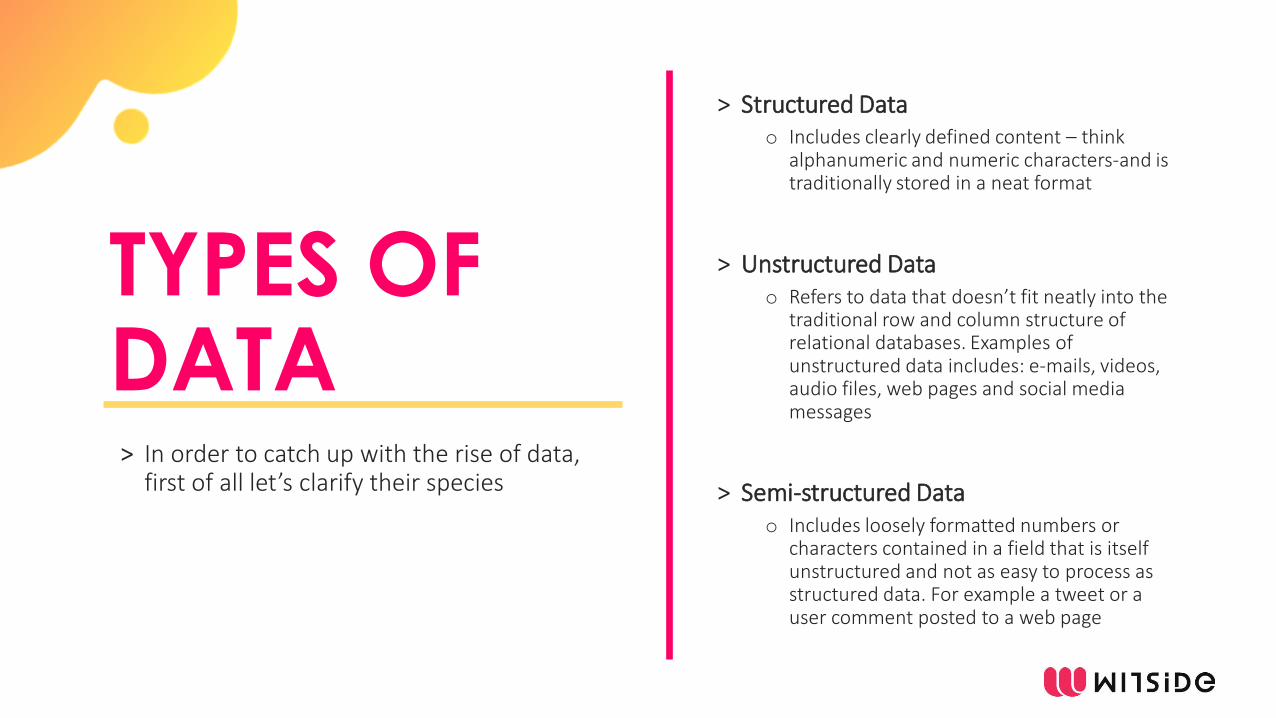
˃ Structured Data
o Includes clearly defined content – think alphanumeric and numeric characters-and is traditionally stored in a neat format
˃ Unstructured Data
o Refers to data that doesn’t fit neatly into the traditional row and column structure of relational databases. Examples of unstructured data includes: e-mails, videos, audio files, web pages and social media messages
˃ Semi-structured Data
o Includes loosely formatted numbers or characters contained in a field that is itself unstructured and not as easy to process as structured data. For example a tweet or a user comment posted to a web page
˃ In order to catch up with the rise of data, first of all let’s clarify their species
TYPES OF DATA
Time is a precious commodity when it comes to actionable marketing analytics
˃ Searching for data they know exists, including investigating email conversations and siloed files
˃ Prepping and blending data derived from Excel Spreadsheets, homegrown databases, and other sources
˃ Asking from help from IT department to extract, transform or load data
˃ Waiting for other departments to take their own step in the analytics process
˃ Completing tasks that require manual intervention- like generating report-which could be automated
Top Challenges marketers have to face
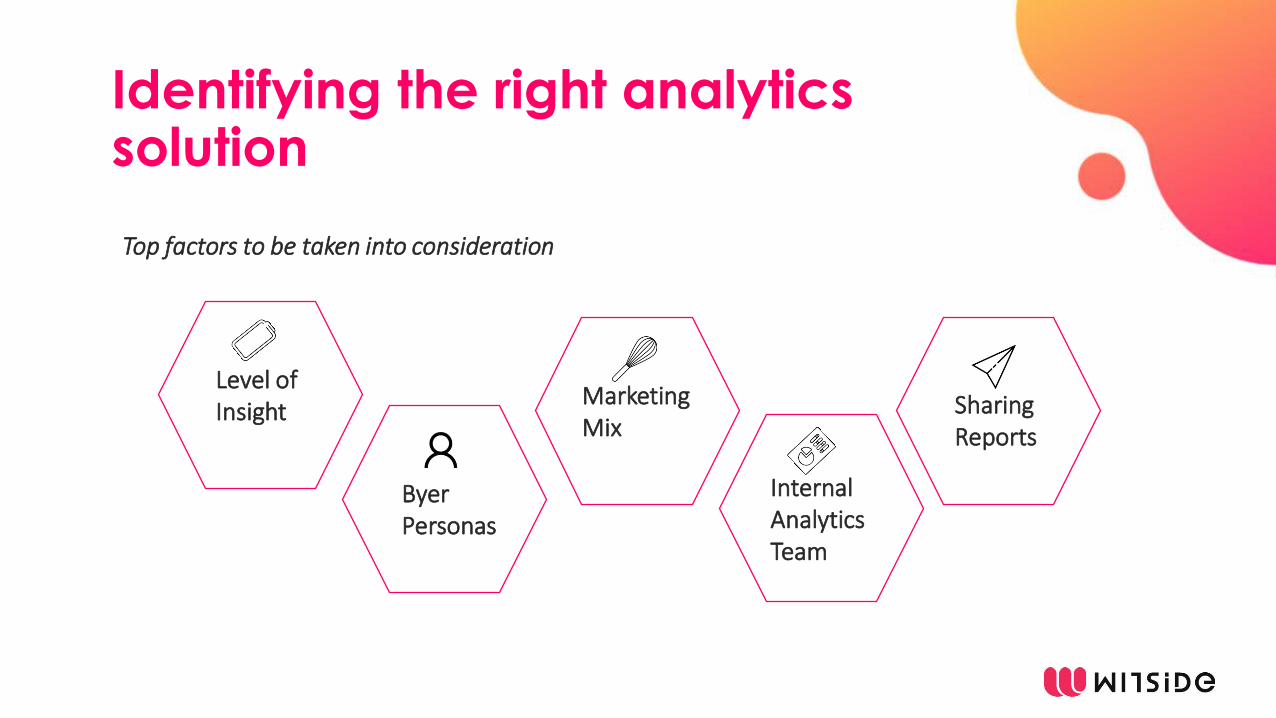
Top factors to be taken into consideration
Identifying the right analytics solution
Level of
Insight
Byer
Personas
Marketing
Mix
Internal
Analytics
Team
Sharing
Reports
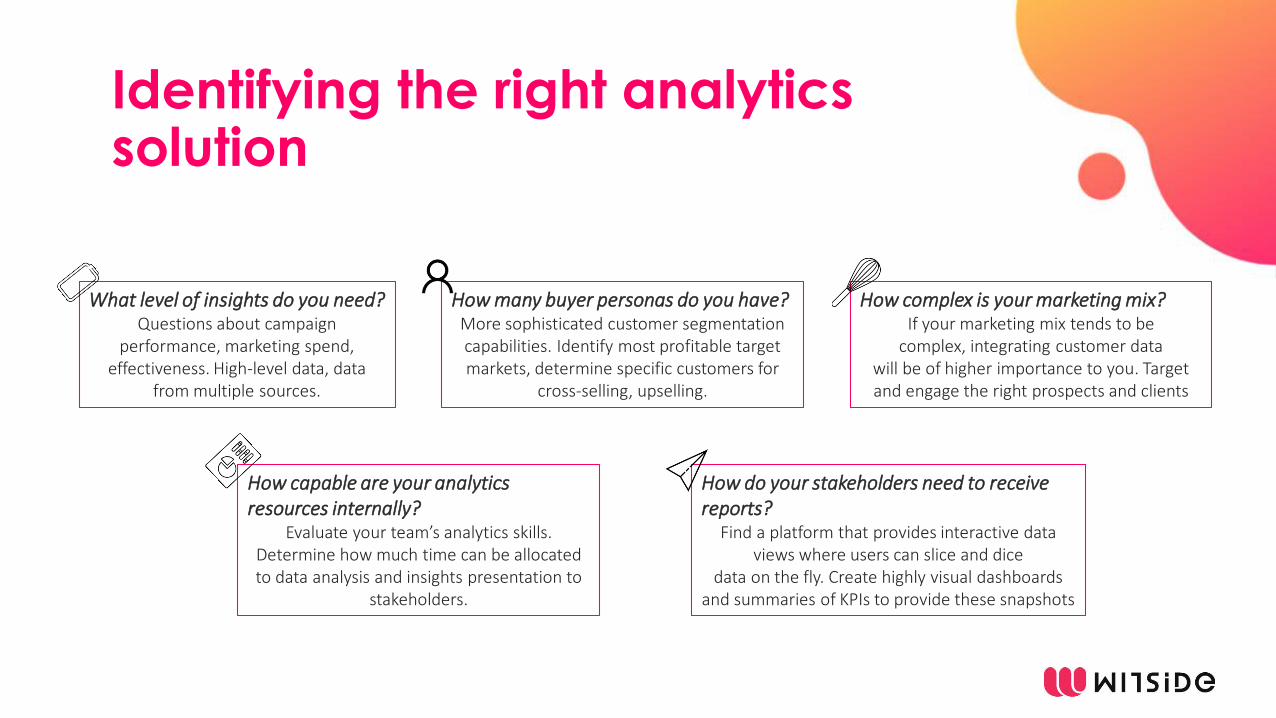
Identifying the right analytics solution
What level of insights do you need?
Questions about campaign
performance, marketing spend,
effectiveness. High-level data, data
from multiple sources.
How many buyer personas do you have?
More sophisticated customer segmentation
capabilities. Identify most profitable target
markets, determine specific customers for
cross-selling, upselling.
How complex is your marketing mix?
If your marketing mix tends to be
complex, integrating customer data
will be of higher importance to you. Target
and engage the right prospects and clients
How capable are your analytics
resources internally?
Evaluate your team’s analytics skills. Determine how much time can be allocated
to data analysis and insights presentation to
stakeholders.
How do your stakeholders need to receive
reports?
Find a platform that provides interactive data
views where users can slice and dice
data on the fly. Create highly visual dashboards
and summaries of KPIs to provide these snapshots
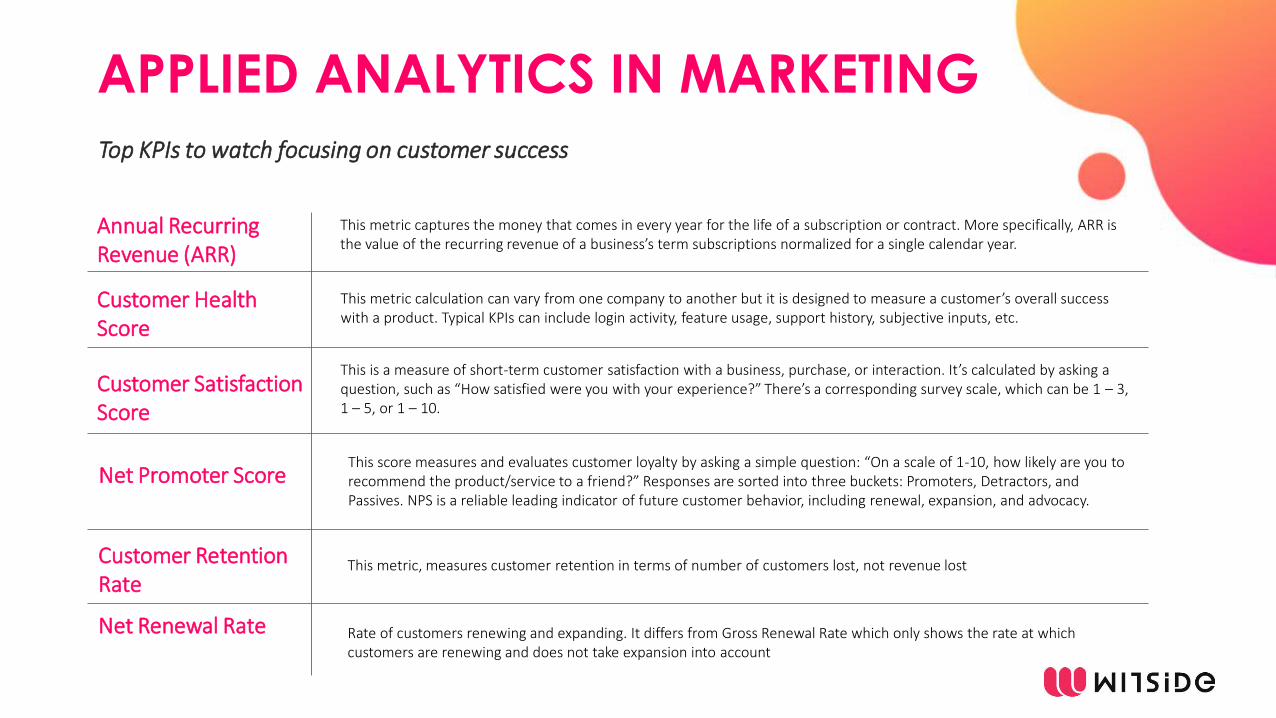
Top KPIs to watch focusing on customer success
APPLIED ANALYTICS IN MARKETING
Rate of customers renewing and expanding. It differs from Gross Renewal Rate which only shows the rate at which
customers are renewing and does not take expansion into account
This metric, measures customer retention in terms of number of customers lost, not revenue lost
This metric calculation can vary from one company to another but it is designed to measure a customer’s overall success with a product. Typical KPIs can include login activity, feature usage, support history, subjective inputs, etc.
This metric captures the money that comes in every year for the life of a subscription or contract. More specifically, ARR is
the value of the recurring revenue of a business’s term subscriptions normalized for a single calendar year.
This score measures and evaluates customer loyalty by asking a simple question: “On a scale of 1-10, how likely are you to
recommend the product/service to a friend?” Responses are sorted into three buckets: Promoters, Detractors, and Passives. NPS is a reliable leading indicator of future customer behavior, including renewal, expansion, and advocacy.
This is a measure of short-term customer satisfaction with a business, purchase, or interaction. It’s calculated by asking a question, such as “How satisfied were you with your experience?” There’s a corresponding survey scale, which can be 1 – 3,
1 – 5, or 1 – 10.
Annual Recurring
Revenue (ARR)
Customer Health
Score
Customer Satisfaction
Score
Net Promoter Score
Customer Retention
Rate
Net Renewal Rate
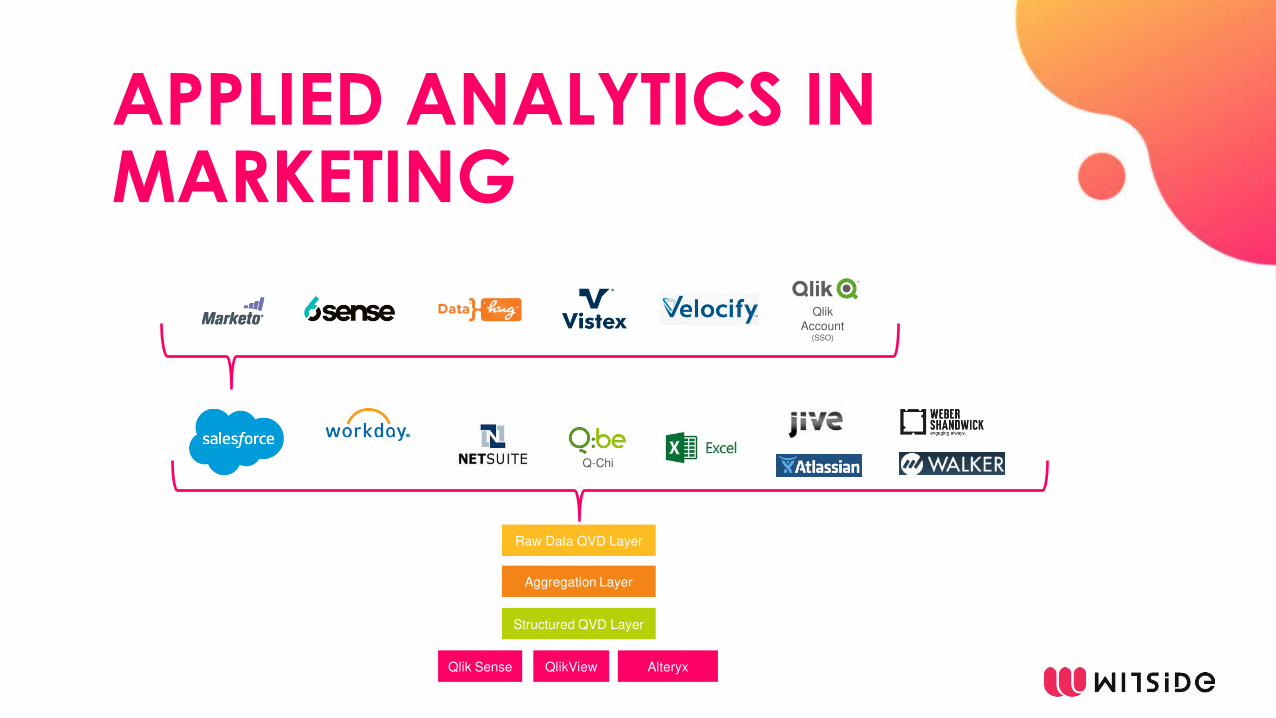
APPLIED ANALYTICS IN MARKETING
Q-Chi
Qlik
Account (SSO)
Raw Data QVD Layer
Aggregation Layer
Structured QVD Layer
Qlik Sense QlikView Alteryx
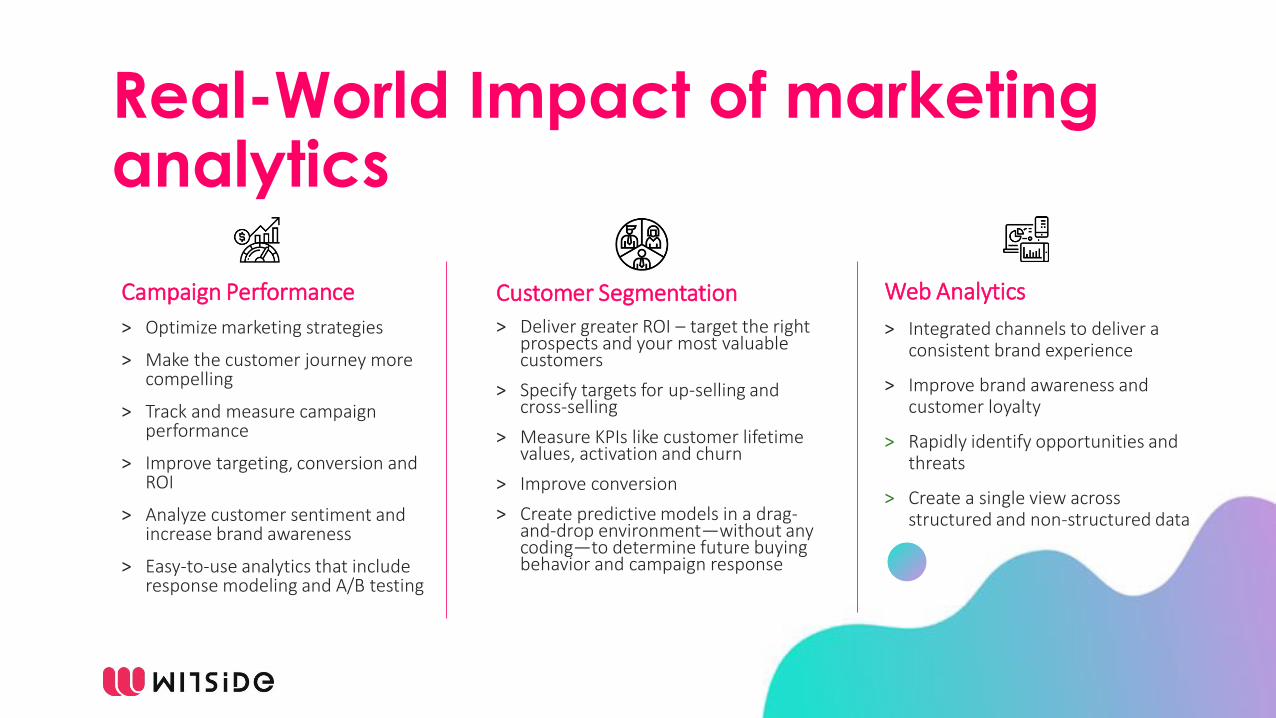
Campaign Performance
˃ Optimize marketing strategies
˃ Make the customer journey more compelling
˃ Track and measure campaign performance
˃ Improve targeting, conversion and ROI
˃ Analyze customer sentiment and increase brand awareness
˃ Easy-to-use analytics that include response modeling and A/B testing
Real-World Impact of marketing analytics
Customer Segmentation
˃ Deliver greater ROI – target the right prospects and your most valuable customers
˃ Specify targets for up-selling and cross-selling
˃ Measure KPIs like customer lifetime values, activation and churn
˃ Improve conversion
˃ Create predictive models in a drag-and-drop environment—without any coding—to determine future buying behavior and campaign response
Web Analytics
˃ Integrated channels to deliver a consistent brand experience
˃ Improve brand awareness and customer loyalty
˃ Rapidly identify opportunities and threats
˃ Create a single view across structured and non-structured data
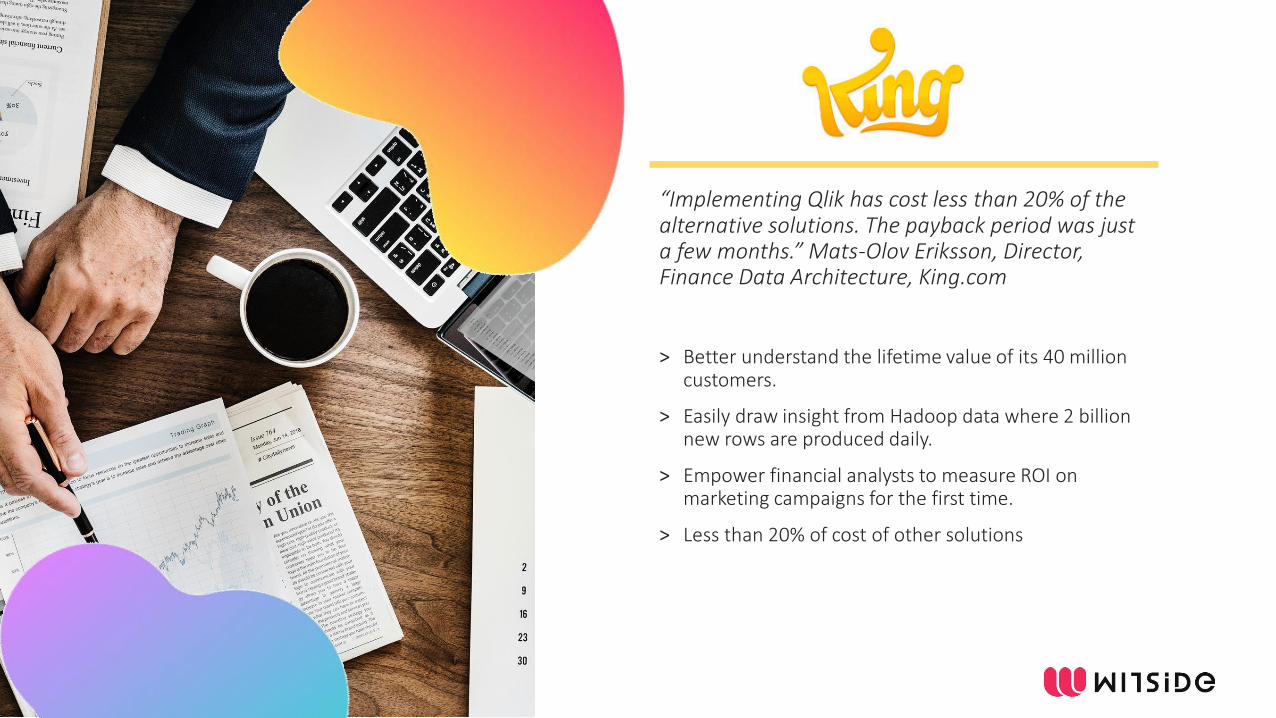
“Implementing Qlik has cost less than 20% of the alternative solutions. The payback period was just
a few months.” Mats-Olov Eriksson, Director,
Finance Data Architecture, King.com
˃ Better understand the lifetime value of its 40 million customers.
˃ Easily draw insight from Hadoop data where 2 billion new rows are produced daily.
˃ Empower financial analysts to measure ROI on marketing campaigns for the first time.
˃ Less than 20% of cost of other solutions
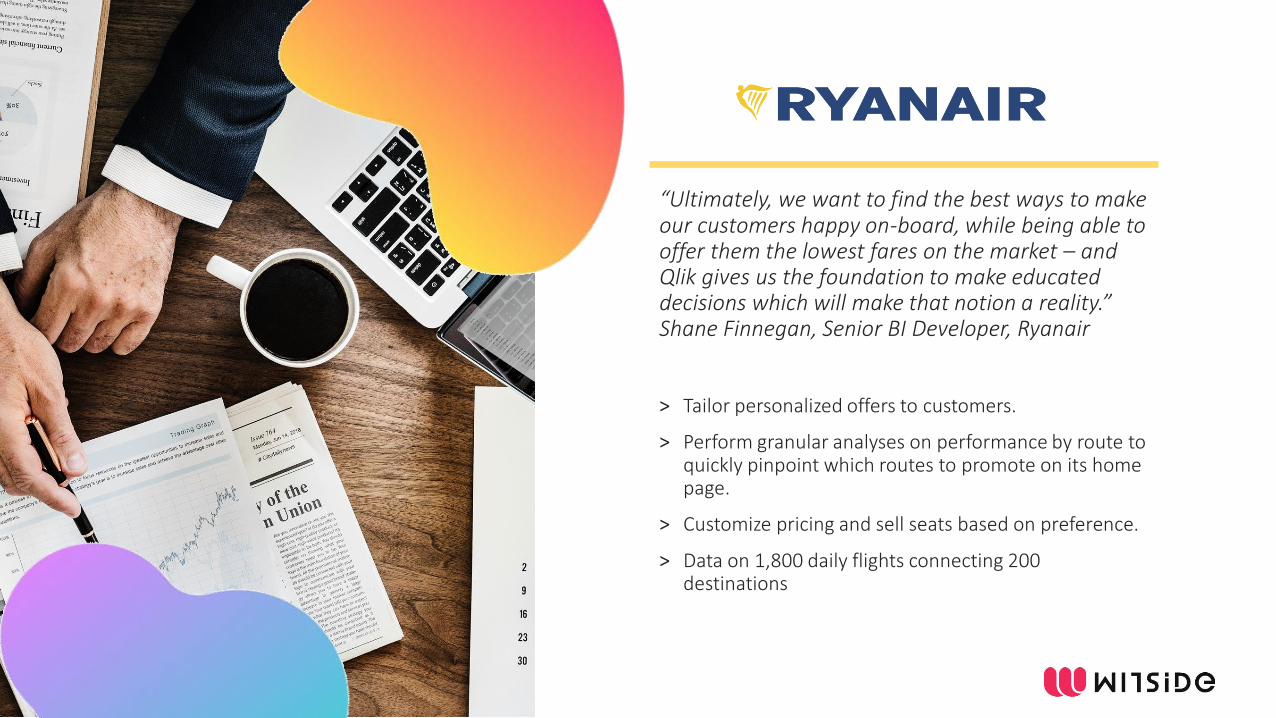
“Ultimately, we want to find the best ways to make our customers happy on-board, while being able to
offer them the lowest fares on the market – and
Qlik gives us the foundation to make educated
decisions which will make that notion a reality.” Shane Finnegan, Senior BI Developer, Ryanair
˃ Tailor personalized offers to customers.
˃ Perform granular analyses on performance by route to quickly pinpoint which routes to promote on its home page.
˃ Customize pricing and sell seats based on preference.
˃ Data on 1,800 daily flights connecting 200 destinations

“Instead of making someone learn SQL and Mongo, and taking about six months of time [for
training], the guys who are joining the team today
usually take about a week or two to get on the line
of work and they are able to make their own
workflows.” Anujay Mathur, Analytics team leader
˃ Generate reports in just a few hours instead of two full days, vastly improving their marketing agility
˃ Predictive analytics for targeted marketing increased email conversion rate. BookMyShow provided analytic insights to event venues, making them a trusted partner
˃ The intuitive interface allows a new hire to be trained and productive quickly, learning from prior work to innovate and explore new ideas in data

THANK YOU!

![Retail Industry Your Company. [Your Company] can help you… ˃ Reel in more first-time shoppers ˃ Boost repeat customer visits ˃ Bring in shoppers during](https://img.pdfslide.net/doc/110x75/56649e4b5503460f94b4077e/retail-industry-your-company-your-company-can-help-you-reel-in-more.jpg)


![Religious Organizations Your Company. [Your Company] can help you… ˃ Welcome more members ˃ Increase attendance ˃ Get members involved ˃ Maintain lasting](https://img.pdfslide.net/doc/110x75/56649e0e5503460f94af82fd/religious-organizations-your-company-your-company-can-help-you-welcome.jpg)


![Medical Industry Your Company. [Your Company] can help you… [Your Company] ˃ Reduce missed appointments ˃ Keep patients informed ˃ Gain word-of-mouth](https://img.pdfslide.net/doc/110x75/56649de95503460f94ae4608/medical-industry-your-company-your-company-can-help-you-your-company.jpg)
![6 - NSPS OOOO and OOOOa (2018 0731 0952) · Perform reduced emissions c ompletions/green completions: ˃ ˃ ˃] ˃ ˃](https://img.pdfslide.net/doc/110x75/5ec14b553e700b7ae2081734/6-nsps-oooo-and-ooooa-2018-0731-0952-perform-reduced-emissions-c-ompletionsgreen.jpg)
![Real Estate Your Company. [Your Company] can help you… ˃ Reach new prospects more effectively ˃ Provide instant information and updates ˃ Sell more homes](https://img.pdfslide.net/doc/110x75/56649db65503460f94aa7b86/real-estate-your-company-your-company-can-help-you-reach-new-prospects.jpg)