Embed Size (px)
Citation preview
DMD # 76414
1
Title Page
Measurement and Mathematical Characterization of Cell-Level
Pharmacokinetics of Antibody-Drug Conjugates: A Case Study with
Trastuzumab-vc-MMAE
Aman P. Singh and Dhaval K. Shah
Department of Pharmaceutical Sciences, School of Pharmacy and Pharmaceutical
Sciences, The State University of New York at Buffalo, 455 Kapoor Hall, Buffalo,
New York, 14214-8033, USA (A.P.S., D.K.S.).
This article has not been copyedited and formatted. The final version may differ from this version.DMD Fast Forward. Published on August 18, 2017 as DOI: 10.1124/dmd.117.076414
at ASPE
T Journals on June 11, 2018
dmd.aspetjournals.org
Dow
nloaded from
DMD # 76414
2
Running Title Page
Running Title: Single Cell PK Model for ADCs
Corresponding author: Dhaval K. Shah, Department of Pharmaceutical Sciences, 455
Kapoor Hall, School of Pharmacy and Pharmaceutical Sciences, University at Buffalo, the State
University of New York, Buffalo, New York 14214-8033. E-mail: [email protected]
Number of Text Pages: 35
Number of Tables: 2
Number of Figures: 7
Number of References: 24
Number of words in Abstract: 250
Number of words in Introduction: 747
Number of words in Discussion: 1502
List of Abbreviations:
ADC – Antibody-drug conjugate; BfA - Bafilomycin A1; LC-MS - Liquid chromatography-Mass
spectrometry; ELISA - Enzyme-linked immunosorbent assay; MMAE - Monomethyl Auristatin E; vc -
valine-citrulline; T-vc-MMAE - Trastuzumab-vc-MMAE; GSA - Global Sensitivity Analysis; DAR - Drug:
Antibody Ratio
This article has not been copyedited and formatted. The final version may differ from this version.DMD Fast Forward. Published on August 18, 2017 as DOI: 10.1124/dmd.117.076414
at ASPE
T Journals on June 11, 2018
dmd.aspetjournals.org
Dow
nloaded from
DMD # 76414
3
Abstract
The main objective of this work was to understand and mathematically characterize the cellular disposition
of a tool ADC, trastuzumab-vc-MMAE (T-vc-MMAE). Towards this goal, three different analytical
methods were developed to measure the concentrations of different ADC related analytes in the media and
cell lysate. An LC-MS/MS method was developed to quantify unconjugated drug (i.e. MMAE)
concentrations, a forced deconjugation method was developed to quantify total drug concentrations, and an
ELISA method was developed to quantify total antibody (i.e. trastuzumab) concentrations. Cellular
disposition studies were conducted in low-HER2 (GFP-MCF7) and high-HER2 expressing (N87) cell lines,
following continuous or 2h exposure of MMAE and T-vc-MMAE. Similar intracellular accumulation of
MMAE was observed between two cell lines following incubation with plain MMAE. However, when
incubated with T-vc-MMAE, much higher intracellular exposures of unconjugated drug, total drug, and
antibody were observed in N87 cells compared to GFP-MCF7 cells. A novel single cell disposition model
was developed to simultaneously characterize in vitro PK of all three analytes of the ADC in the media and
cellular space. The model was able to characterize all the data well, and provided robust estimates of
MMAE influx rate, MMAE efflux rate, and intracellular degradation rate for T-vc-MMAE. ADC
internalization and degradation rates, HER2 expression, and MMAE efflux rate were found to be the key
parameters responsible for intracellular exposure of MMAE, based on global sensitivity analysis. The single
cell PK model for ADCs presented here is expected to provide a better framework for characterizing
bystander effect of ADCs.
This article has not been copyedited and formatted. The final version may differ from this version.DMD Fast Forward. Published on August 18, 2017 as DOI: 10.1124/dmd.117.076414
at ASPE
T Journals on June 11, 2018
dmd.aspetjournals.org
Dow
nloaded from
DMD # 76414
4
Introduction
Antibody-drug Conjugates (ADCs) are a novel class of therapeutics that have demonstrated tremendous
growth over the last 5 years (Chari et al., 2014). Currently there are more than 55 ADCs in the clinical
development (Sohayla R, 2014). Ability of ADCs to specifically deliver highly potent cytotoxic agents to
targeted tumor cells not only enhances their overall efficacy but also mitigates their off-target toxicities,
leading to a better therapeutic index. Once at the site-of-action the ADC molecules bind to antigen
overexpressing tumor cells and internalizes into those cells via antigen-mediated internalization. Once
internalized, based on the linker chemistry, the ADC molecules get processed in the endosomal/lysosomal
space and release the potent cytotoxic agents, which diffuses to the cytoplasm or nucleus to induce the
pharmacological effect. This cellular processing of ADCs is at the center of the mechanism-of-action of
ADCs. Thus, it is crucial to measure and quantitatively characterize cellular level disposition of ADC and
its components to better understand the therapeutic behavior of ADCs and design better ADCs moving
forward.
In the past we have developed mathematical models to quantitatively characterize cellular and tissue level
disposition of ADCs, using the published experimental data from the two clinically approved ADCs (i.e.
SGN-35 and T-DM1) (Shah et al., 2013; Singh et al., 2015). A detailed quantitative analysis of these models
(i.e. pathway analysis and global sensitivity analysis) revealed that the cellular determinants of ADC
pharmacokinetics (PK) are key in sustaining desired drug concentrations in the tumor. Thus, a rigorous
understanding of cellular disposition of ADC is necessary to develop robust PK models of ADCs. In the
past, cellular disposition of ADC has been measured by a few groups, where either the antibody (Maass et
al., 2016) or the cytotoxic drug (Okeley et al., 2010; Erickson et al., 2012) was conjugated to a label to
enable quantification of ADC. However, this approach is limited by the accuracy of the technique, as these
techniques often detect the relative appearance/disappearance of the labels and do not provide the absolute
concentration of different ADC analytes. Consequently, in this manuscript we have quantified the cellular
This article has not been copyedited and formatted. The final version may differ from this version.DMD Fast Forward. Published on August 18, 2017 as DOI: 10.1124/dmd.117.076414
at ASPE
T Journals on June 11, 2018
dmd.aspetjournals.org
Dow
nloaded from
DMD # 76414
5
PK of a tool ADC using analytical techniques that are capable of measuring intracellular concentrations of
different ADC analytes. We have also characterized our in vitro PK data using a novel cell-level
mathematical model developed for ADCs. This model is different than other models developed in the past,
as in this new model we have characterized the PK of ADC in a single cell rather than assuming that all the
cells belong to a single cellular compartment.
Cellular disposition studies of the tool ADC trastuzumab-vc-MMAE (T-vc-MMAE) and plain MMAE were
performed in low-HER2 expressing (MCF7) and high-HER2 expressing (N87) cell lines. Three different
analytes: total trastuzumab, total MMAE (conjugated and unconjugated MMAE), and unconjugated
MMAE, were quantified in the extracellular and intracellular spaces using ELISA and LC/MS assays. A
novel single cell PK model was developed to mathematically characterizing the cellular and extracellular
PK of all three analytes simultaneously. A global sensitivity analysis of the structural model was performed
to identify the most sensitive parameters.
This article has not been copyedited and formatted. The final version may differ from this version.DMD Fast Forward. Published on August 18, 2017 as DOI: 10.1124/dmd.117.076414
at ASPE
T Journals on June 11, 2018
dmd.aspetjournals.org
Dow
nloaded from
DMD # 76414
6
Materials and Methods
Cell Lines Studied: The two cell lines used for investigating the cellular disposition of ADCs were
GFP-MCF7 and N87. GFP-MCF7 is the breast cancer cell line MCF7 that is stably transfected with green
fluorescent protein (GFP), and was acquired from Cell Biolabs Inc. MCF7 is known to express low levels
of HER2 receptors (HER2 0/1+) (Subik et al., 2010). GFP-MCF7 cells were grown in DMEM (high
glucose) supplemented with 10% fetal bovine serum (FBS), 0.1 mM MEM Non-essential Amino Acids
(NEAA), 2mM L-glutamine, and 1% Penicillin-Streptomycin (Life technologies®). The gastric carcinoma
cell line N87 was acquired from American Type Tissue Culture (ATCC®), and was grown in RPMI media
supplemented with heat-inactivated 10% v/w fetal bovine serum (FBS, Gibco®) and 10µg/mL of
Gentamycin (Sigma®). N87 cells express high levels of HER2 receptors (HER2 3+) (Cui et al., 2014). Both
the cells were cultured in a humidified incubator maintained with 5% CO2 at 37oC.
Synthesis and Characterization of Trastuzumab-vc-MMAE: T-vc-MMAE ADC was synthesized by
conjugating trastuzumab (Herceptin®, Genentech) with vc-MMAE drug-linker using the random
conjugation method. This method results in a heterogeneous formulation of ADC with different
drug:antibody ratio (DAR). A detailed procedure for the preparation and characterization of this ADC is
reported in our earlier paper (Singh et al., 2016b). Briefly, trastuzumab was partially reduced to expose the
inter-chain disulphide bonds by adding ~2.5 molar equivalents of TCEP (tris(2-carboxymethyl) phosphine).
Around 8 molar equivalents of vc-MMAE (maleimidocaproyl-Val-Cit-MMAE) was added to the partially
reduced antibody to achieve an average DAR (DAR̅̅ ̅̅ ̅̅ ) of ~4.5. Excess drug-linker was separated from the
conjugated antibody using Sephadex G-25 column (GE®, Life Sciences). The purified T-vc-MMAE ADC
was analyzed for potential aggregates using Size exclusion chromatography (SEC). The abundance of
different DAR species in the ADC formulation was quantitatively determined using the Hydrophobic
Interaction chromatography (HIC). An average DAR value of the ADC was also confirmed by UV
spectroscopic analysis.
This article has not been copyedited and formatted. The final version may differ from this version.DMD Fast Forward. Published on August 18, 2017 as DOI: 10.1124/dmd.117.076414
at ASPE
T Journals on June 11, 2018
dmd.aspetjournals.org
Dow
nloaded from
DMD # 76414
7
Development of Analytical techniques: Disposition of T-vc-MMAE was investigated by
measuring three different analytes in the in vitro system. It is believed that both antibody (trastuzumab) and
small molecule (MMAE) related analytes are critical for the activity of ADC (Lin and Tibbitts, 2012).
Consequently, a sandwich ELISA method was developed to measure total intact trastuzumab levels, and
LC-MS/MS based method was developed to measure unconjugated and total (conjugated and
unconjugated) MMAE levels, in both media and cell lysate samples.
ELISA to quantify total trastuzumab: The sandwich ELISA protocol used to quantify total trastuzumab
levels consisted of the following steps: (1) coating of the 96 well plate with capture antibody, (2) blocking
of the plate, (3) addition of samples and standards to the plate, (4) addition of the detection antibody to the
plate, and (5) addition of substrate. Between each step, plates were washed three times with 1% PBS-Tween
wash buffer (0.05% Tween-20 in 1% PBS, no pH adjustment) followed by three washes with deionized
(DI) water. Nunc Maxisorp® flat-bottom 96 well plates (Cat# 62409-002,VWR®) were used, and coated
(overnight at 4°C) with anti-human IgG (Fc-specific, Sigma® Cat# I2136) at a concentration of 0.5
µg/100µL/well in 1% phosphate buffer saline (PBS). Plates were blocked with 300µL of blocking solution
(1% Bovine Serum Albumin (BSA, Pierce®) in 1% PBS-Tween wash buffer) at room temperature for 90
minutes. Experimental samples, quality control samples, and standards were incubated for 90 mins. 100 µL
of the 1.4 ng/µL of anti-human IgG (Fab specific, Sigma® CAT# A8542) was used as the secondary
antibody and incubated at room temperature for 90 minutes. 100µL P-nitro phenyl phosphate (pNPP)
solution (1 mg/mL in diethanolamine (DEA)) was used as the coloring agent, and change in absorbance
was measured over time (dA/dt) at 405 nm using Filter Max F-5 microplate analyzer (Molecular Devices®).
Standards and quality control (QC) samples were prepared by performing serial dilutions of trastuzumab
(1-1000 ng/mL) in PBS spiked with either 1% of media or 10% of cell lysate in RIPA solution. For every
ELISA plate, QC samples were selected to cover the lower, middle, and upper range of the standard curve.
Media samples were diluted 100-fold (in 1% PBS) to achieve the final media composition of 1% media in
a sample. Cell samples were pelleted and resuspended in RIPA (Pierce®) lysis buffer (with protease
This article has not been copyedited and formatted. The final version may differ from this version.DMD Fast Forward. Published on August 18, 2017 as DOI: 10.1124/dmd.117.076414
at ASPE
T Journals on June 11, 2018
dmd.aspetjournals.org
Dow
nloaded from
DMD # 76414
8
inhibitor cocktail) at a concentration of 2.5 million cells/100µL, followed by incubation for 2h at 4°C. Cell
lysate was collected by centrifuging the samples at a speed of 13,000 rpm for 15 mins (at 4°C) and
separating the supernatant from cell-debris. Cell lysate obtained from each sample was then diluted 10-fold
(in 1% PBS) to achieve a final composition of 10% cell lysate in a sample before measurement.
LC-MS/MS to quantify unconjugated MMAE: A Shimadzu 8040 LC-MS/MS system was used with
electrospray interphase and triple quadrupole mass spectrometer. For the detection of MMAE, a XBridge
BEH Amide column (Waters®) was used with a mobile phase A as water (with 5mM Ammonium formate
and 0.1% formic acid) and mobile phase B as 95:5 Acetonitrile: water (with 0.1% formic acid and 1 mM
ammonium formate), using a gradient at a flow rate of 0.25 ml/min at 40°C. The total duration of the
chromatographic run was 12 min, where two MRM scans (718.5/686.5 and 718.5/152.1 amu) were
monitored. Deuterated (d8) MMAE (Medchem express®) was used as an internal standard. To derive an
equation capable of quantifying unconjugated MMAE in a biological sample, the peak area for each drug
standard was divided by the peak area obtained for the internal standard. The resultant peak area ratios were
then plotted as a function of the standard concentrations, and data points were fitted to the curve using linear
regression (Microsoft Excel®). Three QC samples were included in the lower, middle, and upper range of
the standard curve to assess the predictive capability of the developed standard curve. The obtained standard
curves were then used to deduce the observed concentrations of MMAE in a biological sample.
Typically a 100 µL media sample (unknown, standard, or QC) was spiked with d8-MMAE (to a
concentration of 1 ng/mL) followed by evaporation in a nitrogen-vapor system and reconstitution in mobile
phase B (95:5 Acetonitrile: water with 0.1% formic acid). Cell sample was pelleted and reconstituted in
fresh media to a final concentration of 0.25 million cells/100µL. Samples were spiked with d8-MMAE (1
ng/mL) before performing cell lysis by adding 2-fold volume of ice-cold methanol followed by freeze-thaw
cycle of 45 minutes in -20°C. The final cell lysate was obtained by centrifuging the samples at 13,000 rpm
for 15 minutes at 4°C followed by collection of supernatant. For the preparation of standards and QC
samples, fresh cell suspension (0.25 million/100 µL) was spiked with known concentrations of MMAE and
This article has not been copyedited and formatted. The final version may differ from this version.DMD Fast Forward. Published on August 18, 2017 as DOI: 10.1124/dmd.117.076414
at ASPE
T Journals on June 11, 2018
dmd.aspetjournals.org
Dow
nloaded from
DMD # 76414
9
internal standard (d8-MMAE) before following the similar procedure of cell lysis mentioned above. The
resulting cell lysates were then evaporated and reconstituted in mobile phase B before injecting them in
LC/MS.
Forced deconjugation protocol to quantify total MMAE: Enzymatic cleavage of the vc linker
associated with MMAE was achieved by incubating each ADC sample with the cysteine protease papain
(Sigma-Aldrich®). This results in the appearance of total MMAE (antibody conjugated and unconjugated)
in an unconjugated form within media or cell lysate samples. Cell suspensions were sonicated to release
intracellular content (ADC and MMAE) prior to treatment with papain. A freshly prepared solution of
papain (in DI water) was added to each experimental sample to achieve a final concentration of 2 mg/mL,
followed by incubation for >15h at 40°C to assure complete cleavage of linker-associated MMAE (Li et
al., 2016). Finally, the samples were treated as described in the above section for quantification of total
MMAE by LC-MS/MS.
Cellular Disposition Studies:
Disposition of MMAE in N87 and GFP-MCF7 cells: Cellular disposition of plain MMAE was
investigated in N87 and GFP-MCF7 cells. For each cell line, ~3 million cells were plated in multiple T-25
cell culture flasks followed by overnight attachment in the incubator. The media in the flasks was replaced
with 3 mL of 50 ng/mL (69.6 nM) MMAE containing media the next day, and the flasks were divided into
two arms. Arm 1 was exposed to a continuous exposure of MMAE throughout the duration of study (24h),
where terminal sampling of flasks was performed at different time points to obtain media and cell samples.
Arm 2 was subjected to a brief 2 h exposure of MMAE, after which the drug containing media was replaced
with fresh media following 3 washing steps with PBS. Terminal sampling of flasks was performed at
different time points (e.g. 10 mins, 2h, 6h, 12h, and 24h) based on the availability of the cells, to obtain
media and cell samples. All the media and cell lysate samples collected in this experiment were processed
in accordance to the procedure detailed earlier for the measurement of MMAE via LC/MS.
This article has not been copyedited and formatted. The final version may differ from this version.DMD Fast Forward. Published on August 18, 2017 as DOI: 10.1124/dmd.117.076414
at ASPE
T Journals on June 11, 2018
dmd.aspetjournals.org
Dow
nloaded from
DMD # 76414
10
Disposition of different T-vc-MMAE analytes in N87 and GFP-MCF7 cells: Cellular disposition
of T-vc-MMAE ADC and its components was investigated in N87 and GFP-MCF7 cells. For each cell line,
~10 million cells were plated in multiple T-75 culture flasks. After overnight attachment the old media was
replaced with 10 mL of fresh media containing 75 nM of T-vc-MMAE, and the flasks were divided into
two different Arms (Arm 1&2). Based on our prior analysis on the cellular disposition of T-DM1 (Singh et
al., 2016a), we reckoned this concentration to be suitable for measuring different analytes of ADCs. Arm 1
was subjected to continuous exposure of T-vc-MMAE ADC, and terminal sampling was performed at
different time points up to 96h to collect media and cell samples. Arm 2 was subjected to a brief 2 h exposure
of T-vc-MMAE, after which the ADC containing media was replaced with the fresh media. Terminal
sampling of the flasks was performed at different time points (e.g. 2h, 12h, 24h, 48h, 72h, and 96h) based
on the availability of cells, to collect media and cell samples. Overall experiment was repeated twice, where
unconjugated MMAE was measured only in the first experiment. All the media and cell samples were
divided into three aliquots and processed as described above to measure unconjugated MMAE, total
MMAE, and total trastuzumab.
Effect of protease inhibitors on intracellular release of MMAE from T-vc-MMAE: The rate and
extent of MMAE release from T-vc-MMAE was investigated in the presence of a selective Cathepsin B
inhibitor (100 µM of CA-074, Sigma®) and a non-selective protease inhibitor, Bafilomycin A1 (10 µM,
Sigma®). GFP-MCF7 cells (~3 million cells) were plated in T-25 flasks and after overnight attachment the
flasks were divided into six arms. Arms 1 and 2 (control group) were treated with only 75 nM of T-vc-
MMAE, whereas Arms 3-6 (groups 2 and 3) were pretreated for 6h with protease inhibitors (Cathepsin B
inhibitor for Arms 3 and 4, Bafilomycin A1 for Arms 5 and 6) prior to the treatment with T-vc-MMAE.
Arms 1, 3 and 5 were subjected to continuous exposure, and Arms 2, 4 and 6 were subjected to a 2h brief
exposure of T-vc-MMAE. Terminal sampling was performed to collect media and cell samples until 96 h.
The samples were analyzed for the release of unconjugated MMAE using the analytical method detailed
earlier.
This article has not been copyedited and formatted. The final version may differ from this version.DMD Fast Forward. Published on August 18, 2017 as DOI: 10.1124/dmd.117.076414
at ASPE
T Journals on June 11, 2018
dmd.aspetjournals.org
Dow
nloaded from
DMD # 76414
11
Mathematical Modeling:
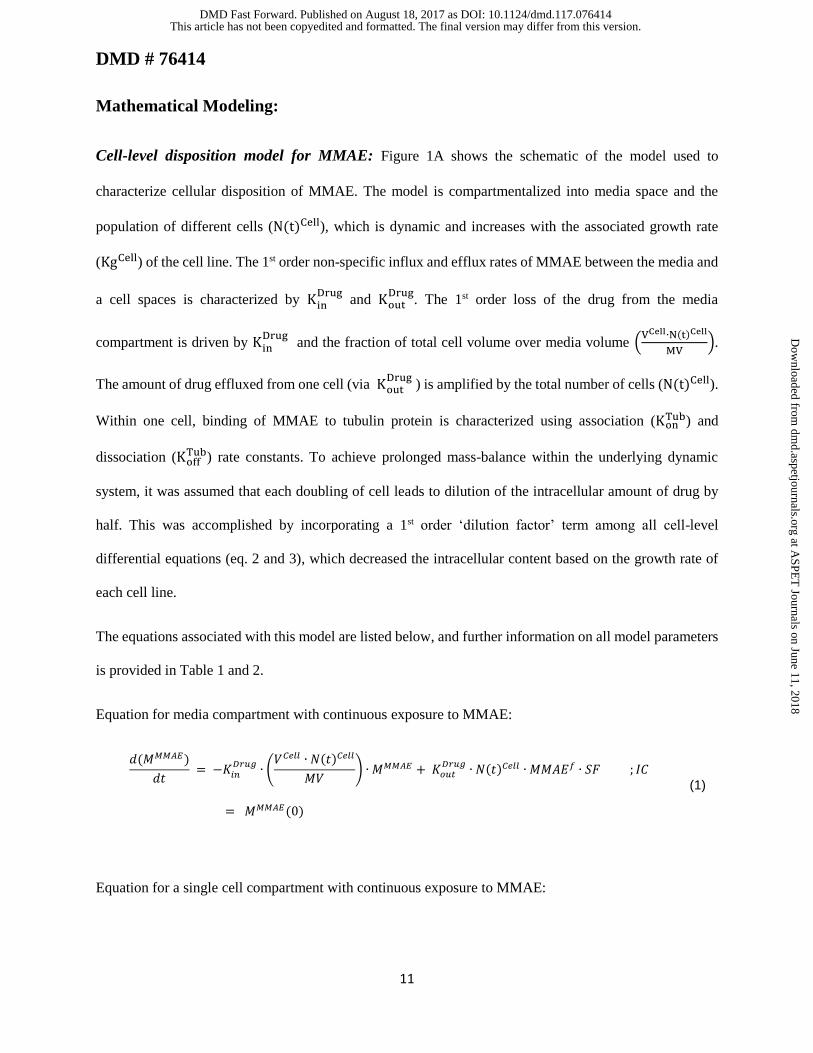
Cell-level disposition model for MMAE: Figure 1A shows the schematic of the model used to
characterize cellular disposition of MMAE. The model is compartmentalized into media space and the
population of different cells (N(t)Cell), which is dynamic and increases with the associated growth rate
(KgCell) of the cell line. The 1st order non-specific influx and efflux rates of MMAE between the media and
a cell spaces is characterized by KinDrug
and KoutDrug
. The 1st order loss of the drug from the media
compartment is driven by KinDrug
and the fraction of total cell volume over media volume (VCell∙N(t)Cell
MV).
The amount of drug effluxed from one cell (via KoutDrug
) is amplified by the total number of cells (N(t)Cell).
Within one cell, binding of MMAE to tubulin protein is characterized using association (KonTub) and
dissociation (KoffTub) rate constants. To achieve prolonged mass-balance within the underlying dynamic
system, it was assumed that each doubling of cell leads to dilution of the intracellular amount of drug by
half. This was accomplished by incorporating a 1st order ‘dilution factor’ term among all cell-level
differential equations (eq. 2 and 3), which decreased the intracellular content based on the growth rate of
each cell line.
The equations associated with this model are listed below, and further information on all model parameters
is provided in Table 1 and 2.
Equation for media compartment with continuous exposure to MMAE:
𝑑(𝑀𝑀𝑀𝐴𝐸)
𝑑𝑡 = −𝐾𝑖𝑛
𝐷𝑟𝑢𝑔∙ (
𝑉𝐶𝑒𝑙𝑙 ∙ 𝑁(𝑡)𝐶𝑒𝑙𝑙
𝑀𝑉) ∙ 𝑀𝑀𝑀𝐴𝐸 + 𝐾𝑜𝑢𝑡
𝐷𝑟𝑢𝑔∙ 𝑁(𝑡)𝐶𝑒𝑙𝑙 ∙ 𝑀𝑀𝐴𝐸𝑓 ∙ 𝑆𝐹 ; 𝐼𝐶
= 𝑀𝑀𝑀𝐴𝐸(0)
(1)
Equation for a single cell compartment with continuous exposure to MMAE:
This article has not been copyedited and formatted. The final version may differ from this version.DMD Fast Forward. Published on August 18, 2017 as DOI: 10.1124/dmd.117.076414
at ASPE
T Journals on June 11, 2018
dmd.aspetjournals.org
Dow
nloaded from
DMD # 76414
12
𝑑(𝑀𝑀𝐴𝐸𝑓)
𝑑𝑡 = 𝐾𝑖𝑛
𝐷𝑟𝑢𝑔∙ (
𝑉𝐶𝑒𝑙𝑙
𝑀𝑉) ∙
𝑀
𝑆𝐹
𝑀𝑀𝐴𝐸
− 𝐾𝑜𝑢𝑡𝐷𝑟𝑢𝑔
∙ 𝑀𝑀𝐴𝐸𝑓 − ((𝐾𝑜𝑛𝑇𝑢𝑏 ∙ 𝑆𝐹)/𝑉𝐶𝑒𝑙𝑙) ∙ 𝑀𝑀𝐴𝐸𝑓
∙ ((𝑇𝑢𝑏𝑢𝑙𝑖𝑛𝑡𝑜𝑡𝑎𝑙
𝑆𝐹∙ 𝑉𝐶𝑒𝑙𝑙) − 𝑀𝑀𝐴𝐸𝑓) + 𝐾𝑜𝑓𝑓
𝑇𝑢𝑏 ∙ 𝑀𝑀𝐴𝐸𝑏 − (𝐿𝑛 2
𝐷𝑇𝐶𝑒𝑙𝑙) ∙ 𝑀𝑀𝐴𝐸𝑓 ; 𝐼𝐶
= 0
(2)
𝑑(𝑀𝑀𝐴𝐸𝑏)
𝑑𝑡 = ((𝐾𝑜𝑛
𝑇𝑢𝑏 ∙ 𝑆𝐹)/ 𝑉𝐶𝑒𝑙𝑙) ∙ 𝑀𝑀𝐴𝐸𝑓 ∙ ((𝑇𝑢𝑏𝑢𝑙𝑖𝑛𝑡𝑜𝑡𝑎𝑙
𝑆𝐹∙ 𝑉𝐶𝑒𝑙𝑙) − 𝑀𝑀𝐴𝐸𝑓) − 𝐾𝑜𝑓𝑓
𝑇𝑢𝑏
∙ 𝑀𝑀𝐴𝐸𝑏 − (𝐿𝑛 2
𝐷𝑇𝐶𝑒𝑙𝑙) ∙ 𝑀𝑀𝐴𝐸𝑏 ; 𝐼𝐶 = 0
(3)
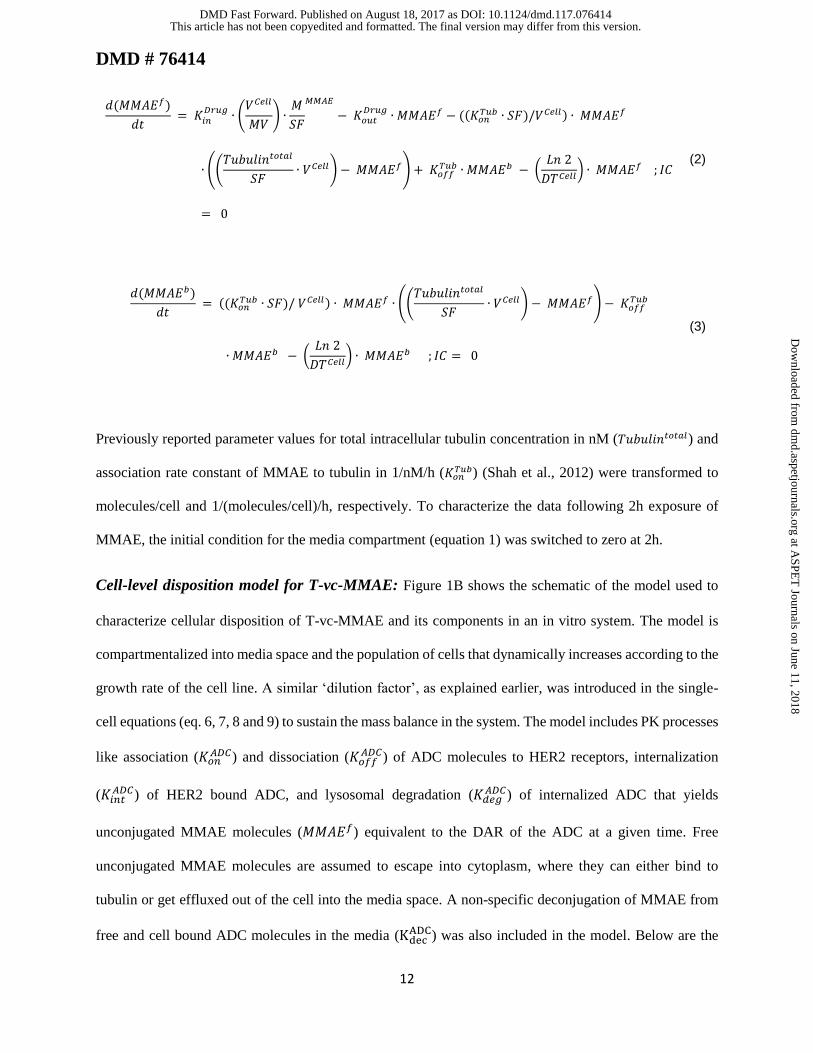
Previously reported parameter values for total intracellular tubulin concentration in nM (𝑇𝑢𝑏𝑢𝑙𝑖𝑛𝑡𝑜𝑡𝑎𝑙) and
association rate constant of MMAE to tubulin in 1/nM/h (𝐾𝑜𝑛𝑇𝑢𝑏) (Shah et al., 2012) were transformed to
molecules/cell and 1/(molecules/cell)/h, respectively. To characterize the data following 2h exposure of
MMAE, the initial condition for the media compartment (equation 1) was switched to zero at 2h.
Cell-level disposition model for T-vc-MMAE: Figure 1B shows the schematic of the model used to
characterize cellular disposition of T-vc-MMAE and its components in an in vitro system. The model is
compartmentalized into media space and the population of cells that dynamically increases according to the
growth rate of the cell line. A similar ‘dilution factor’, as explained earlier, was introduced in the single-
cell equations (eq. 6, 7, 8 and 9) to sustain the mass balance in the system. The model includes PK processes
like association (𝐾𝑜𝑛𝐴𝐷𝐶) and dissociation (𝐾𝑜𝑓𝑓
𝐴𝐷𝐶) of ADC molecules to HER2 receptors, internalization
(𝐾𝑖𝑛𝑡𝐴𝐷𝐶) of HER2 bound ADC, and lysosomal degradation (𝐾𝑑𝑒𝑔
𝐴𝐷𝐶) of internalized ADC that yields
unconjugated MMAE molecules (𝑀𝑀𝐴𝐸𝑓) equivalent to the DAR of the ADC at a given time. Free
unconjugated MMAE molecules are assumed to escape into cytoplasm, where they can either bind to
tubulin or get effluxed out of the cell into the media space. A non-specific deconjugation of MMAE from
free and cell bound ADC molecules in the media (KdecADC) was also included in the model. Below are the
This article has not been copyedited and formatted. The final version may differ from this version.DMD Fast Forward. Published on August 18, 2017 as DOI: 10.1124/dmd.117.076414
at ASPE
T Journals on June 11, 2018
dmd.aspetjournals.org
Dow
nloaded from
DMD # 76414
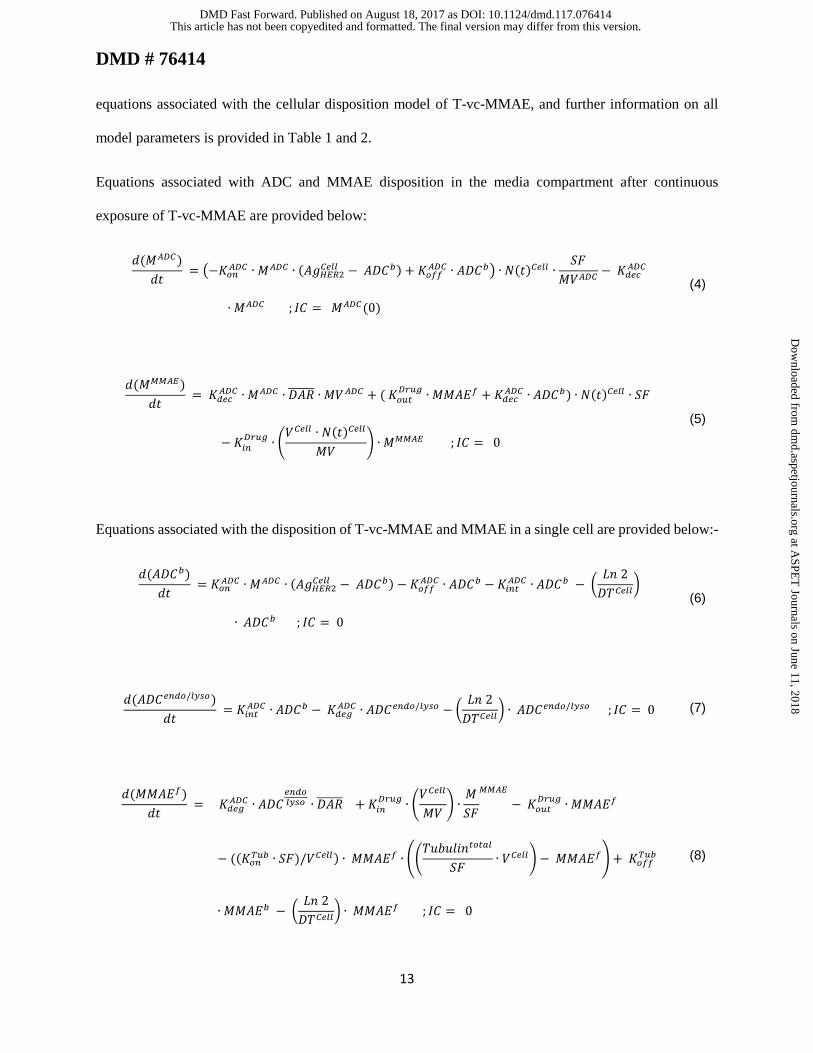
13
equations associated with the cellular disposition model of T-vc-MMAE, and further information on all
model parameters is provided in Table 1 and 2.
Equations associated with ADC and MMAE disposition in the media compartment after continuous
exposure of T-vc-MMAE are provided below:
𝑑(𝑀𝐴𝐷𝐶)
𝑑𝑡 = (−𝐾𝑜𝑛
𝐴𝐷𝐶 ∙ 𝑀𝐴𝐷𝐶 ∙ (𝐴𝑔𝐻𝐸𝑅2𝐶𝑒𝑙𝑙 − 𝐴𝐷𝐶𝑏) + 𝐾𝑜𝑓𝑓
𝐴𝐷𝐶 ∙ 𝐴𝐷𝐶𝑏) ∙ 𝑁(𝑡)𝐶𝑒𝑙𝑙 ∙𝑆𝐹
𝑀𝑉𝐴𝐷𝐶− 𝐾𝑑𝑒𝑐
𝐴𝐷𝐶
∙ 𝑀𝐴𝐷𝐶 ; 𝐼𝐶 = 𝑀𝐴𝐷𝐶(0)
(4)
𝑑(𝑀𝑀𝑀𝐴𝐸)
𝑑𝑡 = 𝐾𝑑𝑒𝑐
𝐴𝐷𝐶 ∙ 𝑀𝐴𝐷𝐶 ∙ 𝐷𝐴𝑅̅̅ ̅̅ ̅̅ ∙ 𝑀𝑉𝐴𝐷𝐶 + ( 𝐾𝑜𝑢𝑡𝐷𝑟𝑢𝑔
∙ 𝑀𝑀𝐴𝐸𝑓 + 𝐾𝑑𝑒𝑐𝐴𝐷𝐶 ∙ 𝐴𝐷𝐶𝑏) ∙ 𝑁(𝑡)𝐶𝑒𝑙𝑙 ∙ 𝑆𝐹
− 𝐾𝑖𝑛𝐷𝑟𝑢𝑔
∙ (𝑉𝐶𝑒𝑙𝑙 ∙ 𝑁(𝑡)𝐶𝑒𝑙𝑙
𝑀𝑉) ∙ 𝑀𝑀𝑀𝐴𝐸 ; 𝐼𝐶 = 0
(5)
Equations associated with the disposition of T-vc-MMAE and MMAE in a single cell are provided below:-
𝑑(𝐴𝐷𝐶𝑏)
𝑑𝑡 = 𝐾𝑜𝑛
𝐴𝐷𝐶 ∙ 𝑀𝐴𝐷𝐶 ∙ (𝐴𝑔𝐻𝐸𝑅2𝐶𝑒𝑙𝑙 − 𝐴𝐷𝐶𝑏) − 𝐾𝑜𝑓𝑓
𝐴𝐷𝐶 ∙ 𝐴𝐷𝐶𝑏 − 𝐾𝑖𝑛𝑡𝐴𝐷𝐶 ∙ 𝐴𝐷𝐶𝑏 − (
𝐿𝑛 2
𝐷𝑇𝐶𝑒𝑙𝑙)
∙ 𝐴𝐷𝐶𝑏 ; 𝐼𝐶 = 0
(6)
𝑑(𝐴𝐷𝐶𝑒𝑛𝑑𝑜/𝑙𝑦𝑠𝑜)
𝑑𝑡 = 𝐾𝑖𝑛𝑡
𝐴𝐷𝐶 ∙ 𝐴𝐷𝐶𝑏 − 𝐾𝑑𝑒𝑔𝐴𝐷𝐶 ∙ 𝐴𝐷𝐶𝑒𝑛𝑑𝑜/𝑙𝑦𝑠𝑜 − (
𝐿𝑛 2
𝐷𝑇𝐶𝑒𝑙𝑙) ∙ 𝐴𝐷𝐶𝑒𝑛𝑑𝑜/𝑙𝑦𝑠𝑜 ; 𝐼𝐶 = 0 (7)
𝑑(𝑀𝑀𝐴𝐸𝑓)
𝑑𝑡 = 𝐾𝑑𝑒𝑔
𝐴𝐷𝐶 ∙ 𝐴𝐷𝐶𝑒𝑛𝑑𝑜𝑙𝑦𝑠𝑜 ∙ 𝐷𝐴𝑅̅̅ ̅̅ ̅̅ + 𝐾𝑖𝑛
𝐷𝑟𝑢𝑔∙ (
𝑉𝐶𝑒𝑙𝑙
𝑀𝑉) ∙
𝑀
𝑆𝐹
𝑀𝑀𝐴𝐸
− 𝐾𝑜𝑢𝑡𝐷𝑟𝑢𝑔
∙ 𝑀𝑀𝐴𝐸𝑓
− ((𝐾𝑜𝑛𝑇𝑢𝑏 ∙ 𝑆𝐹)/𝑉𝐶𝑒𝑙𝑙) ∙ 𝑀𝑀𝐴𝐸𝑓 ∙ ((
𝑇𝑢𝑏𝑢𝑙𝑖𝑛𝑡𝑜𝑡𝑎𝑙
𝑆𝐹∙ 𝑉𝐶𝑒𝑙𝑙) − 𝑀𝑀𝐴𝐸𝑓) + 𝐾𝑜𝑓𝑓
𝑇𝑢𝑏
∙ 𝑀𝑀𝐴𝐸𝑏 − (𝐿𝑛 2
𝐷𝑇𝐶𝑒𝑙𝑙) ∙ 𝑀𝑀𝐴𝐸𝑓 ; 𝐼𝐶 = 0
(8)
This article has not been copyedited and formatted. The final version may differ from this version.DMD Fast Forward. Published on August 18, 2017 as DOI: 10.1124/dmd.117.076414
at ASPE
T Journals on June 11, 2018
dmd.aspetjournals.org
Dow
nloaded from
DMD # 76414
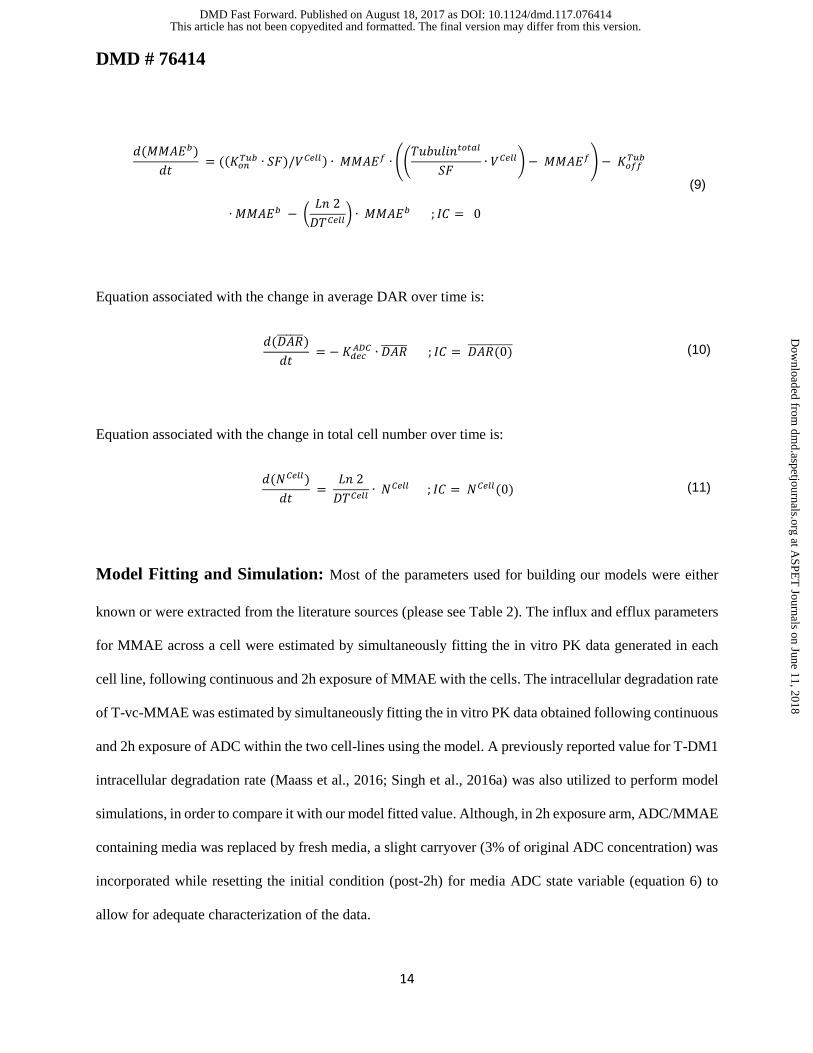
14
𝑑(𝑀𝑀𝐴𝐸𝑏)
𝑑𝑡 = ((𝐾𝑜𝑛
𝑇𝑢𝑏 ∙ 𝑆𝐹)/𝑉𝐶𝑒𝑙𝑙) ∙ 𝑀𝑀𝐴𝐸𝑓 ∙ ((𝑇𝑢𝑏𝑢𝑙𝑖𝑛𝑡𝑜𝑡𝑎𝑙
𝑆𝐹∙ 𝑉𝐶𝑒𝑙𝑙) − 𝑀𝑀𝐴𝐸𝑓) − 𝐾𝑜𝑓𝑓
𝑇𝑢𝑏
∙ 𝑀𝑀𝐴𝐸𝑏 − (𝐿𝑛 2
𝐷𝑇𝐶𝑒𝑙𝑙) ∙ 𝑀𝑀𝐴𝐸𝑏 ; 𝐼𝐶 = 0
(9)
Equation associated with the change in average DAR over time is:
𝑑(𝐷𝐴𝑅̅̅ ̅̅ ̅̅ )
𝑑𝑡 = − 𝐾𝑑𝑒𝑐
𝐴𝐷𝐶 ∙ 𝐷𝐴𝑅̅̅ ̅̅ ̅̅ ; 𝐼𝐶 = 𝐷𝐴𝑅(0)̅̅ ̅̅ ̅̅ ̅̅ ̅̅ (10)
Equation associated with the change in total cell number over time is:
𝑑(𝑁𝐶𝑒𝑙𝑙)
𝑑𝑡 =
𝐿𝑛 2
𝐷𝑇𝐶𝑒𝑙𝑙∙ 𝑁𝐶𝑒𝑙𝑙 ; 𝐼𝐶 = 𝑁𝐶𝑒𝑙𝑙(0) (11)
Model Fitting and Simulation: Most of the parameters used for building our models were either
known or were extracted from the literature sources (please see Table 2). The influx and efflux parameters
for MMAE across a cell were estimated by simultaneously fitting the in vitro PK data generated in each
cell line, following continuous and 2h exposure of MMAE with the cells. The intracellular degradation rate
of T-vc-MMAE was estimated by simultaneously fitting the in vitro PK data obtained following continuous
and 2h exposure of ADC within the two cell-lines using the model. A previously reported value for T-DM1
intracellular degradation rate (Maass et al., 2016; Singh et al., 2016a) was also utilized to perform model
simulations, in order to compare it with our model fitted value. Although, in 2h exposure arm, ADC/MMAE
containing media was replaced by fresh media, a slight carryover (3% of original ADC concentration) was
incorporated while resetting the initial condition (post-2h) for media ADC state variable (equation 6) to
allow for adequate characterization of the data.
This article has not been copyedited and formatted. The final version may differ from this version.DMD Fast Forward. Published on August 18, 2017 as DOI: 10.1124/dmd.117.076414
at ASPE
T Journals on June 11, 2018
dmd.aspetjournals.org
Dow
nloaded from
DMD # 76414
15
Model was initially built and simulated in Berkeley Madonna (University of California at Berkeley, CA)
whereas data fitting was performed using maximum likelihood (ML) estimation method of ADAPT-5
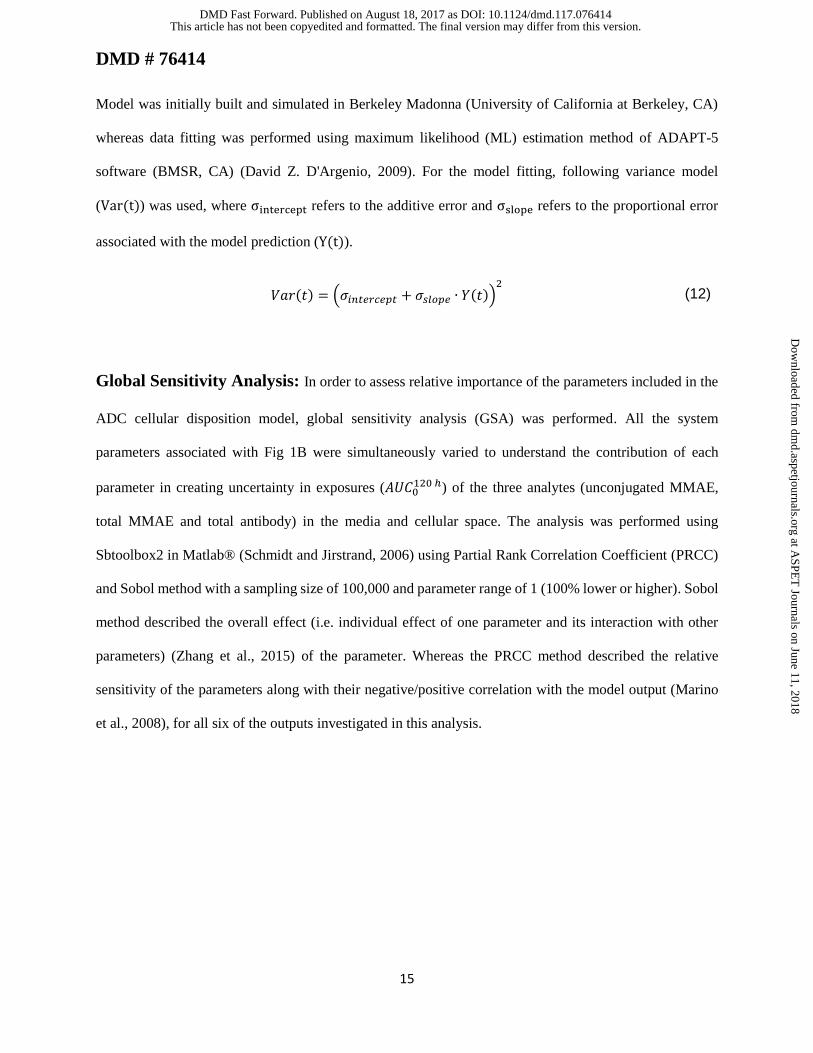
software (BMSR, CA) (David Z. D'Argenio, 2009). For the model fitting, following variance model
(Var(t)) was used, where σintercept refers to the additive error and σslope refers to the proportional error
associated with the model prediction (Y(t)).
𝑉𝑎𝑟(𝑡) = (𝜎𝑖𝑛𝑡𝑒𝑟𝑐𝑒𝑝𝑡 + 𝜎𝑠𝑙𝑜𝑝𝑒 ∙ 𝑌(𝑡))2 (12)
Global Sensitivity Analysis: In order to assess relative importance of the parameters included in the
ADC cellular disposition model, global sensitivity analysis (GSA) was performed. All the system
parameters associated with Fig 1B were simultaneously varied to understand the contribution of each
parameter in creating uncertainty in exposures (𝐴𝑈𝐶0120 ℎ) of the three analytes (unconjugated MMAE,
total MMAE and total antibody) in the media and cellular space. The analysis was performed using
Sbtoolbox2 in Matlab® (Schmidt and Jirstrand, 2006) using Partial Rank Correlation Coefficient (PRCC)
and Sobol method with a sampling size of 100,000 and parameter range of 1 (100% lower or higher). Sobol
method described the overall effect (i.e. individual effect of one parameter and its interaction with other
parameters) (Zhang et al., 2015) of the parameter. Whereas the PRCC method described the relative
sensitivity of the parameters along with their negative/positive correlation with the model output (Marino
et al., 2008), for all six of the outputs investigated in this analysis.
This article has not been copyedited and formatted. The final version may differ from this version.DMD Fast Forward. Published on August 18, 2017 as DOI: 10.1124/dmd.117.076414
at ASPE
T Journals on June 11, 2018
dmd.aspetjournals.org
Dow
nloaded from
DMD # 76414
16
Results
Synthesis and Characterization of Trastuzumab-vc-MMAE:
Based on the UV absorbance ratio method and characterization of HIC chromatographic profiles (Singh et
al., 2016b), the average DAR̅̅ ̅̅ ̅̅ value for the ADC was determined to be ~4.5. SEC analysis indicated absence
of any aggregates in the synthesized ADC formulation.
Development of Analytical techniques:
Supplementary Figure S1 and S2 depicts representative standard curves for ELISA and LC-MS/MS
methods in the media and cell lysate samples, along with their assay performance tables (Supplementary
Tables 1 and 2). Similar standard curves were generated for every assay run. The lower limit of
quantification (LOQ) was determined to be 0.1 ng/mL for total antibody ELISA and 10 pg/mL for MMAE
LC-MS/MS method. All the back-calculated QC samples were predicted with less than 20% CV.
Cellular Disposition Studies:
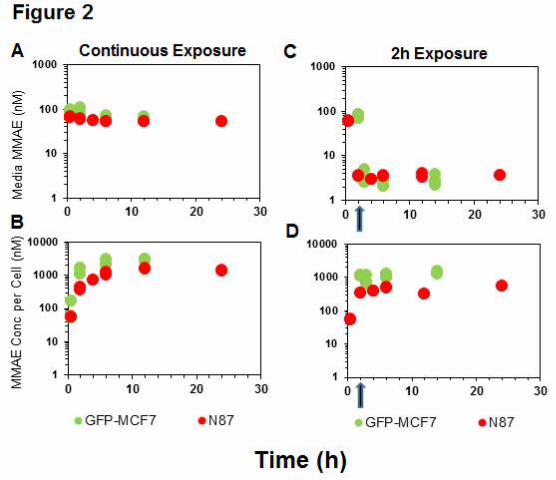
Disposition of MMAE in N87 and GFP-MCF7 cells: Figure 2 shows the disposition of MMAE in
media (panel A and C) and the cellular space (panel B and D) following continuous or 2h exposure of the
cells with the drug. In case of continuous exposure, a steady decline in media MMAE concentrations (Figure
2A) and a rapid accumulation of MMAE in the cells (Figure 2B) was observed for both the cell lines. The
peak concentrations of MMAE observed following continuous drug exposure in both the cells were 15-20
fold higher than the media concentrations. The exposure of MMAE in both the cells lines was fairly similar.
The AUC(0-12h) (area under the concentration curve up to 12h) values calculated using trapezoidal method
were ~2 fold and ~3.4 fold higher for MCF7 cells compared to N87 cells, following continuous (24567.2
vs. 11485.8 nM*h) and 2h exposure (13888.5 vs. 4087.3 nM*h), respectively (Figures 2B). Even after
replacing the MMAE containing media with fresh media just after 2h exposure, MMAE concentrations
This article has not been copyedited and formatted. The final version may differ from this version.DMD Fast Forward. Published on August 18, 2017 as DOI: 10.1124/dmd.117.076414
at ASPE
T Journals on June 11, 2018
dmd.aspetjournals.org
Dow
nloaded from
DMD # 76414
17
inside both the cells were sustained throughout the duration of the experiment (Figure 2D), albeit at lower
concentrations compared to continuous exposure (Figure 2B vs. 2D). This observation suggests that, once
inside the cell, MMAE possesses remarkable ability to sustain high intracellular concentrations, which may
be attributed to strong intracellular binding of the drug. Nonetheless, notable MMAE concentrations were
observed in the fresh media added following 2h washout (Figure 2C), suggesting MMAE is capable of
effluxing out of the cells gradually over the period of time.
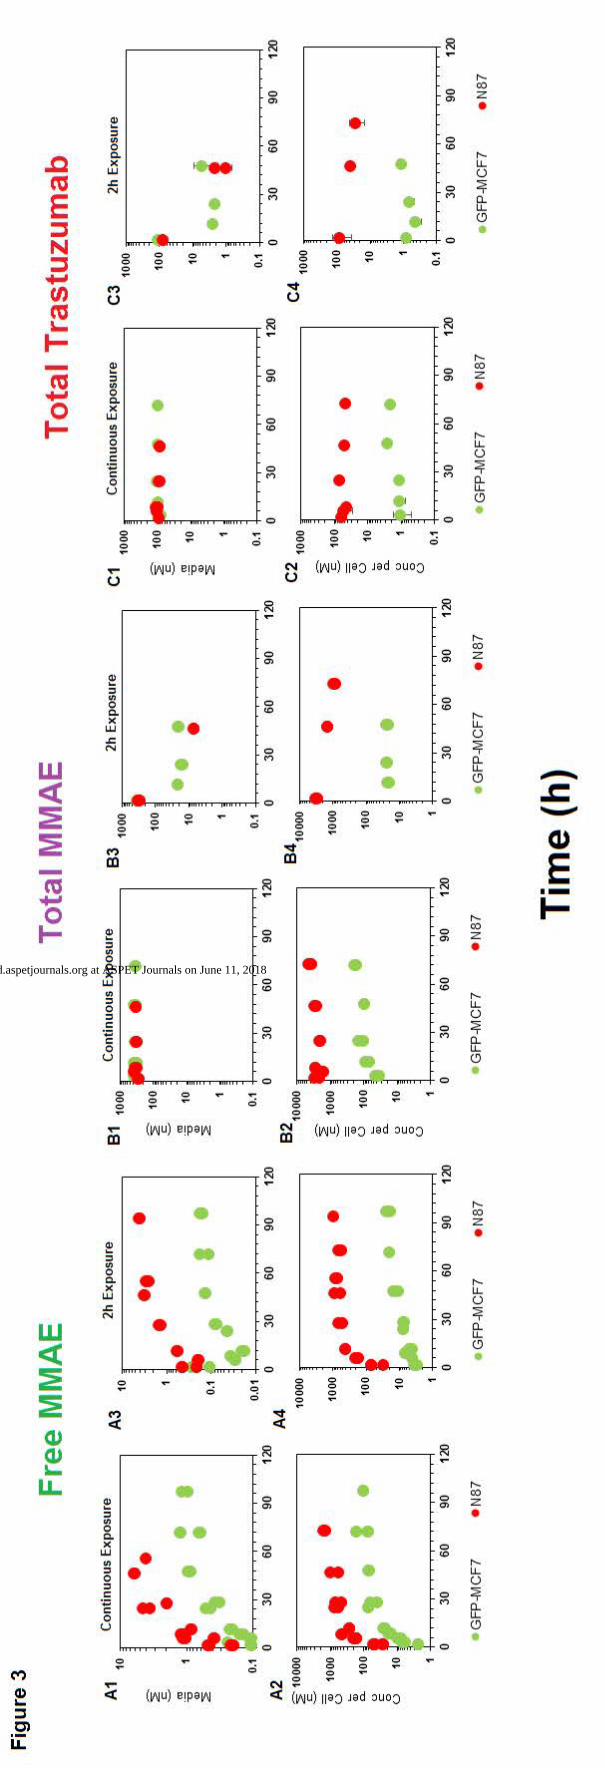
Disposition of different analytes of T-vc-MMAE in N87 and GFP-MCF7 cells: Figure 3 depicts
the disposition of different analytes of T-vc-MMAE in media and cellular spaces of N87 and GFP-MCF7
cells. Figure 3A focuses on unconjugated MMAE. It was observed that following ADC incubation there
was a rapid generation of unconjugated MMAE within the cellular space (Figure 3A2 and 3A4), and there
was also relatively slower generation of MMAE in the media (Figure 3A1 and 3A3), leading to a plateau.
Upon continuous exposure, ~100-fold higher exposure of MMAE was observed in the cellular space
compared to media for both the cell lines, which validated the ability of the ADC to deliver the cytotoxic
drug specifically within the cell (Figure 3A1 and 3A2). There was a clear difference in the extent of
unconjugated MMAE exposure between high-HER2-expressing N87 cells and low-HER2-expressing GFP-
MCF7 cells after incubation with T-vc-MMAE ADC (Figure 3A). This observed difference in intracellular
MMAE exposure based on the level of HER2 expression validates the relationship between antigen
expression and the extent of drug delivery inside a cell via ADC. When the ADC was exposed for a
continuous period of time there was a 7-fold higher AUC of MMAE in N87 cells as compared to GFP-
MCF7 cells (Figure 3A2). However, when the ADC was exposed only for 2h the differences in the AUC
among the two cell lines increased to ~50-fold (Figure 3A4). This difference in the ratio of intracellular
MMAE exposure between high and low HER2 expressing cells following different duration of ADC
incubation may occur due to the predominant role of limited intracellular tubulin binding sites in retaining
MMAE inside the cells. It is hypothesize that following 2h or continuous exposure of ADC with MCF7
cells, the amount of MMAE generated inside the cells is not enough to saturate intracellular tubulin.
This article has not been copyedited and formatted. The final version may differ from this version.DMD Fast Forward. Published on August 18, 2017 as DOI: 10.1124/dmd.117.076414
at ASPE
T Journals on June 11, 2018
dmd.aspetjournals.org
Dow
nloaded from
DMD # 76414
18
However, following 2h and continuous exposure of ADC with N87 cells, the amount of MMAE generated
inside the cells is less-than-saturating and saturating, respectively. Thus, the ratio of N87 to MCF7
intracellular MMAE exposure is maintained to a high level following 2h exposure, but this ratio is
diminished following continuous exposure, due to the saturation of intracellular tubulin binding sites in
N87 cells continuously exposed to ADC.
Figure 3B focuses on in vitro PK of total MMAE (unconjugated + conjugated). The exposures of total
MMAE in the media (Figure 3B1 and 3B3) was primarily driven by intact ADC, and the exposures of total
MMAE inside the cell was primarily driven by unconjugated MMAE (Figure 3B2 and 3B4). A similar
exposures of total MMAE was observed in the media for both cell lines despite a 10 fold difference in the
unconjugated MMAE exposures, mainly because unconjugated MMAE contributed minimally to total
MMAE concentrations in the media as most of the drug was still conjugated to antibody. Inside a cell
however, the pattern of differential exposure for total MMAE between high HER2 and low HER2 cell lines
was similar to what has been observed for unconjugated MMAE after continuous or 2h exposure. For both
the cell lines it was observed that total MMAE concentrations were higher than unconjugated MMAE
concentrations in the beginning, which over the period of time became very similar. This suggests rapid
internalization of ADC in the intracellular space followed by gradual degradation of the ADC to release
unconjugated MMAE.
In vitro PK profiles for total trastuzumab are provided in Figure 3C. This data provides an idea about the
exposures of intact antibody after T-vc-MMAE treatment. In the media, the concentrations of total antibody
were similar to total MMAE concentrations (for both continuous and 2h exposure), which further bolstered
our hypothesis that majority of the MMAE in media is conjugated to trastuzumab. Within the cellular space,
levels of intact trastuzumab were ~100 fold higher in N87 cells compared to GFP-MCF7 cells after both
continuous and 2h exposure. Intracellular degradation rate of antibody was more conspicuous in N87 cells
following 2h exposure of the ADC. We were also able to use the concentrations of all three analytes to infer
the average drug: antibody ratio (DAR̅̅ ̅̅ ̅̅ ) for the ADC using the following expression:
This article has not been copyedited and formatted. The final version may differ from this version.DMD Fast Forward. Published on August 18, 2017 as DOI: 10.1124/dmd.117.076414
at ASPE
T Journals on June 11, 2018
dmd.aspetjournals.org
Dow
nloaded from
DMD # 76414
19
[𝑇𝑜𝑡𝑎𝑙 𝑀𝑀𝐴𝐸−𝐹𝑟𝑒𝑒 𝑀𝑀𝐴𝐸
𝑇𝑜𝑡𝑎𝑙 𝑇𝑟𝑎𝑠𝑡𝑢𝑧𝑢𝑚𝑎𝑏]. Using the measured concentrations in the media it was found that DAR̅̅ ̅̅ ̅̅ value for
the ADC was ~4.2, which was very similar to the value determined using HIC analysis. This data also
suggests that the ADC was fairly stable in the media and there was minimal non-specific deconjugation of
MMAE in the media.
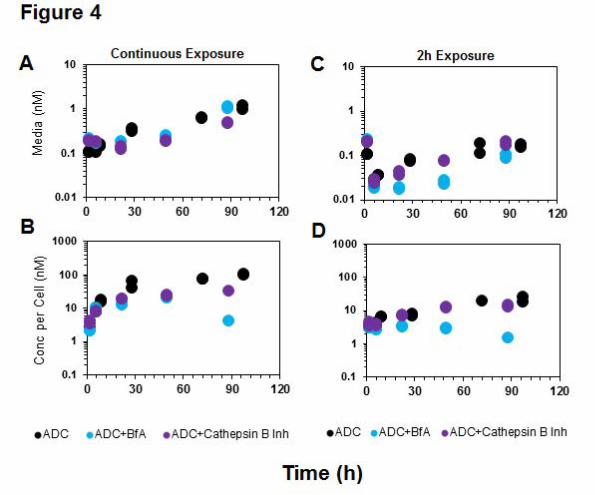
Effect of protease inhibitors on intracellular release of MMAE from T-vc-MMAE: Figure 4 shows
the unconjugated MMAE PK in the media and cellular space of GFP-MCF7 cells in the presence or absence
of the two different protease inhibitors. The exposure of MMAE in the control group, after continuous or
2h incubation with ADC, was very similar to the one reported for GFP-MCF7 cells earlier. Pretreatment
with a selective Cathepsin B inhibitor (100µM) was able to minimally suppress the degradation of ADC
within the cell, as evident by superimposing PK profiles with the control group. The non-specific protease
inhibitor, Bafilomycin A1, was able to significantly inhibit the intracellular degradation of ADC following
both continuous and 2h exposure. Although, no studies were performed to confirm complete inhibition of
the protease enzymes, the inhibitory concentrations chosen for both protease inhibitors (i.e. 100 µM for
CA-074 (Montaser et al., 2002) and 10 µM for Bafilomycin A1 (Rock et al., 2015)) were above the
literature-reported concentrations leading to maximum inhibition. The effects of Bafilomycin A1 were more
pronounced in case of 2h exposure as compared to the continuous exposure. Our results suggested that the
pretreatment with a protease inhibitor (for 6h) will compromise the degradation efficiency of intracellular
proteases, leading to lower unconjugated MMAE formation in the cellular space and lower MMAE
appearance (via efflux) in the media space. The results also suggested that there may be other intracellular
proteases apart from Cathepsin B that are involved in intracellular cleavage of the vc linker and the release
of unconjugated drug.
Mathematical Modeling:
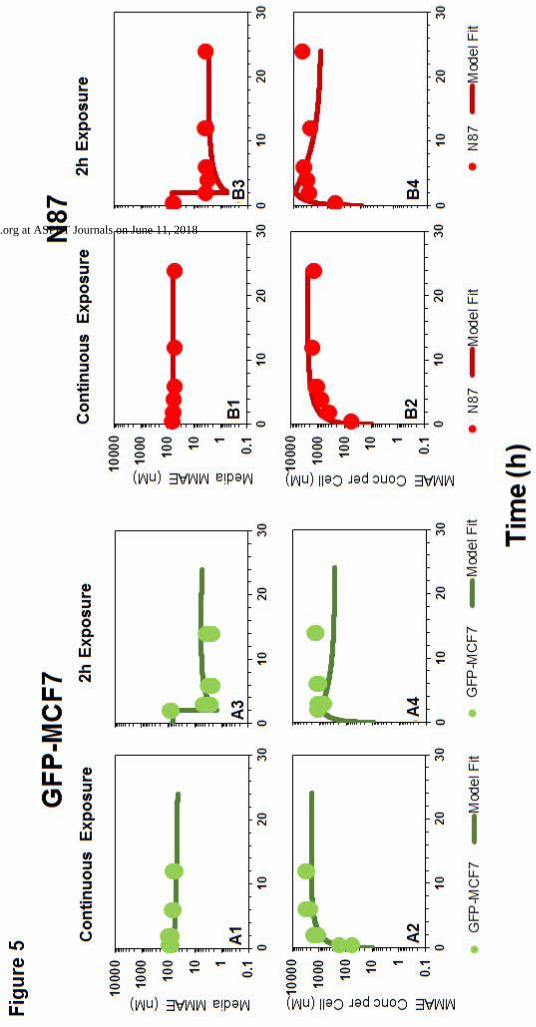
Cell-level disposition model for MMAE: Figure 5 shows the fitting of MMAE disposition data in GFP-
MCF7 and N87 cells using the model shown in Figure 1A. The model was able to capture the overall trend
This article has not been copyedited and formatted. The final version may differ from this version.DMD Fast Forward. Published on August 18, 2017 as DOI: 10.1124/dmd.117.076414
at ASPE
T Journals on June 11, 2018
dmd.aspetjournals.org
Dow
nloaded from
DMD # 76414
20
in the data reasonably well, which is characterize by a steady decrease in the media exposure and rapid
accumulation of MMAE inside the cell over the duration of study. Due to the attainment of very similar
exposure levels of MMAE in the media and cellular spaces of both the cell lines, data from each cell line
was pooled together to estimate common influx (𝐾𝑖𝑛𝑀𝑀𝐴𝐸) and efflux (𝐾𝑜𝑢𝑡
𝑀𝑀𝐴𝐸) rates of MMAE. All the
datasets were reasonably captured by the model, except the slight underestimation of later cellular
concentrations in the 2h washout group. Having the availability of both continuous and 2h exposure datasets
allowed for a simultaneous fitting of the data using the model, and provided the estimates of MMAE influx
and efflux rates with good precision (as shown in the Table 2). The modeling results suggested that the
average efflux half-life of MMAE from each cell line was ~3.5 h.
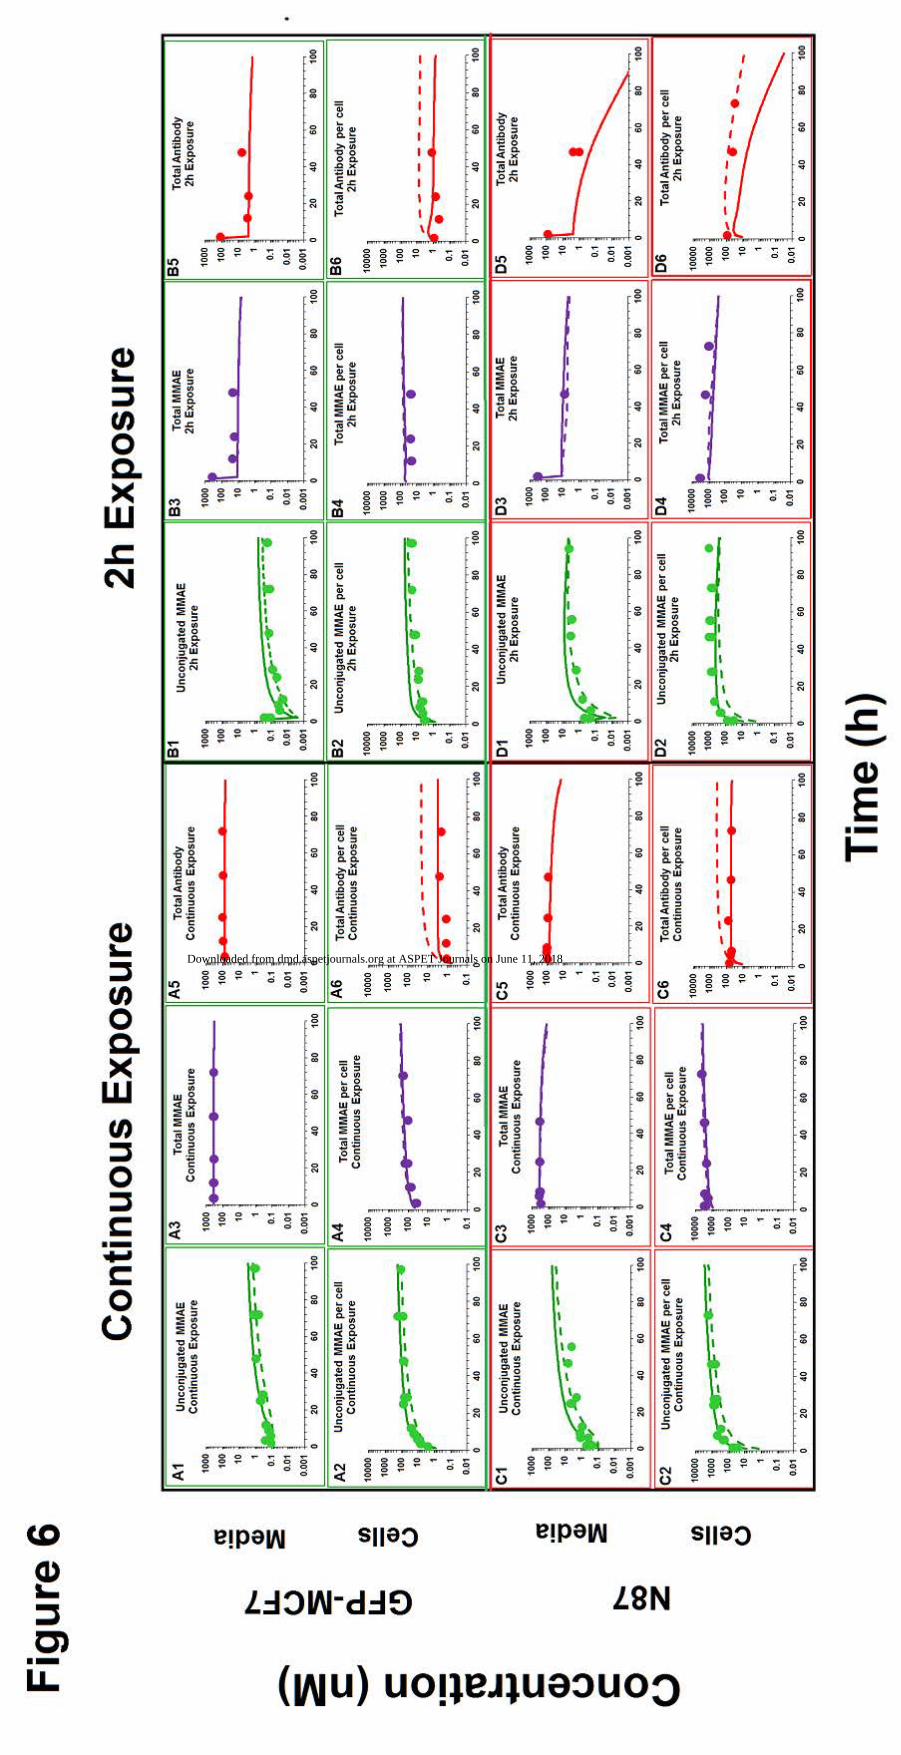
Cell-level disposition model for T-vc-MMAE: Figure 6 shows the fitting of T-vc-MMAE disposition
data, generated after continuous and 2h exposure of the ADC in GFP-MCF7 and N87 cells, using the
structural model shown in Figure 1B. As shown in Table 2, in order to fit the data most of the parameters
in the model were fixed to previously known values, and the influx and efflux parameters for MMAE were
fixed to the values estimated in the previous modeling step. All 24 PK profiles (i.e. the PK of all three
analytes in media and cell for GFP-MCF7 and N87 cells) were fitted simultaneously using the model to
obtain robust estimates of intracellular T-vc-MMAE degradation rates. To characterize the data more
accurately an inefficient washing of T-vc-MMAE after 2h exposure was included within the model, by
incorporating a slight carryover of 3% post-washing. This led to much better prediction of data (shown in
Figure 6) in comparison to predictions where complete washing was assumed (shown in Supplementary
Figure S3). Just by estimating a single parameter the model was able to effectively capture the disposition
profiles of all three analytes of ADC in the media and cellular space. The average degradation half-life for
T-vc-MMAE in the cell was estimated to be 1.96 h, which was significantly shorter than the previously
reported half-life of 23h (Maass et al., 2016). Model fitting also suggested that the non-specific
deconjugation rate of ADC in the media was very low, as when estimated the value was were very close to
zero. Of note, the model predicted antibody concentrations in the cell were ADC/antibody concentrations
This article has not been copyedited and formatted. The final version may differ from this version.DMD Fast Forward. Published on August 18, 2017 as DOI: 10.1124/dmd.117.076414
at ASPE
T Journals on June 11, 2018
dmd.aspetjournals.org
Dow
nloaded from
DMD # 76414
21
in the lysosomal compartment, and did not include any antibody molecules bound on cell surface. Because,
during sample processing all the cell-debris after lysis was pelleted out and only intracellular contents in
the supernatant were isolated to measure total trastuzumab concentrations. In addition, when cell surface
bound antibody levels were included in our final simulation outputs, it significantly over-predicted the
observed data. Thus, our results suggest that the amount of antibody bound to cell surface after washing
steps was insignificant, and the antibody levels measured using our method were mostly related to
intracellular content. Model outputs generated using our fitted faster degradation parameters (Figure 6, solid
lines) were compared with model outputs generated using literature reported degradation parameters
(Maass et al., 2016) (Figure 6, dashed lines). It was found that a faster antibody degradation rate was
superior in overall capturing total trastuzumab profiles within the cell in comparison to slower degradation
rate. However, both parameter values performed quite similarly in explaining the rest of the cell PK data
for different analytes.
Global Sensitivity Analysis:
The results from GSA of the cell-level ADC PK model are provided in Figure 7, and individual sensitivity
indices have been reported in Supplementary Table 3. The sensitivity of each system parameter was
analyzed by assessing its effect on the overall exposures (𝐴𝑈𝐶0120ℎ) of all six analytes (i.e. unconjugated
MMAE, total MMAE and total antibody in the media and cellular space). Figure 7A shows the results from
Sobol method that provides overall sensitivity of each parameter, whereas Figure 7B shows the results from
PRCC method that provides sensitivity as well as positive/negative correlation of each parameter with
respect to the model output. Results from GSA suggested that ADC internalization rate, ADC degradation
rate, level of HER2 expression, and MMAE efflux rates were the most sensitive parameters. Association
rate constant of ADC to HER2 receptors and influx rate of MMAE inside the cell were also sensitive
parameters. It was noticed that the volume of a single cell, media volume, and doubling time of the cells
were also very sensitive parameters. ADC internalization rate, level of HER2 expression, and association
rate of ADC to HER2, all three parameters had positive correlation with the exposure of all six analytes.
This article has not been copyedited and formatted. The final version may differ from this version.DMD Fast Forward. Published on August 18, 2017 as DOI: 10.1124/dmd.117.076414
at ASPE
T Journals on June 11, 2018
dmd.aspetjournals.org
Dow
nloaded from
DMD # 76414
22
Media volume and cell doubling time had negative correlation with media concentrations and positive
correlation with intracellular concentrations. Volume of a single cell had negative correlation with
intracellular concentrations as well as unconjugated MMAE concentrations in the media. While total
intracellular tubulin concentrations were found to be sensitive in sustaining cellular levels of total MMAE,
in general parameters associated with intracellular binding of drug to tubulin were found to be relatively
less sensitive.
This article has not been copyedited and formatted. The final version may differ from this version.DMD Fast Forward. Published on August 18, 2017 as DOI: 10.1124/dmd.117.076414
at ASPE
T Journals on June 11, 2018
dmd.aspetjournals.org
Dow
nloaded from
DMD # 76414
23
Discussion
In order to better understand whole body disposition and pharmacological effects of ADCs it is important
to understand cell-level PK of ADCs. However, despite having more than 60 ADC molecules in the clinic,
we are lacking a comprehensive understanding of a quantitative relationship between the extent of target
expression and intracellular exposure of ADC and its components. In addition to target expression, there
are additional determinants like ADC internalization rate, ADC degradation rate, extent of drug binding to
intracellular target, and the efflux rate of unconjugated drug, which can also play an important role in
deciding intracellular exposure of ADC and its components. Hence it becomes imperative to understand
which of these determinants are most important drivers for cellular PK of ADCs, to not only comprehend
cellular disposition of ADCs but also to support the discovery and development of better ADCs. In addition,
we are lacking a quantitative framework that can allow us to assess the relative importance of all these
determinants in silico. Therefore, a robust mathematical model that can characterize the cellular disposition
of ADC and its components will be of great importance to the field of ADC development and Model Based
Drug Development (MBDD) (Singh et al., 2015). When combined with in vitro cytotoxicity data, the
cellular PK models of ADC can also help in estimating the minimum intracellular drug exposure required
to induce the killing of tumor cells. When integrated with in vivo PK-Pharmacodynamic (PK-PD) models
(Shah et al., 2012; Shah et al., 2014; Singh et al., 2016a) this information can help in better clinical
translation and optimization of ADC dosing regimens (Singh and Shah, 2017). Accordingly, here we have
proposed a novel single cell-level disposition model for ADCs, and validated the model using in vitro
disposition data generated from our tool ADC T-vc-MMAE in low and high HER2 expressing cell lines.
There are very few studies pertaining to intracellular disposition of ADCs in the literature. One of the
earliest work is described for SGN-35 (Okeley et al., 2010), where upon incubation of conjugates prepared
using 14C-labeled-MMAE, authors demonstrated higher exposures of MMAE in CD30+ cell lines (L540cy
and Karpas299) as compared to CD30- (WSU-NHL) cells. Similar disposition studies were performed for
This article has not been copyedited and formatted. The final version may differ from this version.DMD Fast Forward. Published on August 18, 2017 as DOI: 10.1124/dmd.117.076414
at ASPE
T Journals on June 11, 2018
dmd.aspetjournals.org
Dow
nloaded from
DMD # 76414
24
T-DM1 (Erickson et al., 2012), where a tritium (3H) labelled DM1 catabolites were followed over time in
the intracellular and extracellular space for BT474EEI, MCF7, and SKBR3 cells. Although informative,
these studies do not differentiate the disposition of different ADC related analytes, and do not provide in
depth information on the determinants responsible for cellular disposition of ADCs. More recently, another
cellular disposition study has been presented for fluorescently labelled trastuzumab-maytansinoid conjugate
(Maass et al., 2016), and the disposition data has been characterized using a mathematical model. However,
in this study the authors have followed the fluorescent label and have not used quantitative methods to
measure absolute concentrations different ADC analytes. In the present work, we have employed a more
rigorous approach of developing robust analytical methods for three different ADC related analytes in
media and cellular matrix. In vitro PK of three different analytes (i.e. total trastuzumab, total MMAE, and
unconjugated MMAE) in the media and cells was generated following incubation of T-vc-MMAE with
high HER2 (N87) and low HER2 (GFP-MCF7) expressing cells, to generate a comprehensive PK dataset
that can allow the development of a detailed cell-level PK model for ADCs.
We have first investigated the disposition of pure MMAE in GFP-MCF7 and N87 cells, to understand the
inherent PK characteristics of this molecule in vitro. We observed very similar accumulation of MMAE in
both the cell lines. Because the experiments conducted with only 2h exposure of MMAE (Figure 2) showed
significant retention of MMAE within the cells for up to 24h, we deduced the possibility of strong
intracellular binding of MMAE (possibly to tubulin) that allowed the retention of the molecule within the
cell. Our previously reported tubulin concentration estimate (Shah et al., 2012), obtained from L540cy
bearing tumors, was able to characterize the prolonged retention of MMAE within the tumor cell. The in
vitro PK of MMAE in both the cell lines following continuous and 2h exposure of MMAE was
mathematically characterized using the model shown in Figure 1A to allow the estimation of average influx
and efflux rate constants for MMAE (Table 2).
Following characterization of the cellular PK of plain MMAE, cellular disposition of T-vc-MMAE was
investigated in N87 and GFP-MCF7 cells. This is probably the first time when in vitro PK of an ADC and
This article has not been copyedited and formatted. The final version may differ from this version.DMD Fast Forward. Published on August 18, 2017 as DOI: 10.1124/dmd.117.076414
at ASPE
T Journals on June 11, 2018
dmd.aspetjournals.org
Dow
nloaded from
DMD # 76414
25
its components has been measured in media and cells using different analytical techniques to accomplish
mass balance in the system. The in vitro PK data showed that there was a clear relationship between antigen
expression and intracellular ADC exposure, as there was ~100-fold higher intracellular exposure of
unconjugated MMAE in N87 (HER2 3+) cells compared to GFP-MCF7 (HER2 0/1+) cells. The PK of total
antibody, unconjugated drug, and total drug in media and cell was well characterized using the single-cell
disposition model for ADC (Figure 1B) simultaneously. As majority of the system parameters were fixed
based on prior knowledge, the model was also able to provide a robust estimate of intracellular degradation
rate of ADC (KdecADC) (Table 2). The degradation rate estimated for T-vc-MMAE in our studies was much
faster than the one reported for trastuzumab-maytansinoid conjugate (2h versus 23 h) (Maass et al., 2016).
When model simulations generated using the degradation values reported by Maass et al. (Figure 6, dashed
lines) were compared with our model fitted profiles (Figure 6, solid lines), it was found that the faster
degradation rate was relatively better in characterizing the overall cellular PK data for different analytes.
These effects were much more pronounced in total trastuzumab profiles within the cell (Figure 6A6, 6B6,
6C6 and 6D6). However, since the slower degradation rate obtained by (Maass et al., 2016) was determined
following brief exposure (30 mins) of BT-474, N87, and SK-BR-3 cells with T-DM1, the values obtained
by them may not be entirely comparable to our values obtained using T-vc-MMAE. In addition, here we
have also shown that the non-selective protease inhibitor was more effective in reducing the production of
intracellular unconjugated MMAE compared to a selective Cathepsin B inhibitor. This suggests that
contrary to the common belief (Sutherland et al., 2006; Gikanga et al., 2016), there may be other enzymes
in addition to Cathepsin B that are responsible for the degradation of vc-MMAE based ADCs.
While interpreting the data generated in our study and the fitting of the data using the proposed model, it is
also important to bear in mind that here we have presented a deterministic approach to characterize the data,
but in reality each parameter is associated with some variability and a stochastic approach may be more
comprehensive. Nonetheless, the final model was able to provide great insight into the interplay between
different parameters using GSA (Figure 7). It was interesting to learn that apart from the system parameters
This article has not been copyedited and formatted. The final version may differ from this version.DMD Fast Forward. Published on August 18, 2017 as DOI: 10.1124/dmd.117.076414
at ASPE
T Journals on June 11, 2018
dmd.aspetjournals.org
Dow
nloaded from
DMD # 76414
26
the experimental parameters (e.g. media volume, cell volume, doubling time) also pay a crucial role in
determining in vitro PK of ADC, suggesting the need for more caution when comparing the data generated
in different laboratories using different experimental conditions. The GSA also revealed that antigen
expression, ADC internalization rate, and drug efflux rate were the key parameters sustaining the overall
exposures of different analytes in the intracellular and extracellular space. The PRCC analysis was helpful
in assessing positive or negative correlations between different parameters and model outputs, most of
which were intuitive.
In summary, here we have developed and validated analytical methods to measure unconjugated MMAE
(using LC-MS/MS), total MMAE (using forced deconjugation procedure), and total trastuzumab (using
ELISA) concentrations in the media and cell lysates. We have experimentally characterized the disposition
of both MMAE and T-vc-MMAE in high-HER2 expressing N87 and low-HER2 expressing GFP-MCF7
cells. We have also used selective and non-selective protease inhibitors to further understand the role of
Cathepsin B in intracellular degradation of T-vc-MMAE. A novel cell-level disposition model for ADCs
has been developed to simultaneously characterize media and intracellular concentration of different ADC
related analytes in a dynamically changing population of tumor cells. The model was able to account for
differences in HER2 receptor expression between the two cell lines along with other cell-specific
biomeasures, and was able to characterize the disposition of all three analytes of T-vc-MMAE in the media
and cells reasonably well. The unique feature of this cellular ADC PK model is that it can be expanded to
account for multiple cell populations in a system, mimicking heterogeneous tumor microenvironments.
This in silico heterogeneity in cell population can then be used to better understand and characterize the
bystander effects of ADCs, similar to the one presented by us for T-vc-MMAE in a co-culture system of
GFP-MCF7 and N87 cells (Singh et al., 2016b). We hope to incorporate such in vitro PK-PD models of
ADCs into the in vivo model for ADC (Shah et al., 2012) to characterize in vivo bystander effect of ADCs
in the future.
This article has not been copyedited and formatted. The final version may differ from this version.DMD Fast Forward. Published on August 18, 2017 as DOI: 10.1124/dmd.117.076414
at ASPE
T Journals on June 11, 2018
dmd.aspetjournals.org
Dow
nloaded from
DMD # 76414
27
Acknowledgements
Authors would also like to thank Donna Ruszaj for her help with LC-MS/MS method development, Dr.
Sharad Sharma for his help with forced deconjugation protocol development, Shabkhaiz Masih for her help
with ELISA method development, and Hsueh-Yuan (Luke) Chang for his help with validation of the single-
cell PK model.
Authorship Contributions
Participated in research design: Aman P. Singh, Dhaval K. Shah
Conducted experiments: Aman P. Singh
Contributed in developing analytical techniques: Aman P. Singh
Performed data analysis: Aman P. Singh, Dhaval K. Shah
Wrote or contributed to the writing of the manuscript: Aman P. Singh, Dhaval K. Shah
This article has not been copyedited and formatted. The final version may differ from this version.DMD Fast Forward. Published on August 18, 2017 as DOI: 10.1124/dmd.117.076414
at ASPE
T Journals on June 11, 2018
dmd.aspetjournals.org
Dow
nloaded from
DMD # 76414
28
References
Chari RV, Miller ML, and Widdison WC (2014) Antibody-drug conjugates: an emerging concept in cancer
therapy. Angewandte Chemie 53:3796-3827.
Cui H, Cheng Y, Piao SZ, Xu YJ, Sun HH, Cui X, Li XZ, Zhang SN, Piao LZ, Jin YM, Lin ZH, and Shen
XH (2014) Correlation between HER-2/neu(erbB-2) expression level and therapeutic effect of
combination treatment with HERCEPTIN and chemotherapeutic agents in gastric cancer cell lines.
Cancer cell international 14:10.
David Z. D'Argenio AS, Xiaoning Wang (2009) ADAPT 5 User’s Guide:
Pharmacokinetic/Pharmacodynamic Systems Analysis Software, Biomedical Simulations
Resource, Los Angeles.
Erickson HK, Lewis Phillips GD, Leipold DD, Provenzano CA, Mai E, Johnson HA, Gunter B, Audette
CA, Gupta M, Pinkas J, and Tibbitts J (2012) The effect of different linkers on target cell catabolism
and pharmacokinetics/pharmacodynamics of trastuzumab maytansinoid conjugates. Molecular
cancer therapeutics 11:1133-1142.
Gikanga B, Adeniji NS, Patapoff TW, Chih HW, and Yi L (2016) Cathepsin B Cleavage of vcMMAE-
Based Antibody-Drug Conjugate Is Not Drug Location or Monoclonal Antibody Carrier Specific.
Bioconjugate chemistry 27:1040-1049.
Li Y, Gu C, Gruenhagen J, Yehl P, Chetwyn NP, and Medley CD (2016) An enzymatic deconjugation
method for the analysis of small molecule active drugs on antibody-drug conjugates. mAbs 8:698-
705.
Lin K and Tibbitts J (2012) Pharmacokinetic considerations for antibody drug conjugates. Pharmaceutical
research 29:2354-2366.
Maass KF, Kulkarni C, Betts AM, and Wittrup KD (2016) Determination of Cellular Processing Rates for
a Trastuzumab-Maytansinoid Antibody-Drug Conjugate (ADC) Highlights Key Parameters for
ADC Design. The AAPS journal 18:635-646.
Marino S, Hogue IB, Ray CJ, and Kirschner DE (2008) A methodology for performing global uncertainty
and sensitivity analysis in systems biology. Journal of theoretical biology 254:178-196.
Montaser M, Lalmanach G, and Mach L (2002) CA-074, but not its methyl ester CA-074Me, is a selective
inhibitor of cathepsin B within living cells. Biological chemistry 383:1305-1308.
Okeley NM, Miyamoto JB, Zhang X, Sanderson RJ, Benjamin DR, Sievers EL, Senter PD, and Alley SC
(2010) Intracellular activation of SGN-35, a potent anti-CD30 antibody-drug conjugate. Clinical
cancer research : an official journal of the American Association for Cancer Research 16:888-
897.
Rock BM, Tometsko ME, Patel SK, Hamblett KJ, Fanslow WC, and Rock DA (2015) Intracellular
Catabolism of an Antibody Drug Conjugate with a Noncleavable Linker. Drug metabolism and
disposition: the biological fate of chemicals 43:1341-1344.
Schmidt H and Jirstrand M (2006) Systems Biology Toolbox for MATLAB: a computational platform for
research in systems biology. Bioinformatics 22:514-515.
Shah DK, Barletta F, Betts A, and Hansel S (2013) Key bioanalytical measurements for antibody-drug
conjugate development: PK/PD modelers' perspective. Bioanalysis 5:989-992.
Shah DK, Haddish-Berhane N, and Betts A (2012) Bench to bedside translation of antibody drug conjugates
using a multiscale mechanistic PK/PD model: a case study with brentuximab-vedotin. Journal of
pharmacokinetics and pharmacodynamics 39:643-659.
Shah DK, King LE, Han X, Wentland JA, Zhang Y, Lucas J, Haddish-Berhane N, Betts A, and Leal M
(2014) A Priori Prediction of Tumor Payload Concentrations: Preclinical Case Study with an
Auristatin-Based Anti-5T4 Antibody-Drug Conjugate. The AAPS journal 16:452-463.
This article has not been copyedited and formatted. The final version may differ from this version.DMD Fast Forward. Published on August 18, 2017 as DOI: 10.1124/dmd.117.076414
at ASPE
T Journals on June 11, 2018
dmd.aspetjournals.org
Dow
nloaded from
DMD # 76414
29
Singh AP, Maass KF, Betts AM, Wittrup KD, Kulkarni C, King LE, Khot A, and Shah DK (2016a)
Evolution of Antibody-Drug Conjugate Tumor Disposition Model to Predict Preclinical Tumor
Pharmacokinetics of Trastuzumab-Emtansine (T-DM1). The AAPS journal 18:861-875.
Singh AP and Shah DK (2017) Application of a PK-PD Modeling and Simulation-Based Strategy for
Clinical Translation of Antibody-Drug Conjugates: a Case Study with Trastuzumab Emtansine (T-
DM1). The AAPS journal 19:1054-1070.
Singh AP, Sharma S, and Shah DK (2016b) Quantitative characterization of in vitro bystander effect of
antibody-drug conjugates. Journal of pharmacokinetics and pharmacodynamics.
Singh AP, Shin YG, and Shah DK (2015) Application of Pharmacokinetic-Pharmacodynamic Modeling
and Simulation for Antibody-Drug Conjugate Development. Pharmaceutical research 32:3508-
3525.
Sohayla R IQ, Robert S (2014) The Clinical Landscape of Antibody-drug Conjugates. doi:
10.14229/jadc.2014.8.1.001.
Subik K, Lee JF, Baxter L, Strzepek T, Costello D, Crowley P, Xing L, Hung MC, Bonfiglio T, Hicks DG,
and Tang P (2010) The Expression Patterns of ER, PR, HER2, CK5/6, EGFR, Ki-67 and AR by
Immunohistochemical Analysis in Breast Cancer Cell Lines. Breast cancer : basic and clinical
research 4:35-41.
Sutherland MS, Sanderson RJ, Gordon KA, Andreyka J, Cerveny CG, Yu C, Lewis TS, Meyer DL,
Zabinski RF, Doronina SO, Senter PD, Law CL, and Wahl AF (2006) Lysosomal trafficking and
cysteine protease metabolism confer target-specific cytotoxicity by peptide-linked anti-CD30-
auristatin conjugates. The Journal of biological chemistry 281:10540-10547.
Zhang XY, Trame MN, Lesko LJ, and Schmidt S (2015) Sobol Sensitivity Analysis: A Tool to Guide the
Development and Evaluation of Systems Pharmacology Models. CPT: pharmacometrics & systems
pharmacology 4:69-79.
This article has not been copyedited and formatted. The final version may differ from this version.DMD Fast Forward. Published on August 18, 2017 as DOI: 10.1124/dmd.117.076414
at ASPE
T Journals on June 11, 2018
dmd.aspetjournals.org
Dow
nloaded from
DMD # 76414
30
Footnotes
This work was supported by National Institute of Health [Grant GM114179] and the Centre for Protein
Therapeutics at University at Buffalo.
This article has not been copyedited and formatted. The final version may differ from this version.DMD Fast Forward. Published on August 18, 2017 as DOI: 10.1124/dmd.117.076414
at ASPE
T Journals on June 11, 2018
dmd.aspetjournals.org
Dow
nloaded from
DMD # 76414
31
Figure Legends
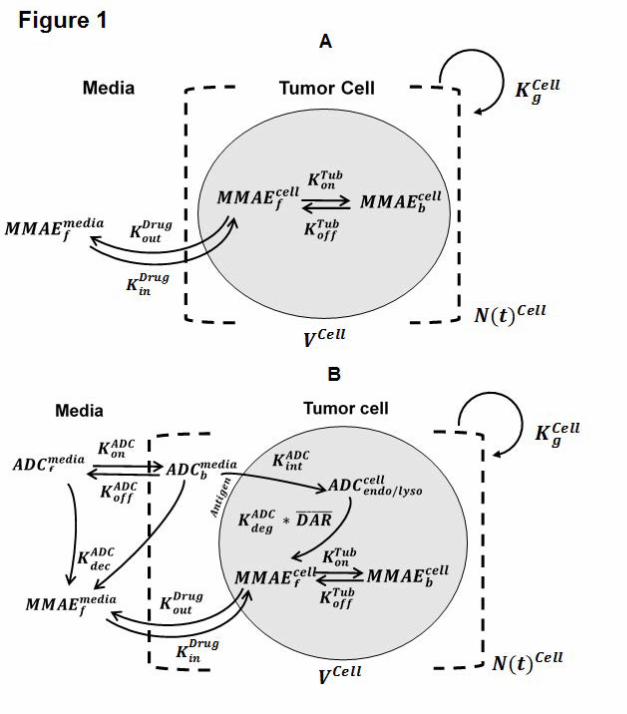
Figure 1. Schematics of single cell PK models developed for MMAE and T-vc-MMAE ADC. (A) A
cellular disposition model for MMAE consisting of media space and a proliferating population of cells. (B)
A cellular disposition model for T-vc-MMAE, consisting of media space and a proliferating population of
cells. The model includes key disposition processes like receptor mediated binding and internalization of
ADC, intracellular degradation of ADC and release of unconjugated drug, binding of unconjugated drug to
intracellular target and the efflux of unbound drug molecules to media space. Please refer to Table-2 for
detailed description of different symbols used in the figure.
Figure 2. In vitro PK of MMAE in the media and cellular space for GFP-MCF7 cells (green) and N87 cells
(red). (A) Disposition of MMAE in the media after continuous exposure of MMAE. (B) Disposition of
MMAE in the cellular space after continuous exposure of MMAE. (C) Disposition of MMAE in the media
after 2h exposure of MMAE. (D) Disposition of MMAE in the cellular space after 2h exposure of MMAE.
The arrow represents the washing step for the 2h exposure experiment.
Figure 3. In vitro PK of (A) unconjugated MMAE, (B) total MMAE, and (C) total trastuzumab, in the
media (upper panels) and cellular space (lower panels) of GFP-MCF7 (green) and N87 (in red) cells, after
continuous and 2h exposures of the cells with 75 nM of T-vc-MMAE.
Figure 4. Formation of unconjugated MMAE in the media (panels (A) and (C)) and cellular space (panels
(B) and (D)) of GFP-MCF7 cells after incubation with 75 nM T-vc-MMAE. Black symbols represent
control group, purple symbols represent the cells that were pretreated with specific Cathepsin B inhibitor,
and blue symbols represent the cells that were pretreated with Bafilomycin A1.
Figure 5. Observed (symbols) and model predicted (lines) profiles of MMAE in the media (upper panels)
and cellular space (lower panels) of GFP-MCF7 (green) and N87 (red) cells, following continuous or 2h
exposure of MMAE.
This article has not been copyedited and formatted. The final version may differ from this version.DMD Fast Forward. Published on August 18, 2017 as DOI: 10.1124/dmd.117.076414
at ASPE
T Journals on June 11, 2018
dmd.aspetjournals.org
Dow
nloaded from
DMD # 76414
32
Figure 6. Media and intracellular PK profiles of different ADC analytes after continuous exposure (panels
A and C) and 2h exposure (panels B and D) of 75 nM T-vc-MMAE in GFP-MCF7 cells (panels A and B)
and N87 cells (panels C and D). Solid circles represent observed data, solid lines represent model fitted
profiles, and dashed lines represent model simulated profiles generated using a slower kdeg value obtained
from (Maass et al., 2016).
Figure 7. The results from Global Sensitivity Analysis. (A) Sobol total effect analysis, and (B) Partial Rank
Correlation Coefficient (PRCC) method, to assess the changes in AUCs of unconjugated MMAE
(u_MMAE), total MMAE (T_MMAE) and total trastuzumab (TTmAb) in the media and cellular space.
This article has not been copyedited and formatted. The final version may differ from this version.DMD Fast Forward. Published on August 18, 2017 as DOI: 10.1124/dmd.117.076414
at ASPE
T Journals on June 11, 2018
dmd.aspetjournals.org
Dow
nloaded from
DMD # 76414
33
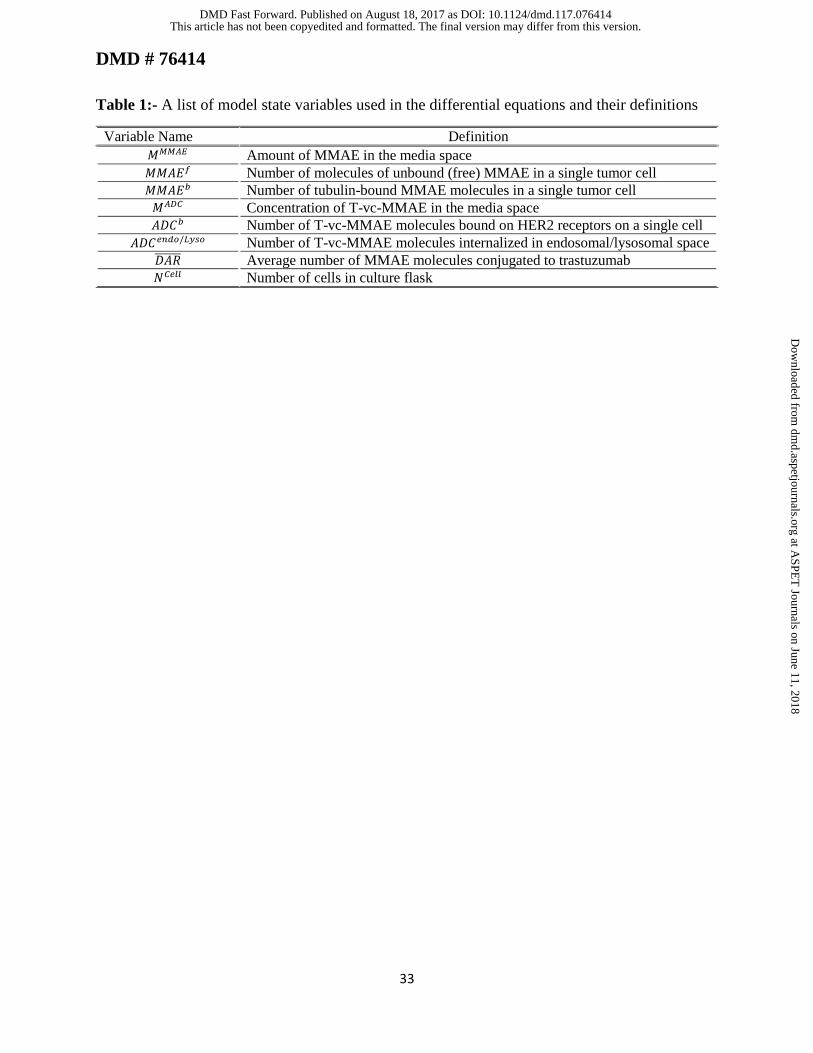
Table 1:- A list of model state variables used in the differential equations and their definitions
Variable Name Definition
𝑀𝑀𝑀𝐴𝐸 Amount of MMAE in the media space
𝑀𝑀𝐴𝐸𝑓 Number of molecules of unbound (free) MMAE in a single tumor cell
𝑀𝑀𝐴𝐸𝑏 Number of tubulin-bound MMAE molecules in a single tumor cell
𝑀𝐴𝐷𝐶 Concentration of T-vc-MMAE in the media space
𝐴𝐷𝐶𝑏 Number of T-vc-MMAE molecules bound on HER2 receptors on a single cell
𝐴𝐷𝐶𝑒𝑛𝑑𝑜/𝐿𝑦𝑠𝑜 Number of T-vc-MMAE molecules internalized in endosomal/lysosomal space
𝐷𝐴𝑅̅̅ ̅̅ ̅̅ Average number of MMAE molecules conjugated to trastuzumab
𝑁𝐶𝑒𝑙𝑙 Number of cells in culture flask
This article has not been copyedited and formatted. The final version may differ from this version.DMD Fast Forward. Published on August 18, 2017 as DOI: 10.1124/dmd.117.076414
at ASPE
T Journals on June 11, 2018
dmd.aspetjournals.org
Dow
nloaded from
DMD # 76414
34
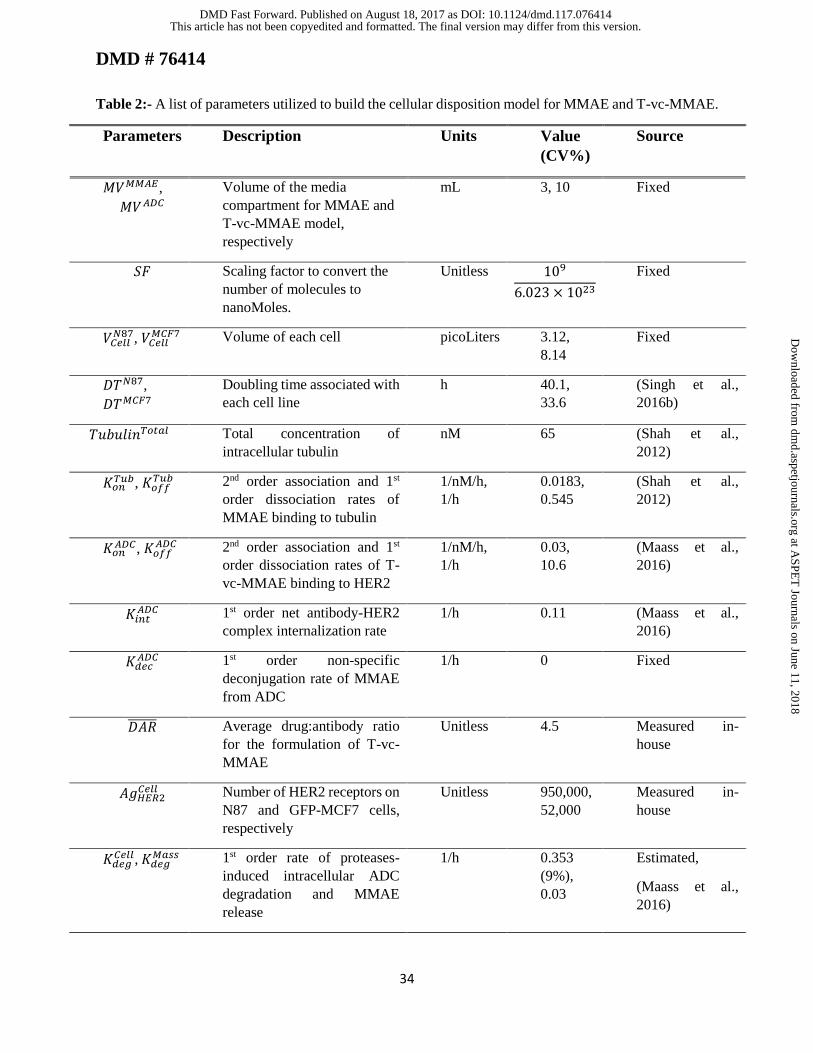
Table 2:- A list of parameters utilized to build the cellular disposition model for MMAE and T-vc-MMAE.
Parameters Description Units Value
(CV%)
Source
𝑀𝑉𝑀𝑀𝐴𝐸,
𝑀𝑉𝐴𝐷𝐶
Volume of the media
compartment for MMAE and
T-vc-MMAE model,
respectively
mL 3, 10 Fixed
𝑆𝐹 Scaling factor to convert the
number of molecules to
nanoMoles.
Unitless 109
6.023 × 10²³
Fixed
𝑉𝐶𝑒𝑙𝑙𝑁87, 𝑉𝐶𝑒𝑙𝑙
𝑀𝐶𝐹7 Volume of each cell picoLiters 3.12,
8.14
Fixed
𝐷𝑇𝑁87,
𝐷𝑇𝑀𝐶𝐹7
Doubling time associated with
each cell line
h 40.1,
33.6
(Singh et al.,
2016b)
𝑇𝑢𝑏𝑢𝑙𝑖𝑛𝑇𝑜𝑡𝑎𝑙 Total concentration of
intracellular tubulin
nM 65 (Shah et al.,
2012)
𝐾𝑜𝑛𝑇𝑢𝑏, 𝐾𝑜𝑓𝑓
𝑇𝑢𝑏 2nd order association and 1st
order dissociation rates of
MMAE binding to tubulin
1/nM/h,
1/h
0.0183,
0.545
(Shah et al.,
2012)
𝐾𝑜𝑛𝐴𝐷𝐶, 𝐾𝑜𝑓𝑓
𝐴𝐷𝐶
2nd order association and 1st
order dissociation rates of T-
vc-MMAE binding to HER2
1/nM/h,
1/h
0.03,
10.6
(Maass et al.,
2016)
𝐾𝑖𝑛𝑡𝐴𝐷𝐶 1st order net antibody-HER2
complex internalization rate
1/h 0.11 (Maass et al.,
2016)
𝐾𝑑𝑒𝑐𝐴𝐷𝐶 1st order non-specific
deconjugation rate of MMAE
from ADC
1/h 0 Fixed
𝐷𝐴𝑅̅̅ ̅̅ ̅̅ Average drug:antibody ratio
for the formulation of T-vc-
MMAE
Unitless 4.5 Measured in-
house
𝐴𝑔𝐻𝐸𝑅2𝐶𝑒𝑙𝑙 Number of HER2 receptors on
N87 and GFP-MCF7 cells,
respectively
Unitless 950,000,
52,000
Measured in-
house
𝐾𝑑𝑒𝑔𝐶𝑒𝑙𝑙, 𝐾𝑑𝑒𝑔
𝑀𝑎𝑠𝑠 1st order rate of proteases-
induced intracellular ADC
degradation and MMAE
release
1/h 0.353
(9%),
0.03
Estimated,
(Maass et al.,
2016)
This article has not been copyedited and formatted. The final version may differ from this version.DMD Fast Forward. Published on August 18, 2017 as DOI: 10.1124/dmd.117.076414
at ASPE
T Journals on June 11, 2018
dmd.aspetjournals.org
Dow
nloaded from
DMD # 76414
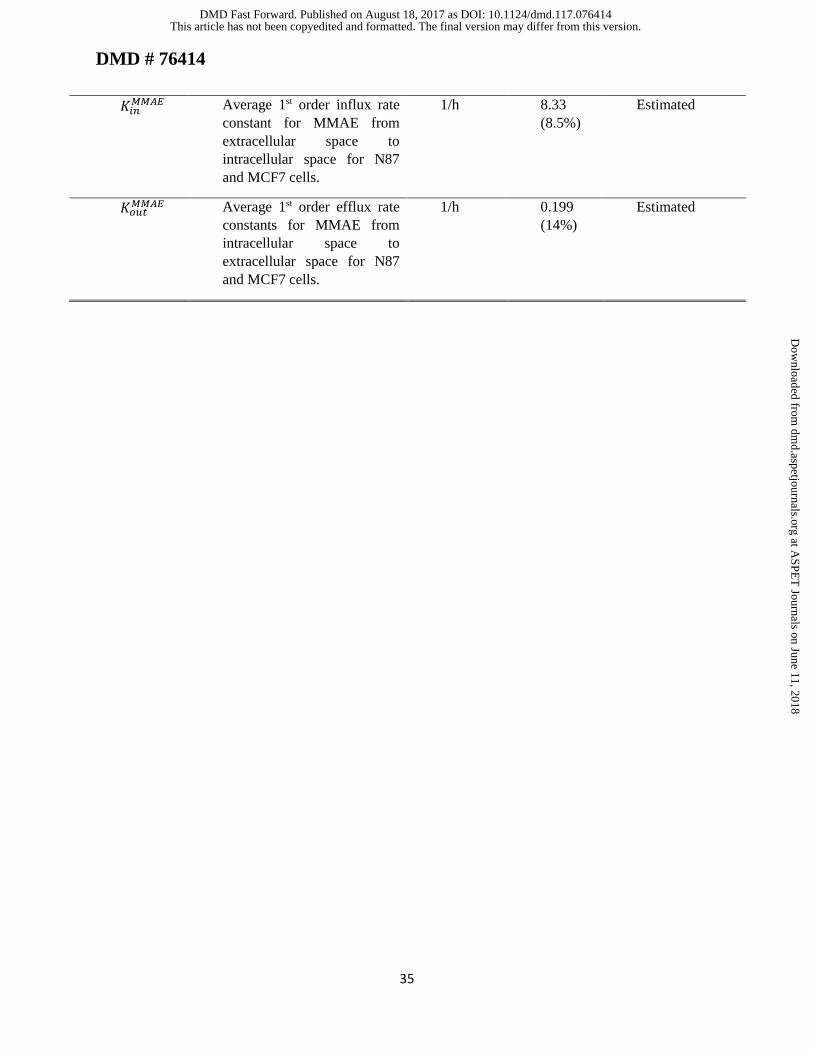
35
𝐾𝑖𝑛𝑀𝑀𝐴𝐸 Average 1st order influx rate
constant for MMAE from
extracellular space to
intracellular space for N87
and MCF7 cells.
1/h 8.33
(8.5%)
Estimated
𝐾𝑜𝑢𝑡𝑀𝑀𝐴𝐸 Average 1st order efflux rate
constants for MMAE from
intracellular space to
extracellular space for N87
and MCF7 cells.
1/h 0.199
(14%)
Estimated
This article has not been copyedited and formatted. The final version may differ from this version.DMD Fast Forward. Published on August 18, 2017 as DOI: 10.1124/dmd.117.076414
at ASPE
T Journals on June 11, 2018
dmd.aspetjournals.org
Dow
nloaded from
This article has not been copyedited and formatted. The final version may differ from this version.DMD Fast Forward. Published on August 18, 2017 as DOI: 10.1124/dmd.117.076414
at ASPE
T Journals on June 11, 2018
dmd.aspetjournals.org
Dow
nloaded from
This article has not been copyedited and formatted. The final version may differ from this version.DMD Fast Forward. Published on August 18, 2017 as DOI: 10.1124/dmd.117.076414
at ASPE
T Journals on June 11, 2018
dmd.aspetjournals.org
Dow
nloaded from
Thi
s ar
ticle
has
not
bee
n co
pyed
ited
and
form
atte
d. T
he f
inal
ver
sion
may
dif
fer
from
this
ver
sion
.D
MD
Fas
t For
war
d. P
ublis
hed
on A
ugus
t 18,
201
7 as
DO
I: 1
0.11
24/d
md.
117.
0764
14
at ASPET Journals on June 11, 2018dmd.aspetjournals.orgDownloaded from
Thi
s ar
ticle
has
not
bee
n co
pyed
ited
and
form
atte
d. T
he f
inal
ver
sion
may
dif
fer
from
this
ver
sion
.D
MD
Fas
t For
war
d. P
ublis
hed
on A
ugus
t 18,
201
7 as
DO
I: 1
0.11
24/d
md.
117.
0764
14
at ASPET Journals on June 11, 2018dmd.aspetjournals.orgDownloaded from
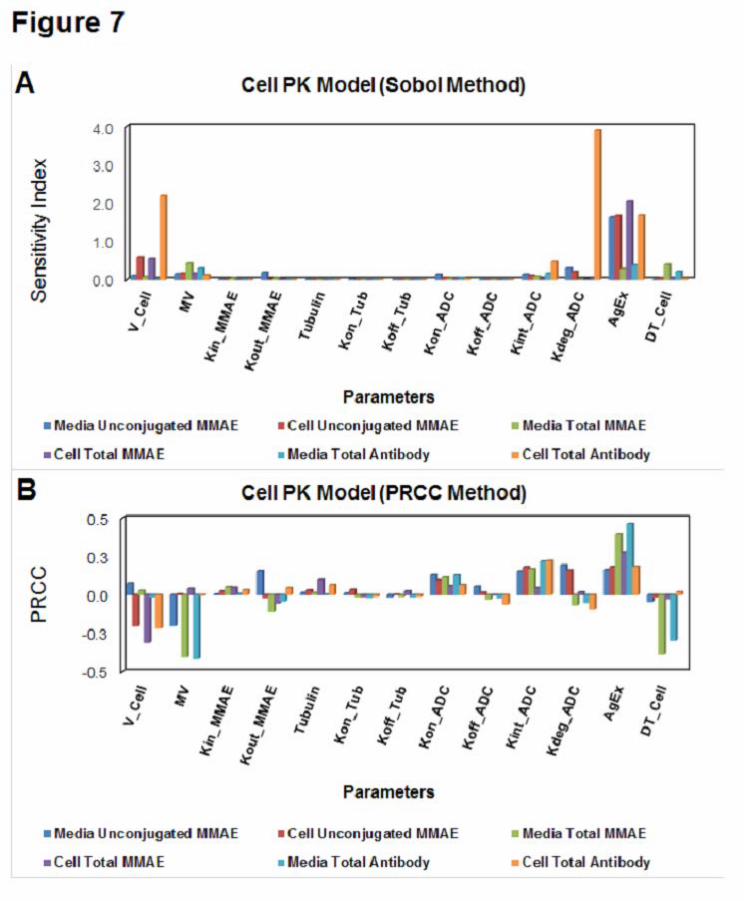
This article has not been copyedited and formatted. The final version may differ from this version.DMD Fast Forward. Published on August 18, 2017 as DOI: 10.1124/dmd.117.076414
at ASPE
T Journals on June 11, 2018
dmd.aspetjournals.org
Dow
nloaded from