Embed Size (px)
Citation preview
Measurement Challenges for Cyber Cyber Digital Twins:Experiences from the Deployment of Facebook’s WW
Simulation SystemK. BojarczukFacebook Inc.
UK
I. DvortsovaFacebook Inc.
UK
J. GeorgeFacebook Inc.
UK
N. GucevskaFacebook Inc.
UK
M. HarmanFacebook Inc.
UK
M. LomeliFacebook Inc.
UK
S. LucasFacebook Inc.
UK
E. MeijerFacebook Inc.
UK
R. RojasFacebook Inc.
UK
S. SaporaFacebook Inc.
UK
ABSTRACTA cyber cyber digital twin is a deployed software model that exe-cutes in tandem with the system it simulates, contributing to, anddrawing from, the system’s behaviour. This paper outlines Face-book’s cyber cyber digital twin, dubbed WW, a twin of Facebook’sWWW platform, built using web-enabled simulation. The paperfocuses on the current research challenges and opportunities in thearea of measurement. Measurement challenges lie at the heart ofmodern simulation. They directly impact how we use simulationoutcomes for automated online and semi-automated offline decisionmaking. Measurements also encompas how we verify and validatethose outcomes. Modern simulation systems are increasingly be-coming more like cyber cyber digital twins, effectively moving frommanual to automated decision making, hence, these measurementchallenges acquire ever greater significance.
CCS CONCEPTS• Software and its engineering→ Software creation andman-agement; Extra-functional properties.
KEYWORDSSimulation, Social Media, Digital Twin, Software MeasurementACM Reference Format:K. Bojarczuk, I. Dvortsova, J. George, N. Gucevska, M. Harman, M. Lomeli,S. Lucas, E. Meijer, R. Rojas, and S. Sapora. 2021. Measurement Challengesfor Cyber Cyber Digital Twins: Experiences from the Deployment of Face-book’s WW Simulation System. In ACM / IEEE International Symposium
Permission to make digital or hard copies of part or all of this work for personal orclassroom use is granted without fee provided that copies are not made or distributedfor profit or commercial advantage and that copies bear this notice and the full citationon the first page. Copyrights for third-party components of this work must be honored.For all other uses, contact the owner/author(s).ESEM ’21, October 11–15, 2021, Bari, Italy© 2021 Copyright held by the owner/author(s).ACM ISBN 978-1-4503-8665-4/21/10.https://doi.org/10.1145/3475716.3484196
on Empirical Software Engineering and Measurement (ESEM) (ESEM ’21),October 11–15, 2021, Bari, Italy. ACM, New York, NY, USA, 10 pages. https://doi.org/10.1145/3475716.3484196
1 INTRODUCTIONThis paper is concerned with challenges in measurement of simula-tion systems. Measurement questions are essential for simulationsince these have direct importance and impact on the decisionsmade from simulation outcomes.
Simulation is acquiring increasing importance due to the wide-spread application domains, and far-reaching impact of the criticaldecisions taken based on simulation results. These decisions af-fect diverse areas of human endeavour ranging from economics[50] and traffic safety [5], through to profound questions about thehealth of our species [1] and of our planet [30]. Without reliable,replicable, interpretable and soundly-based measurement, all ofthese important application areas become compromised.
At Facebook, we are building a digital twin, called WW [2], ofall Facebook platforms. WW simulates Facebook user communitybehaviour, but uses the real Facebook platforms, as well as offlineversions of them, thereby making simulations highly realistic [4].WW is a cyber cyber digital twin, because it simulates virtual (i.e.,cyber-based) systems; the Facebook WWW platforms in particular.[4]. The ability to execute simulations of user behaviour on the realsoftware platforms is a unique property of cyber cyber digital twins,distinguishing them from their cyber physical cousins [4].
The ‘cyber cyber’ nature of the simulation also has implicationsfor measurement, because we can deploy the same measurementsthat the real platform computes for real users, when computingvalues for simulated users (bots). However, as we shall see, despitethis apparent advantage for measurement, there remain many im-portant open challenges and research questions for measurementof cyber cyber digital twins in particular, and of modern softwaresimulations in general.
ESEM ’21, October 11–15, 2021, Bari, Italy K. Bojarczuk, I. Dvortsova, J. George, N. Gucevska, M. Harman, M. Lomeli, S. Lucas, E. Meijer, R. Rojas, and S. Sapora
This position paper outlines some of the open research chal-lenges, highlighting the potential impact on software measurementtheory and practice. We hope that the paper generates further in-terest amongst the scientific research community, in tackling someof these challenging, impactful, and intellectually stimulating prob-lems.
2 WHAT IS MEASUREDMeasurement is important, not only in deciding all the low-level sig-nals to monitor but also plays a role in determiningwhich high-levelfeatures or summaries to produce. The very essence of simulation isto produce measurements in the simulated world that are relevantto future real-world executions. Because our simulation is web-enabled [2], the measurements are taken from the execution of botbehaviours on the real platform. This allows us to base decisionson measurements taken directly from the execution of simulatedbehaviours on the real platform and not on simulated values fromsome model of the real world.
In order to support measurement, WW has an extensive set ofmonitoring facilities that can be selectively enabled to report avariety of signals including:
• Details of each action taken by each bot/user, whether itsucceeded or failed and any exceptions it raised
• The observations provided to each bot/user• The exact timestamp per action and observation (in bothreal-time and simulation-time)
• The changes or mutations made to the WW social graph asa result of the simulation
These measurements provide a rich set of signals from which todraw test-related inferences. In our definition of measurement, weinclude logging all the required low-level details of a run togetherwith the higher-level signals we abstract from these. For example,we log exactly when each bot action was triggered and the reac-tion it produced. Subsequently, this raw output is processed and ameaningful summary needs to be extracted from it.
One of the advantages of the measurements we take from WWsimulations is their realistic nature but there remain open prob-lems and challenges in interpreting the measurement signal fromsimulations, more details of which are included in the next section.
3 FOUNDATIONS OF SIMULATIONMEASUREMENT
A run from a simulation process encodes the entire emergent be-haviour of the whole community of users on the WWW platform.It is of interest to determine whether two or more simulation runscome from the same underlying process. This can be done using adecision rule based on one or more shared attributes of each run.This boolean outcome is what constitutes our simulation measure-ment in this section. The task of determining whether two sets ofruns 𝑋 and 𝑌 are generated by the same underlying distribution,called simulation testing, gives us a form of software testing that liesabove all other testing approaches in the test abstraction hierarchy,such as integration testing and unit testing. It has a greater faultrevealing potential, since the simulation encodes the entire emer-gent behaviour of the whole community of users on the platform,rather than testing a specific aspect of the infrastructure.
As a consequence, simulation-based testing is able to find sub-tler bugs that might otherwise make their way into production. Itachieves this greater fault revelation potential at the cost of greatercomputational effort than any other testing approach.
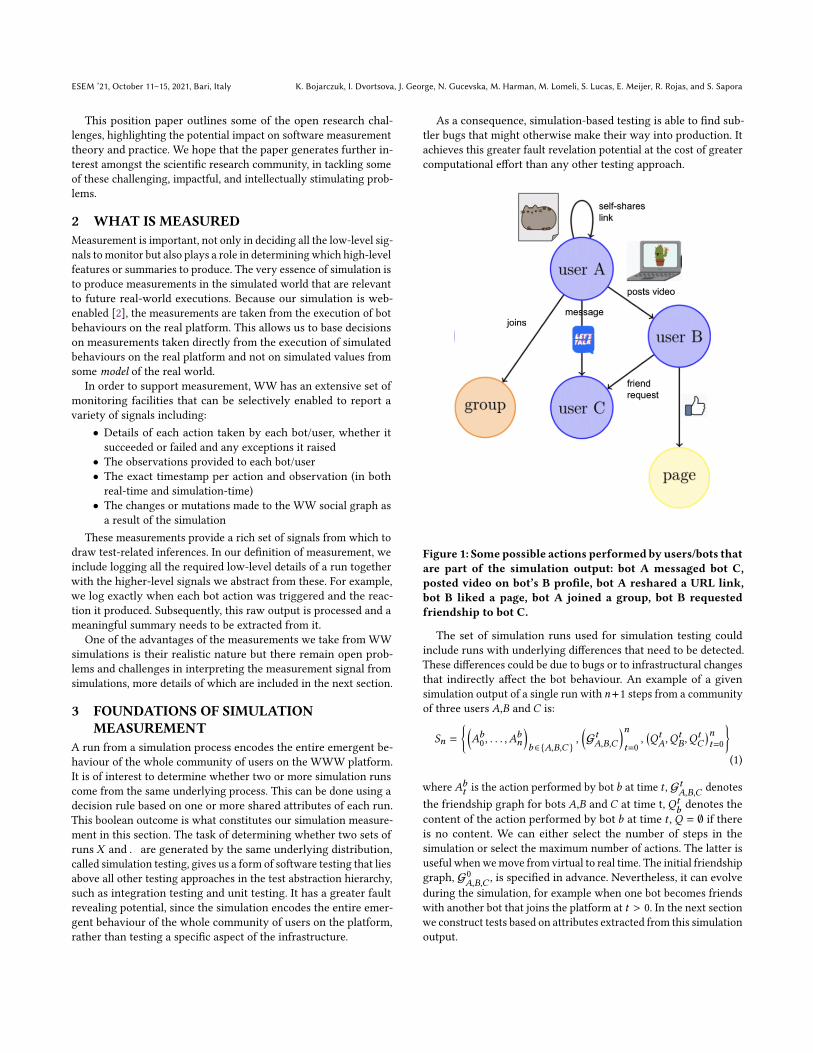
Figure 1: Some possible actions performed by users/bots thatare part of the simulation output: bot A messaged bot C,posted video on bot’s B profile, bot A reshared a URL link,bot B liked a page, bot A joined a group, bot B requestedfriendship to bot C.
The set of simulation runs used for simulation testing couldinclude runs with underlying differences that need to be detected.These differences could be due to bugs or to infrastructural changesthat indirectly affect the bot behaviour. An example of a givensimulation output of a single run with 𝑛+1 steps from a communityof three users 𝐴,𝐵 and 𝐶 is:
𝑆𝑛 =
{(𝐴𝑏0 , . . . , 𝐴
𝑏𝑛
)𝑏∈{𝐴,𝐵,𝐶 }
,
(G𝑡𝐴,𝐵,𝐶
)𝑛𝑡=0
,(𝑄𝑡𝐴, 𝑄
𝑡𝐵, 𝑄
𝑡𝐶
)𝑛𝑡=0
}(1)
where𝐴𝑏𝑡 is the action performed by bot 𝑏 at time 𝑡 , G𝑡
𝐴,𝐵,𝐶denotes
the friendship graph for bots 𝐴,𝐵 and 𝐶 at time t, 𝑄𝑡𝑏denotes the
content of the action performed by bot 𝑏 at time 𝑡 , 𝑄 = ∅ if thereis no content. We can either select the number of steps in thesimulation or select the maximum number of actions. The latter isuseful whenwemove from virtual to real time. The initial friendshipgraph, G0
𝐴,𝐵,𝐶, is specified in advance. Nevertheless, it can evolve
during the simulation, for example when one bot becomes friendswith another bot that joins the platform at 𝑡 > 0. In the next sectionwe construct tests based on attributes extracted from this simulationoutput.
Measurement Challenges for Cyber Cyber Digital Twins: Experiences from the Deployment of Facebook’s WW Simulation System ESEM ’21, October 11–15, 2021, Bari, Italy
3.1 Deterministic Simulation-based testing forWW at Facebook
In general, when we construct tests, we do so with respect to aset of attributes that we can observe from a simulation. Theseattributes are ‘measured’ as a byproduct of simulation, and formthe connection between simulation and software measurement. Wetest WW using a software testing infrastructure called MIA (theMetamorphic Interaction Automaton) [3].
In this section, we review three types of deterministic simulationtesting:
(1) Social testing [2] consists of verifying that the whole sys-tem meets social properties required of the system. It simu-lates the actions of an entire community of users, interactingwith one another.
(2) End-to-end testing consists on verifying that the differentparts of the system are working as intended, it simulatesthe actions of a single user of the system. An end-to-endtest is usually regarded as having a successful outcome ifthere were no exceptions raised during the execution of thesimulation. It is therefore, primarily concerned with whetherthe software system breaks when used by one of its users.However, this is a very rudimentary success criterion; equiv-alent to the default (aka implicit [13]) oracle. By contrast,social testing can reveal bugs where one user can harm an-other through the system under test; traditional end-to-endtesting cannot do this because it concerns only a single userexperience, and because it seeks bugs caused by the systemnot through its use.
(3) Regression testing [55] compares two or more executionsof the system under test, typically comparing the current ver-sion with some previous ground truth. In previous work [3],we showed that regression testing is a special case of meta-morphic testing, an observation we used to simplify thedeployment of our MIA test system for social, end-to-end,regression and metamorphic testing.
Importantly, and unlike traditional simulation, themeasurementsare taken directly from the execution on the real software systemunder test. We call this “web-enabled” simulation [2], because thedeployment of software systems on web-based platforms enablesus to simulate user communities’ behaviour on the real platformitself, rather than a mere simulation of that platform. This has theimportant implication that our measurements are taken directlyfrom the engineering artefact simulated, thereby imbuing themwith greater realism, and consequently actionability, compared totraditional simulations.
Based on the attributes we measure, we define properties that weexpect to hold irrespective of the specific details of the simulations.For example, a simple property to verify is, if we create a newcommunity of 𝑁 bots, then at least 𝑁 new user accounts havebeen created. We can therefore augment end-to-end testing withproperty testing, allowing the simulation developer to test thatany changes they may make to the platform respect the propertiesof interest. In particular, end-to-end property testing in WW atFacebook is used to help us catch social bugs [2]. We use this formof simulation-based testing to identify integrity bugs; social bugsthat affect the integrity of our user community.
We called this “property testing” rather than “property-basedtesting”, because property-based testing typically involves sim-plifying fault-revealing test sequences [18]. Currently, we do notperform the simplification step, although there is no reason why, infuture, we could not extend our test infrastructure to perform suchsimplifications, thereby making it fully property-based testing.
Property testing can be very powerful to measure expected out-comes in the simulation. Consider the scenario in which the socialmedia platform needs to give certain guarantees about the deletionof offensive content. All three forms of simulation-based testingcould be used to identify integrity bugs; social bugs that affect theintegrity of our user community.
For example, we can check whether there exists a bug that breaksthe part of the infrastructure responsible for deleting content. Ifwe suppose further that the changes made in part of the code thatis unrelated to content deletion have a subtle transitive effect onthe deletion framework such that it can occasionally fail to deletecontent. Property testing would be the option of choice since thespecific property – deletion of content – can be tested in all versionsof the code to hold true.
A property or set of properties captures aspects of the socialmedia system that should be preserved throughout any and allscenarios captured by the simulation. We can verify the followingproposition: for all ordered tuples O, which contain a set of prop-erties computed from the simulation output, and an ordered tupleO∗, which contains the expected property, then
ER(O,O∗)
where ER denotes the conjunction of point-wise equality relation-ships.
One can test whether a simulation run contains a specific pieceof content or whether a given action or set of actions has beencompleted. In the latter case, due to the stochasticity of simulations,testing that exactly 𝑛 actions happened can lead to a false positivetest failure so we instead test for the typicality per action. Thestatistical testing task is described in the next section, it consistson determining whether two sets of runs X and Y are generated bythe same underlying distribution.
3.2 Statistical simulation testingA simulation is an example of a randomized algorithm [10], sincerunning it twice usually produces different output. For this reason,instead of testing whether a given property is present in all simula-tion runs, we can test whether it is typically present in a proportionof runs.
This is because there exists inherent stochasticity arising fromboth the bots’ behaviours and infrastructural changes. Many sys-tems, not just simulation systems, exhibit high degrees of non-determinism, arising from a diverse set of reasons, including:
• Remote Procedure Call (RPC)-related variability, arising fromnetwork delays and variable host performance and loads
• Parallel, multi-threaded and/or asynchronous execution• Use of random number generators• Dependence on real-world sensors
If we rely on measurements from such non-deterministic execu-tions it could lead to flaky tests [28, 36].

ESEM ’21, October 11–15, 2021, Bari, Italy K. Bojarczuk, I. Dvortsova, J. George, N. Gucevska, M. Harman, M. Lomeli, S. Lucas, E. Meijer, R. Rojas, and S. Sapora
Figure 2: Two distinct runs of a simulation where we specifythe proportion of users of a given age and sample the usersage independently with a given probability. In the first run,the probability of a user being aged in their 50s is 0.2 andthe probability of being aged in their 20s is 0.8. In the secondrun, users have a higher probability of being in their fifties.The average age of profiles visited during the second run ishigher than the average age of visited profiles on the firstrun.
We also face this problem, in arguably its most pernicious form,with WW simulation outcomes, and the measurements and testswe extract from them. To continue the example of content deletion,a property test can check whether borderline content is removedfrom social networks. The property – deletion of content – could bechecked to be typically fulfilled (rather than always fulfilled) sincethe classifiers might reasonably be expected to missclassify thecontent in a small number of scenarios. The typicality of the bots’behaviour can be assessed indirectly by analysing the frequency ofthe bots’ actions per type.
This requires appropriate statistical tests to be properly analyzedin a sound manner [10]. Detailed surveys concerning the conductof statistical testing can be found elsewhere [9, 27]. In the followingtwo sections we review how these inferential statistical conceptsapply to simulation measurement for cyber cyber digital twins.
3.2.1 Type I and Type II errors in Different Simulation Use Cases.In two sample tests, it is of interest to reject the null hypothesis oftwo probability distribution 𝑃 and 𝑄 being equal. This is denotedby 𝐻0 : 𝑃 = 𝑄 vs 𝐻1 : 𝑃 ≠ 𝑄 . There are two possible types of errorswhen performing statistical testing: (I) reject the null hypothesiswhen it is true (i.e., claiming that there is a difference between twosets of outcome when actually there is none), and (II) 𝐻0 is notrejected when it is false. The 𝑝-value of a statistical test denotesthe probability of a Type I error. The significance level, 𝛼 , of a testis the highest 𝑝-value that would lead to a rejection of 𝐻0.
Naturally, a balance has to be struck between risk of committingeach of these two types of error. Typically, because scientific ad-vances ideally build on the most certain foundations, there has beena tendency to shift the balance in favour of not committing a Type Ierror. The ritualistic statistical behaviours this has introduced havebeen the subject of much discussion in the scientific community,for instance, the problem with common ‘𝑝-value fallacies’ [23]. Forsimulation applications, this subtle balance needs to be determineddifferently depending on the use case sensitivity.
For example, when we are simulating whether a new featuremight lead to a privacy violation, we would want an extremelyhigh confidence before deploying the feature. For this scenario, wewould much rather commit a Type II error and miss an opportunityto deploy the new feature.
However, when we are experimenting with a positive featurethat may possibly reduce prevalence of harmful behaviour online,and which has no other risks, we would be much more concernedabout committing a Type I error.
Clearly then, we cannot set an arbitrary threshold for the statis-tical confidence required of a simulation. Instead, we need to adaptthe way in which we deploy inferential statistical analysis to eachof the use cases to which we put simulation.
Non-deterministic behaviours, although varying between runs,typically do respect certain statistical properties of interest that canbe expressed over multiple simulation runs. For example, considerFigure 2, which compares the results of two simulations accordingto the average age of profiles visited. Comparing the results of twoor more executions is typically known as ‘metamorphic’ testing[17], although traditional end-to-end testing has been shown to bea special case [3].
For non-deterministic simulations, we are typically interested instatistical metamorphic testing, which caters for non-determinismand with which we can incorporate all the expressive power andconceptual framework of inferential statistical testing.
3.2.2 Parametric and non-parametric testing. There exist paramet-ric two sample tests that rely on parametric assumptions aboutthe data generation mechanism and non-parametric tests that donot have any distributional assumption. Parametric tests usuallycheck whether certain moments of the two samples are the same,for example, the F-test checks for equality in variances, denoted by𝐻0 : 𝜎21 = 𝜎22 vs 𝐻1 : 𝜎21 ≠ 𝜎22 .
Two-sample non-parametric tests directly compare the empiricalobservations of the probability distributions 𝑃 and 𝑄 . Nonparamet-ric tests are less prone to model miss-specification but require moresamples to accurately estimate the empirical counterparts of thedistributions.
In order to determine whether the two simulation outcomescan be considered to be ‘equal’, one also requires a divergencemeasure in the space of probability distributions 𝐻0 : 𝐷 (𝑃,𝑄) < 𝛾
vs𝐻1 : 𝐷 (𝑃,𝑄) > 𝛾 , where𝛾 is a threshold that needs to be selected.Specifically, to compute the test threshold, the null distribution canbe simulated via permutation or bootstrapping of the samples[6].
There are many well-known discrepancy measures between twoprobability distributions, such as the Kullback–Leibler divergence,the Hellinger and total variation distances, which belong to theclass of f-divergences [19].
Alternatively, the class of integral probability metrics [41] hasalso been used to construct two sample tests, for instance, the max-imum mean discrepancy [14, 46] is a kernel-based integral proba-bility metric. Two sample tests based on metrics or divergences areavailable for different data types. For instance, for non-Euclideandata such as the friendship graph part of the simulation output, atwo sample test has been proposed in [22]. A complete overviewof both parametric and non-parametric two sampled tests is out ofscope of the present paper.
Measurement Challenges for Cyber Cyber Digital Twins: Experiences from the Deployment of Facebook’s WW Simulation System ESEM ’21, October 11–15, 2021, Bari, Italy
In the next section, we outline our use of the Jensen-Shannondistance together with a classification approach as an illustration ofhow we can experiment with a statistically-based test and measure-ment approach. The motivation behind using a classifier approachis that a training set can be used to learn the regular variationspresent in the data. This helps us to account for natural simulationoutcome variations and reduces the chance of wrongly rejectingthe null hypothesis. The relationship between classifiers and twosample tests has been explored [16, 35]. Indeed, Kim et al. [31]formally demonstrated that classification accuracy is a proxy fortwo-sample testing.
3.3 Case Study: Using Jensen-ShannonDistance Measurement in Simulations
In this section we illustrate the use of the Jensen-Shannon distancefor statistical metamorphic tests, based on the distributions of botactions taken during simulation runs. The Jensen-Shannon distanceis appropriate for more nuanced variations in behaviour. It providesa testing approach which does not require a particular deterministicproperty to be specified.
3.3.1 Setup. The setup involves:• A change request under test: In Facebook parlance, pullrequests are called ‘diffs’. Diffs undergo code review in thenormal continuous execution system deployed at Facebook,based on Phabricator [21].
• A simulation story to run: In this illustration, we use astory called CommunityBuilder, which creates a communityof bots that then take actions within the community, suchas creating posts, liking posts, sending 1-to-1 messages, up-loading photos etc. At the time of writing there are over 60individual actions in which bots can engage, a number thatis regularly increasing as more simulations come on stream.
• Selecting parameters: Parameters include the number ofusers or bots, the community friendship graph, and the max-imum total number of actions to execute.
• Definition of the aspects of the simulation to be ob-served: In this simple illustration, we count the total num-ber of actions of each type that successfully executed duringa simulation. This is returned as a dictionary of key-valuepairs, for example MobilePhotoUpload:23, ShareURL:533,...). We model these as drawn from an underlying multino-mial distribution.
• A set of simulation runs from which to collect obser-vations: These runs necessarily include those with knowndifferences that need to be detected so that we can tuneand test the test infrastructure itself. We create these differ-ences by varying parameter choices. We also use mutationtesting [29] in order to test the test system itself.
3.3.2 Statistical Distance Solution. In this section, we address howto detect anomalies in the distribution caused by bugs or by in-tended changes in the behaviour of the bots, compared to differ-ences caused by “natural or regular” variations. More precisely,we want to estimate the probability that the action distributionsrepresent a significant change in the underlying behaviour of eitherthe platform or the community of bots.
A sample of pairs of runs, denoted by 𝑃𝑁 , is collected from theaction distribution where each run in the pair was made on thesame diff with no known confounding platform effects. 𝑃𝐷 is asample of pairs where each run in the pair is drawn from differentdiffs that led to an expected difference in the action distributionbetween the pairs.
3.3.3 Jensen Shannon Distance (JSD). While any distance measurebetween two probability distributions can be used within our frame-work, we chose the JSD since it has some attractive features suchas:
(1) JSD is simpler to implement that other distance measureswhich could have non-analytic forms
(2) JSD conforms to the requirements for a distance metric i.e.symmetry and triangle inequality
(3) JSD is bounded by 0.0 (the two distributions have nothingin common) and 1.0 (they are identical).
We use a frequentist approach to compute probabilities for eachbot action type. That is, we count the number of each type of actionsuccessfully executed during a run, and normalise this by the totalnumber of successful actions, thereby estimating the probability ofeach action. An alternative way to estimate action probabilities isto use a Bayesian method, where the the observation of each actionis used to update a prior distribution (e.g. see [37], chapter 2). Wecould also adopt standard n-gram language modelling estimationtechniques such as Laplace smoothing to include joint distributionsas well as marginal distributions.
3.3.4 Threshold and Probability Estimation from Data. The JSDcondenses the differences between two probability distributionsinto a single number. We need to set a threshold in order to deter-mine the pass/fail outcome of the test. Alternatively, we can alsocalculate the probability that the distance between distributionssignifies an underlying issue.
For each case, provided we have enough data in the test pair sets𝑃𝑁 and 𝑃𝐷 , we proceed as follows:
(1) For each pair 𝑝𝑖 we calculate the distance 𝑑 (𝑝𝑖 ) and recordwhether it is a positive (𝑃𝑁 ) or negative (𝑃𝐷 ) example.
(2) We sort the entire list in increasing order of 𝑑 (𝑝𝑖 ).(3) Given an incoming run pair, we estimate the probability that
it is a failed test by finding the proportion of negative pairswith a distance greater than or equal to 𝑑 (𝑝𝑖 ).
If the list of pairs is ordered, this can be calculated directly inO(log(n)) time or compiled into a look-up table for constant-timecomputation. The Receiver Operator Characteristic Area UnderCurve (AUC) metric1 can be computed. The AUC gives us a single-figure summary of the power of the overall combined method setup(i.e. the simulation story, story parameters, action distributionsextracted, distance measure used). The set up can be used to directlytest alternatives.
When testing new product features or other counter-factualsituations, we may not have sufficient existing negative run pairsfrom previously collected data. However, even in this data-scarcesituation, there are two techniques we can employ to interpret theresults from our analysis, to which we now turn.1See https://developers.google.com/machine-learning/crash-course/classification/roc-and-auc for concise description.
ESEM ’21, October 11–15, 2021, Bari, Italy K. Bojarczuk, I. Dvortsova, J. George, N. Gucevska, M. Harman, M. Lomeli, S. Lucas, E. Meijer, R. Rojas, and S. Sapora
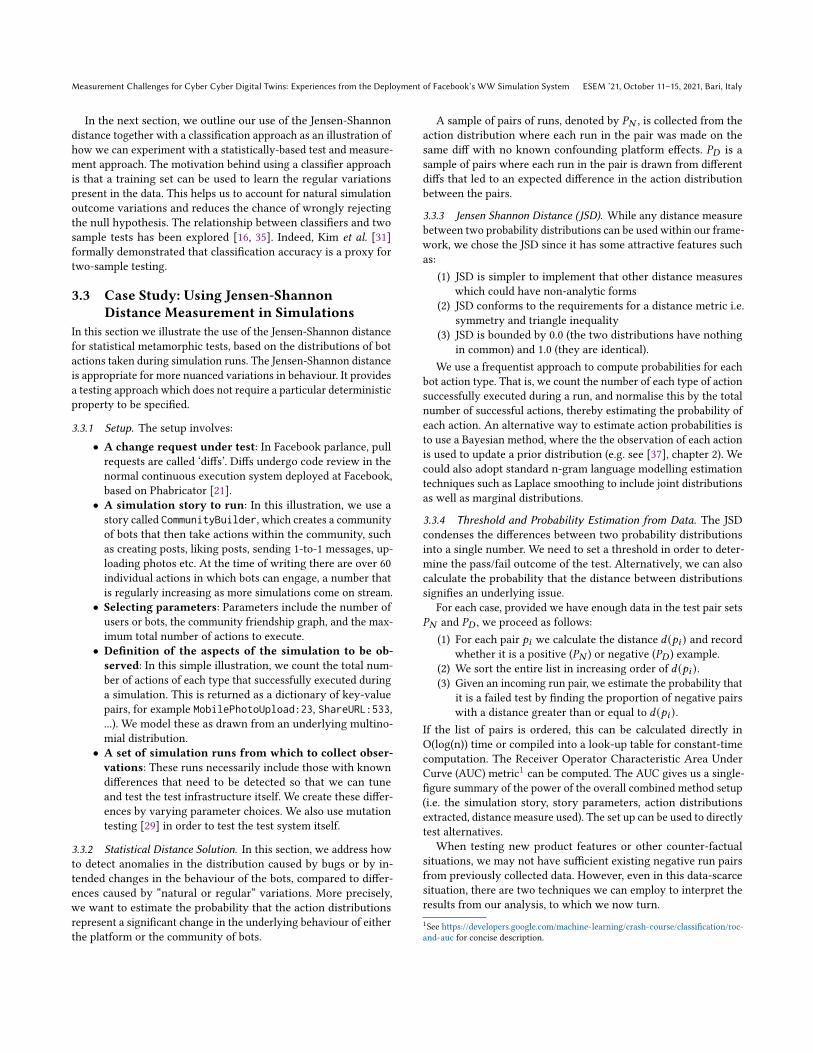
Figure 3: Visualising the JSD matrix; run number 4 brokeand this clearly stands out compared to the normal back-ground variations.
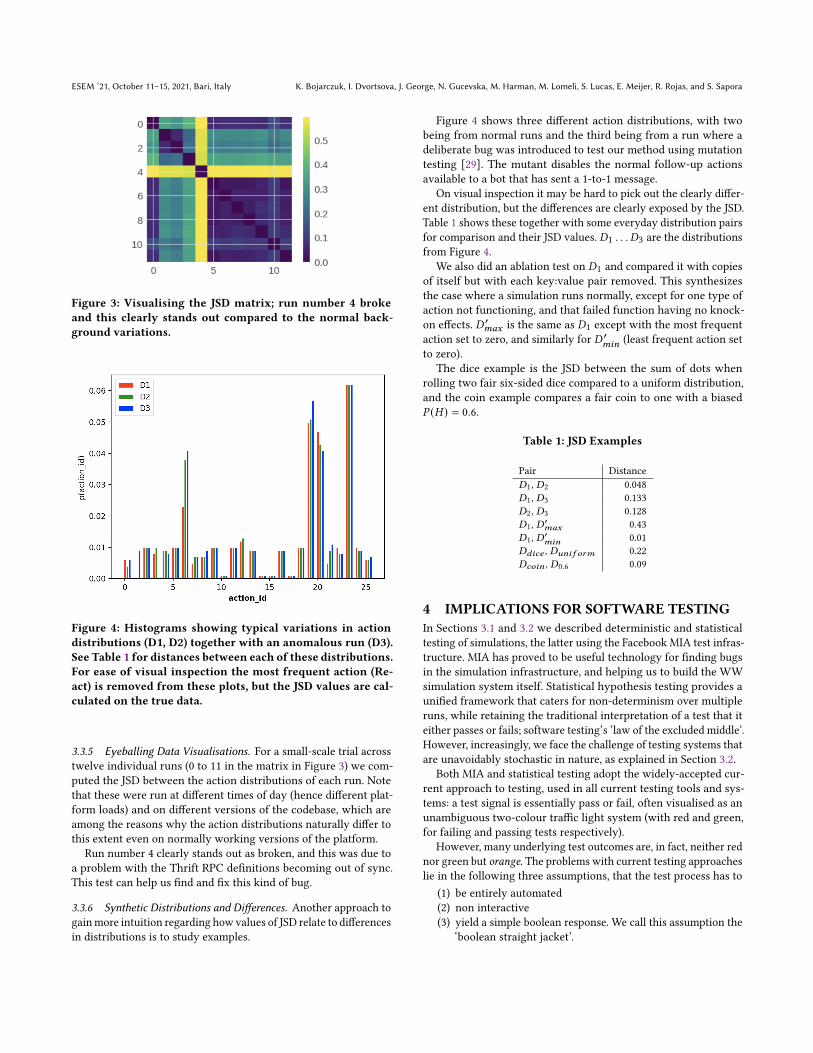
Figure 4: Histograms showing typical variations in actiondistributions (D1, D2) together with an anomalous run (D3).See Table 1 for distances between each of these distributions.For ease of visual inspection the most frequent action (Re-act) is removed from these plots, but the JSD values are cal-culated on the true data.
3.3.5 Eyeballing Data Visualisations. For a small-scale trial acrosstwelve individual runs (0 to 11 in the matrix in Figure 3) we com-puted the JSD between the action distributions of each run. Notethat these were run at different times of day (hence different plat-form loads) and on different versions of the codebase, which areamong the reasons why the action distributions naturally differ tothis extent even on normally working versions of the platform.
Run number 4 clearly stands out as broken, and this was due toa problem with the Thrift RPC definitions becoming out of sync.This test can help us find and fix this kind of bug.
3.3.6 Synthetic Distributions and Differences. Another approach togainmore intuition regarding how values of JSD relate to differencesin distributions is to study examples.
Figure 4 shows three different action distributions, with twobeing from normal runs and the third being from a run where adeliberate bug was introduced to test our method using mutationtesting [29]. The mutant disables the normal follow-up actionsavailable to a bot that has sent a 1-to-1 message.
On visual inspection it may be hard to pick out the clearly differ-ent distribution, but the differences are clearly exposed by the JSD.Table 1 shows these together with some everyday distribution pairsfor comparison and their JSD values. 𝐷1 . . . 𝐷3 are the distributionsfrom Figure 4.
We also did an ablation test on 𝐷1 and compared it with copiesof itself but with each key:value pair removed. This synthesizesthe case where a simulation runs normally, except for one type ofaction not functioning, and that failed function having no knock-on effects. 𝐷 ′
𝑚𝑎𝑥 is the same as 𝐷1 except with the most frequentaction set to zero, and similarly for 𝐷 ′
𝑚𝑖𝑛(least frequent action set
to zero).The dice example is the JSD between the sum of dots when
rolling two fair six-sided dice compared to a uniform distribution,and the coin example compares a fair coin to one with a biased𝑃 (𝐻 ) = 0.6.
Table 1: JSD Examples
Pair Distance𝐷1, 𝐷2 0.048𝐷1, 𝐷3 0.133𝐷2, 𝐷3 0.128𝐷1, 𝐷′
𝑚𝑎𝑥 0.43𝐷1, 𝐷′
𝑚𝑖𝑛0.01
𝐷𝑑𝑖𝑐𝑒 , 𝐷𝑢𝑛𝑖𝑓 𝑜𝑟𝑚 0.22𝐷𝑐𝑜𝑖𝑛 , 𝐷0.6 0.09
4 IMPLICATIONS FOR SOFTWARE TESTINGIn Sections 3.1 and 3.2 we described deterministic and statisticaltesting of simulations, the latter using the Facebook MIA test infras-tructure. MIA has proved to be useful technology for finding bugsin the simulation infrastructure, and helping us to build the WWsimulation system itself. Statistical hypothesis testing provides aunified framework that caters for non-determinism over multipleruns, while retaining the traditional interpretation of a test that iteither passes or fails; software testing’s ‘law of the excluded middle’.However, increasingly, we face the challenge of testing systems thatare unavoidably stochastic in nature, as explained in Section 3.2.
Both MIA and statistical testing adopt the widely-accepted cur-rent approach to testing, used in all current testing tools and sys-tems: a test signal is essentially pass or fail, often visualised as anunambiguous two-colour traffic light system (with red and green,for failing and passing tests respectively).
However, many underlying test outcomes are, in fact, neither rednor green but orange. The problems with current testing approacheslie in the following three assumptions, that the test process has to
(1) be entirely automated(2) non interactive(3) yield a simple boolean response. We call this assumption the
‘boolean straight jacket’.

Measurement Challenges for Cyber Cyber Digital Twins: Experiences from the Deployment of Facebook’s WW Simulation System ESEM ’21, October 11–15, 2021, Bari, Italy
These assumptions are appropriate for unit testing, which residesat the lowest level of the test abstraction hierarchy. However, aswe move up the hierarchy we encounter more expensive forms oftesting and also tests with less certain outcomes. Over time, weaim to develop a more interactive approach to testing, better suitedto simulation. We believe that such an approach to testing maybenefit non-simulation based testing scenarios too. In this section,we outline the vision for this potentially new form of softwaretesting. We envisage that our test technology will evolve into a botthat plays the role of a reviewer, interacting with other reviewersand code authors. In this way, test technology will yield much morenuanced and sophisticated signals than merely a simple booleanresponse.
To motivate the long term need to escape the boolean straightjacket, consider the current tip of the test abstraction hierarchy,where we encounter traditional end-to-end tests. End-to-end testsseek to mimic the behaviour of the whole system, as seen by a realuser. At this level of testing, the test is computationally expensive,because it involves execution of the entire system. Social testingusing simulation, lies at an even higher level of abstraction [2]. Andit is even more computationally expensive.
As systems become increasingly non-deterministic, such highlevel tests also become increasingly flaky. One can remedy this bychoosing an acceptable tolerance for Type I errors. However, it isnot clear what this ‘sensible’ significance level should be a priori.The test flakiness problem has been highlighted previously, in bothresearch [36] and practice [28, 40]. The research community hasattempted to overcome the test flakiness problem by identifying,controlling and removing flaky tests [39]. However, an alternativeis to live with a world in which “all tests are assumed to be flaky” [28].This shift in perspective allows us to escape the boolean straightjacket. Such a non-boolean testing approach is clearly better suitedto measurement challenges set out in the previous section. Wealso believe it may be forced on the wider software engineeringcommunity by increased non-determinism, whether or not thesystem under test is a simulation.
The boolean straight jacket is problematic from both a practicaland a theoretical point of view:
• Theoretical problemswith the boolean straight jacket:From a theoretical standpoint, the boolean straight jackettransforms an enormous amount of information into a singlebit (pass/fail). It means that all testing systems have theworst possible domain to range ratio [8, 52], an observationwhich, perhaps, accounts for the difficulty of testing the testinfrastructure itself; high domain to range ratio programsare the least testable [52]. From an information theoreticperspective [47], the boolean straitjacket also denotes a hugeloss of information; why throw away all of that valuable testsignal, especially when obtaining it was computationallyexpensive?
• Practical problems with the boolean straight jacket:From a practical perspective, there are mounting challengesin tackling test flakiness that come from unavoidably increas-ing non-determinism. Simulation resides at the vanguardof this trend, because it involves users’ behaviour, which istypically highly stochastic.
However, other software technologies, unrelated to simula-tion, are increasingly interconnected are thereby becomingincreasingly non-deterministic. For instance, some of the firstautomated web based testing tools already encountered thisproblem; even the weather can affect test coverage achieved[7]. Taking account of this non-determinism in a testingprocess inherently involves making context sensitive andwell-informed decisions about statistical thresholds, that bal-ance false positives and false negatives. One cannot simplydetermine a threshold up front and adopt a ‘one size fits allapproach’.
Of course, it is undoubtedly heartening to receive a test signalwhich simply gives a green light or a red light. The old-fashionedtesting approach is simple, intuitive, reassuring when green, andhopefully actionable when red. Sadly, as any practising softwareengineer will attest, the green signal can so easily give a false senseof security. Arguably worse, the red signal may prove to be a falsepositive, wasting developer effort on some of the most tedious andfrustrating intellectual activities known to humankind.
Any test infrastructure that survives and thrives while respectingthe boolean straight jacket can do so only by significantly reducingthe chance of wasted developer effort. A test infrastructure thatfails to achieve this will tend to be weeded out by natural selection;developers will simply abandon or ignore a system that wastes toomuch of their time.
As a result of this underlying evolutionary adoption process, themost pernicious effect of the boolean straight jacket lies not thewasted developer effort itself, but rather, it lies in the potentiallyvaluable test signal that we lose by attempting to ensure developereffort is not wasted. In the presence of highly non-deterministicexecution environments, testing systems resort to passing on a redsignal to a developer, only when there is a high degree of certainty.What about those situations where the signal indicates there maybe some problem, but an automated decision needs to be taken notto bother the developer?
4.1 Foggy Traffic Light TestingWhat if we could give the developer a foggy traffic light signalinstead of a crisp one?
Of course there is a lot to be sacrificed by migrating from sharpto foggy traffic lights, and this is why it has proved difficult toachieve. However, we need to rethink the fundamentals of testingand in particular, the software engineering workflows in whichtesting is deployed. Failure to do so will result in testing becomingever more expensive, while simultaneously yielding ever poorerassurance of software correctness.
How can we go further than simply replacing a clear (actionable)signal with a foggy (vague and unactionable) signal?
The answer lies in code review: Instead of thinking of testingas a fully automated process that acts as a final gatekeeper ondeployment, we should think of it as an extra member of the codereview team, in the sense of modern code review [11]. Ever sincethe introduction of Fagin inspections [20], code review has provedto be one of the most effective practical techniques available forensuring code quality and correctness [45].
ESEM ’21, October 11–15, 2021, Bari, Italy K. Bojarczuk, I. Dvortsova, J. George, N. Gucevska, M. Harman, M. Lomeli, S. Lucas, E. Meijer, R. Rojas, and S. Sapora
Modern code review provides infrastructural support, wherebymany software engineering tools become bots themselves [49].However, despite increasing sophistication of test technology, theautomated test tool is typically not thought of as an interactive bot.
Suppose we think of the automated test tool as a fully interactivemember of the review team that comments on code changes, justas a human reviewer does. Such a ‘test tool as a team member’approach shares its motivation with related approaches such as theautomated statistician [48] and the robot scientist [32].
Let us even give this testing tool a name, ‘Pat’, to respect thefact that Pat truly is part of the team. Pat could be a Three-LetterAcronym for ‘Practical Automated Tester’, but let us anthropomor-phise further, and imagine that Pat is a real person. What doesPat bring to the overall code review process? Quite a lot, it turnsout. Pat is an exceptionally gifted member of the team, who nevercomplains. Pat always responds, in a timely fashion, to questionsand follow-up requests from other reviewers and the author of theproposed code change. Let us review Pat’s unique attributes:
(1) Anytime followup: Pat knows they have to respond quickly.If they are not the first one to comment on the diff, then theother human reviewers might accept, or reject based on sup-position, bias or misinformation. This time pressure meansthat Pat typically cannot perform all the experiments theywould like to undertake. Instead, Pat has to comment ina limited time window in order to ensure that they are afirst responder. This time pressure forces Pat to choose aprioritised subset of test signal with which to initially com-ment. Fortunately, this subset prioritisation problem hasbeen tackled in an extensive literature on test case selectionand prioritisation, so there are many well-studied algorithmsand techniques [34, 44] from which Pat can choose.Furthermore, Pat is always willing, if asked by human re-viewer, to “go away and perform extra experiments andchecks, and come back to the review process with extrasignal”. Automated testing is an ‘any time’ algorithm; withadditional computational resources we can run more testcases. Notice how making Pat and interactive reviewer, likea human reviewer, creates a natural and intuitive interfaceto help us efficiently find the necessarily context-aware bal-ances required by test case selection and prioritisation prob-lems [55].In a foggy traffic light test system, Pat would offer a Ser-vice Level Agreement (SLA) in which their initial commentwould arrive before that of any human tester. To achievetheir SLA, Pat would adapt their test resources to computethis initial signal, based on observation of current humanreviewer response times. When Pat’s initial signal causesdoubt as to the software correctness among the human re-viewers, they can ask Pat to perform further testing. This isa process well-suited to a non-deterministic world; get theinitial signal, make a human judgement, potentially ask forfurther signal, or decide to go ahead and deploy the codechange anyway. Making Pat a natural part of the normalcode review process creates natural and intuitive workflowsthat enable testing to be iterative and interactive.
(2) Diligent Experimenter: Pat can perform many tedious ex-periments to understand the precise implications of a codechange. If one of the human reviewers requires Pat to doso, then Pat can perform experiments to provide follow-upsignal, answering reviewer questions such as:
(a) Unrelated infra failures: Could the test failures Pat re-ported be the result of recent (apparently) unrelated changesthat landed into the code base? (Pat goes away to ex-perimentally and locally revert the apparently unrelatedchanges and re-run the tests to check)
(b) Increased confidence and reducedflakiness: couldwewait a moment while Pat checks (apparently) flaky signalregarding property 𝑃 for more evidence? (Pat goes awayand runs further tests to gain greater statistical confidencewrt 𝑃 )
(c) Counterfactual experimenter: What if failing test 𝑇were to be run in an initial state where property 𝑃 does nothold? Would it still fail (Pat goes away and checks). Thisability to do counterfactual experimentation could forma natural jumping off point from testing into debugging.Notice how making Pat a team member establishes a verynatural and seamless test-and-debug blend, rather thanenforcing an arbitrary and abrupt step change (that wouldotherwise have come from the boolean straight jacket).Debugging technology has evolved little in the last 40years; it is time for a change. Pat can help.
(d) Popperian Scientist: Pat’s follow-up need not focus onlyon deep diving on failing test signal. Pat can also play therole of ‘Popperian scientist’ [43]; attempting to falsify theclaim that the software is correct, perhaps initiated by thedoubts expressed by a human reviewer.For example, suppose the human reviewer feels queasyabout a particular aspect of the system, perhaps due to acode smell [54], or maybe simply that awkward feelingthat a corner case has been missed.Currently, the anxious human reviewer may have to do alot of work to follow up. Depending on their temperament,they will either reject the code with too little explanation,or accept it while “holding their nose”. How much misun-derstanding and avoidable engineer conflict could havebeen averted if we had only had a thirdmember of the teamwho was willing devote that extra effort to investigate ap-parently green signal? (Pat goes off and runs more testson aspects with currently passing tests, in an to attemptto find a failing case and reports back).
(3) Final Gate Keeper: When Pat is sure that the code changesare incorrect, they can dig in their heels by demanding a fix.In this regard, adding Pat to the review team discards noneof the existing properties of testing systems; foggy trafficlight testing subsumes sharp traffic light testing. However,once again, there are interesting scientific challenges. Howcan Pat learn, from historical data, which parts of the codebase are more likely to fail given the change introduced inthe new code? This is a question already tackled by work onfault prediction [15, 25].

Measurement Challenges for Cyber Cyber Digital Twins: Experiences from the Deployment of Facebook’s WW Simulation System ESEM ’21, October 11–15, 2021, Bari, Italy
What human member of the review team is prepared to go tosuch lengths to help support the code review process? Why, forso long, have we ignored the very special characteristics a teammember like Pat could bring to our team? Pat has so much to tell us,yet we are currently forcing this exceptionally gifted team memberto forget all they know and to simply give us a pure and simple‘yes’ or ‘no’ answer. As we all know, “the truth is rarely pure andnever simple” [53].
Software testing workflows have to change to accommodate Pat.Ultimately, with further research and development, Pat may evolvebeyond the confines of testing, to become a software engineer,able to suggest repairs [24, 38, 51], to recommend code transplants[12, 57], improvements and optimisations [42], and even to explorenew features [26]. The first step on this exciting journey would beto make Pat a proper member of the review team, as a way to adaptsoftware testing for a highly non-deterministic world.
5 OPEN CHALLENGES FOR THE SCIENTIFICCOMMUNITY• Non-boolean testing: As outlined in Section 4, we needto rethink software testing for a world in which the devel-oper gets recommendations during code review rather thanmerely a boolean pass or fail. Section 4 is part proposal andpart polemic, setting out a possible vision of future softwaretesting technology as a full member of the code review team,rather than it being merely a final gatekeeper. Much morework is required to realise this vision. Tackling it will un-doubtedly surface many interesting scientific questions andchallenges.
• Statisticalmetamorphic testing: As outlined in Section 3.2,we need techniques to incorporate statistical inference intothe simulation system itself, the measurements we take fromit, and the decisions and optimisations it recommends. Cur-rent deployment of A/B testing in many organisations [33]already involves sophisticated inferential statistical analy-sis, to support decision-making, based on the outcomes ofthe A/B test. We anticipate simulation will require similarstatistical sophistication. However, the paradigm is morechallenging than A/B testing, because simulation typicallyencompasses counterfactual scenarios.
• Trade offs between simulation speed andprecision: Foroffline simulation modes [4], in which the simulation is notrun directly on the real infrastructure, we need techniquesto understand the trade-off between speed and fidelity ofmeasurement.
• Scalable fitness computation: Measurements from simu-lation can used to guide optimisation, such as for mechanismdesign [2]. Mechanism design has huge potential to turn sim-ulation into a technique for automated product improvement,using techniques such as genetic improvement[42]. However,the computational expense of simulation will raise scalabil-ity challenges. To tackle scalability, we need techniques thatmore closely integrate the optimisation algorithm with thesimulation-based measurement process.We need a kind of ‘lazy fitness computation’, which wouldperform as much of the simulation as required, but no more,
in order to determine an actionable fitness value. For earlierexploratory phases of the optimisation process we may needfaster lightweight simulation, possibly using offline modes.For later optimisation stages in which exploitation of promis-ing solution spaces requires higher fidelity, we will deploymore computationally expensive fitness computation, thatcan yield this higher fidelity.Methods such as early stopping are applicable here and arewidely used in automated hyper-parameter optimisation fortraining neural networks. They aim to make the most of theavailable computation budget by terminating runs that areunlikely to provide good solutions [56].How ever we choose to tackle these scalability challenges, itis clear that the optimisation process cannot treat simulationmerely as a black box that delivers fitness, but needs to havea white box approach to simulation in order to scale.
ACKNOWLEDGEMENTSAuthor order is alphabetical. Mark Harman’s scientific work is partsupported by European Research Council (ERC), Advanced Fellow-ship grant number 741278; Evolutionary Program Improvement(EPIC) which is run out of University College London, where he ispart time professor. He is a full time Research Scientist at Facebook.Simon Lucas is currently a full time Research Scientist at Facebookand also a part time professor at Queen Mary University of London.
REFERENCES[1] David Adam. 2020. Special report: The simulations driving the world’s response
to COVID-19. Nature (April 2020).[2] John Ahlgren, Maria Eugenia Berezin, Kinga Bojarczuk, Elena Dulskyte, Inna
Dvortsova, Johann George, Natalija Gucevska, Mark Harman, Ralf Laemmel,Erik Meijer, Silvia Sapora, and Justin Spahr-Summers. 2020. WES: Agent-basedUser Interaction Simulation on Real Infrastructure. In GI @ ICSE 2020, ShinYoo, Justyna Petke, Westley Weimer, and Bobby R. Bruce (Eds.). ACM, 276–284.https://doi.org/doi:10.1145/3387940.3392089 Invited Keynote.
[3] John Ahlgren, Maria Eugenia Berezin, Kinga Bojarczuk, Elena Dulskyte, InnaDvortsova, Johann George, Natalija Gucevska, Mark Harman, Maria Lomeli, ErikMeijer, Silvia Sapora, and Justin Spahr-Summers. 2021. Testing Web EnabledSimulation at Scale Using Metamorphic Testing. In International Conference onSoftware Engineering (ICSE) Software Engineering in Practice (SEIP) track. Virtual.
[4] John Ahlgren, Kinga Bojarczuk, Sophia Drossopoulou, Inna Dvortsova, JohannGeorge, Natalija Gucevska, Mark Harman, Maria Lomeli, Simon Lucas, ErikMeijer, Steve Omohundro, Rubmary Rojas, Silvia Sapora, Jie M. Zhang, and NormZhou. 2021. Facebook’s Cyber–Cyber and Cyber–Physical Digital Twins. In 25thInternational Conference on Evaluation and Assessment in Software Engineering(EASE 2021). Virtual.
[5] Saif Al-Sultan, Moath M. Al-Doori, Ali H. Al-Bayatti, and Hussien Zedan. 2014.A comprehensive survey on vehicular Ad Hoc network. Journal of Network andComputer Applications 37 (2014), 380 – 392.
[6] V. Alba Fernández, M.D. Jiménez Gamero, and J. Muñoz García. 2008. A test for thetwo-sample problem based on empirical characteristic functions. ComputationalStatistics and Data Analysis 52, 7 (2008), 3730–3748. https://doi.org/10.1016/j.csda.2007.12.013
[7] Nadia Alshahwan and Mark Harman. 2011. Automated Web Application TestingUsing Search Based Software Engineering. In 26𝑡ℎ IEEE/ACM International Con-ference on Automated Software Engineering (ASE 2011). Lawrence, Kansas, USA, 3– 12.
[8] Kelly Androutsopoulos, David Clark, Haitao Dan, Mark Harman, and RobertHierons. 2014. An Analysis of the Relationship between Conditional Entropy andFailed Error Propagation in Software Testing. In 36𝑡ℎ International Conferenceon Software Engineering (ICSE 2014). Hyderabad, India, 573–583.
[9] Andrea Arcuri and Lionel Briand. 2011. A Practical Guide for Using StatisticalTests to Assess Randomized Algorithms in Software Engineering. In 33𝑟𝑑 Inter-national Conference on Software Engineering (ICSE’11) (Waikiki, Honolulu, HI,USA). ACM, New York, NY, USA, 1–10.
[10] Andrea Arcuri and Lionel Briand. 2014. A Hitchhiker’s guide to statistical testsfor assessing randomized algorithms in software engineering. Software Testing,
ESEM ’21, October 11–15, 2021, Bari, Italy K. Bojarczuk, I. Dvortsova, J. George, N. Gucevska, M. Harman, M. Lomeli, S. Lucas, E. Meijer, R. Rojas, and S. Sapora
Verification and Reliability 24, 3 (2014), 219–250. https://doi.org/10.1002/stvr.1486arXiv:https://onlinelibrary.wiley.com/doi/pdf/10.1002/stvr.1486
[11] Alberto Bacchelli and Christian Bird. 2013. Expectations, outcomes, and chal-lenges of modern code review. In 2013 35th International Conference on SoftwareEngineering (ICSE). IEEE, 712–721.
[12] Earl T. Barr, Mark Harman, Yue Jia, Alexandru Marginean, and Justyna Petke.2015. Automated software transplantation. In Proceedings of the 2015 InternationalSymposium on Software Testing and Analysis, ISSTA 2015, Baltimore, MD, USA,July 12-17, 2015. 257–269.
[13] Earl T. Barr, Mark Harman, Phil McMinn, Muzammil Shahbaz, and Shin Yoo.2015. The Oracle Problem in Software Testing: A Survey. IEEE Transactions onSoftware Engineering 41, 5 (May 2015), 507–525.
[14] Karsten M. Borgwardt, Arthur Gretton, Malte J. Rasch, Hans-PeterKriegel, Bernhard Schölkopf, and Alex J. Smola. 2006. Integratingstructured biological data by Kernel Maximum Mean Discrepancy.Bioinformatics 22, 14 (07 2006), e49–e57. https://doi.org/10.1093/bioinformatics/btl242 arXiv:https://academic.oup.com/bioinformatics/article-pdf/22/14/e49/616383/btl242.pdf
[15] David Bowes, Tracy Hall, Mark Harman, Yue Jia, Federica Sarro, and Fan Wu.2016. Mutation-Aware Fault Prediction. In International Symposium on SoftwareTesting and Analysis (ISSTA 2016). 330–341.
[16] Haiyan Cai, Bryan Goggin, and Qingtang Jiang. 2020. Two-sample test basedon classification probability. Statistical Analysis and Data Mining: The ASAData Science Journal 13, 1 (2020), 5–13. https://doi.org/10.1002/sam.11438arXiv:https://onlinelibrary.wiley.com/doi/pdf/10.1002/sam.11438
[17] Tsong Yueh Chen, Jianqiang Feng, and T. H. Tse. 2002. Metamorphic Testingof Programs on Partial Differential Equations: A Case Study. In 26𝑡ℎ AnnualInternational Computer Software and Applications Conference (COMPSAC’02).IEEE Computer Society, 327–333.
[18] Koen Claessen and John Hughes. 2000. QuickCheck: a lightweight tool forrandom testing of Haskell programs. In Proceedings of the fifth ACM SIGPLANinternational conference on Functional programming. 268–279.
[19] I. Csiszar. 1967. Information-type measures of difference of probability distribu-tions and indirect observation. Studia Scientiarum Mathematicarum Hungarica 2(1967), 229–318. https://ci.nii.ac.jp/naid/10028997448/en/
[20] Michael E. Fagan. 1976. Design and code inspections to reduce errors in codedevelopment. IBM Systems Journal 15, 3 (1976), 182–211.
[21] Dror G. Feitelson, Eitan Frachtenberg, and Kent L. Beck. 2013. Development andDeployment at Facebook. IEEE Internet Computing 17, 4 (2013), 8–17.
[22] Han Feng, Xing Qiu, and Hongyu Miao. 2021. Hypothesis Testing for Two SampleComparison of Network Data. arXiv:2106.13931 [stat.ME]
[23] StevenGoodman. 2008. A dirty dozen: twelve p-valuemisconceptions. In Seminarsin hematology, Vol. 45. Elsevier, 135–140.
[24] Claire Le Goues, Stephanie Forrest, and Westley Weimer. 2013. Current Chal-lenges in Automatic Software Repair. Software Quality Journal 21, 3 (2013),421–443.
[25] Tracy Hall, Sarah Beecham, David Bowes, David Gray, and Steve Counsell. 2012.A Systematic Literature Review on Fault Prediction Performance in SoftwareEngineering. IEEE Transactions on Software Engineering 38, 6 (2012), 1276–1304.
[26] Mark Harman, William B. Langdon, and Yue Jia. 2014. Babel Pidgin: SBSEcan grow and graft entirely new functionality into a real world system. In 6𝑡ℎSymposium on Search Based Software Engineering (SSBSE 2014). Springer LNCS,Fortaleza, Brazil, 247–252.
[27] Mark Harman, Phil McMinn, Jerffeson Teixeira de Souza, and Shin Yoo. 2012.Search Based Software Engineering: Techniques, Taxonomy, Tutorial. In Empiri-cal software engineering and verification: LASER 2009-2010, Bertrand Meyer andMartin Nordio (Eds.). Springer, 1–59. LNCS 7007.
[28] Mark Harman and Peter O’Hearn. 2018. From Start-ups to Scale-ups: Opportu-nities and Open Problems for Static and Dynamic Program Analysis (keynotepaper). In 18𝑡ℎ IEEE International Working Conference on Source Code Analysisand Manipulation (SCAM 2018). Madrid, Spain, 1–23.
[29] Yue Jia and Mark Harman. 2011. An Analysis and Survey of the Development ofMutation Testing. IEEE Transactions on Software Engineering 37, 5 (September–October 2011), 649 – 678.
[30] Gregory L Johnson, Clayton L Hanson, Stuart P Hardegree, and Edward B Ballard.1996. Stochastic weather simulation: Overview and analysis of two commonlyused models. Journal of Applied Meteorology 35, 10 (1996), 1878–1896.
[31] Ilmun Kim, Aaditya Ramdas, Aarti Singh, and Larry Wasserman. 2021. Classifi-cation accuracy as a proxy for two-sample testing. The Annals of Statistics 49, 1(2021), 411 – 434. https://doi.org/10.1214/20-AOS1962
[32] Ross D. King, Kenneth E. Whelan, Ffion M. Jones, Philip G. K. Reiser, Christo-pher H. Bryant, Douglas B. Kell Stephen H. Muggleton, and Stephen G. Oliver.2004. Functional genomic hypothesis generation and experimentation by a robotscientist. Nature (01 2004), 247–252.
[33] Ron Kohavi and Roger Longbotham. 2017. Online Controlled Experiments andA/B Testing. Encyclopedia of machine learning and data mining 7, 8 (2017),922–929.
[34] Zheng Li, Mark Harman, and Rob Hierons. 2007. Search Algorithms for Regres-sion Test Case Prioritization. IEEE Transactions on Software Engineering 33, 4(2007), 225–237.
[35] David Lopez-Paz and Maxime Oquab. 2017. Revisiting Classifier Two-SampleTests. In ICLR.
[36] Qingzhou Luo, Farah Hariri, Lamyaa Eloussi, and Darko Marinov. 2014. Anempirical analysis of flaky tests. In 22𝑛𝑑 International Symposium on Foundationsof Software Engineering (FSE 2014), Shing-Chi Cheung, Alessandro Orso, andMargaret-Anne Storey (Eds.). ACM, Hong Kong, China, 643–653.
[37] David J. C. MacKay. 2002. Information Theory, Inference and Learning Algorithms.Cambridge University Press, USA.
[38] Alexandru Marginean, Johannes Bader, Satish Chandra, Mark Harman, Yue Jia,Ke Mao, Alexander Mols, and Andrew Scott. 2019. SapFix: Automated End-to-End Repair at Scale. In International Conference on Software Engineering (ICSE)Software Engineering in Practice (SEIP) track. Montreal, Canada.
[39] Atif M. Memon and Myra B. Cohen. 2013. Automated testing of GUI applications:models, tools, and controlling flakiness. In 35𝑡ℎ International Conference onSoftware Engineering (ICSE 2013), David Notkin, Betty H. C. Cheng, and KlausPohl (Eds.). IEEE Computer Society, San Francisco, CA, USA, 1479–1480.
[40] Atif M. Memon, Zebao Gao, Bao N. Nguyen, Sanjeev Dhanda, Eric Nickell, RobSiemborski, and John Micco. 2017. Taming Google-Scale Continuous Testing. In39𝑡ℎ International Conference on Software Engineering, Software Engineering inPractice Track (ICSE-SEIP). IEEE, Buenos Aires, Argentina, 233–242.
[41] Alfred Müller. 1997. Integral Probability Metrics and Their Generating Classesof Functions. Advances in Applied Probability 29, 2 (1997), 429–443. http://www.jstor.org/stable/1428011
[42] Justyna Petke, Saemundur O. Haraldsson, Mark Harman, William B. Langdon,David R. White, and John R. Woodward. 2018. Genetic Improvement of Software:a Comprehensive Survey. IEEE Transactions on Evolutionary Computation 22, 3(June 2018), 415–432. https://doi.org/doi:10.1109/TEVC.2017.2693219
[43] Karl R. Popper. 1959. The logic of scientific discovery. London: Hutchinson andCo. (Publishers) 480 p. (1959)..
[44] Gregg Rothermel, Roland Untch, Chengyun Chu, and Mary Jean Harrold. 2001.Prioritizing Test Cases For Regression Testing. IEEE Transactions on SoftwareEngineering 27, 10 (Oct. 2001), 929–948.
[45] Caitlin Sadowski, Emma Söderberg, Luke Church, Michal Sipko, and AlbertoBacchelli. 2018. Modern code review: a case study at google. In Proceedings ofthe 40th International Conference on Software Engineering: Software Engineeringin Practice. 181–190.
[46] Dino Sejdinovic, Arthur Gretton, Bharath Sriperumbudur, and Kenji Fukumizu.2012. Hypothesis testing using pairwise distances and associated kernels (withAppendix). Proceedings of the 29th International Conference on Machine Learning,ICML 2012 2 (05 2012).
[47] Claude Elwood Shannon. 1948. A Mathematical Theory of Communication.Bell System Technical Journal 27 (July and October 1948), 379–423 and 623–656. http://cm.bell-labs.com/cm/ms/what/shannonday/paper.html,http://cm.bell-labs.com/cm/ms/what/shannonday/shannon1948.ps.gz,http://cm.bell-labs.com/cm/ms/what/shannonday/shannon1948.pdf,http://djvu.research.att.com/djvu/sci/shannon/index.html
[48] Christian Steinruecken, Emma Smith, David Janz, James Lloyd, and ZoubinGhahramani. 2019. The Automatic Statistician. Springer International Publishing,Cham, 161–173. https://doi.org/10.1007/978-3-030-05318-5_9
[49] Margaret-Anne D. Storey and Alexey Zagalsky. 2016. Disrupting developerproductivity one bot at a time. In Proceedings of the 24th International Symposiumon Foundations of Software Engineering (FSE 2016), Seattle, WA, USA, November13-18, 2016. ACM, 928–931.
[50] Sergio Terzi and Sergio Cavalieri. 2004. Simulation in the supply chain context:a survey. Computers in Industry 53, 1 (2004), 3–16.
[51] Simon Urli, Zhongxing Yu, Lionel Seinturier, and Martin Monperrus. 2018. Howto Design a Program Repair Bot? Insights from the Repairnator Project. In 40thInternational Conference on Software Engineering, Software Engineering in Practicetrack (ICSE 2018 SEIP track). 1–10.
[52] Jeffrey M. Voas and Keith W. Miller. 1995. Software Testability: The New Verifi-cation. IEEE Software 12, 3 (May 1995), 17–28.
[53] Oscar Wilde. 1895. The Importance of Being Earnest.[54] Aiko Yamashita and Leon Moonen. 2013. Do developers care about code smells?
An exploratory survey. In 2013 20th working conference on reverse engineering(WCRE). IEEE, 242–251.
[55] Shin Yoo andMarkHarman. 2012. Regression TestingMinimisation, Selection andPrioritisation: A Survey. Journal of Software Testing, Verification and Reliability22, 2 (2012), 67–120.
[56] Tong Yu and Hong Zhu. 2020. Hyper-Parameter Optimization: A Review ofAlgorithms and Applications. arXiv:2003.05689 [cs.LG]
[57] Tianyi Zhang andMiryung Kim. 2017. Automated transplantation and differentialtesting for clones. In 2017 IEEE/ACM 39th International Conference on SoftwareEngineering (ICSE). IEEE, 665–676.