Embed Size (px)
Citation preview
A Proposal For Predictive Ad
Quality Measurement
ROI
Ad QualityMedia Weight
Sales Behavior
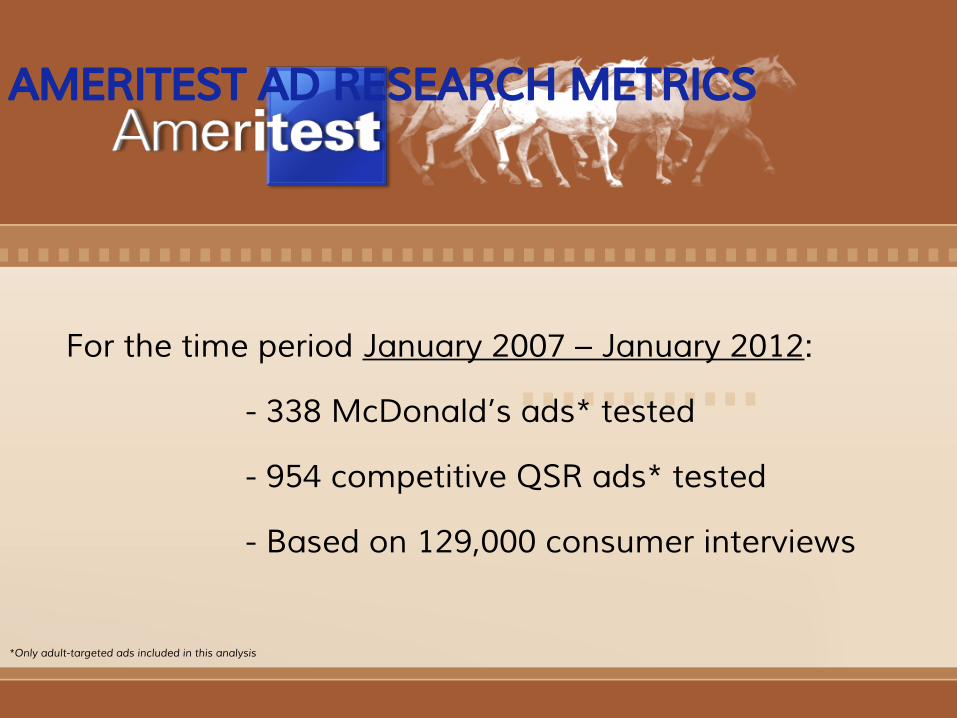
AMERITEST AD RESEARCH METRICS
For the time period January 2007 – January 2012:
- 338 McDonald’s ads* tested
- 954 competitive QSR ads* tested
- Based on 129,000 consumer interviews
*Only adult-targeted ads included in this analysis
*
●Three goals:
1.Predictability
2.Reasons why
3.Generalized learning
AD QUALITY MEASUREMENT
*
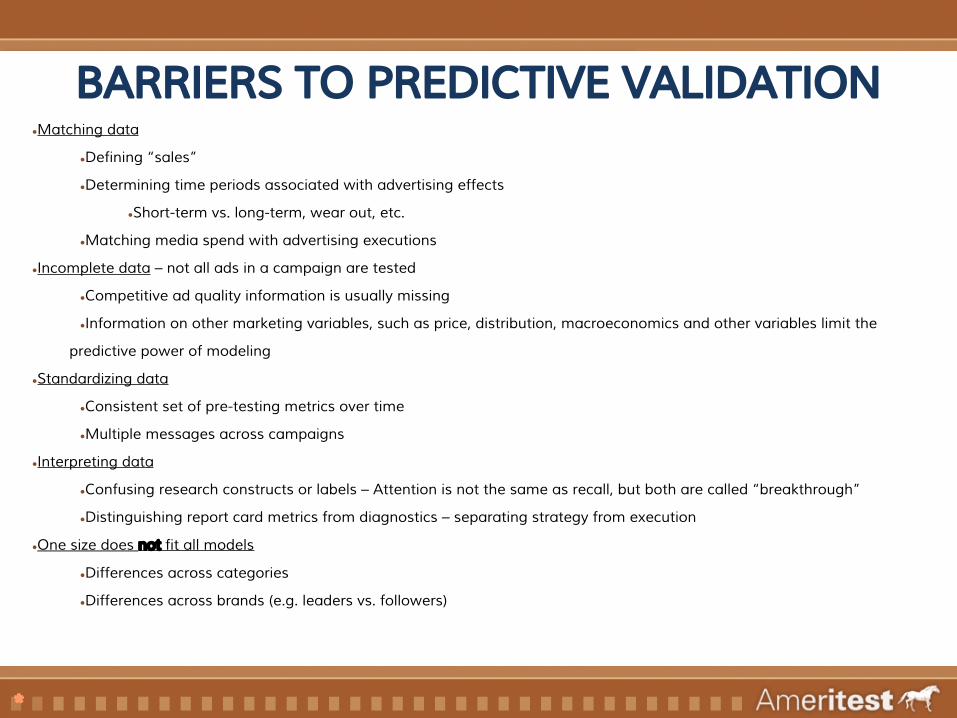
●Matching data
●Defining “sales”
●Determining time periods associated with advertising effects
●Short-term vs. long-term, wear out, etc.
●Matching media spend with advertising executions
●Incomplete data – not all ads in a campaign are tested
●Competitive ad quality information is usually missing
●Information on other marketing variables, such as price, distribution, macroeconomics and other variables limit the
predictive power of modeling
●Standardizing data
●Consistent set of pre-testing metrics over time
●Multiple messages across campaigns
●Interpreting data
●Confusing research constructs or labels – Attention is not the same as recall, but both are called “breakthrough”
●Distinguishing report card metrics from diagnostics – separating strategy from execution
●One size does not fit all models
●Differences across categories
●Differences across brands (e.g. leaders vs. followers)
BARRIERS TO PREDICTIVE VALIDATION
*
1) Predictability
*
CASE HISTORY
Can we build a model
linking ad quality metrics
to the actual sales
McDonald’s reports to
Wall Street?
*
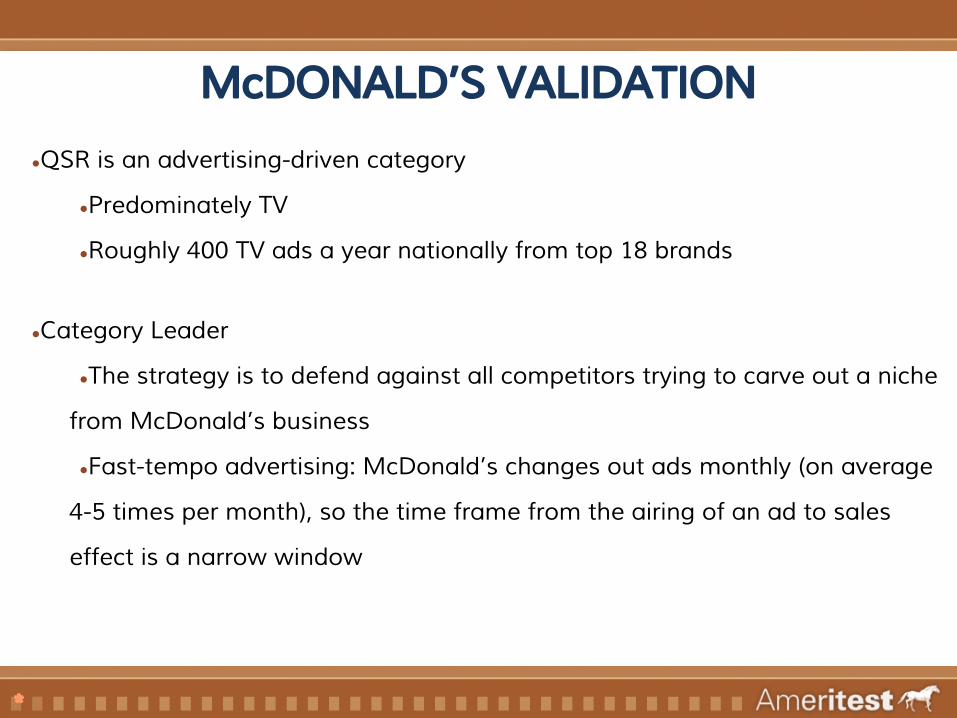
●QSR is an advertising-driven category
●Predominately TV
●Roughly 400 TV ads a year nationally from top 18 brands
●Category Leader
●The strategy is to defend against all competitors trying to carve out a niche
from McDonald’s business
●Fast-tempo advertising: McDonald’s changes out ads monthly (on average
4-5 times per month), so the time frame from the airing of an ad to sales
effect is a narrow window
McDONALD’S VALIDATION
*
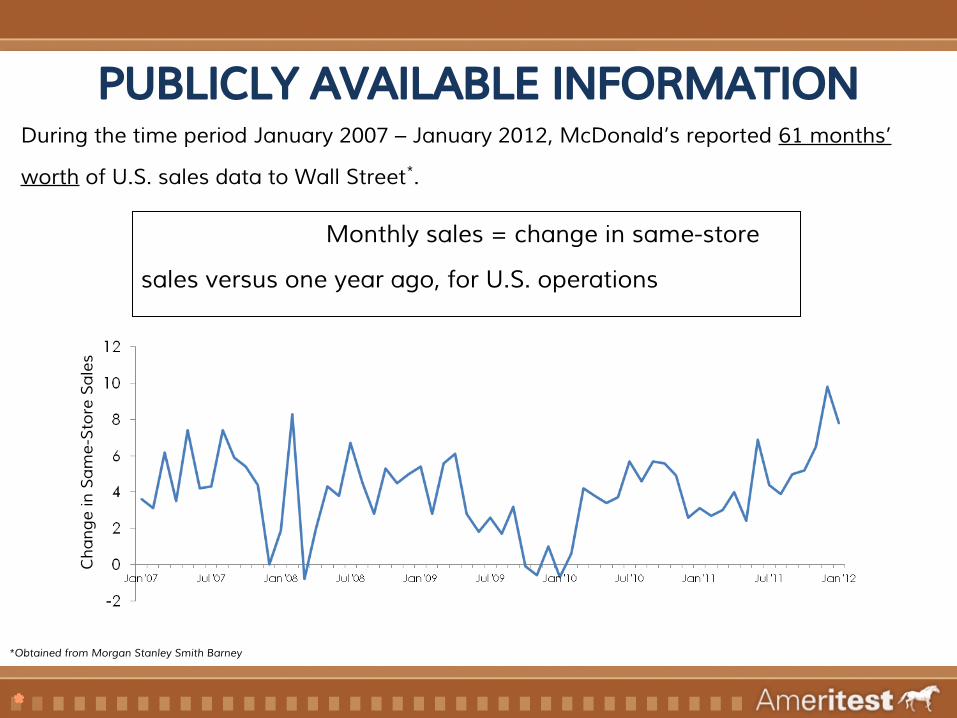
During the time period January 2007 – January 2012, McDonald’s reported 61 months’
worth of U.S. sales data to Wall Street*.
PUBLICLY AVAILABLE INFORMATION
Monthly sales = change in same-store
sales versus one year ago, for U.S. operations
Cha
nge
in S
ame-
Stor
e Sa
les
*Obtained from Morgan Stanley Smith Barney
*
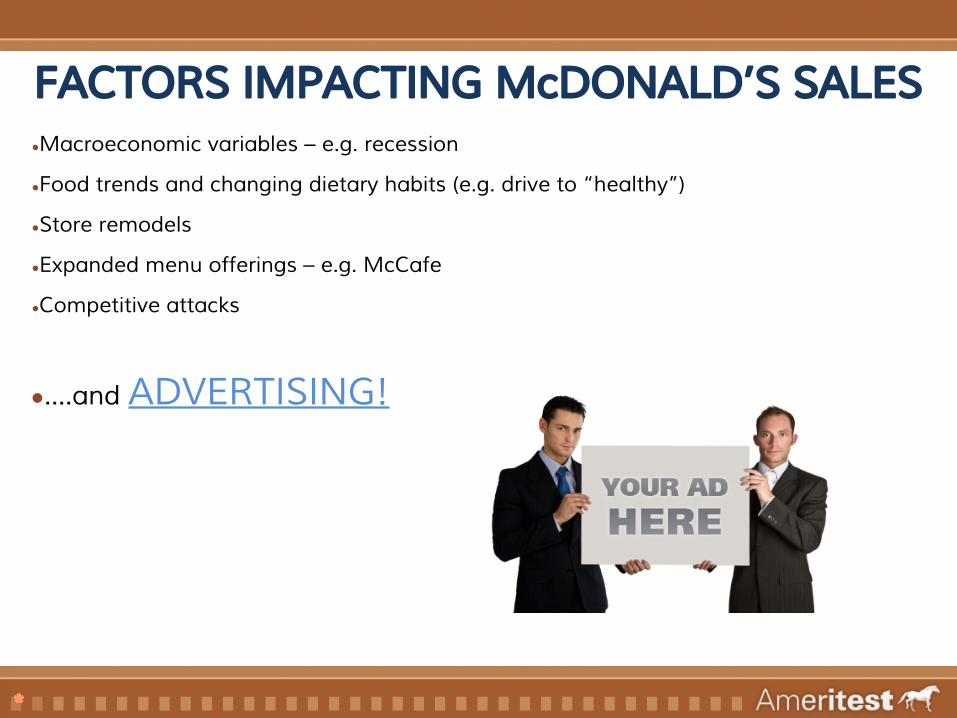
●Macroeconomic variables – e.g. recession
●Food trends and changing dietary habits (e.g. drive to “healthy”)
●Store remodels
●Expanded menu offerings – e.g. McCafe
●Competitive attacks
●….and ADVERTISING!
FACTORS IMPACTING McDONALD’S SALES
*
"BATCH PROCESS" AD QUALITY RESEARCH
CompetiView Portal
AdStandings™ Email
Meta-Analysis Reports
*
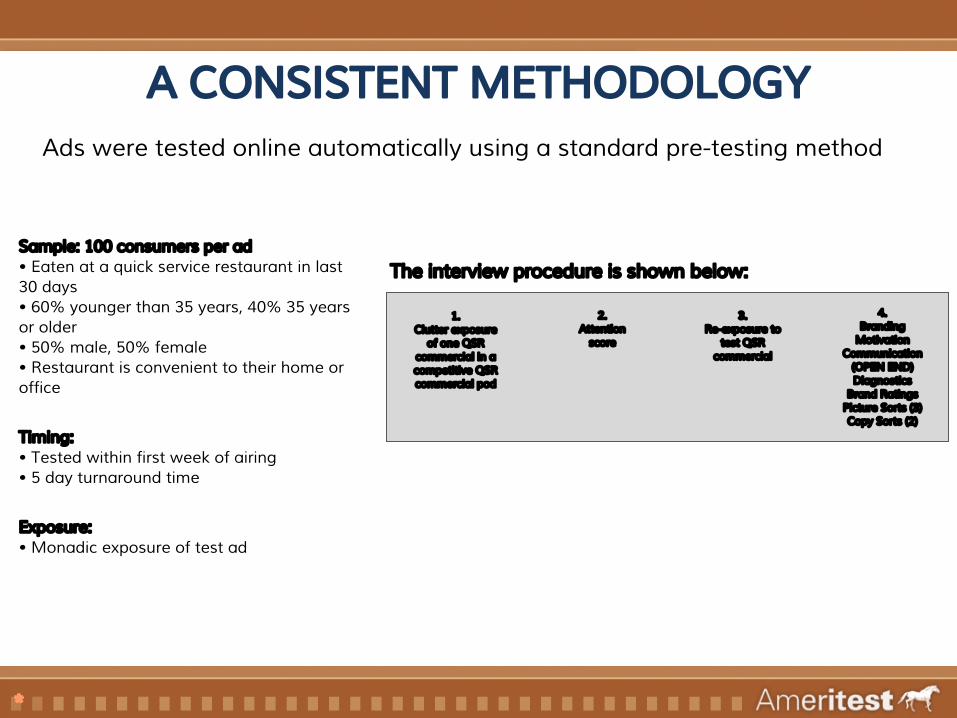
A CONSISTENT METHODOLOGYAds were tested online automatically using a standard pre-testing method
Sample: 100 consumers per ad• Eaten at a quick service restaurant in last 30 days• 60% younger than 35 years, 40% 35 years or older• 50% male, 50% female• Restaurant is convenient to their home or office
Timing:• Tested within first week of airing• 5 day turnaround time
Exposure:• Monadic exposure of test ad
The interview procedure is shown below:
4.Branding
MotivationCommunication
(OPEN END)Diagnostics
Brand RatingsPicture Sorts (3)Copy Sorts (2)
2.Attention
score
1.Clutter exposure
of one QSR commercial in a competitive QSR commercial pod
3.Re-exposure to
test QSR commercial
*
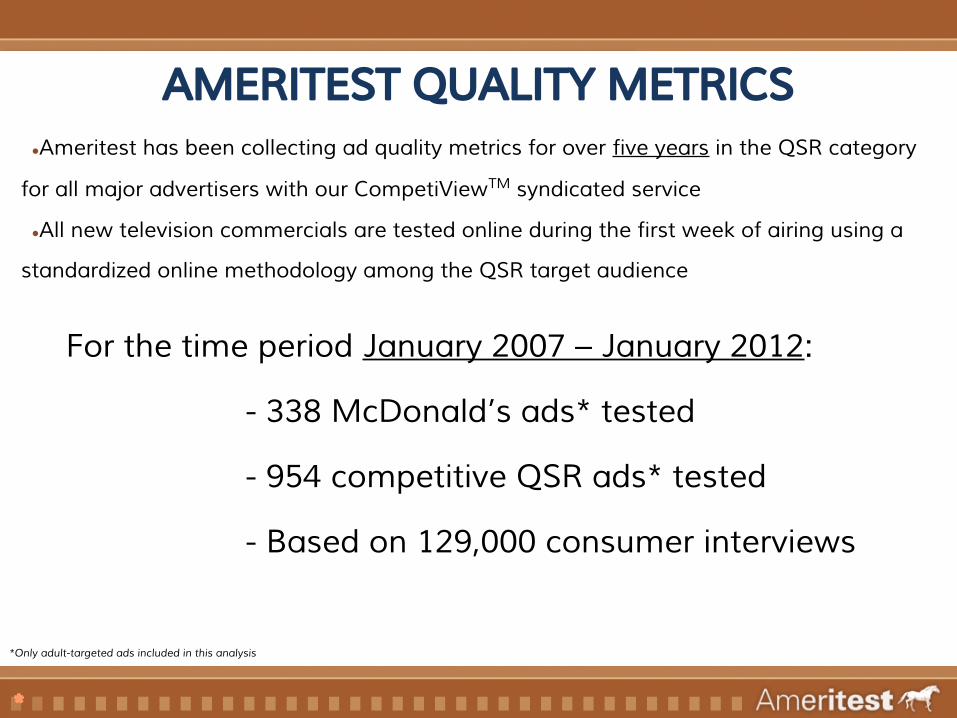
●Ameritest has been collecting ad quality metrics for over five years in the QSR category
for all major advertisers with our CompetiViewTM syndicated service
●All new television commercials are tested online during the first week of airing using a
standardized online methodology among the QSR target audience
AMERITEST QUALITY METRICS
For the time period January 2007 – January 2012:
- 338 McDonald’s ads* tested
- 954 competitive QSR ads* tested
- Based on 129,000 consumer interviews
*Only adult-targeted ads included in this analysis
*
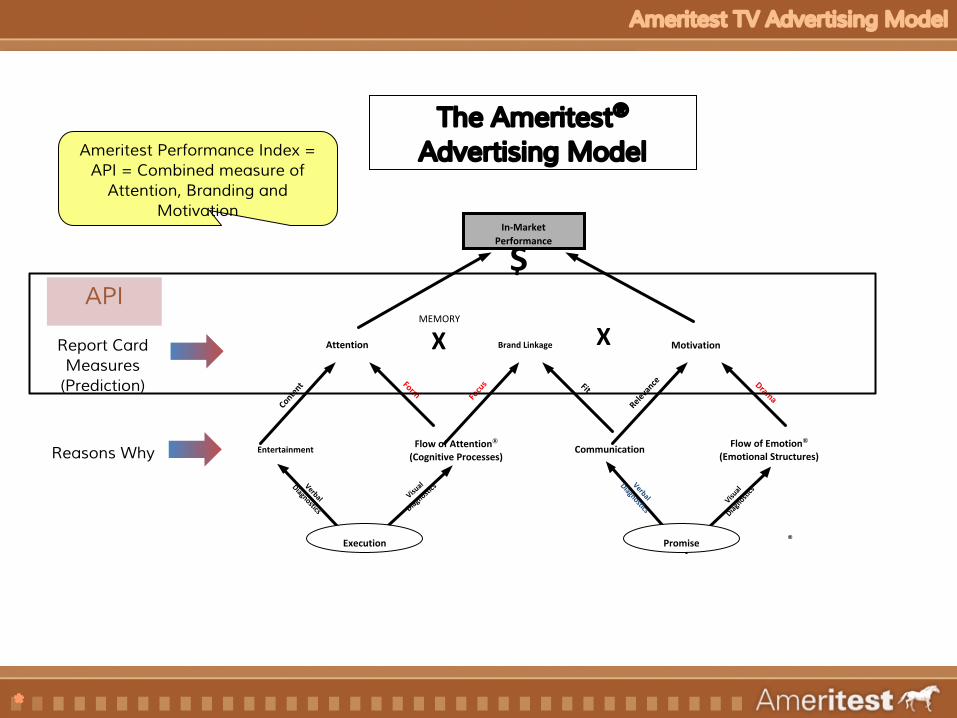
Ameritest TV Advertising Model
The Ameritest® Advertising Model
Report Card Measures
(Prediction)
Reasons Why
$
Brand Linkage MotivationAttention
In-MarketPerformance
Entertainment CommunicationFlow of Attention®
(Cognitive Processes)Flow of Emotion®
(Emotional Structures)
Execution Promise
X
Content
Releva
nceFitForm
X
Focu
s Drama
Visual
Diagn
ostics
Verbal
Diagnostics
Verbal
Diagnostics
Visual
Diagnostics
®
MEMORY
API
Ameritest Performance Index = API = Combined measure of
Attention, Branding and Motivation
*
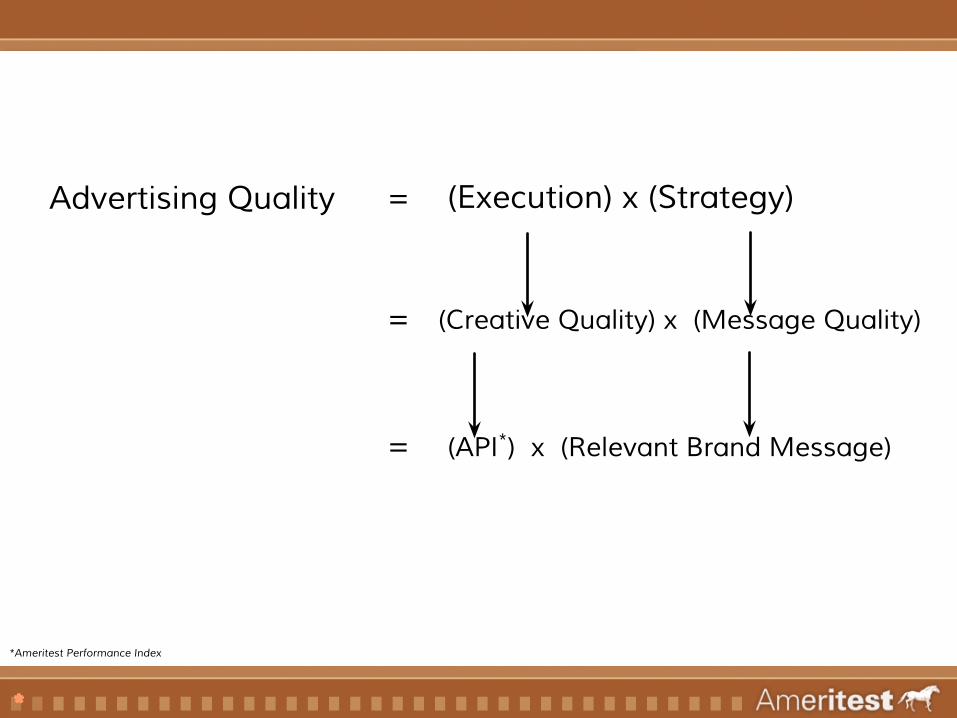
Advertising Quality = (Execution) x (Strategy)
= (Creative Quality) x (Message Quality)
= (API*) x (Relevant Brand Message)
*Ameritest Performance Index
*
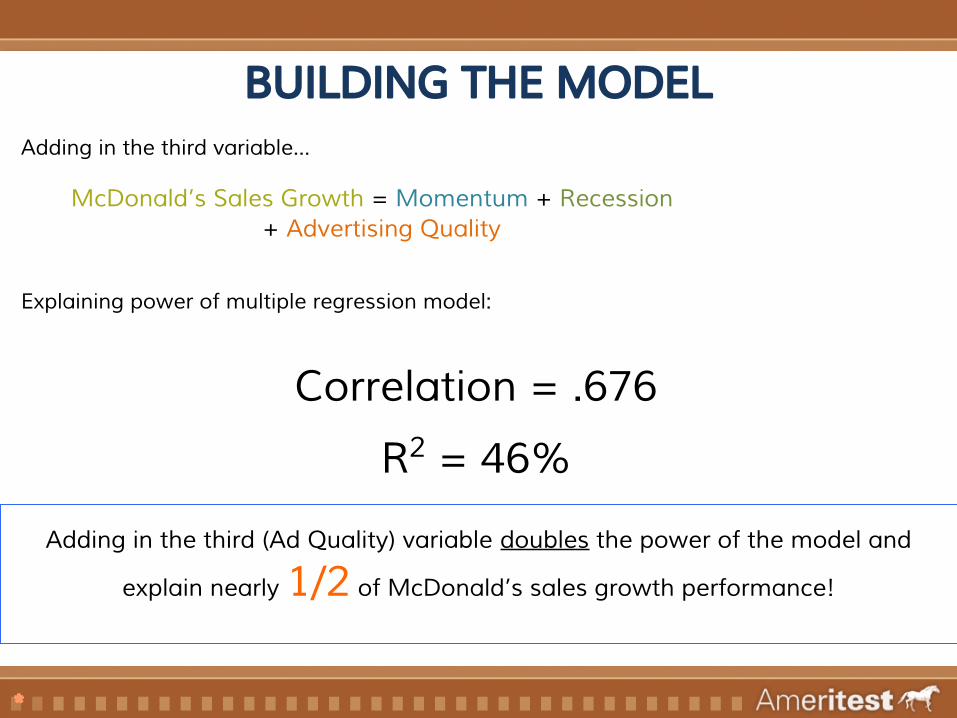
Adding in the third variable…
BUILDING THE MODEL
McDonald’s Sales Growth = Momentum + Recession + Advertising Quality
Explaining power of multiple regression model:
Correlation = .676
R2 = 46%
Adding in the third (Ad Quality) variable doubles the power of the model and
explain nearly 1/2 of McDonald’s sales growth performance!
*
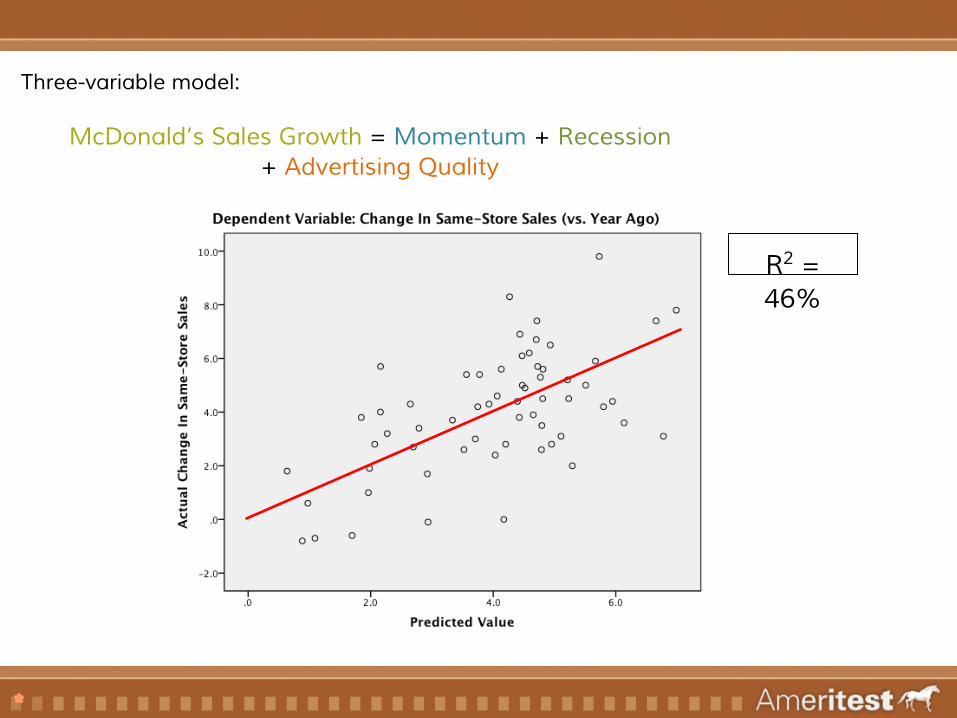
Three-variable model:
McDonald’s Sales Growth = Momentum + Recession + Advertising Quality
R2 = 46%
*
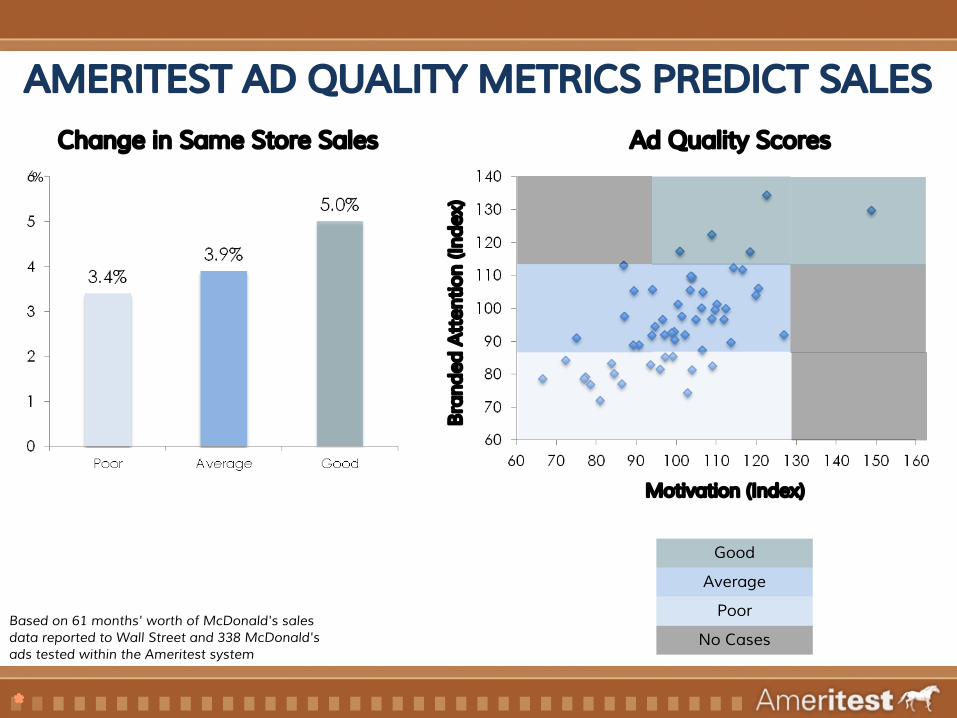
Change in Same Store Sales%
Ad Quality Scores
Motivation (Index)
Bra
nded
Att
entio
n (In
dex)
Good
Average
Poor
No CasesBased on 61 months' worth of McDonald's sales data reported to Wall Street and 338 McDonald's ads tested within the Ameritest system
AMERITEST AD QUALITY METRICS PREDICT SALES
*
■Even without looking at media spend levels, our data
validates the conclusion that the quality of the advertising
that McDonald’s puts on air is a major driver of sales growth
– explaining ¼ of in-market performance by itself.
■Since growth in same-store sales is a major factor
driving McDonald’s stock prices, this data confirms that
television advertising has been a good investment for
McDonald’s over the past five years.
CONCLUSIONS

*
2) Reasons Why

*
Executional quality is a variable that
hides within itself a complex set of
other variables.
*
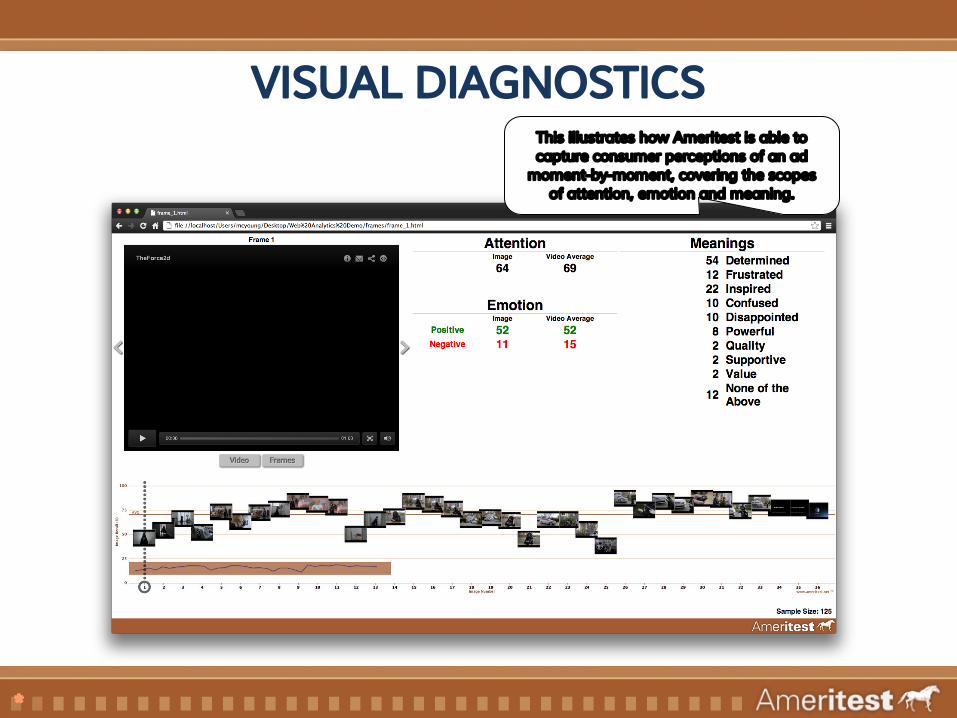
VISUAL DIAGNOSTICSThis illustrates how Ameritest is able to capture consumer perceptions of an ad
moment-by-moment, covering the scopes of attention, emotion and meaning.
*
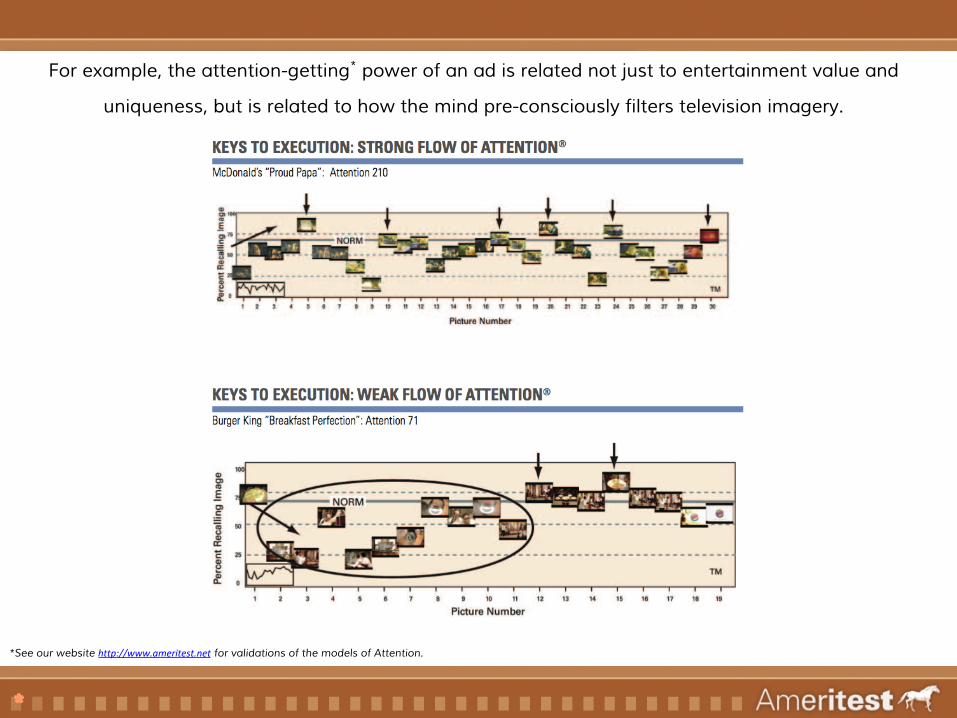
For example, the attention-getting* power of an ad is related not just to entertainment value and
uniqueness, but is related to how the mind pre-consciously filters television imagery.
*See our website http://www.ameritest.net for validations of the models of Attention.
*
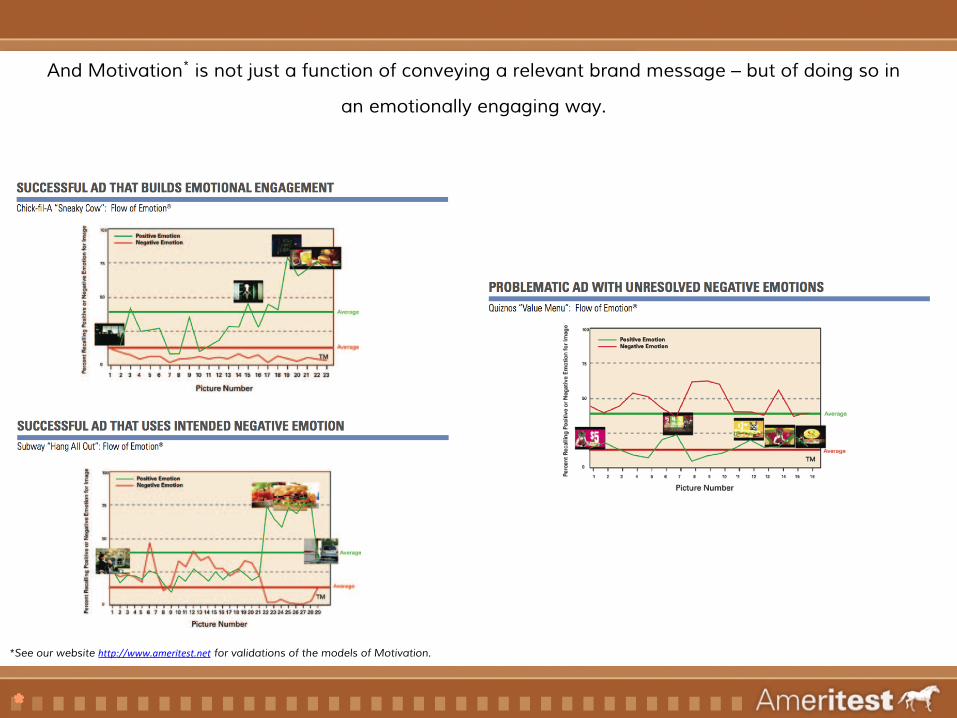
And Motivation* is not just a function of conveying a relevant brand message – but of doing so in
an emotionally engaging way.
*See our website http://www.ameritest.net for validations of the models of Motivation.
*
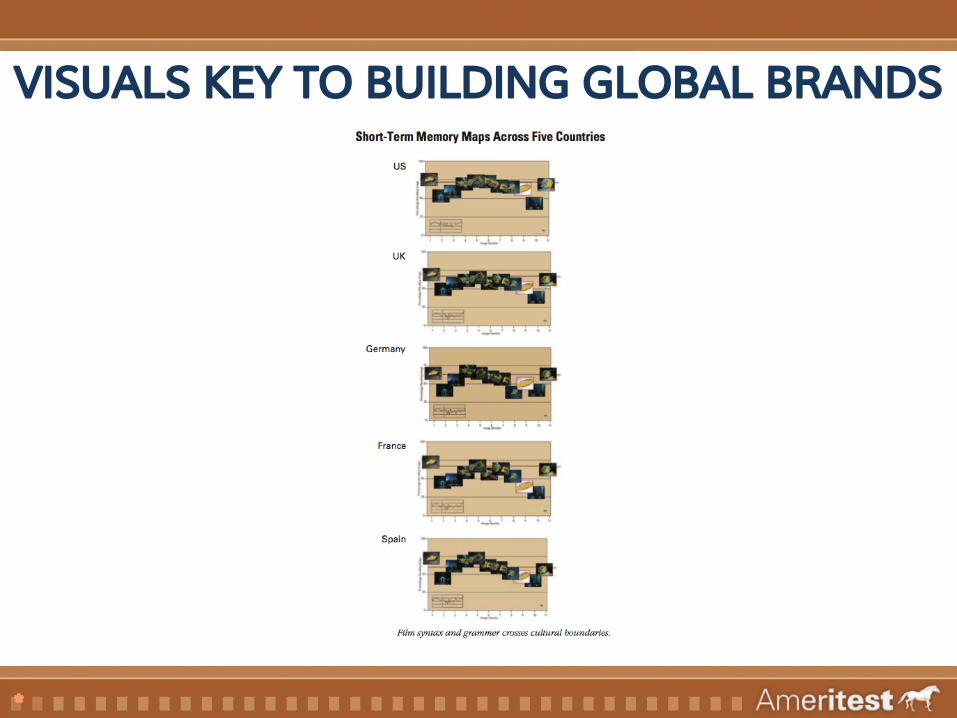
VISUALS KEY TO BUILDING GLOBAL BRANDS

*
3) Generalized Learnings
*
Not all messages are
created equal.
*
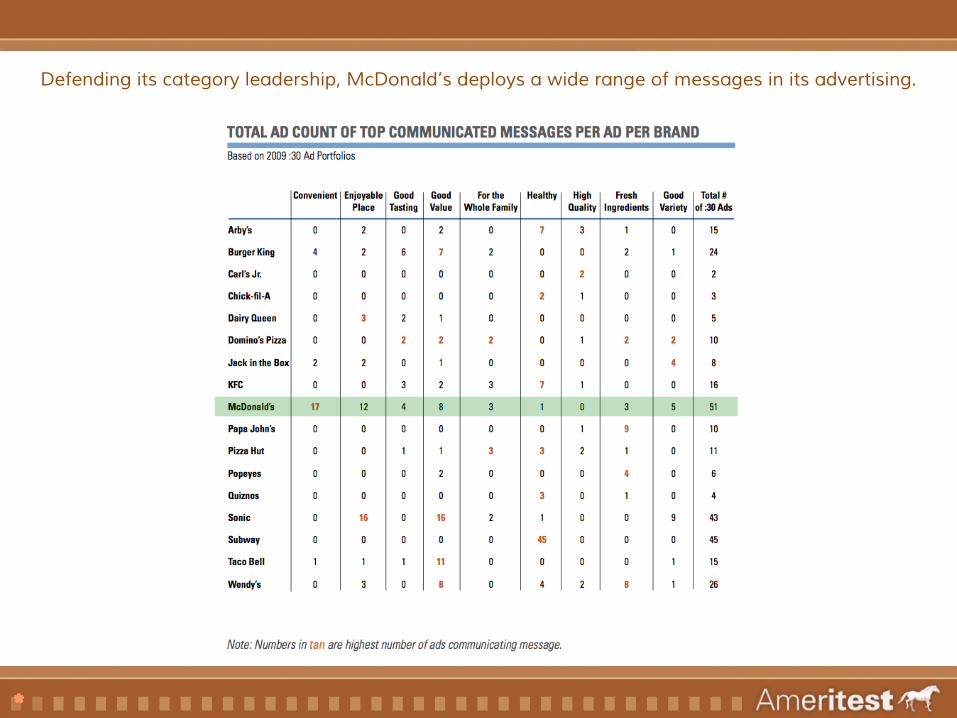
Defending its category leadership, McDonald’s deploys a wide range of messages in its advertising.
*
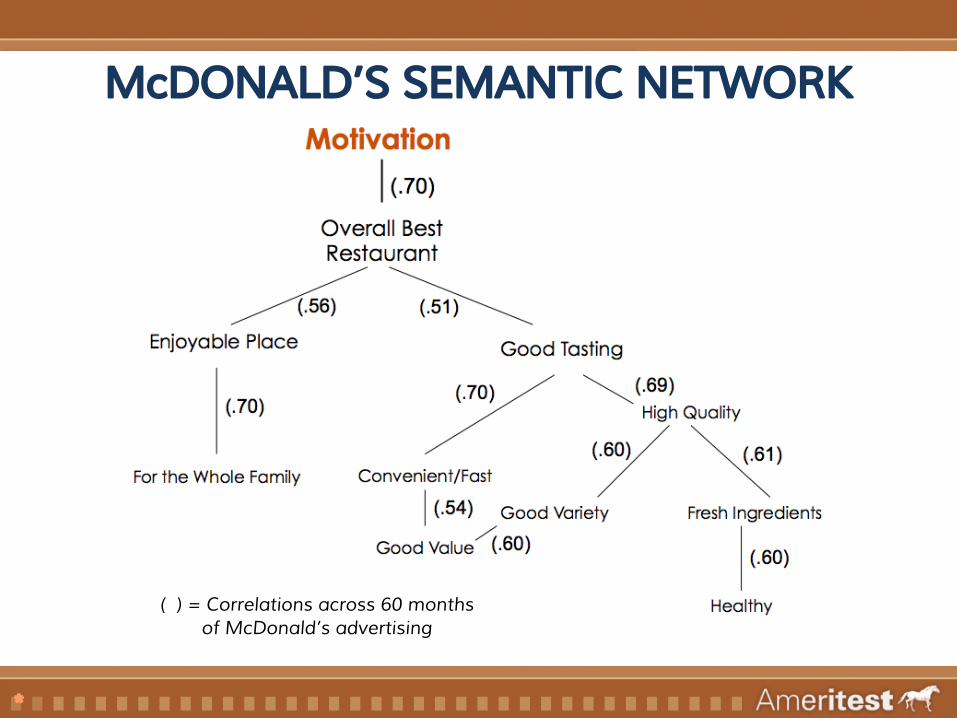
McDONALD’S SEMANTIC NETWORK
( ) = Correlations across 60 months of McDonald’s advertising
*
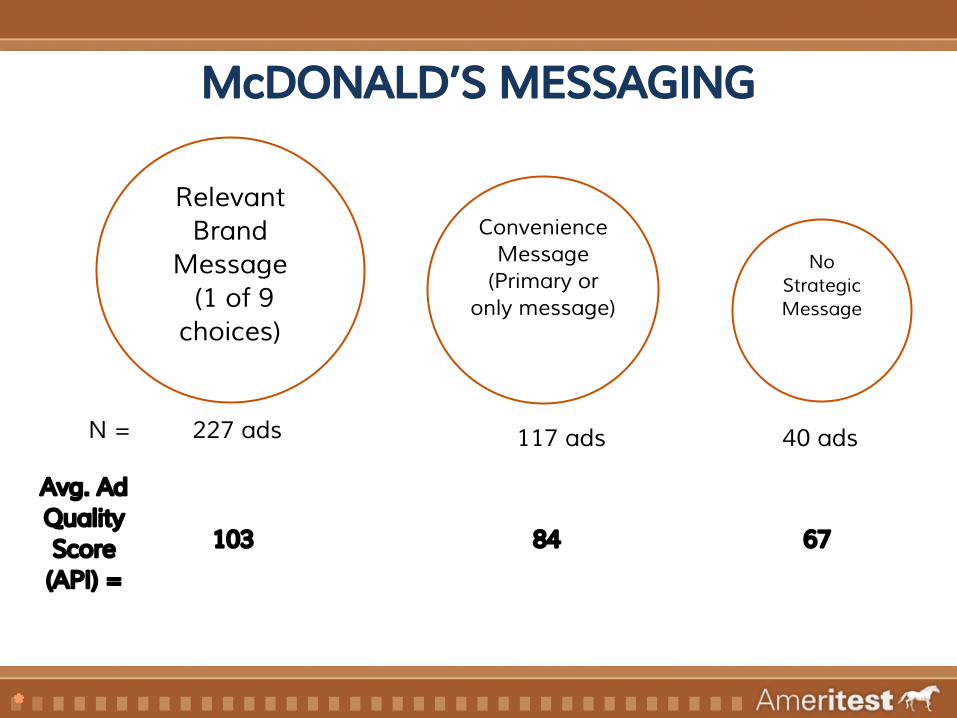
RelevantBrand
Message (1 of 9 choices)
ConvenienceMessage
(Primary or only message)
No Strategic Message
N = 227 ads 117 ads 40 ads
Avg. Ad Quality Score (API) =
103 84 67
McDONALD’S MESSAGING
*
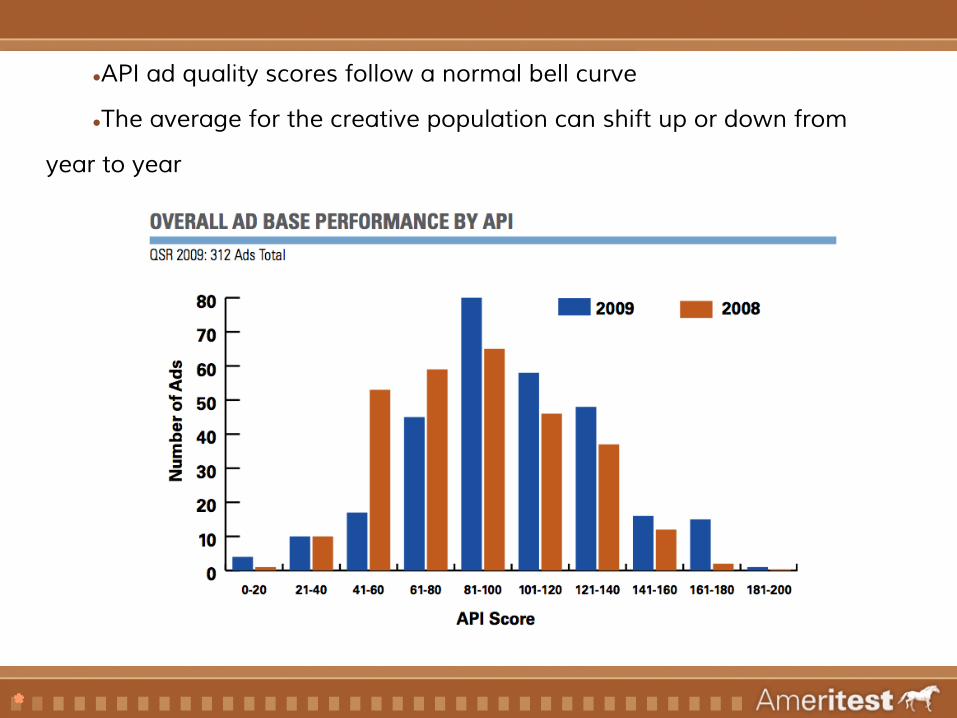
●API ad quality scores follow a normal bell curve
●The average for the creative population can shift up or down from
year to year
*
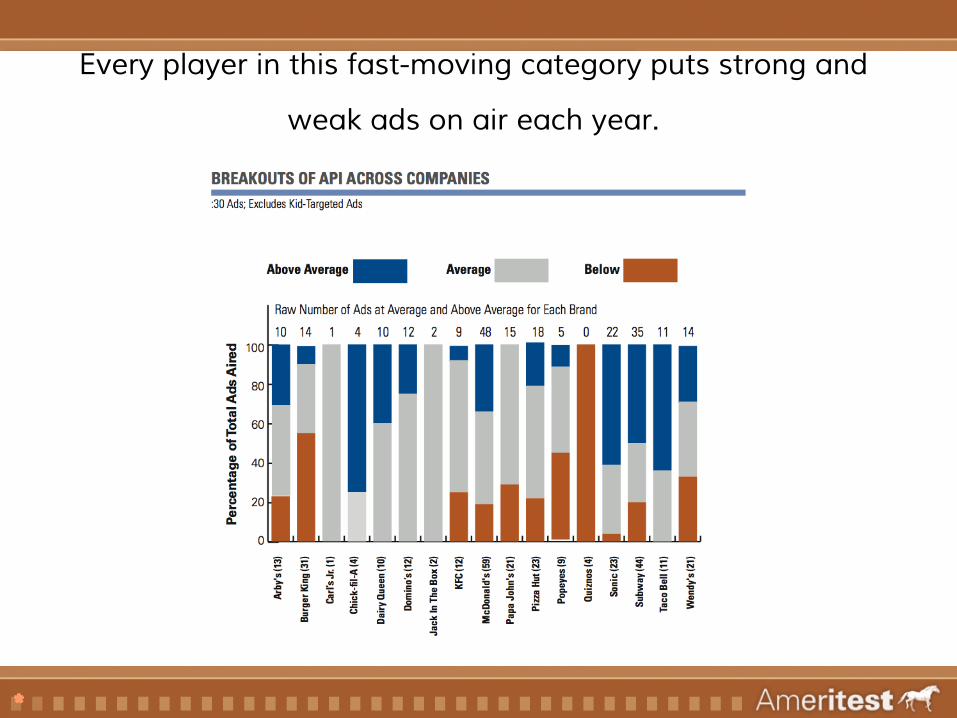
Every player in this fast-moving category puts strong and
weak ads on air each year.
*
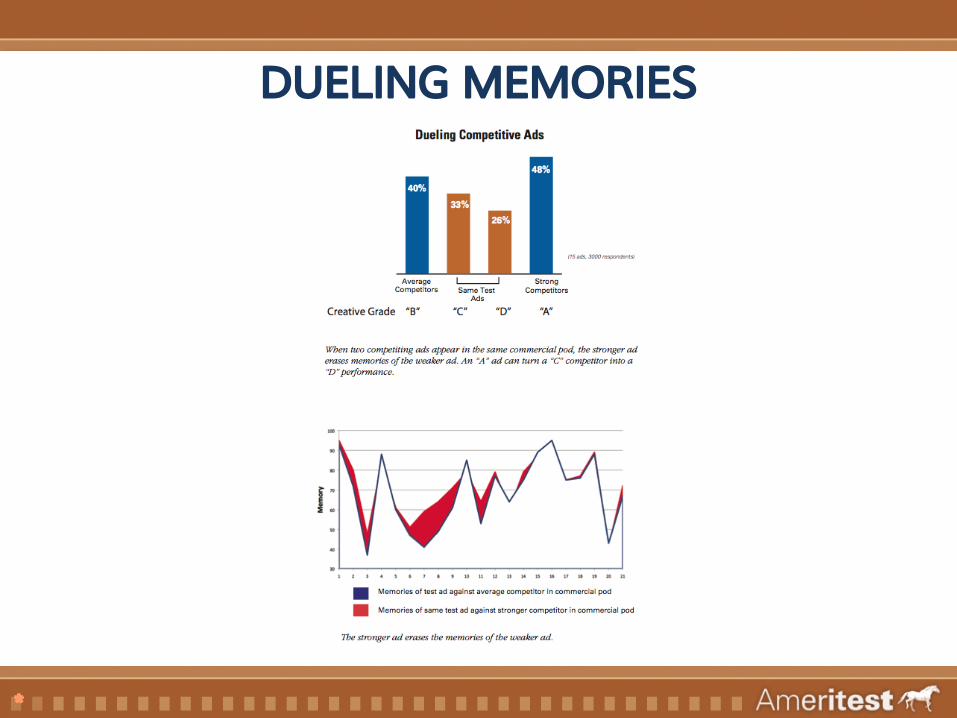
DUELING MEMORIES
*
www.ameritest.net
(505) 856-0763
Contact: Chuck [email protected]
Ameritest® is a seven-time winner of the David Ogilvy Award for research excellence, including the Grand Ogilvy Award for our work with IBM.
We’ve thought a lot about how advertising works. To see some of the dozens of articles we’ve published, visit:www.ameritest.net/resources