Embed Size (px)
Citation preview

Abilene Christian University Abilene Christian University
Digital Commons @ ACU Digital Commons @ ACU
Engineering and Physics College of Arts and Sciences
5-13-2019
Measurement of charm and bottom production from semileptonic Measurement of charm and bottom production from semileptonic
hadron decays in p + p collisions at √ s = 200 GeV hadron decays in p + p collisions at s = 200 GeV
Mike Daugherity Abilene Christian University, [email protected]
Donald Isenhower Abilene Christian University, [email protected]
Rusty Towell Abilene Christian University, [email protected]
Follow this and additional works at: https://digitalcommons.acu.edu/engineer_physics
Recommended Citation Recommended Citation Daugherity, Mike; Isenhower, Donald; and Towell, Rusty, "Measurement of charm and bottom production from semileptonic hadron decays in p + p collisions at √ s = 200 GeV" (2019). Engineering and Physics. 16. https://digitalcommons.acu.edu/engineer_physics/16
This Article is brought to you for free and open access by the College of Arts and Sciences at Digital Commons @ ACU. It has been accepted for inclusion in Engineering and Physics by an authorized administrator of Digital Commons @ ACU.
Measurement of charm and bottom production from semileptonic hadrondecays in p+ p collisions at
ffiffis
p= 200 GeV
C. Aidala,40 Y. Akiba,52,53,* M. Alfred,23 V. Andrieux,40 N. Apadula,28 H. Asano,33,52 B. Azmoun,7 V. Babintsev,24
N. S. Bandara,39 K. N. Barish,8 S. Bathe,5,53 A. Bazilevsky,7 M. Beaumier,8 R. Belmont,12,46 A. Berdnikov,55
Y. Berdnikov,55 D. S. Blau,32,43 J. S. Bok,45 M. L. Brooks,35 J. Bryslawskyj,5,8 V. Bumazhnov,24 S. Campbell,13
V. Canoa Roman,58 R. Cervantes,58 C. Y. Chi,13 M. Chiu,7 I. J. Choi,25 J. B. Choi,10,† Z. Citron,63 M. Connors,21,53
N. Cronin,58 M. Csanád,16 T. Csörgő,17,64 T. W. Danley,47 M. S. Daugherity,1 G. David,7,15,58 K. DeBlasio,44 K. Dehmelt,58
A. Denisov,24 A. Deshpande,7,53,58 E. J. Desmond,7 A. Dion,58 D. Dixit,58 J. H. Do,65 A. Drees,58 K. A. Drees,6
J. M. Durham,35 A. Durum,24 A. Enokizono,52,54 H. En’yo,52 S. Esumi,61 B. Fadem,41 W. Fan,58 N. Feege,58 D. E. Fields,44
M. Finger,9 M. Finger, Jr.,9 S. L. Fokin,32 J. E. Frantz,47 A. Franz,7 A. D. Frawley,20 Y. Fukuda,61 C. Gal,58 P. Gallus,14
E. A. Gamez,40 P. Garg,3,58 H. Ge,58 F. Giordano,25 Y. Goto,52,53 N. Grau,2 S. V. Greene,62 M. Grosse Perdekamp,25
T. Gunji,11 H. Guragain,21 T. Hachiya,42,52,53 J. S. Haggerty,7 K. I. Hahn,18 H. Hamagaki,11 H. F. Hamilton,1 S. Y. Han,18,52
J. Hanks,58 S. Hasegawa,29 T. O. S. Haseler,21 X. He,21 T. K. Hemmick,58 J. C. Hill,28 K. Hill,12 A. Hodges,21 R. S. Hollis,8
K. Homma,22 B. Hong,31 T. Hoshino,22 N. Hotvedt,28 J. Huang,7 S. Huang,62 K. Imai,29 M. Inaba,61 A. Iordanova,8
D. Isenhower,1 S. Ishimaru,42 D. Ivanishchev,51 B. V. Jacak,58 M. Jezghani,21 Z. Ji,58 X. Jiang,35 B. M. Johnson,7,21
D. Jouan,49 D. S. Jumper,25 J. H. Kang,65 D. Kapukchyan,8 S. Karthas,58 D. Kawall,39 A. V. Kazantsev,32 V. Khachatryan,58
A. Khanzadeev,51 C. Kim,8,31 E.-J. Kim,10 M. Kim,52,56 D. Kincses,16 E. Kistenev,7 J. Klatsky,20 P. Kline,58 T. Koblesky,12
D. Kotov,51,55 S. Kudo,61 B. Kurgyis,16 K. Kurita,54 Y. Kwon,65 J. G. Lajoie,28 A. Lebedev,28 S. Lee,65 S. H. Lee,28,58
M. J. Leitch,35 Y. H. Leung,58 N. A. Lewis,40 X. Li,35 S. H. Lim,35,65 M. X. Liu,35 V.-R. Loggins,25 S. Lökös,16,17
K. Lovasz,15 D. Lynch,7 T. Majoros,15 Y. I. Makdisi,6 M. Makek,66 V. I. Manko,32 E. Mannel,7 M. McCumber,35
P. L. McGaughey,35 D. McGlinchey,12,35 C. McKinney,25 M. Mendoza,8 W. J. Metzger,17 A. C. Mignerey,38 A. Milov,63
D. K. Mishra,4 J. T. Mitchell,7 Iu. Mitrankov,55 G. Mitsuka,30,52,53 S. Miyasaka,52,60 S. Mizuno,52,61 P. Montuenga,25
T. Moon,65 D. P. Morrison,7 S. I. Morrow,62 T. Murakami,33,52 J. Murata,52,54 K. Nagai,60 K. Nagashima,22,52
T. Nagashima,54 J. L. Nagle,12 M. I. Nagy,16 I. Nakagawa,52,53 K. Nakano,52,60 C. Nattrass,59 S. Nelson,19 T. Niida,61
R. Nishitani,42 R. Nouicer,7,53 T. Novák,17,64 N. Novitzky,58 A. S. Nyanin,32 E. O’Brien,7 C. A. Ogilvie,28
J. D. Orjuela Koop,12 J. D. Osborn,40 A. Oskarsson,36 G. J. Ottino,44 K. Ozawa,30,61 V. Pantuev,26 V. Papavassiliou,45
J. S. Park,56 S. Park,52,56,58 S. F. Pate,45 M. Patel,28 W. Peng,62 D. V. Perepelitsa,7,12 G. D. N. Perera,45 D. Yu. Peressounko,32
C. E. PerezLara,58 J. Perry,28 R. Petti,7 M. Phipps,7,25 C. Pinkenburg,7 R. P. Pisani,7 A. Pun,47 M. L. Purschke,7
P. V. Radzevich,55 K. F. Read,48,59 D. Reynolds,57 V. Riabov,43,51 Y. Riabov,51,55 D. Richford,5 T. Rinn,28 S. D. Rolnick,8
M. Rosati,28 Z. Rowan,5 J. Runchey,28 A. S. Safonov,55 T. Sakaguchi,7 H. Sako,29 V. Samsonov,43,51 M. Sarsour,21 S. Sato,29
C. Y. Scarlett,19 B. Schaefer,62 B. K. Schmoll,59 K. Sedgwick,8 R. Seidl,52,53 A. Sen,28,59 R. Seto,8 A. Sexton,38 D. Sharma,58
I. Shein,24 T.-A. Shibata,52,60 K. Shigaki,22 M. Shimomura,28,42 T. Shioya,61 P. Shukla,4 A. Sickles,25 C. L. Silva,35
D. Silvermyr,36 B. K. Singh,3 C. P. Singh,3 V. Singh,3 M. J. Skoby,40 M. Slunečka,9 K. L. Smith,20 M. Snowball,35
R. A. Soltz,34 W. E. Sondheim,35 S. P. Sorensen,59 I. V. Sourikova,7 P. W. Stankus,48 S. P. Stoll,7 T. Sugitate,22
A. Sukhanov,7 T. Sumita,52 J. Sun,58 Z. Sun,15 S. Suzuki,42 J. Sziklai,64 K. Tanida,29,53,56 M. J. Tannenbaum,7
S. Tarafdar,62,63 A. Taranenko,43 G. Tarnai,15 R. Tieulent,21,37 A. Timilsina,28 T. Todoroki,53,61 M. Tomášek,14 C. L. Towell,1
R. S. Towell,1 I. Tserruya,63 Y. Ueda,22 B. Ujvari,15 H.W. van Hecke,35 J. Velkovska,62 M. Virius,14 V. Vrba,14,27
N. Vukman,66 X. R. Wang,45,53 Z. Wang,5 Y. S. Watanabe,11 C. P. Wong,21 C. L. Woody,7 C. Xu,45 Q. Xu,62 L. Xue,21
S. Yalcin,58 Y. L. Yamaguchi,53,58 H. Yamamoto,61 A. Yanovich,24 J. H. Yoo,31,53 I. Yoon,56 H. Yu,45,50 I. E. Yushmanov,32
W. A. Zajc,13 A. Zelenski,6 Y. Zhai,28 S. Zharko,55 and L. Zou8
(PHENIX Collaboration)
1Abilene Christian University, Abilene, Texas 79699, USA2Department of Physics, Augustana University, Sioux Falls, South Dakota 57197, USA
3Department of Physics, Banaras Hindu University, Varanasi 221005, India4Bhabha Atomic Research Centre, Bombay 400 085, India
5Baruch College, City University of New York, New York, New York, 10010 USA6Collider-Accelerator Department, Brookhaven National Laboratory, Upton, New York 11973-5000, USA
7Physics Department, Brookhaven National Laboratory, Upton, New York 11973-5000, USA8University of California-Riverside, Riverside, California 92521, USA
9Charles University, Ovocný trh 5, Praha 1, 116 36, Prague, Czech Republic10Chonbuk National University, Jeonju, 561-756, Korea
PHYSICAL REVIEW D 99, 092003 (2019)
2470-0010=2019=99(9)=092003(21) 092003-1 Published by the American Physical Society

11Center for Nuclear Study, Graduate School of Science, University of Tokyo,7-3-1 Hongo, Bunkyo, Tokyo 113-0033, Japan
12University of Colorado, Boulder, Colorado 80309, USA13Columbia University, New York, New York 10027, USAand Nevis Laboratories, Irvington, New York 10533, USA
14Czech Technical University, Zikova 4, 166 36 Prague 6, Czech Republic15Debrecen University, H-4010 Debrecen, Egyetem ter 1, Hungary
16ELTE, Eötvös Loránd University, H-1117 Budapest, Pázmány P. s. 1/A, Hungary17Eszterházy Károly University, Károly Róbert Campus, H-3200 Gyöngyös, Mátrai út 36, Hungary
18Ewha Womans University, Seoul 120-750, Korea19Florida A&M University, Tallahassee, Florida 32307, USA20Florida State University, Tallahassee, Florida 32306, USA21Georgia State University, Atlanta, Georgia 30303, USA
22Hiroshima University, Kagamiyama, Higashi-Hiroshima 739-8526, Japan23Department of Physics and Astronomy, Howard University, Washington, D.C. 20059, USA
24IHEP Protvino, State Research Center of Russian Federation, Institute for High Energy Physics,Protvino, 142281, Russia
25University of Illinois at Urbana-Champaign, Urbana, Illinois 61801, USA26Institute for Nuclear Research of the Russian Academy of Sciences,
prospekt 60-letiya Oktyabrya 7a, Moscow 117312, Russia27Institute of Physics, Academy of Sciences of the Czech Republic,
Na Slovance 2, 182 21 Prague 8, Czech Republic28Iowa State University, Ames, Iowa 50011, USA
29Advanced Science Research Center, Japan Atomic Energy Agency,2-4 Shirakata Shirane, Tokai-mura, Naka-gun, Ibaraki-ken 319-1195, Japan
30KEK, High Energy Accelerator Research Organization, Tsukuba, Ibaraki 305-0801, Japan31Korea University, Seoul, 02841
32National Research Center “Kurchatov Institute”, Moscow, 123098 Russia33Kyoto University, Kyoto 606-8502, Japan
34Lawrence Livermore National Laboratory, Livermore, California 94550, USA35Los Alamos National Laboratory, Los Alamos, New Mexico 87545, USA
36Department of Physics, Lund University, Box 118, SE-221 00 Lund, Sweden37IPNL, CNRS/IN2P3, Univ Lyon, Universit Lyon 1, F-69622, Villeurbanne, France
38University of Maryland, College Park, Maryland 20742, USA39Department of Physics, University of Massachusetts, Amherst, Massachusetts 01003-9337, USA
40Department of Physics, University of Michigan, Ann Arbor, Michigan 48109-1040, USA41Muhlenberg College, Allentown, Pennsylvania 18104-5586, USA
42Nara Women’s University, Kita-uoya Nishi-machi Nara 630-8506, Japan43National Research Nuclear University, MEPhI, Moscow Engineering Physics Institute,
Moscow, 115409, Russia44University of New Mexico, Albuquerque, New Mexico 87131, USA45New Mexico State University, Las Cruces, New Mexico 88003, USA
46Physics and Astronomy Department, University of North Carolina at Greensboro,Greensboro, North Carolina 27412, USA
47Department of Physics and Astronomy, Ohio University, Athens, Ohio 45701, USA48Oak Ridge National Laboratory, Oak Ridge, Tennessee 37831, USA
49IPN-Orsay, Univ. Paris-Sud, CNRS/IN2P3, Universite Paris-Saclay, BP1, F-91406, Orsay, France50Peking University, Beijing 100871, People’s Republic of China
51PNPI, Petersburg Nuclear Physics Institute, Gatchina, Leningrad region, 188300, Russia52RIKEN Nishina Center for Accelerator-Based Science, Wako, Saitama 351-0198, Japan
53RIKEN BNL Research Center, Brookhaven National Laboratory, Upton, New York 11973-5000, USA54Physics Department, Rikkyo University, 3-34-1 Nishi-Ikebukuro, Toshima, Tokyo 171-8501, Japan
55Saint Petersburg State Polytechnic University, St. Petersburg, 195251 Russia56Department of Physics and Astronomy, Seoul National University, Seoul 151-742, Korea
57Chemistry Department, Stony Brook University, SUNY, Stony Brook, New York 11794-3400, USA58Department of Physics and Astronomy, Stony Brook University,
SUNY, Stony Brook, New York 11794-3800, USA59University of Tennessee, Knoxville, Tennessee 37996, USA
60Department of Physics, Tokyo Institute of Technology, Oh-okayama, Meguro, Tokyo 152-8551, Japan61Tomonaga Center for the History of the Universe, University of Tsukuba, Tsukuba, Ibaraki 305, Japan
C. AIDALA et al. PHYS. REV. D 99, 092003 (2019)
092003-2

62Vanderbilt University, Nashville, Tennessee 37235, USA63Weizmann Institute, Rehovot 76100, Israel
64Institute for Particle and Nuclear Physics, Wigner Research Centre for Physics,Hungarian Academy of Sciences (Wigner RCP, RMKI) H-1525 Budapest 114,
POBox 49, Budapest, Hungary65Yonsei University, IPAP, Seoul 120-749, Korea
66Department of Physics, Faculty of Science, University of Zagreb,Bijenička c. 32 HR-10002 Zagreb, Croatia
(Received 26 January 2019; published 13 May 2019)
Measurements of the differential production of electrons from open-heavy-flavor hadrons with charm-and bottom-quark content in pþ p collisions at
ffiffiffis
p ¼ 200 GeV are presented. The measurements proceedthrough displaced-vertex analyses of electron tracks from the semileptonic decay of charm and bottomhadrons using the PHENIX silicon-vertex detector. The relative contribution of electrons from bottomdecays to inclusive heavy-flavor-electron production is found to be consistent with fixed-order-plus-next-to-leading-log perturbative-QCD calculations within experimental and theoretical uncertainties. These newmeasurements in pþ p collisions provide a precision baseline for comparable forthcoming measurementsin Aþ A collisions.
DOI: 10.1103/PhysRevD.99.092003
I. INTRODUCTION
Charm and bottom quarks are collectively referred to asheavy-flavor quarks. Their production in elementary pþ pcollisions is of interest from a variety of vantage points,both in high-energy particle and nuclear physics.From a fundamental standpoint, unlike light quarks
the large masses of heavy-flavor quarks (comparemc ≈ 1280 MeV=c2 and mb ≈ 4180 MeV=c2 with mu ≈2.2 MeV=c2 and md ≈ 4.7 MeV=c2) [1] are such that theirproduction can be calculated using perturbative quantumchromodynamics (pQCD) even at low pT. At leading order(LO), heavy quark production proceeds via gluon fusionand quark-antiquark annihilation. At next-to-leading order(NLO), processes such as flavor excitation and gluonsplitting are involved. In this regime, divergences areregulated by the mass of the heavy quarks, which actsas an infrared cutoff except when the quark pT is greaterthan its mass [2]. In that case, logarithmic divergencesappear. The most advanced analytic pQCD techniquescurrently available allow for such divergences to beresummed, giving rise to the fixed-order-plus-next-to-leading-log (FONLL) approach [3]. Unfortunately,FONLL calculations exhibit very large error bands asso-ciated predominantly with uncertainties in the heavy quark
masses and the renormalization scales, motivating the needfor comparisons with experimental data.A wealth of heavy-flavor-production data exists both at
the Relativistic Heavy Ion Collider (RHIC) [4] and theLarge Hadron Collider (LHC) [2]. At the LHC, suchmeasurements comprise cross section measurements ofinclusive heavy-flavor leptons, as well as of individualD (containing charm) and B (containing bottom) mesonstates. At RHIC, such measurements are consistent withFONLL calculations within uncertainties, yet systemati-cally higher than the central value predicted by the theory.It is thus of interest to arrive at a simultaneous measurementof charm and bottom production at RHIC energies toleverage the distinct masses of these quarks to provideconstraints for pQCD calculations.Now, from the standpoint of high energy nuclear
physics, heavy-ion collisions at RHIC and the LHCproduce deconfined nuclear matter—known as thequark-gluon plasma (QGP). The QGP produced in thesecolliders can be characterized as a strongly coupled fluid[5] exhibiting, among other properties, substantial coloropacity. This refers to the ability of the medium to hinderthe passage of color charges, resulting in the energy loss ofsuch particles [6]. Charm and bottom quarks are excellentprobes of color opacity because they originate primarilyfrom early-stage hard-parton-scattering processes and thustransit through the entire evolution of the QGP medium [4].The yield of heavy-flavor electrons at RHIC scales with
the number of binary nucleon-nucleon collisions [7,8] as aconsequence of charm and bottom conservation by thestrong interaction. Nevertheless, their spectrum is modifiedin central Auþ Au collisions relative to the pþ p baseline,as quantified by the nuclear modification factor RAA [8].
*PHENIX Collaboration Spokesperson: [email protected]
†Deceased.
Published by the American Physical Society under the terms ofthe Creative Commons Attribution 4.0 International license.Further distribution of this work must maintain attribution tothe author(s) and the published article’s title, journal citation,and DOI. Funded by SCOAP3.
MEASUREMENT OF CHARM AND BOTTOM PRODUCTION FROM … PHYS. REV. D 99, 092003 (2019)
092003-3

Heavy quarks are redistributed in momentum space, suchthat a strong suppression of heavy-flavor electrons isobserved for pT > 5 GeV=c, comparable in magnitudeto that observed for light quarks [9,10].This constitutes a puzzling observation, as it challenges
traditional interpretations of energy loss as proceedingexclusively through gluon radiation, requiring the inclusionof additional collisional mechanisms. To shed light on theinterplay of radiative and collisional energy loss by leverag-ing the mass difference between charm and bottom, thePHENIX Collaboration has measured separated heavy-flavor-quark yields from semileptonic decay electrons inAuþ Au collisions using the silicon-vertex-detectorupgrade [11]. Nuclear modification factors RAA were calcu-lated using a pþ p baseline measurement by the STARCollaboration [12] obtained via electron-hadron correlationswith limited kinematic reach and large uncertainties.In this paper, we present a new baseline measurement of
heavy-flavor separation in pþ p atffiffiffis
p ¼ 200 GeV usingthe same displaced-vertex analysis technique used in aprevious PHENIX measurement made in Auþ Au colli-sions at
ffiffiffis
p ¼ 200 GeV [11]. Our new results with smalleruncertainties and extended kinematic range provide avaluable update for future measurements of heavy-flavormodification.
II. EXPERIMENTAL SETUP
Figure 1 shows a transverse (beam) view of the PHENIXdetector and its subsystems. Two midrapidity spectrome-ters, called the central arms, are shown on either side ofthe central magnet. With an acceptance of jηj < 0.35 and
Δϕ ¼ π=2, each arm provides tracking and particle iden-tification capabilities. The magnetic field is generated bytwo pairs of coils in the pole faces of the central magnetsuch that when electric current runs in the same direction inboth coils, a maximum field strength of 0.9 T is achieved atthe beam location. A detailed description of the PHENIXdetector is given in Refs. [13–15].The drift chambers and three layers of multiwire-
proportional pad chambers are the subsystems used forcharged particle tracking [16]. The ring imaging Čerenkov(RICH) detector and the electromagnetic calorimeter(EMCal) are the subsystems used for electron identifica-tion. The RICH [17] comprises two independent volumes,one in each detector arm, filled with CO2. The gas acts as adielectric medium, in which electrons emit Čerenkovradiation for pT > 20 MeV=c; pions can also emit lightin the RICH above pT ≈ 5 GeV=c. The EMCal [18], whichcomprises lead-glass (PbGl) and lead-scintillator (PbSc)modules, is used to identify electrons based on the trans-verse shape of an electromagnetic shower and the ratio ofthe particle’s energy deposit in the EMCal to the momen-tum of the reconstructed track.Figure 2 shows the finely segmented silicon-vertex
detector (VTX) [14,19], which was installed as an upgradein 2011 to provide tracking close to the interactionregion, capable of reconstructing the primary vertex witha resolution on the order of 150 μm in pþ p collisions.The VTX comprises two arms with four independentlayers arranged around the beam pipe at nominal radii ofr ¼ 2.6, 5.1, 11.8, and 16.7 cm. The material budget,expressed as a percentage of a radiation length is, for
West Beam View
PHENIX Detector2012
East
MPC
BBC
(F)VTX
PbSc PbSc
PbSc PbSc
PbSc PbGl
PbSc PbGl
TOF-E
PC1 PC1
PC3
PC2
CentralMagnet TEC
PC3
BB
RICH RICH
DC DC
Aerogel
TOF-W 7.9 m =
26 ftMPC(EX)
2015
FIG. 1. Schematic view of the PHENIX detector configuration along the beam axis in the 2015 run period. The indicated subsystemsare identified in the text.
C. AIDALA et al. PHYS. REV. D 99, 092003 (2019)
092003-4

each layer, X0ð%Þ ¼ 1.28%, 1.28%, 5.43%, and 5.43%.Simultaneously with the VTX a new, thinner, berylliumbeam pipe was installed in 2011 with a material budget ofX0ð%Þ ¼ 0.22%. Each layer comprises a series of laddersextending longitudinally. The VTX has an acceptance ofjηj < 1 and Δϕ ≈ 0.8π per arm. Going from smallest tolargest radius, individual layers are named B0, B1, B2,and B3. The innermost layers, B0 and B1, were constructedusing silicon-pixel technology developed at CERN [20].Pixels in these layers have dimensions 50 μm× 425 μmand are arranged into lattices of 256 × 32 pixels which areread-out by a single ALICE1LHCb sensor-read-out chip[21]. Four readout chips constitute one sensor module, withfour sensor modules in a single ladder. Layers B0 and B1have five and ten ladders per arm, respectively. Layers B2and B3, were constructed using a novel silicon-stripixeltechnology developed at Brookhaven National Laboratory.Each 4.34 × 6.46 cm sensor in these layers is segmentedinto 80 μm × 1000 μm stripixels. These are implanted withtwo serpentine metal strips defining two read-out direc-tions, X and U, such that the two-dimensional location ofhit positions can be determined. Layers B2 and B3 have 8and 12 ladders per arm, respectively, with five(six) sensorsper ladder in B2(B3). Stripixel sensors are read-out usingthe SVX4 read-out chip, developed by a collaborationbetween Fermilab and Lawrence Berkeley NationalLaboratory [22].
III. METHODS
The goal of this analysis is to measure the invariant yieldof heavy-flavor electrons, independently for charm and
bottom decays. This is accomplished by exploiting the factthat hadrons with bottom content have a longer lifetimethan those with charm, as shown in Table I for B and Dmesons [1]. As will be described in the following sub-section, the provenance of heavy flavor electron tracks isdetermined statistically based on the distance of closestapproach in the transverse plane (DCAT) between thetracks and the beam center, which is the point relative towhich they are reconstructed.Thus, the longer lifetime of the B, and its decay
kinematics, will result in a broader DCAT distributionthan for electrons from the shorter-lived D mesons.However, the measured electron candidate sample containsnot only heavy flavor electrons, but also abundant back-ground from a variety of sources (i.e., decays of π0, η, ρ, ω,J=ψ , K�, K0
s , ϒ mesons and the Drell-Yan process, as wellas conversions of direct and decay photons), each with itsown characteristic DCAT shape. Once this background hasbeen determined, the DCAT distribution of inclusive heavyflavor electrons can be isolated. The individual contribu-tions from charm and bottom can then be obtained throughan inversion procedure often referred to as unfolding [23].We outline the steps involved in the analysis as follows:(1) Measure the DCAT distribution of hadrons and
electrons candidate tracks in data, as a function oftrack pT .
(2) Model the DCAT distributions of nonheavy-flavorbackground in the candidate electron sample bysimulating the following electron sources: π0, η,direct photons, J=ψ , K0
s , K�, and hadron contami-nation.
(3) Determine the fraction of electrons attributable toeach of the background sources considered, thusnormalizing the background DCAT distributionsrelative to those of electron candidates in data.
(4) Separate the contribution of charm and bottomdecays to the electron sample using Bayesian in-ference techniques. This step is constrained by themeasured electron DCAT distributions, as well as bythe invariant yield of inclusive heavy-flavor elec-trons, previously published by the PHENIX Col-laboration [24].
This analysis used 110 pb−1 of integrated luminositycollected during the 2015 pþ p RHIC running period. Afamily of EMCal-RICH triggers were used to maximize thenumber of electron tracks available for analysis. Thesetriggers segment the calorimeter and RICH detector into a
-20
-15
-10
-5
0
5
10
15
20
-15 -10 -5 0 5 10 15 20x [cm]
y [c
m]
FIG. 2. Cross sectional view of the VTX detector showing therelative positions of individual layers B0, B1, B2, and B3 fromsmallest to largest radius.
TABLE I. Lifetime cτ0 of selected D and B states [1].
Particle Lifetime cτ0
D0 129.9 μmDþ 311.8 μmB0 457.2 μmBþ 491.1 μm
MEASUREMENT OF CHARM AND BOTTOM PRODUCTION FROM … PHYS. REV. D 99, 092003 (2019)
092003-5

series of tiles, triggering on events in which a certain energythreshold is exceeded in a calorimeter tile, and for sometriggers requiring that a spatial match can be found inthe RICH.
A. Measuring track DCAT
Track reconstruction is carried out using the central armspectrometers, as detailed in Ref. [8]. Electron candidateswithin 1.5 < pT ½GeV=c� < 6.0 are identified by matchingreconstructed tracks with hits in the RICH, and energydeposits in the EMCal.Electrons traversing the RICH emit Čerenkov light,
which is amplified by photomultiplier tubes (PMT). Amaximum displacement of 5 cm is allowed between a trackprojection and the centroid of the hit PMTs. For tracks withpT < 5 GeV=c, at least one PMT hit is required in theRICH, whereas at higher pT at least three hits are required,given that pions in this kinematic region begin to radiate inthe RICH.Additionally, the energy E deposited by a track in the
EMCal is required to match its momentum p, since—unlike hadrons—electrons deposit the majority of theirenergy in the calorimeter. This is quantified through thevariable dep ¼ ðE=p − μE=pÞ=σE=p, where μE=p and σE=pcorrespond to the mean and width of a Gaussian fit to thedistribution of the energy-momentum ratio E=p aroundE=p ¼ 1, respectively. A cut on jdepj < 2 is then used toselect electrons.Additional cuts involving the EMCal include restricting
the displacement in Δz and Δϕ between the trackprojection and the calorimeter shower to within threestandard deviations. Finally, a cut on the probability thata given EMCal cluster originates from an electromagneticshower—as determined from the shower shape—is used toreject hadrons.Once identified in the central arms, reconstructed tracks
are projected back to the VTX detector, where an iterativealgorithm described in Ref. [11] is used to associate thetrack with VTX hits to create a VTX-associated track. Suchtracks are required to have a hit in each of the twoinnermost layers of the VTX, and at least one hit in eitherof the outer layers, and to satisfy χ2vtx=ndf < 2 to ensure thequality of the fit.Figure 3 shows a schematic diagram defining the
DCAT of a VTX-associated track. The circular trackprojection is shown in the transverse plane, where aconstant magnetic field exists over the region covered bythe VTX detector. The DCAT is then defined asDCAT ¼ L − R, where L is the distance between the beamcenter and the center of the projection, and R is theprojection radius. The beam center is defined as thegeometric center of the transverse region over which beamcollisions occur, is constant over a given run period, andexhibits a Gaussian spread of width σðbeamÞ
x ≈ 130 μm andσðbeamÞy ≈ 100 μm. Notice that DCAT is a signed quantity
which is not generally symmetric around zero, becauseelectrons from some background sources exhibit asym-metric DCAT distributions depending on the decay kin-ematics of their parent particles.In a previous PHENIX analysis [11], the DCAT
was defined relative to the primary vertex of the collision,rather than the beam center. The primary vertex is determinedusing tracks reconstructed from VTX hits alone, with noreliance on the central arm tracking subsystems. However,given the low multiplicity of pþ p collisions, such aprocedure does not converge to a vertex for approximately50% allpþ p events. Furthermore, when it does converge—and particularly in events with electron tracks—the lownumber of reconstructed tracks makes it likely that theprimary vertex is biased towards a displaced vertex and thusunsuitable for analysis. The choice of using the beam centerfor DCAT determination is further justified because theprimary-vertex resolution is quite similar to the beam spotspread. Table II shows the resolution of the precise vertexin the transverse plane, as a function of the number ofreconstructed VTX tracks used in its determination. Theresolution improves significantly with increasing numberof tracks. However, due to the limited coverage of the VTX,the average number of tracks used to calculate the primary
L
RBeamCenter
Center of CircularTrack Projection
ParticleTrack
FIG. 3. Schematic diagram illustrating the definition of trackDCAT in the transverse plane, as DCAT ¼ L − R.
TABLE II. Resolution of the primary vertex in the transverseplane, as a function of the number of reconstructed VTX tracksavailable for its determination.
Number of tracks σvertexx [μm] σvertexy [μm]
2 296.5 207.03 195.0 141.24 157.3 113.75 132.7 97.06 118.8 77.87 98.8 72.88 89.6 60.3
C. AIDALA et al. PHYS. REV. D 99, 092003 (2019)
092003-6

vertex in pþ p collisions is 3.2, such that the correspondingresolution is broader than the beam spread.Figure 4 shows the DCAT distribution of hadron tracks
within 1.8 < pT ½GeV=c� < 2.1, where the histogram cor-responds to counts of tracks passing the analysis cuts, withno correction for acceptance or efficiency effects. Hadrontracks are subject to the same quality requirements aselectron tracks, but are identified as hadrons by requiringno RICH PMT hits. The very prominent Gaussian peakcentered at DCAT ¼ 0 is attributed to particles originatingfrom the primary collision point, with its width reflectingthe beam spread, convolved with the track-pointing reso-lution. On the other hand, the broad tails can be attributed tolong-lived light hadrons which decay, as well as back-ground. It is observed that the DCAT resolution improveswith increasing track pT . For this analysis, DCAT distri-butions of electron candidate tracks were measured in10 pT bins between 1.5 < pT ½GeV=c� < 6.0.
B. Modeling electron background sources
In addition to heavy-flavor-decay electrons, the electronsample determined by applying the track cuts described inthe previous section contains contributions from a varietyof background sources. Namely, we consider (i) photonicelectrons from the Dalitz decay of π0 and η mesons, as wellas photon conversions; ðiiÞ nonphotonic electrons from thedecay of J=ψ and the three-body decay of K� and K0
s(collectively calledKe3 electrons); and ðiiiÞ hadrons whichare misidentified as electrons.To isolate the heavy-flavor signal of interest, it is
necessary to properly account for the background.
Conversion electrons constitute the single largest sourceof background in this analysis owing to the material budgetof the VTX with X0ð%Þ ¼ 13.42% of a radiation length. Inthe following subsection we describe a strategy that usesthe fine segmentation of the VTX itself to reject the vastmajority of conversions based on the narrow opening angletopology of conversion electron pairs. The remainingbackground, both photonic and nonphotonic, is accountedfor by constructing an electron cocktail normalized relativeto the measured electron sample.Of the background electron sources, all but misidentified
hadrons can be modeled using previous measurements ofprimary (i.e., π0, η, J=ψ , K�, K0
s) particle productioncombined with a knowledge of their decay modes andGEANT3 simulations of the PHENIX detector. Contributionsfrom other sources of electrons, like the decay of vectormesons such as the ϒ, ϕ, ω and ρ, as well as the Drell-Yanprocess, were found to contribute negligibly to the totalelectron background in the kinematic region of interest.
1. Photonic electron background
Photonic electrons originate from the Dalitz decay(X → eþe−γ) of π0 and η mesons, and from the conversionof photons (γ → eþe−) interacting with the beam pipe orthe VTX detector itself, where the photons are either directphotons or a hadronic decay product. To model thisbackground, we start with the published cross sectionof π0, η and direct photons in pþ p at
ffiffiffis
p ¼ 200 GeV[25–28]. Single particles are then generated between0 < pT ½GeV=c� < 20 according to the published spectrum.For π0 and η, accounting for branching ratios, the decay isforced to proceed exclusively through channels involvingphotons or electrons in the final state. The decay photonsand electrons are fed through a GEANT3 simulation of thePHENIX detector, where the same reconstruction code andtrack cuts used in data are applied. The resulting recon-structed electron yield is normalized by the number ofsimulated primary particles, thus correctly describing therelative contribution of each primary source to the totalphotonic electron yield.As previously mentioned, conversion electrons consti-
tute the most significant source of background in thisanalysis, originating from the beam pipe as well as all fourlayers of the VTX. We can eliminate 80% of conversionelectrons by imposing the requirement that tracks used inanalysis have a hit in each of the innermost two layers of theVTX, thereby discarding electron tracks originating in theouter layers.Given the narrow opening angle between the eþe− pair
from photon conversions, a veto cut is defined to minimizethe remaining conversions from the beam pipe and inner-most two layers. In this approach, tracks with a VTX hit inclose proximity, within a certain window in Δϕ and Δz, arerejected. As illustration, if a conversion occurs in the beampipe, or in B0, then nearby pairs of hits will be found in
DCA [cm]T
0.2− 0.15− 0.1− 0.05− 0 0.05 0.1 0.15 0.2
Co
un
ts
210
310
410
510
< 2.1T
1.8 < p
Charged Hadrons = 200 GeVsp+p
PHENIX < 0.35
FIG. 4. DCAT distribution of hadron tracks in data within1.8 GeV=c < pT < 2.1 GeV=c, calculated relative to the beamcenter position.
MEASUREMENT OF CHARM AND BOTTOM PRODUCTION FROM … PHYS. REV. D 99, 092003 (2019)
092003-7

subsequent detector layers. If at least one of these electronsis reconstructed as a track, the conversion veto cut willreject it based on the presence of at least one nearby hitwithin the window in any layer.The size of the conversion veto window in chrg × Δϕ,
where chrg is the charge of the track and Δϕ is theazimuthal distance between track and cluster on the surfaceof a VTX chip, is shown in Fig. 5. It depends on the trackpT , as well as the layer where the nearby cluster is found. Ingeneral, because the bend of conversion electron pairs inthe magnetic field decreases with photon momentum, thewindows become narrower with increasing electron pT .Furthermore, due to multiple scattering as well as theseparation of electron pairs in the magnetic field, windowsin the outer layers are larger than in the inner layers. Thewindows are asymmetric because the quantity chrg × Δϕ ispositive by construction; the negative side of the window ispopulated by mismeasured tracks which do not yield apositive chrg × Δϕ. In the longitudinal direction, theconversion veto window is jΔzj < 0.05 cm in the inner-most two VTX layers, and jΔzj < 0.1 cm in the outer-most two.The survival rate ε of electrons from a given source is
defined as the probability that they will not be rejected bythe conversion veto cut. Figure 6 shows the survival rate ofelectrons from photonic and nonphotonic sources as afunction of electron track pT , where the nonphotonicsurvival rate has been estimated using hadrons in data asa proxy. The survival rate of photonic electrons has beenfurther broken down by background source, namely π0 andη decays, as well as photon conversions.Conversion electrons, such as those shown from direct
photons, have the lowest survival rate of all. Electrons fromπ0 and η mesons have a higher survival probability becausethey include—in addition to photon conversions—Dalitzelectron pairs which have a wider opening angle thanconversions pairs. The survival rate of all photonic elec-trons combined is shown in blue in Fig. 6 to be approx-imately 20%. This demonstrates the ability of the
conversion veto cut to reject a substantial fraction of thephotonic background. In contrast, the survival rate ofnonphotonic electrons is very high, at approximately90%. The conversion veto cut rejects a small fraction ofnonphotonic electrons due to the presence of uncorrelatedrandom hits in the window, which affect all tracks regard-less of their provenance. The particular size of the con-version veto windows used in this analysis represents acompromise between maintaining a large window forbackground rejection and limiting its size to minimizethe inclusion of uncorrelated hits.After applying the conversion veto cut on electrons in the
photonic cocktail, the contribution of each primary particlesource to the total photonic background can be calculated,as shown in Fig. 7(a). Electrons from π0 (both Dalitz andfrom the conversion of decay photons) dominate the
[GeV/c]T
p0 0.5 1 1.5 2 2.5 3 3.5 4 4.5 5
[ra
d]
φΔ×c
0.05−
0
0.05
0.1
0.15
[GeV/c]T
p0 0.5 1 1.5 2 2.5 3 3.5 4 4.5 5
[ra
d]
φΔ×c
0.05−
0
0.05
0.1
0.15
B0 B1
0 0.5 1 1.5 2 2.5 3 3.5 4 4.5 5 0.5 1 1.5 2 2.5 3 3.5 4 4.5 5
-0.05
0
0.05
0.1
0.15
-0.05
0
0.05
0.1
0.15
pT [GeV/c] pT [GeV/c]
chrg
x
chrg
x
[
rad
]
[
rad
]
FIG. 5. Track pT-dependent window in chrg × Δϕ used in the conversion veto cut in the pixel detector layers, where chrg is the chargeof a given track and Δϕ is the azimuthal separation between clusters, one of which is associated with the track.
1.5 2 2.5 3 3.5 4 4.5 5 5.5 60
0.2
0.4
0.6
0.8
1
Non-photonic Electrons
Photonic Electrons
0 Electrons
Electrons
Direct Electrons
Su
rviv
al R
ate
pT [GeV/c]
FIG. 6. Conversion veto cut survival rates for nonphotonic, andphotonic electrons from various sources. The total photonicsurvival rate is the weighted average of the individual sources.
C. AIDALA et al. PHYS. REV. D 99, 092003 (2019)
092003-8

background for all pT , with direct photon external con-versions becoming more significant at higher pT.
2. Nonphotonic electron background
Nonphotonic electrons in this analysis correspond tothose from the decay of J=ψ mesons, as well as the three-body decays of K� and K0
s , collectively known as Ke3electrons (K → eνπ). Other background electron sources,namely the decays of vector mesons such as the ϒ, ρ, ω,and ϕwere considered in the background cocktail, but werefound to contribute negligibly.The approach to modeling nonphotonic background is
similar to that used for photonic sources. Namely, singleparticles are generated according to their respective pub-lished cross section, as measured by the PHENIXCollaboration [29–31], forced to decay, and the resultingparticles fed through a GEANT3 simulation of the detector.Applying the full set of analysis track cuts, including theconversion veto cut, we complete the background electroncocktail. The fraction of nonphotonic electrons from eachsource, relative to the total photonic background is shownin Fig. 7(b). Notice that the J=ψ contribute more to thebackground cocktail than any other background sourceabove pT ≈ 3.5 GeV=c.
3. Hadron contamination
Despite the electron identification cuts described in theprevious section, some hadron tracks will incorrectly betagged as electrons. This contribution to the electronsample is modest and is estimated in two independentways, making use of EMCal and RICH signals.
Unlike hadrons, electron tracks deposit the majority oftheir energy in the EMCal, as quantified by the ratio E=p,where E is the calorimeter energy and p is the trackmomentum. The variable dep, as previously defined, takesthe shape of a Gaussian of zero mean and unit width for trueelectron tracks. In contrast, the dep distribution of hadrontracks exhibits a very different shape. Thus, a template isconstructed, as a function of pT , by fitting the depdistribution of hadrons tracks in data. The dep distributionof electron candidates is then fit with a combination of thehadron template plus a Gaussian, with a single freeparameter corresponding to their relative contribution.The value of this parameter provides an estimate of thefraction of hadron contamination in the sample.An independent way of estimating the hadron contami-
nation is to exploit the fact that imposing a cut requiring aminimum number of PMTs fired in the RICH providesgreater rejection power for hadron tracks than for electrons.The fraction of hadrons rejected by such a cut can beestimated from hadron tracks in data, while the fraction ofrejected electrons can be determined through GEANT3
simulation of single electrons. With these two pieces ofinformation it is possible to isolate the number of hadronsand electrons in the candidate electron sample, thusdetermining the contamination fraction.The weighted average of the two independent estimates
of hadron contamination is taken as the nominal value, withtheir difference as a systematic uncertainty, as shown inFig. 8. The systematic uncertainties are assigned toencompass both estimates and are asymmetric.Another source of contamination comprises electron
tracks identified in the central arms which are associated
[GeV/c]T
p1.5 2 2.5 3 3.5 4 4.5 5 5.5 6
2−10
1−
1
Decay Electrons0π
Decay Electronsη
Conversion ElectronsγDirect
[GeV/c]p1.5 2 2.5 3 3.5 4 4.5 5 5.5 6N
on
-Ph
oto
nic
Rel
ativ
e to
To
tal P
ho
ton
ic B
ackg
rou
nd
2−10
1−10
1
10
Decay ElectronsψJ/
Ke3 Decay Electrons
(a) (b)
0 Electrons
Electrons
Direct Electrons
J/ Electrons
Ke3 Electrons
10
Fra
ctio
n o
f To
tal P
ho
ton
ic B
ackg
rou
nd
No
n-P
ho
ton
ic t
o P
ho
ton
ic B
ackg
rou
nd
T
FIG. 7. (a) Fraction of electrons from individual photonic sources relative to the total photonic electron background as determined byconstructing a background electron cocktail. (b) Fraction of electrons from individual nonphotonic sources relative to the total photonicbackground.
MEASUREMENT OF CHARM AND BOTTOM PRODUCTION FROM … PHYS. REV. D 99, 092003 (2019)
092003-9
with uncorrelated random hits in the VTX detector, leadingto the creation of a spurious VTX-associated track. Thedegree of contamination arising in this manner wasquantified by rotating all hits in the VTX in azimuthand polar angles by a small amount and attempting toreassociate central arm tracks with the rotated hits. Giventhe low multiplicity of pþ p collisions, the contribution ofmisassociated central-arm tracks was found to be negli-gible, unlike in Auþ Au collisions where it is significant.
C. Normalizing electron background DCAT
In 2015—the year in which the pþ p data wascollected—the VTXdetector exhibited a time-varying accep-tance froma changingnumber of dead, cold, and hot channelsacross the surface of each detector layer over time. Thisprecluded the measurement of an electron candidate samplefully corrected for acceptance and efficiency effects. As aresult, the simulated electrons in the background cocktailare not corrected for acceptance and efficiency, but simplyconstructed in such a way that the same reconstruction codeand analysis cuts used in data are applied.The cocktail can then be used to calculate the fraction of
electrons from each background source relative to the totalphotonic background. However, to use this information todetermine their normalization relative to the total sample ofelectron candidates, it is necessary to determine the fractionof electron candidates attributable to photonic background.This is accomplished via a data-driven method relying onthe conversion veto cut.Let NP and NNP be the number of photonic and non-
photonic electrons in the electron candidate sampleobtained without applying the conversion veto cut.
Also, let εP and εUC be the veto cut survival rate ofphotonic electrons due to correlated effects and due tononcorrelated effects, respectively. In this nomenclature,heavy-flavor electrons are part of the nonphotonic sample.The number of electrons measured without the conversionveto cut is then simply
Ne ¼ NP þ NNP; ð1Þwhile the number of measured electrons that pass the vetocut is given by
Ne ¼ εP × εUC × NP þ εUC × NNP; ð2Þwhere NP is modified by both εP and εUC because photonicelectrons are also susceptible to rejection from uncorrelatedhits in the window. Taken together, Eqs. (1) and (2) form asystem of equations with NP and NNP as the onlyunknowns, yielding
NP ¼ Ne − NeεUC
εUCðεP − 1Þ ; ð3Þ
and
NNP ¼NeεPεUC − Ne
εUCðεP − 1Þ : ð4Þ
The fraction of photonic electrons in the sample with theconversion veto cut applied is then
FP ¼ εPεUCNP
εPεUCNP þ εUCNNP; ð5Þ
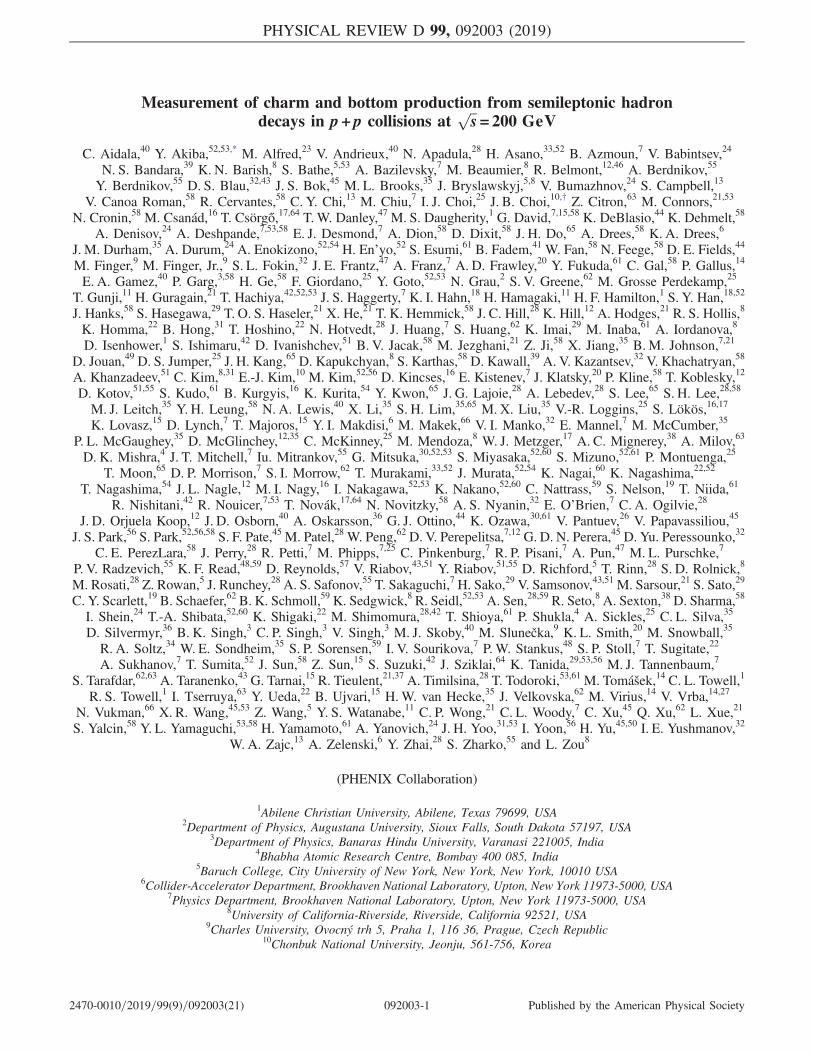
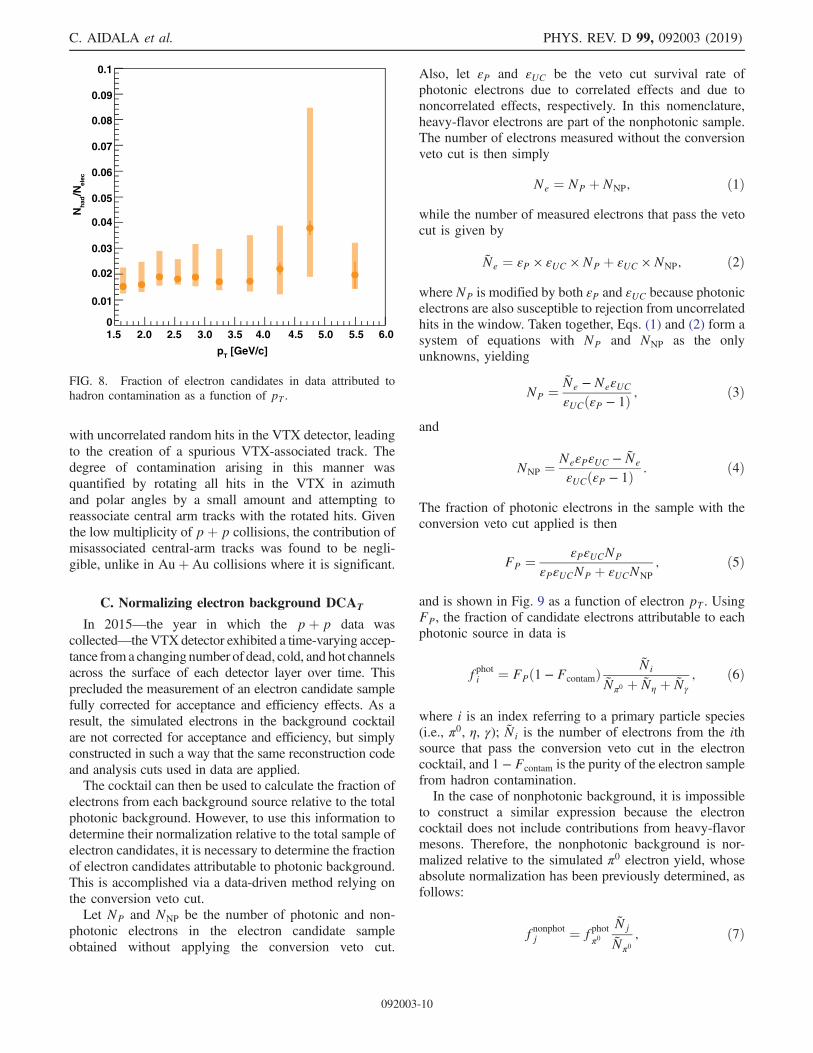
and is shown in Fig. 9 as a function of electron pT . UsingFP, the fraction of candidate electrons attributable to eachphotonic source in data is
fphoti ¼ FPð1 − FcontamÞNi
Nπ0 þ Nη þ Nγ
; ð6Þ
where i is an index referring to a primary particle species(i.e., π0, η, γ); Ni is the number of electrons from the ithsource that pass the conversion veto cut in the electroncocktail, and 1 − Fcontam is the purity of the electron samplefrom hadron contamination.In the case of nonphotonic background, it is impossible
to construct a similar expression because the electroncocktail does not include contributions from heavy-flavormesons. Therefore, the nonphotonic background is nor-malized relative to the simulated π0 electron yield, whoseabsolute normalization has been previously determined, asfollows:
fnonphotj ¼ fphotπ0
Nj
Nπ0; ð7Þ
pT [GeV/c]
Nh
ad/N
elec
0.01
0.02
0.03
0.04
0.05
0.06
0.07
0.08
0.09
0
0.1
1.5 2.0 2.5 3.0 3.5 4.0 4.5 5.0 5.5 6.0
FIG. 8. Fraction of electron candidates in data attributed tohadron contamination as a function of pT .
C. AIDALA et al. PHYS. REV. D 99, 092003 (2019)
092003-10
with j indexing the primary particles giving rise to non-photonic electrons (i.e., J=ψ and Ke3).These factors, shown in Fig. 10, are used to normalize
the DCAT distribution of each background electron sourcerelative to the electron candidate sample. Figure 11 showsthe DCAT distribution of electrons from each backgroundspecies within 1.8 < pT ½GeV=c� < 2.1, normalized rela-tive to the total number of electron candidates in that pTbin. Unlike prompt electrons, which exhibit a Gaussian
DCAT shape, Ke3 electrons originate from long-lived kaondecays, which results in their characteristic DCAT shape.In general, the resolution of the DCAT is a consequence
of the width of the beam spot convolved with the track-pointing resolution. However, the simulations used tocreate the background electron cocktail were run using asingle reference value for the beam spot size, which inreality fluctuates over time during data-taking. Therefore, itis necessary to correct for the difference in resolutionbetween simulations and data. This was accomplished bycomparing, as a function of pT , the DCAT resolution ofcharged pions in data and simulation, as quoted in Table IIIderiving a pT-dependent factor such that the simulatedDCAT distributions could be broadened to match the
[GeV/c]T
Electron p1.5 2 2.5 3 3.5 4 4.5 5 5.5 6
Fra
ctio
n o
f E
lect
ron
Can
did
ates
3−10
2−10
1−10
1
10
210
γDirect
Ke3
Hadron Contamination
Total Background
p+p at s = 200 GeV < 0.35
FIG. 10. Fraction of the measured candidate electron sampleattributable to various sources of background electrons as afunction of pT .
[GeV/c]T
Electron p1.5 2 2.5 3 3.5 4 4.5 5 5.5 6
0.05
0.1
0.15
0.2
0.25
0.3
0.35
0.4
0.45
0.5F
ract
ion
of
Ph
oto
nic
Ele
ctro
ns
p+p at s = 200 GeV < 0.35
FIG. 9. Fraction of photonic electrons to inclusive electrons indata, as a function of electron pT .
!"#"
$
!%&'(#)*+,#,-.
/'0
[cm]TDCA0.2 0.15 0.1 0.05 0 0.05 0.1 0.15 0.2
Co
un
ts
1
10
210
310
< 2.1(e)
T1.8 < p
= 200 GeVsp+p
PHENIX
< 0.35
Electron Candidates
Electrons Electrons
Hadron ContamDirect PhotonsKe3
FIG. 11. DCAT distribution of candidate electron tracks within1.8 < pT ½GeV=c� < 2.1, which pass the conversion veto cut.Also shown are the absolutely normalized DCAT distributionsfrom each simulated background electron source, as well ashadron contamination.
TABLE III. Resolution of the DCAT distribution of chargedpion tracks as reconstructed in data and in Monte Carlo GEANT3simulations of the PHENIX detector.
ElectronpT ½GeV=c�
Dataresolution [μm]
MCresolution [μm]
1.5 < pT < 1.8 134.1 122.11.8 < pT < 2.1 131.7 121.02.1 < pT < 2.4 130.1 119.92.4 < pT < 2.7 128.9 118.92.7 < pT < 3.0 127.9 118.53.0 < pT < 3.5 126.8 118.23.5 < pT < 4.0 126.2 117.94.0 < pT < 4.5 125.5 117.64.5 < pT < 5.0 125.1 117.25.0 < pT < 6.0 124.8 116.9
MEASUREMENT OF CHARM AND BOTTOM PRODUCTION FROM … PHYS. REV. D 99, 092003 (2019)
092003-11

resolution in data. This broadening factor was applied toelectrons from every species in the background electroncocktail.
D. Heavy-flavor separation via unfolding
Having normalized the electron background DCATdistributions, it is possible to isolate the correspondingdistributions of electrons from heavy-flavor decays in data.If the shapes of the parent hadron spectra were knowna priori, it would be a straightforward matter to use theknowledge of heavy-flavor-decay kinematics to determinethe shape of the DCAT distributions of charm and bottomelectrons separately, whose relative normalization couldthen be constrained by the measured inclusive DCAT .However, because such spectral shapes are not known
for D and B mesons, it becomes necessary to solve aninverse problem where the model parameters (i.e., thespectrum of hadrons containing open charm and bottom, asa function of pT) are inferred from data observations,namely the DCAT and spectrum of inclusive heavy-flavorelectrons. For the spectrum, an earlier PHENIX measure-ment [24] was used, shown in Fig. 12.To solve the inverse problem, it is necessary to construct
a mapping from the model parameters to the data. Giventhat the heavy-flavor-decay kinematics are known, it ispossible to assign a probability for a heavy flavor hadron ata given pðhÞ
T to decay into an electron with a certain pðeÞT and
DCAT . Such mapping makes it possible to quantify thelikelihood that a given set of trial hadron spectra isconsistent with the measured electron spectrum andDCAT distributions.
We use a probabilistic approach [23] to the unfoldingproblem based on Bayesian inference, identical to that usedby PHENIX to separate charm and bottom electron yieldsin Auþ Au collisions [11]. Let Ydata be a vector whoseindividual elements correspond to the yield of inclusiveheavy-flavor electrons, as shown in Fig. 12. Similarly,Ddata
jis a vector of the binned DCAT distribution of electrons indata, for tracks in the jth pT bin, out of nine bins between1.5 < pT ½GeV=c� < 6.0. The two observables are com-bined in a “data” vector,
x ¼ ðYdata;Ddata0 ;…;Ddata
8 Þ: ð8ÞThe model parameters are also represented as a vector,
θ ¼ ðθc; θbÞ; ð9Þwhere θc and θb correspond to the charm and bottomhadron yields, respectively, in 17 pT bins each, between0 < pT ½GeV=c� < 20.Bayes’ theorem, as written below,
PðθjxÞ ¼ PðxjθÞπðθÞPðxÞ ; ð10Þ
relates the probability that a given set of model parametersθ are true given the data x, to the probability that the datafollow from an assumed set of model parameters. While theformer probability—known as the posterior—is a difficultquantity to estimate, the latter—known as the likelihood—is straightforward to compute given the knowledge ofheavy-flavor decays. The quantity πðθÞ, known as theprior, corresponds to the knowledge of the model param-eters prior to the data being analyzed. The denominatorPðxÞ, sometimes known as the evidence, provides thenormalization for the posterior. Thus, Bayes’ theoremallows us to take a first guess regarding the modelparameters, as encoded in the prior, and refine it throughthe inclusion of data in the likelihood.The 17 bins for both the charm and bottom hadron
spectra within 0 < pðhÞT ½GeV=c� < 20, as represented by θ,
define a 34-dimensional space of model parameters.Starting with an initial set of values given by the priorπðθÞ, corresponding to the charm and bottom yields ascalculated with PYTHIA,1 the unfolding proceeds by draw-ing trial sets of hadron yields, corresponding to individualpoints in the multidimensional parameter space. Becausesampling such a large-dimensional space uniformly iscomputationally prohibitive, we use a Markov chainMonte Carlo (MCMC) algorithm [32], which proceedsiteratively until convergence of the final solution is
[GeV/c]T
p
0 1 2 3 4 5 6 7 8 9 1011−10
10−10
9−10
8−10
7−10
6−10
5−10
4−10
3−10
2−10
1−10
1
10
Inclusive Heavy Flavor Electrons = 200 GeVsp+p at
PHENIX (PRC 84, 044905)
Ed
3/d
p3 [
mb
GeV
-2c3 ]
FIG. 12. Invariant cross section of inclusive heavy-flavor-electron production in pþ p collisions, as measured by thePHENIX experiment [24], and used as input for the flavor-electron-separation-unfolding procedure.
1We used PYTHIA6.2, with parton distribution functions (PDFs)given by CTEQ5L. The following parameters were modified:MSEL ¼ 5, MSTPð91Þ ¼ 1, PARPð91Þ ¼ 1.5, MSTPð33Þ ¼ 1,PARPð31Þ ¼ 2.5. For bottom (charm) hadron studies,PARJð13Þ ¼ 0.75 (0.63), PARJð2Þ ¼ 0.29 (0.2), PARJð1Þ ¼0.35 (0.15).
C. AIDALA et al. PHYS. REV. D 99, 092003 (2019)
092003-12

achieved. In this analysis, three iterations suffice forconvergence with 500 parallel “walkers” and 1000 burn-in steps, as described in [32].For each trial θ, we predict an electron pT spectrum and
DCAT distribution as follows:
YðθÞ ¼ MðYÞθc þMðYÞθb; ð11Þ
DjðθÞ ¼ MðDÞj θc þMðDÞ
j θb; ð12Þ
where MY∶ pðhÞT → pðeÞ
T is a matrix encoding the proba-
bility of a hadron of pðhÞT of any rapidity to yield an electron
of pðeÞT at midrapidity, while MðDÞ
j ∶ pðhÞT → DCAðeÞ
T enc-odes the probability of yielding an electron at a givenDCAT value. The construction of these matrices using thePYTHIA generator is described in detail in Ref. [11] and
includes the decays of charm hadrons (D�,D0,Ds, and Λc)and bottom hadrons (B�, B0, Bsm and Λb). AdditionalMonte Carlo generators could be used to construct thematrix, but this would be computationally prohibitive.For the purposes of this analysis, an additional matrixwas introduced to model the detector response, mapping
the truth pT and DCAT values in MðYÞ and MðDÞj to their
reconstructed counterparts, allowing for a direct compari-son between the data and the predicted distributions froma given set of trial parameters θ.The predicted spectrum and DCAT distributions are then
used to compute the (log)likelihood as follows:
lnPðxjθÞ¼ lnPðYdatajYðθÞÞþX8
j¼0
lnPðDdataj jDjðθÞÞ; ð13Þ
PHENIX
2.5
< p
Tb [G
eV/c
] < 3
.0
2e-05
5e-06
3.5 < pTc [GeV/c] < 4.0
0.0001 0.0002
0.0001 0.0002
3.5 < pTc [GeV/c] < 4.0
2.5 < pTb [GeV/c] < 3.0
2e-055e-06
(a)(b)
(c) (d)
FIG. 13. (a) Joint probability distributions of bottom and charm hadron yields. The marginalized distribution for each pT bin is shownalong the diagonal. Correlations among bins are shown in the upper triangular [green] area for pc
T and pcT , the far-right triangular [blue]
area for pbT and pb
T , and the lower-left [orange] area for pbT and pc
T . (b)–(d) Correlation between charm and bottom yields in twoparticular pT bins, along with the marginalized distributions in those bins. See text for details.
MEASUREMENT OF CHARM AND BOTTOM PRODUCTION FROM … PHYS. REV. D 99, 092003 (2019)
092003-13
where the log-likelihood for the Ydata term is modeled as amultivariate Gaussian with diagonal covariance, while thelog-likelihood for the Dj term is modeled by a multivariatePoisson distribution, with full details provided in Ref. [11].To constrain the shape of the unfolded charm and bottom
spectra, ensuring its smoothness, a regularization term isadded to the log-likelihood function, as follows:
ln πðθÞ ¼ −α2ðjLRcj2 þ jLRbj2Þ; ð14Þ
where Rc and Rb correspond to the ratios of the trial vectorof charm and bottom spectra to the prior. The matrix L is a17 × 17 discretized second-order finite-difference matrix,effectively corresponding to the second derivative operator.Thus, the addition of this term enhances the log-likelihoodfor solutions with large curvature, effectively penalizingdeviations from smoothness. The optimal regularizationstrength α is determined by carrying out a scan of variouspossible parameter values and calculating the total log-likelihood of the unfolding solution in each case, compar-ing it to the case with no regularization. The desired optimalvalue is that which maximizes the log-likelihood, and isfound to be α ¼ 1.The end result of the Monte Carlo exploration of the
parameter space is a set of probability distributions for each
of the 34 model parameters, corresponding to the value ofeach bin of the charm and bottom hadron spectra integratedover all rapidities, including the correlations among them,as depicted in Fig. 13(a). The diagonal of the triangle showsthe marginal probability distribution for each of the 17 binsof the charm and bottom hadron spectra. Correlationsamong bins are shown in the upper triangular [green] areafor pc
T and pcT , the far-right triangular [blue] area for p
bT and
pbT , and the lower-left square [orange] area for pb
T and pcT .
Panels Figs. 13(b) and 13(d) show the marginal distribu-tions in detail for charm and bottom hadrons in two selectedpT bins. We select the parameter that maximizes themarginal distributions as the desired value of the spectrumat each bin; the 16th and 84th quantiles of the distribution aretaken as the 1σ uncertainty associated with the pointestimate, as indicated by the dotted lines.Panel Fig. 13(c) shows the joint probability distribution
of the charm and bottom hadron yields for the pT bins inFigs. 13(b) and 13(d). The shape of the distributionindicates the existence of a strong negative correlationbetween the yields in the bins at hand. It is possible to seethat the bins are largely uncorrelated, except for intermedi-ate pb
T and pcT , where a strong negative correlation exists
due to the yields being similar in this kinematic region. Forthe correlations among bins in the same hadron spectrum,
[GeV/c]T
Electron p1 2 3 4 5 6 7 8 9
]-2
dy)
[m
b (
GeV
/c)
T/d
pσ2
) d
T pπ
(1/2
10−10
9−10
8−10
7−10
6−10
5−10
4−10
3−10
2−10 = 200 GeVNNsp+p at
< 0.35
e e + b c
e
b e
c
Inclusive HF Electrons [PRC 84, 044905]
[GeV/c]T
Electron p
e)
Dat
a / (
c+b
0.60.8
11.21.41.61.8
22.22.4
1 2 3 4 5 6 7 8 9
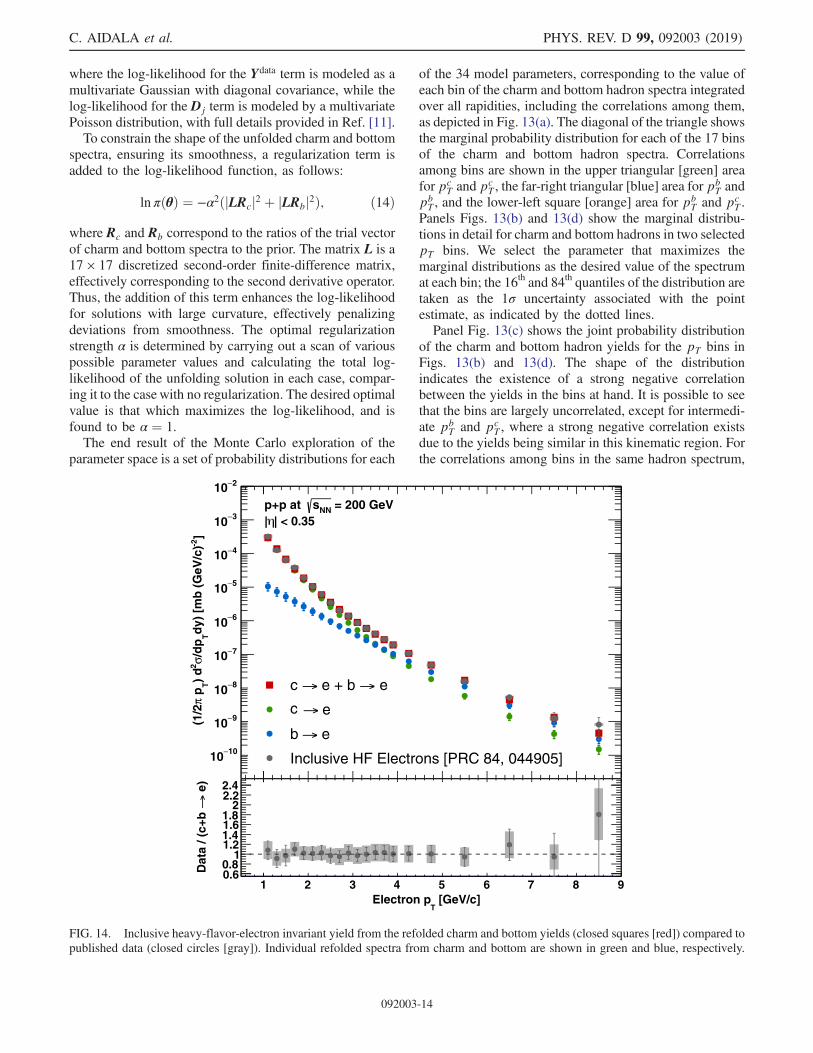
FIG. 14. Inclusive heavy-flavor-electron invariant yield from the refolded charm and bottom yields (closed squares [red]) compared topublished data (closed circles [gray]). Individual refolded spectra from charm and bottom are shown in green and blue, respectively.
C. AIDALA et al. PHYS. REV. D 99, 092003 (2019)
092003-14

Data
Background + Heavy Flavor
Total Background
Unfolded Bottom
Unfolded Charm
<0.35 <0.35 <0.35
<0.35 <0.35 <0.35
<0.35 <0.35 <0.35
<0.35
(a)
(d)
(g)
(j)
(h) (i)
(e) (f)
(b) (c)
FIG. 15. DCAT distribution of electron candidates in various pT bins, along with the contribution from total background electrons(brown) and the refolded electrons from charm (green) and bottom (blue) hadron decays. The sum of these three components is shown inred, and the ratio with the data is shown in the bottom panels. The shaded gray areas indicate the region over which the DCAT providesconstraints for the unfolding procedure.
MEASUREMENT OF CHARM AND BOTTOM PRODUCTION FROM … PHYS. REV. D 99, 092003 (2019)
092003-15

a very strong positive correlation is seen among neighbor-ing pT bins owing to the smoothness requirement on theunfolded spectra, which is imposed via regularization.The unfolded yield of charm and bottom hadrons can be
tested for consistency with the inputs provided, namely thespectrum and DCAT distributions of inclusive heavy-flavorelectrons, by applying the decay matrices to the unfoldedresult. Figure 14 shows the so-called “refolded” spectra ofcharm (bottom) electrons in green (blue), along with theirsum, in red. The refolded inclusive spectrum compares verywell with the published spectrum, as shown by the ratio plotin the bottom panel. Similarly, Fig. 15 shows, for everyelectron pT bin, the refolded inclusive electron DCATdistributions, its charm and bottom components, and thetotal background DCAT , obtained as discussed inSec. III C. The ratio plots in the bottom panel demonstratean excellent agreement with the DCAT of measuredelectrons. The shaded gray region indicates the range overwhich the DCAT is used in the unfolding procedure. Noticethat bottom electrons have a broader DCAT than those fromcharm, as expected.
IV. SYSTEMATIC UNCERTAINTIES
The unfolding procedure, as described in Sec. III D,takes the measured electron DCAT distributions andpublished electron spectrum as inputs, along with theircorresponding statistical uncertainties, which are propa-gated to the final result. However, additional sources ofsystematic uncertainty must be taken into account. Namely,we identify the following as the most significant:(1) the normalization of individual sources in the back-
ground electron cocktail,(2) the systematic uncertainty on the inclusive heavy-
flavor electron spectrum,(3) the choice of the regularization parameter strength α
in the unfolding procedure, and(4) the choice of prior used in the unfolding.The uncertainty associated with the normalization of
individual electron background components originatesfrom the parametrization of the associated primary particlespectrum. Each spectrum is repeatedly deformed randomlywithin the extent of its own statistical and systematicuncertainties, with a new parametrization being obtainedat every iteration. The rms value of all parametrizations isthen taken as the associated systematic uncertainty. In thismanner, a systematic uncertainty will exist for everybackground electron source in the cocktail. Their combinedeffect on the unfolded result is estimated by running theunfolding procedure for every combination of individualbackground normalizations, raised and lowered by theirassociated parametrization uncertainty.To estimate the pT-correlated systematic uncertainties
associated with the inclusive heavy-flavor-electron spec-trum, we deform the shape of the spectrum by tilting and
kinking the curve about two pivot points, at pT ¼2.5 GeV=c and pT ¼ 5.0 GeV=c. The choice of thesepoints is motivated by specific features of the previousanalysis which produced the inclusive heavy-flavor-electron spectrum [24], related to the method of back-ground subtraction. Tilting refers to a rotation of thespectrum about one of the two pivots, such that the firstand last points go up and down, respectively, by a fractionof their systematic uncertainty. The kinking of the spectrumintroduces a deformation whereby the spectrum takes on a“v” shape at the pivots. This procedure resulted in eightvariations of the spectrum. The ones that resulted in thelargest deviation from the nominal unfolded result weretaken as the associated systematic uncertainty.Section III D described how the optimal value of the
regularization strength αmaximizes the total log-likelihoodof the unfolded solution. An uncertainty on this value isdetermined by finding the values of α around the maximumwhich lead to a decrease of the log-likelihood by half a unit,effectively corresponding to a 1σ uncertainty. The devia-tions of the unfold result obtained with these values(α ¼ 0.71 and α ¼ 1.55), relative to the nominal resultwhen using the optimal parameter, define the extent of theassociated systematic uncertainty.Finally, a systematic uncertainty is associated with the
choice of θprior. The magnitude of this uncertainty isestimated by selecting a different prior and evaluatingthe change in the unfold result. In particular, the heavy-flavor-hadron yields obtained with PYTHIAwere scaled by amodified blast wave calculation, as described in Ref. [33].Because a feature of Markov chains, such as the one used inthis analysis, is that the probability of reaching a given stateis independent of the starting point, the sensitivity to the
[GeV/c]T
Electron p
1 2 3 4 5 6 7 8 9
Fra
ctio
nal
Un
cert
ain
ty o
n B
ott
om
Ele
c. F
ract
ion
0.6
0.8
1
1.2
1.4
Unfold Uncertainty
Unfolding Prior
Unfolding Regularization
Inclusive HFe Spectrum
Background Cocktail
Total Uncertainty
=200 GeVsp+p at
<0.35PHENIX
FIG. 16. Fractional uncertainty on the bottom electron fraction,defined as 1� the relative uncertainty of each source.
C. AIDALA et al. PHYS. REV. D 99, 092003 (2019)
092003-16
initial choice of prior is expected to be minimal after asufficient number of iterations.Figure 16 shows the relative contribution of each source
of uncertainty as a function of pT , to the unfolded fractionof electrons from bottom decays. The most significantcontribution comes from the unfold uncertainty, whichoriginates from the statistical uncertainty on the inclusiveheavy-flavor spectrum and DCAT as it is propagatedthrough the unfold procedure. The next most significantcontribution comes from the background electron cocktailand its normalization, supplying an approximate 10%uncertainty at low pT. The total systematic uncertainty isobtained by adding the contributions of every source inquadrature.
V. RESULTS AND DISCUSSION
Figure 17 shows the invariant cross section of charm andbottom hadrons integrated over all rapidity, correspondingto the values that maximize the probability distributionassociated with each hadron pT bin, shown along thediagonal of Fig. 13. The uncertainties incorporate both theunfolding uncertainty (which includes the propagation ofthe total uncertainty in the inclusive heavy-flavor-electronmeasurements provided as input) as well as the systematicuncertainties discussed in Sec. IV. The uncertainty band isnarrowest in the region where electron DCAT measure-ments provide constraint to the unfold procedure, namely1.5 < pT ½GeV=c� < 6.0. As presented, the hadron crosssection is integrated over rapidity by construction, follow-ing directly from the procedure used to populate the decay
matrices used in the unfolding procedure. Namely, hadronssimulated in PYTHIA at all rapidities are allowed to decay,recording only the probability of producing an electronwithin jηj < 0.35. It thus follows that the cross sections inFig. 17 depend on the hadron rapidity distribution imple-mented in the PYTHIA generator. This model dependenceimplies an associated uncertainty which has not beenevaluated since, as previously mentioned, this would becomputationally prohibitive. Furthermore, the modeldependence is reduced when applying the decay matrixto arrive at results in electron space.To compare the unfolded differential hadron cross
sections to existing measurements, we use the PYTHIA
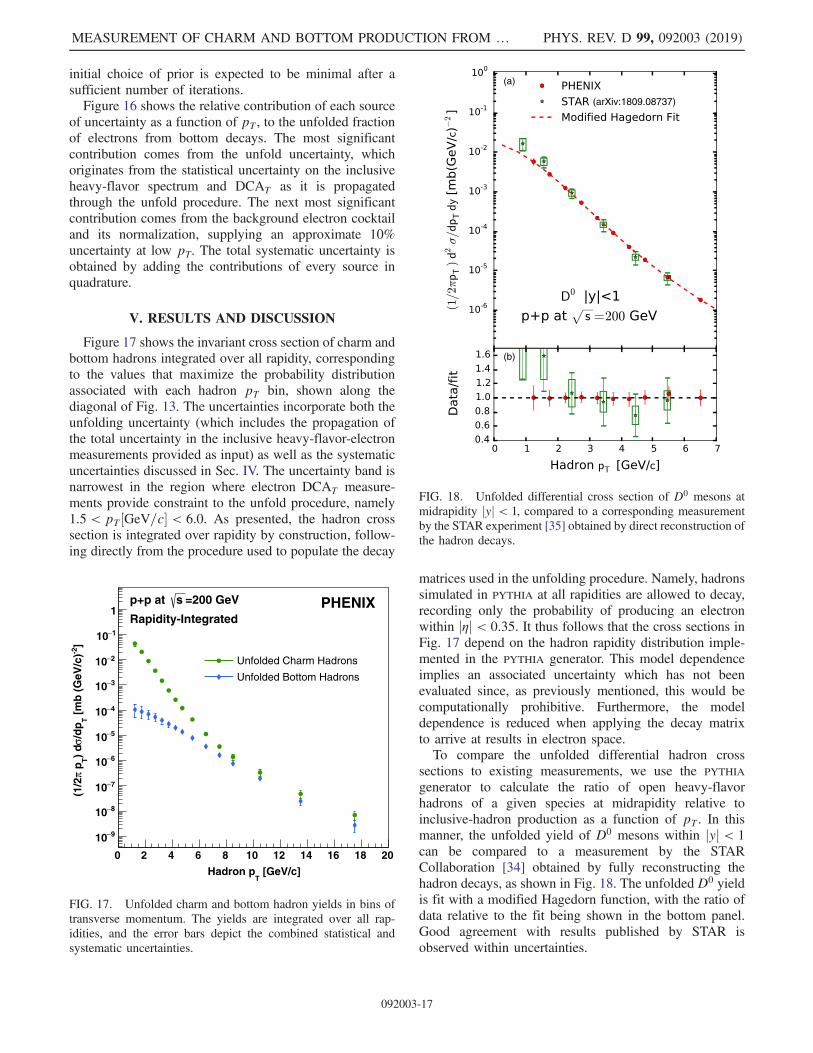
generator to calculate the ratio of open heavy-flavorhadrons of a given species at midrapidity relative toinclusive-hadron production as a function of pT . In thismanner, the unfolded yield of D0 mesons within jyj < 1can be compared to a measurement by the STARCollaboration [34] obtained by fully reconstructing thehadron decays, as shown in Fig. 18. The unfolded D0 yieldis fit with a modified Hagedorn function, with the ratio ofdata relative to the fit being shown in the bottom panel.Good agreement with results published by STAR isobserved within uncertainties.
[GeV/c]T
Hadron p
0 2 4 6 8 10 12 14 16 18 20
]-2
[m
b (
GeV
/c)
T/d
pσ
) d
T pπ
(1/2
9−10
8−10
7−10
6−10
5−10
4−10
3−10
2−10
1−10
1=200 GeVsp+p at
Rapidity-Integrated
Unfolded Charm Hadrons
Unfolded Bottom Hadrons
PHENIX
FIG. 17. Unfolded charm and bottom hadron yields in bins oftransverse momentum. The yields are integrated over all rap-idities, and the error bars depict the combined statistical andsystematic uncertainties.
(arXiv:1809.08737)
(a)
(b)
FIG. 18. Unfolded differential cross section of D0 mesons atmidrapidity jyj < 1, compared to a corresponding measurementby the STAR experiment [35] obtained by direct reconstruction ofthe hadron decays.
MEASUREMENT OF CHARM AND BOTTOM PRODUCTION FROM … PHYS. REV. D 99, 092003 (2019)
092003-17

The model dependence of the unfolded charm andbottom cross sections can be reduced by applying thedecay model—that is, multiplying the hadron cross sec-tions by the decay matrices—to obtain the refolded crosssection of heavy-flavor-decay electrons in the PHENIXcentral arm acceptance. The result can be normalized toobtain the fully invariant differential cross sections shownin Fig. 19, where the b → e curve has been scaled down bya factor of 100 for ease of visualization. Also shown areFONLL2 pQCD calculations [3], which are in reasonable
agreement with both charm and bottom cross sectionswithin uncertainties. The large uncertainties in FONLLare driven by variations in the factorization andrenormalization scales, as well as uncertainties in the heavyquark masses and the PDFs used. The central FONLLcurves in Fig. 19 correspond to the total cross sectionsfor charm and bottom of σcðFONLLÞ ¼ 242 μb andσbðFONLLÞ¼1.80 μb. Notice that, unlike the rapidity-integrated hadron observables in Figs. 17 and 18, theelectron spectra in Fig. 19 are reported at midrapidity byconstruction, following from the definition of the decaymatrix. Like other heavy-flavor measurements at RHIC, theresults presented are higher than the FONLL calculation.However, it is notable that the agreement with the centralFONLL prediction improves at high pT , where the effectsof the quark mass in the calculation become less significant.The ratio of electrons from bottom to inclusive heavy-
flavor decays, b → e=ðc → eþ b → eÞ, can be constructedfrom the electron cross sections and is shown in Fig. 20. Inthis measurement, the electrons from the feed-down decayb → c → e are considered part of the bottom electron
[GeV/c]T
Electron p1 2 3 4 5 6 7 8 9
]-2
dy)
[m
b (
GeV
/c)
T/d
pσ2
) d
T pπ
(1/2
12−10
11−10
10−10
9−10
8−10
7−10
6−10
5−10
4−10
3−10
2−10
1−10 = 200 GeVNNsp+p at
PHENIX ec
-2 10× e) (b
FONLL c e
FONLL b e e
) / F
ON
LL
(c 0.51
1.52
2.53
3.5
[GeV/c]Electron p
1 2 3 4 5 6 7 8 9
e)
/ FO
NL
L(b
0.51
1.52
2.5
T
FIG. 19. Refolded spectra of electrons at midrapidity from charm and bottom decays, compared to FONLL calculations [3]. Thebottom electron spectrum has been scaled down by a factor of 100 for easier comparison.
2We used the current default parameters with CTEQ6.6 PDFs.Central values: mb ¼ 4.75 GeV, mc ¼ 1.5 GeV, μR ¼ μF ¼μ0 ¼
ffiffiffiffiffiffiffiffiffiffiffiffiffiffiffiffiffim2 þ p2
T
p. Scales uncertainties: μ0=2 < μR, μF < 2μ0
with 1=2 < μR=μF < 2. Mass uncertainties: mb ¼ 4.5,5.0 GeV, mc ¼ 1.3, 1.7 GeV, summed in quadrature to scalesuncertainties. PDFs uncertainties are calculated according to theindividual PDF set recipe and summed in quadrature to scales andmass uncertainties. Branching ratios: BRðD → lÞ ¼ 0.103,BRðB → lÞ ¼ 0.1086, BRðB→D→ lÞ¼0.096, BRðB → DÞ ¼0.823, BRðB → D�Þ ¼ 0.173, BRðB → J=ψÞ ¼ 0.0116, andBRðB → ψð2SÞÞ ¼ 0.00307.
C. AIDALA et al. PHYS. REV. D 99, 092003 (2019)
092003-18

sample. The contribution of bottom decays to theinclusive electron sample is seen to increase sharply withpT , coming to dominate over that of charm quarks abovepT ≈ 4 GeV=c. The solid gray line corresponds to theFONLL calculation, with its uncertainty depicted bydashed gray lines. The measured bottom electron fractionis observed to be consistent with the FONLL calculationwithin uncertainties. In particular, good agreement withthe central FONLL value is seen below pT ≈ 3 GeV=c,with the measured fraction rising slightly above that athigher pT.Figure 21 shows a comparison of the unfolded bottom
electron fraction with earlier measurements made by theSTAR [12] and PHENIX [36] Collaborations using
electron-hadron and electron-D correlations. It is apparentthat the size of the data set, combined with the unfoldingmethod used in the present analysis provides a result withsmaller total uncertainty and significantly extended kin-ematic reach at low pT. Furthermore, the unfolded resultprovides a more direct determination of the bottom electronfraction since—unlike the earlier measurements—itdoes not depend on model-dependent PYTHIA templatesof event kinematics to describe the shape of electron-hadron correlations.The previous PHENIX electron-hadron results, plotted
with blue markers, are in good agreement with thenew unfolded measurement. Similarly, the STARmeasurement—while systematically lower—is also con-sistent with the unfolded bottom fraction on account of itslarge combined statistical and systematic uncertainties.The degree of agreement between these two measurementswas quantified by calculating—under the null hypothesisthat the two results are equal—the probability of obtaininga difference more extreme than that currently observedbetween the measurements. The resulting p-value using atwo-sample chi-square statistic is found to be 0.15, indicat-ing that the null hypothesis cannot be rejected. In short,both the unfold and the STAR bottom fraction measure-ments are consistent given the uncertainties.
VI. SUMMARY
We have reported on a new measurement of thedifferential-invariant production cross section of separated-heavy-flavor electrons in pþ p collisions at
ffiffiffis
p ¼200 GeV, at midrapidity jηj < 0.35 and within 1.0 <pðeÞT < 9.0 GeV=c. The measurement proceeds via an
unfolding analysis where the yield of open-heavy-flavorhadrons is inferred from the inclusive-heavy-flavor electronspectrum, and the electron DCAT distribution measuredwith the PHENIX silicon-vertex detector. The individualyields of charm and bottom electrons, as well as the bottomelectron fraction, are found to be consistent with FONLLcalculations. This measurement will provide a precisionbaseline for future-heavy-flavor-separation analyses. Inparticular, forthcoming PHENIX results using a high-statistics Auþ Au data set promise to reduce currentuncertainties and shed light on the centrality dependenceof charm and bottom suppression.
ACKNOWLEDGMENTS
We thank the staff of the Collider-Accelerator andPhysics Departments at Brookhaven National Laboratoryand the staff of the other PHENIX participating institutionsfor their vital contributions. We acknowledge support fromthe Office of Nuclear Physics in the Office of Science of theDepartment of Energy, the National Science Foundation,Abilene Christian University Research Council, ResearchFoundation of SUNY, and Dean of the College of Arts and
[GeV/c]T
Electron p1 2 3 4 5 6 7 8 9
e)
→ e
+ c
→
e /
(b
→b
0
0.1
0.2
0.3
0.4
0.5
0.6
0.7
0.8
0.9
1
PHENIX Unfolding
FONLL
PHENIX = 200 GeVsp+p at
η < 0.35
FIG. 20. Fraction of bottom electrons obtained with theunfolding procedure (red), compared to a pQCD FONLLcalculation (gray) [3], with uncertainties arising from the quarkmasses and regularization scales.
[GeV/c]T
Electron p1 2 3 4 5 6 7 8 9
e)
→ e
+ c
→
e /
(b
→b
0
0.1
0.2
0.3
0.4
0.5
0.6
0.7
0.8
0.9
1
PHENIX Unfolding
FONLL
STAR e-h Correlation
Correlation0STAR e-D
PHENIX e-h Correlation
PHENIX = 200 GeVsp+p at
< 0.35η
FIG. 21. Fraction of bottom electrons obtained with theunfolding procedure (red), compared to previous measurementsby PHENIX [36] and STAR [12] using electron-hadron corre-lations. Also shown are theory comparisons to a pQCD FONLLcalculation [3].
MEASUREMENT OF CHARM AND BOTTOM PRODUCTION FROM … PHYS. REV. D 99, 092003 (2019)
092003-19

Sciences, Vanderbilt University (U.S.A), Ministry ofEducation, Culture, Sports, Science, and Technology andthe Japan Society for the Promotion of Science (Japan),Conselho Nacional de Desenvolvimento Científico eTecnológico and Fundação de Amparo a Pesquisa doEstado de São Paulo (Brazil), Natural ScienceFoundation of China (People’s Republic of China),Croatian Science Foundation and Ministry of Scienceand Education (Croatia), Ministry of Education, Youthand Sports (Czech Republic), Centre National de laRecherche Scientifique, Commissariat a l’ÉnergieAtomique, and Institut National de Physique Nucleaireet de Physique des Particules (France), Bundesministeriumfür Bildung und Forschung, Deutscher AkademischerAustausch Dienst, and Alexander von Humboldt Stiftung(Germany), J. Bolyai Research Scholarship, EFOP, the
New National Excellence Program (ÚNKP), NKFIH, andOTKA (Hungary), Department of Atomic Energy andDepartment of Science and Technology (India), IsraelScience Foundation (Israel), Basic Science Research andSRC(CENuM) Programs through NRF funded by theMinistry of Education and the Ministry of Science andICT (Korea), Physics Department, Lahore University ofManagement Sciences (Pakistan), Ministry of Educationand Science, Russian Academy of Sciences, FederalAgency of Atomic Energy (Russia), VR and WallenbergFoundation (Sweden), the U.S. Civilian Research andDevelopment Foundation for the Independent Statesof the Former Soviet Union, the Hungarian AmericanEnterprise Scholarship Fund, the US-HungarianFulbright Foundation, and the US-Israel BinationalScience Foundation.
[1] M. Tanabashi et al. (Particle Data Group), Review ofparticle physics, Phys. Rev. D 98, 030001 (2018).
[2] A. Andronic et al., Heavy-flavour and quarkonium pro-duction in the LHC era: From proton-proton to heavy-ioncollisions, Eur. Phys. J. C 76, 107 (2016).
[3] M. Cacciari, P. Nason, and R. Vogt, QCD Predictions forCharm and Bottom Production at RHIC, Phys. Rev. Lett. 95,122001 (2005).
[4] R. Averbeck, Heavy-flavor production in heavy-ion colli-sions and implications for the properties of hot QCD matter,Prog. Part. Nucl. Phys. 70, 159 (2013).
[5] E. Shuryak, Strongly coupled quark-gluon plasma in heavyion collisions, Rev. Mod. Phys. 89, 035001 (2017).
[6] M. Gyulassy and M. Plumer, Jet quenching in dense matter,Phys. Lett. B 243, 432 (1990).
[7] S. S. Adler et al. (PHENIX Collaboration), CentralityDependence of Charm Production from Single ElectronsMeasurement in Auþ Au Collisions at
ffiffiffiffiffiffiffiffisNN
p ¼ 200 GeV,Phys. Rev. Lett. 94, 082301 (2005).
[8] A. Adare et al. (PHENIX Collaboration), Energy Loss andFlow of Heavy Quarks in Auþ Au Collisions atffiffiffiffiffiffiffiffisNN
p ¼ 200 GeV, Phys. Rev. Lett. 98, 172301 (2007).[9] K. Adcox et al. (PHENIX Collaboration), Suppression of
Hadrons with Large Transverse Momentum in CentralAuþ Au Collisions at
ffiffiffiffiffiffiffiffisNN
p ¼ 130-GeV, Phys. Rev. Lett.88, 022301 (2002).
[10] S. S. Adler et al. (PHENIX Collaboration), Suppressed π0
Production at Large Transverse Momentum in Central AuþAu Collisions at
ffiffiffiffiffiffiffiffisNN
p ¼ 200 GeV, Phys. Rev. Lett. 91,072301 (2003).
[11] A. Adare et al. (PHENIX Collaboration), Single electronyields from semileptonic charm and bottom hadron decaysin Auþ Au collisions at
ffiffiffiffiffiffiffiffisNN
p ¼ 200 GeV, Phys. Rev. C93, 034904 (2016).
[12] M.M. Aggarwal et al. (STAR Collaboration), Measurementof the Bottom Contribution to Non-Photonic Electron
Production in pþ p Collisions atffiffiffis
p ¼ 200 GeV, Phys.Rev. Lett. 105, 202301 (2010).
[13] K. Adcox et al. (PHENIX Collaboration), Phenix detectoroverview, Nucl. Instrum. Methods Phys. Res., Sect. A 499,469 (2003).
[14] E. J. Mannel, System electronics and daq for the siliconvertex detector upgrade for phenix, in Proceediings of 200715th IEEE-NPSS Real-Time Conference (IEEE, New York,2007).
[15] Y. Akiba et al., Proposal for a silicon vertex tracker (vtx) forthe phenix experiment, IAEA, Report No. bNL-72204-2004-R1, 2004.
[16] K. Adcox et al. (PHENIX Collaboration), PHENIX centralarm tracking detectors, Nucl. Instrum. Methods Phys. Res.,Sect. A 499, 489 (2003).
[17] M. Aizawa et al. (PHENIX Collaboration), PHENIX centralarm particle ID detectors, Nucl. Instrum. Methods Phys.Res., Sect. A 499, 508 (2003).
[18] L. Aphecetche et al. (PHENIX Collaboration), PHENIXcalorimeter, Nucl. Instrum. Methods Phys. Res., Sect. A499, 521 (2003).
[19] R. Nouicer et al. (PHENIX Collaboration), Status andperformance of new silicon stripixel detector for thePHENIX experiment at RHIC: Beta source, cosmic-raysand proton beam at 120 GeV, J. Instrum. 4, P04011 (2009).
[20] R. Ichimiya et al., Silicon pixel detector for the PHENIXexperiment at the BNL RHIC, J. Instrum. 4, P05001(2009).
[21] W. Snoyes et al., Pixel readout electronics development forthe ALICE pixel vertex and LHCb RICH detector, Nucl.Instrum. Methods Phys. Res., Sect. A 465, 176 (2001).
[22] B. Krieger et al., SVX4: A new seep-submicron readout ICfor the Tevatron collider at Fermilab, IEEE Trans. Nucl. Sci.51, 1968 (2004).
[23] G. Choudalakis, Fully Bayesian unfolding, arXiv:1201.4612.
C. AIDALA et al. PHYS. REV. D 99, 092003 (2019)
092003-20

[24] A. Adare et al. (PHENIX Collaboration), Heavy quarkproduction in pþ p and energy loss and flow of heavyquarks in Auþ Au collisions at
ffiffiffis
p ¼ 200 GeV, Phys. Rev.C 84, 044905 (2011).
[25] A. Adare et al. (PHENIX Collaboration), Enhanced Pro-duction of Direct Photons in Auþ Au Collisions at
ffiffiffiffiffiffiffiffisNN
p ¼200 GeV and Implications for the Initial Temperature, Phys.Rev. Lett. 104, 132301 (2010).
[26] A. Adare et al. (PHENIX Collaboration), Inclusive crosssection and double helicity asymmetry for π0 production inpþ p collisions at
ffiffiffis
p ¼ 62.4 GeV, Phys. Rev. D 79,012003 (2009).
[27] S. S. Adler et al. (PHENIX Collaboration), Measure-ment of Direct Photon Production in pþ p Collisionsat
ffiffiffis
p ¼ 200 GeV, Phys. Rev. Lett. 98, 012002(2007).
[28] A. Adare et al. (PHENIX Collaboration), Inclusive crosssection and double helicity asymmetry for π0 production inpþ p collisions at
ffiffiffis
p ¼ 200 GeV: Implications for thepolarized gluon distribution in the proton, Phys. Rev. D 76,051106 (2007).
[29] A. Adare et al. (PHENIX Collaboration), Ground andexcited charmonium state production in pþ p collisionsat
ffiffiffis
p ¼ 200 GeV, Phys. Rev. D 85, 092004 (2012).
[30] A. Adare et al. (PHENIX Collaboration), Identified chargedhadron production in pþ p collisions at
ffiffiffis
p ¼ 200 and62.4 GeV, Phys. Rev. C 83, 064903 (2011).
[31] A. Adare et al. (PHENIX Collaboration), Measurement ofneutral mesons in pþ p collisions at
ffiffiffis
p ¼ 200 GeV andscaling properties of hadron production, Phys. Rev. D 83,052004 (2011).
[32] D. Foreman-Mackey, D.W. Hogg, D. Lang, and J. Goodman,emcee: The mcmc hammer, Publ. Astron. Soc. Pac. 125, 306(2013).
[33] A. M. Adare, M. P. McCumber, J. L. Nagle, and P.Romatschke (PHENIX Collaboration), Examination whetherheavy quarks carry information on the early-time coupling ofthe quark-gluon plasma, Phys. Rev. C 90, 024911 (2014).
[34] L. Adamczyk et al. (STAR Collaboration), Measurementsof D0 and D� production in pþ p collisions at
ffiffiffis
p ¼200 GeV, Phys. Rev. D 86, 072013 (2012).
[35] L. Adamczyk et al. (STAR Collaboration), Observation ofD0 Meson Nuclear Modifications in Auþ Au Collisions atffiffiffiffiffiffiffiffisNN
p ¼ 200 GeV, Phys. Rev. Lett. 113, 142301 (2014).[36] A. Adare et al. (PHENIX Collaboration), Measurement of
Bottom versus Charm as a Function of Transverse Momen-tum with Electron-Hadron Correlations in pþ p Collisionsat
ffiffiffis
p ¼ 200 GeV, Phys. Rev. Lett. 103, 082002 (2009).
MEASUREMENT OF CHARM AND BOTTOM PRODUCTION FROM … PHYS. REV. D 99, 092003 (2019)
092003-21