Embed Size (px)
Citation preview

677EP 2014 (61) 3 (677-693)
Economics of Agriculture 3/2014UDC: 338.439.02:339.564(497.11)
MEASUREMENT OF COMPARATIVE ADVANTAGES OF PROCESSED FOOD SECTOR OF SERBIA IN THE INCREASING THE EXPORT
Review Article
MEASUREMENT OF COMPARATIVE ADVANTAGES OF PROCESSED FOOD SECTOR OF SERBIA
IN THE INCREASING THE EXPORT
Svetlana Ignjatijević1, Miroslav Čavlin2, Dragomir Đorđević3
Summary
The subject of this research is to analyse the comparative advantages of export of processed food sector, in order to define the position of the processed food sector in Serbia in compare to the Danube region and highlight the products that were and will be the main exporting agricultural product of Serbia. In this research, we have applied the following indexes: RXA, RTA, ln RXA, RC, RCA, LFI, GL, Sm. We have examined the movement of the index for the period 2005 - 2011th year. We have investigated the existence of correlations RCA index of processed food sectors with the application of the Pearson and Spearman index determined as RCA variable mutual co-variant. We found that following products showed an increase of comparative advantage in export as measured by the Balassa index: milk products, cheese and curd, groats and meal of other cereals, preparations of cereals, flour, starch, vegetables, roots and tubers, processed, prepared and Fruit products, sugar, molasses and honey, chocolate and other food preparations with cocoa, animal food (including un milled cereals), edible products and preparations, alcoholic beverages, non-alcoholic beverages, solid vegetable fats, oils, ‘ soft ‘ and animal and vegetable fats.
Key words: Serbia, Danube region, comparative advantages, processed food sector
JEL: F14, P51
Introduction
Market of the countries of the Danube region is of particular importance for the development of the food industry in Serbia. As Serbia in the past achieved positive comparative advantage exports of processed food sector (Ignjatijević, Milojević, 2011) we rightly believe that technological and organizational modernization of Serbia can improve the current level of cooperation. Serbia has very favourable natural conditions (soil and climate) for diversified
1 Svetlana Ignjatijević, Ph.D., Assistant Professor, FIMEK, Cvećarska 2, 21000 Novi Sad, Phone: +381 21 400 484, E-mail: [email protected] , [email protected]
2 Miroslav Čavlin, Ph.D., Assistant Professor, FIMEK, Cvećarska 2, 21000 Novi Sad, Phone: +381 21 400 484, E-mail: [email protected]
3 Dragomir Đorđević, Ph.D., Full Professor, FIMEK, Cvećarska 2, 21000 Novi Sad, Phone: +381 21 400 484, E-mail: [email protected]

678 EP 2014 (61) 3 (677-693)
Svetlana Ignjatijević, Miroslav Čavlin, Dragomir Đorđević
agricultural production (as crop, as well as livestock production), it has experienced producers, top-experts and scientific workers, worldwide recognized selection of various crop products (Arsić, Čavlin, 2013). Increasing demand for fresh food and processed food sector products of the countries of the Danube region represents the potential that must be used. The current concept of the Danube region development is significantly improved, so that the scene is creating for a strong macro-region in which the country should mobilize all resources in order to “overcome the uneven level of development, to strengthen the economy of the member states, conservation and environmental protection, the development of the transportation and education” (Ignjatijević, Milojevic, 2011). In period after 2005 Serbia achieved surplus in export of agricultural and food products. As the leading trade partners of Serbia are countries of the EU and CEFTA, a logical question arises: why then explore the international trade of food products from the Serbia to Danube countries? The answer lies in the fact that Danube region consists of „highly developed countries, developed transitional countries and countries with transitional problems“ (Ignjatijević et al., 2013, p. 252) and exactly these countries are foreign trade partners of Serbia. “The company, however, I do not want to, if he wants to survive and evolve freely, must continually take into account all the complex, numerous, rapid and sudden social (economic and non-economic) interests, objectives, requirements, criteria and restrictions set out their environment, to enable the achievement of company goals and long-term maximization of differences between the values of inputs and outputs” (Malešević, Čavlin, 2009). That is why it is necessary to answer the question what is the position of processed food sector of Serbia in comparison to the above mentioned Danube region countries. For this purpose we have applied seven indexes of comparative values: RXA, RTA, ln RXA, RC, RCA, LFI and Sm. Through correlation analysis, we wanted to answer the question of the existence of correlations obtained indexes, then the variation and distribution of the index. In the further research we have measured the level of comparative advantage and specialization of products that belong to processed food sector so we could determine which production have potential for development, or which product has achieved improvement of competitiveness in the international market.
Literature review
Numerous authors were dealing with the question of competitiveness or, to be more precise, the competitive advantages. In their research they were applying Balassa index to explore the position of food industry. Most research is aimed to analyse the competitiveness of the system of the food industry in the EU process. That is how Bojnec et al. (2005) emphasized the importance of structural changes in the food industry of Slovenia in the process of integration into the European market. Majkovic et al. (2006) came up to similar conclusions and they added that in the period before 2003 Slovenia achieved positive competitive advantage with the export of dairy products, meat and beverages. Vološin (2011); Svatoš, Smutka (2012) pointed out the significance of the changes of production and export structure of Czech Republic after joining the EU. The results of their study indicate a positive comparative advantage in export of milk and dairy products, livestock, cereals and beverages. Research results Belova et al. (2012) are consistent with the above conclusion that the export of the Czech food

679EP 2014 (61) 3 (677-693)
MEASUREMENT OF COMPARATIVE ADVANTAGES OF PROCESSED FOOD SECTOR OF SERBIA IN THE INCREASING THE EXPORT
industry experienced a significant transformation after joining the EU, and that the only traditionally competitive sectors maintain a positive position. Fertö, Hubbard (2001) were dealing with the competitiveness of the Hungarian food industry in period from 1992 until 1998. In another study, Fertö, Hubbard (2002) emphasizes the role of the state in the process of improving the competitiveness of the livestock. By using the Balassa index Bojnec, Fertö (2007) showed a positive comparative advantage of the food industry in Hungary at EU market. Török, Jambor (2013) showed the positive results of the market adjustment of the Hungarian food industry toward demands of the European market. Buturac (2008) researched the position of the manufacturing industry of Croatia. The results of the research show decline in comparative advantage industries in general to slightly increase the comparative advantage of export from the tobacco industry. Buturac et al. in the study (2010) emphasizes the existence of comparative advantage in export of food industry of Serbia and Croatia, which is consistent with the results of Ignjatijević, Milojević (2011). In a study on the level of competitiveness of the food industry in Slovakia, Qineti et al. (2009) suggested two directions of export. Decline of comparative advantage in export to the demanding European market was compensated by an increase in export toward Ukraine. Numerous authors were dealing with the competitiveness of the Serbian economy. In early studies Gagović (2003) analyses the comparative advantage of export in Serbia and points to the agri-food products with positive comparative advantages. The author points out that in the period up to in 1999 there were achieved improvement of the structure of production and exports, which is certainly a positive effect on the level of export competitiveness. One of the first studies on the existence of a comparative advantage in export of agricultural and food products in Serbia is definitely researched by Ignjatijević et al. (2010) on the positive comparative advantage in exports of herbs and herbal raw materials. Modelled on the research of manufacturing in Croatia Buturac (2008); Ignjatijević (2012) proves that the manufacturing industry in Serbia as a whole have negative comparative advantage, while only the food industry has a convenient position. The focus of future research Ignjatijević et al. (2012) is precisely the position of agricultural products and food industries of Serbia in the international market. Raičević et al. (2012) have identified sectors of the food industry with positive comparative advantages. Ignjatijević, Milojević (2012) showed the importance of food industry in development of rural areas of Serbia. A new study by Ignjatijević et al. (2014) have found that “growing intensity of trade of food products in Danube Region countries. There is a concentration of exports in this sector by the countries and by commodity groups. Analysis of changes in revealed comparative advantage points to increase the competitiveness of processed food sector in the Czech Republic, Hungary, Germany, Serbia and Ukraine, while in other countries there is was decrease competitiveness. From this perspective, there is a clear need to continue structural reforms, in order to promote export structure, which is pointed out in earlier studies. In the following period it’s not enough just to continue production, on the contrary, countries that are not members of the EU must be strengthened and improve production, as they face the increasingly competitive producers in the EU.“
680 EP 2014 (61) 3 (677-693)
Svetlana Ignjatijević, Miroslav Čavlin, Dragomir Đorđević
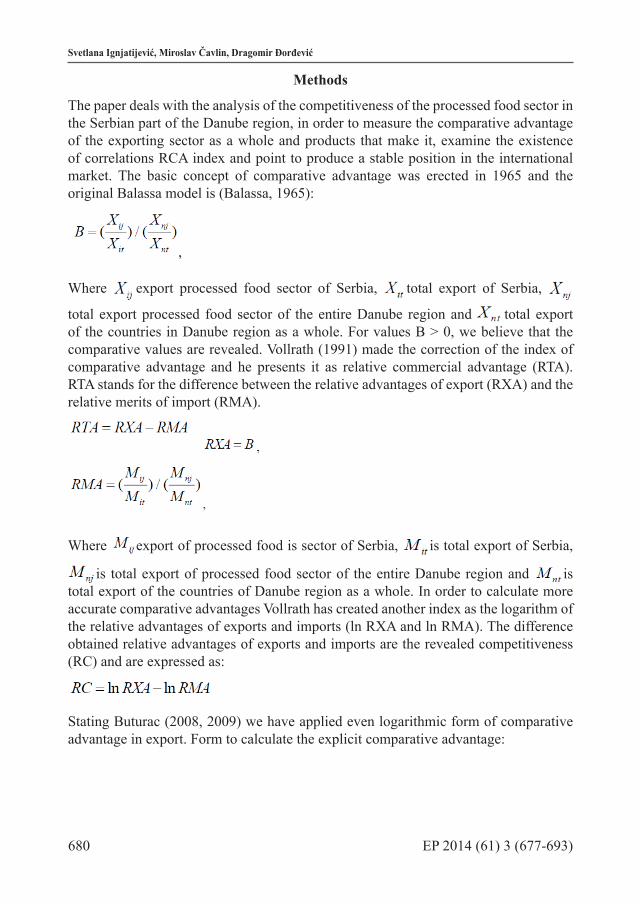
Methods
The paper deals with the analysis of the competitiveness of the processed food sector in the Serbian part of the Danube region, in order to measure the comparative advantage of the exporting sector as a whole and products that make it, examine the existence of correlations RCA index and point to produce a stable position in the international market. The basic concept of comparative advantage was erected in 1965 and the original Balassa model is (Balassa, 1965):
,
Where export processed food sector of Serbia, total export of Serbia,
total export processed food sector of the entire Danube region and total export of the countries in Danube region as a whole. For values B > 0, we believe that the comparative values are revealed. Vollrath (1991) made the correction of the index of comparative advantage and he presents it as relative commercial advantage (RTA). RTA stands for the difference between the relative advantages of export (RXA) and the relative merits of import (RMA).
Where export of processed food is sector of Serbia, is total export of Serbia,
is total export of processed food sector of the entire Danube region and is total export of the countries of Danube region as a whole. In order to calculate more accurate comparative advantages Vollrath has created another index as the logarithm of the relative advantages of exports and imports (ln RXA and ln RMA). The difference obtained relative advantages of exports and imports are the revealed competitiveness (RC) and are expressed as:
Stating Buturac (2008, 2009) we have applied even logarithmic form of comparative advantage in export. Form to calculate the explicit comparative advantage:

681EP 2014 (61) 3 (677-693)
MEASUREMENT OF COMPARATIVE ADVANTAGES OF PROCESSED FOOD SECTOR OF SERBIA IN THE INCREASING THE EXPORT
Where X is the value of export, M is value of import. Index i presents processed food sector in whole or the product of that sector.
Following the example of used indexes of comparative advantage, we created a modified index of comparative advantage (Sm), which is calculated by dividing the export of accounts in relation to the total exports of processed food sector in Serbia. The values obtained in the modified model Sm (Ignjatijević, 2011; Raičević et al., 2012) represent a specific model of comparative advantage in export of processed food sector. The modified comparative advantage of processed food sector by Sm model is calculated using the formula:
, where:
Sm - The modified comparative advantage of processed food sector, Xip export of product i processed food sector p, Mip - import of product i processed food sector p,
- total export of processed food sector p i - total import of processed food sector p.
For an analysis of the level of specialization in intra-industry trade we are using the Grubel-Lloyd’s Index. Grubel Lloyd index is calculated as follows (1975):
value of Grubel Lloyd index for group of products i. value of export, and
is value of import. The index is in the range of 0 to 1. Values close to 0 indicate the inter-character exchange, and value close to 1 the character of intra-industry trade.
Comparative advantage processed food sector were counted by Lafay index (LFI). Comparative advantage processed food sector were counted and by Lafay index (LFI). It is defined as (Affortunato et al., 2010):

682 EP 2014 (61) 3 (677-693)
Svetlana Ignjatijević, Miroslav Čavlin, Dragomir Đorđević
Where and export and import of product J in country i, to the rest of the world, and n is the number of items. The comparative advantage in the country i in production j measures the differences in products J from the total commercial balance. Unlike Balassa index, this index takes into account the difference between exports and imports and tries to overcome some shortcomings of the Balassa index taking into account within the trade flows and GDP.
Research of correlation by Pearson and Spearman coefficient explains the connection of coefficients in shedding light on the comparative advantages. According to the research Lord et al. (2010) we have applied Pearson (rp) and Spearman (rs) test. We have found correlation between the level of the paired index 10, and we have established that the value of the RCA co-variant. Analysis of variance (ANOVA) is an analytical model used to analyze the differences when there are more than two groups. The advantage of this method is in the fact that the model included into account all the variability, as well as their impact, making it impossible to assess the other way. ANOVA provides a statistical test of whether or not the means of several groups are equal, and therefore generalizes the t-test to more than two groups.
The paper used the data of The Statistical Office of the Republic of Serbia and UN Comtrade for the corresponding year. The study included processed food sector (according to the methodology ITC - International Trade Centre) and products that are in their belonging.
Results
In a study of comparative advantage in exports processed food sector, we applied five indexes. The table below shows the RCA indexes for all analyzed, and the coefficient of variation of the said indexes. The research found a positive comparative advantage of all five indices. Positive values of the index processed food sector are directly related to the low coefficient of variation of the index during the analyzed period. The low coefficients of variation RCA indices indicate the stability of the coefficient of comparative advantage. Established positive value of comparative advantage in export processed food sector is in line with the conclusions of Ignjatijević, Milojević (2011). Empirical research results of comparative advantage in exports processed food sector in Serbia in the period 2005 - 2011th are shown in Table 1.

683EP 2014 (61) 3 (677-693)
MEASUREMENT OF COMPARATIVE ADVANTAGES OF PROCESSED FOOD SECTOR OF SERBIA IN THE INCREASING THE EXPORT
Table 1. RXA, RMA, RTA, RC and RCA data export of processed food sector in Serbia in the period from 2005 to 2011.
YearsIndexes
RXA=B RTA LNRXA RC RCA>1 >0 >0 >0
2005 4.13 2.96 1.42 1.26 0.162006 3.98 2.80 1.38 1.21 0.212007 3.94 2.95 1.37 1.38 0.282008 3.54 2.56 1.26 1.29 0.262009 3.53 2.49 1.26 1.23 0.282010 1.67 1.08 0.51 1.05 0.342011 2.92 1.79 1.07 0.95 0.27
Source: The Statistical Office of the Republic of Serbia and calculation by authors
By analysing the variance we wanted to determine whether the mean variables vary in relation to the group. In our case empirical F value is 38.29, and p < 0.0001, indicating that the differences between the groups are significant, systematic. In fact, the differences are statistically significant, Table 2.
Table 2. Results of ANOVA test
Indicators IndexesRXA RTA LNRXA RC RCA
Minimum 1.67 1.08 0.51 0.95 0.16Median 3.54 2.56 1.26 1.23 0.27Maximum 4.13 2.96 1.42 1.38 0.34Mean 3.387 2.376 1.181 1.196 0.2571Std. Deviation 0.8582 0.6976 0.3182 0.1472 0.05736Std. Error of Mean 0.3244 0.2637 0.1203 0.05563 0.02168t, df t=10.44 df=6 t=9.010 df=6 t=9.823 df=6 t=21.49 df=6 t=11.86 df=6P value (two tailed) < 0.0001 0.0001 < 0.0001 < 0.0001 < 0.0001Significant (alpha=0.05)? Yes Yes Yes Yes Yes
Coefficient of variation 25.34% 29.37% 26.93% 12.31% 22.31%ANOVA summaryF 38.29P value < 0.0001P value summary ****Are differences among means statistically significant? (P < 0.05)
Yes
R square 0.8362ANOVA table SS DF MS F (DFn, DFd) P value

684 EP 2014 (61) 3 (677-693)
Svetlana Ignjatijević, Miroslav Čavlin, Dragomir Đorđević
Indicators IndexesRXA RTA LNRXA RC RCA
Treatment (between columns) 41.34 4 10.34 F (4, 30) =
38.29 P < 0.0001
Residual (within columns) 8.097 30 0.2699
Total 49.44 34
Source: calculation by authors
According to research conducted Ballance (1987) we performed a correlation analysis of the obtained indices, in order to examine the extent to which the indices related to the identification of comparative advantages. In accordance with the finding Lorde et al. (2010), correlation coefficient whose value is greater than 70% is regarded as acceptable. In Serbia we have eight pairs with strong correlation, the correlation above 70%. From these results, three pairs have a negative correlation. As p - value for the correlation mentioned indexes have a value of less than 0.05, we conclude that a correlation exists and co-variant variables. Test of the connection RCA index by applying the Spearman’s test shows the existence of correlation bigger than 70% at 6 pairs (two of them are negative), Table 3.
Table 3. The correlation index of the comparative advantages of Serbia
Indexesrp rs
RXA RTA LNRXA RC RCA RXA RTA LNRXA RC RCARXA 0.99 0.99 0.72 -0.79 0.96 0.99 0.57 -0.79
RTA 0.99 0.97 0.82 -0.73 0.96 0.95 0.71 -0.67
LNRXA 0.99 0.97 0.67 -0.76 0.99 0.95 0.54 -0.75
RC 0.72 0.82 0.67 -0.33 0.57 0.71 0.54 -0.16
RCA -0.79 -0.73 -0.76 -0.33 -0.79 -0.67 -0.75 -0.16
Source: calculation by authors
Results of the research export commodity groups that belong to processed food sector show that from 29 sectors Serbia achieves the maximum value of the index of revealed comparative advantage in 16 commodity groups. We note that in 13 commodity groups there is recorded increase in positive comparative advantage in export. These are the following Product Groups: Milk and products, except butter of cheese - 022; Cheese and curd - 024; Groats and meal of other cereals - 047; Preparations of cereals, flour, starch - 048; Vegetables, roots and tubers, processed - 056; Fruit and prepared products (excluding juices) - 058; Sugar, molasses and honey - 061; Chocolate and other food preparations with cocoa - 073; Animal food (not including un milled cereals) - 081; Edible products and preparations - 098; Non-alcoholic beverages - 111; Alcoholic beverages - 112; Fixed vegetable fats, soft oils - 421; Animal and vegetable fats, oils – 431, Table 4.

685EP 2014 (61) 3 (677-693)
MEASUREMENT OF COMPARATIVE ADVANTAGES OF PROCESSED FOOD SECTOR OF SERBIA IN THE INCREASING THE EXPORT
Table 4. Values RCA, GL, LFI and Sm index by commodity groups processed food sector of Serbia in period 2005-2011
Product groups 2005 2011RCA GL LFI Sm RCA GL LFI Sm
Meat and edible offal, salted, dried - 016 0.07 0.92 0.01 0.22 -1.04 0.30 -0.01 -3.60
Meat and edible offal, preserved - 017 0.35 0.61 0.14 1.18 0.19 0.84 0.08 0.67
Milk products, except butter or cheese - 022 -0.06 0.93 0.04 -0.19 0.36 0.70 0.16 1.26
Butter and other fats from milk, dairy spreads - 023 0.38 0.59 0.01 1.27 -0.30 0.75 0.00 -1.05
Cheese and curd - 024 0.09 0.90 0.02 0.30 0.40 0.68 0.06 1.38Birds eggs and egg yolks, fresh, dried, egg whites - 025 -0.35 0.61 0.00 -1.17 -0.52 0.58 0.00 -1.82
Fish, dried, salted, in brine, smoked - 035 0.00 0.00 0.00 - -0.35 0.71 0.00 -1.22
Fish and crustaceans, molluscs, Preserved - 037 -0.99 0.18 -0.06 -3.32 -2.08 0.06 -0.08 -7.23
Rice - 042 -3.15 0.00 -0.02 -10.56 -1.88 0.08 -0.02 -6.52Flour, groats and meal of wheat - 046 2.00 0.02 0.08 6.73 1.82 0.09 0.20 6.31
Groats and meal of other cereals - 047 1.26 0.10 0.02 4.23 2.21 0.05 0.04 7.65
Preparations of cereals, flour, starch - 048 0.19 0.78 0.33 0.63 0.51 0.59 0.33 1.78
Vegetables, roots and tubers, processed - 056 0.19 0.78 0.18 0.65 0.29 0.76 0.12 1.02
Fruit and prepared products (excluding juices)- 058 1.16 0.12 1.35 3.91 1.47 0.15 1.21 5.10
Fruit and vegetables juices- 059 0.41 0.56 0.25 1.37 0.15 0.88 0.04 0.51
Sugar, molasses and honey - 061 0.76 0.29 1.47 2.54 1.14 0.26 0.63 3.94
Sugar products - 062 -0.23 0.73 0.02 -0.78 -0.07 0.94 0.02 -0.25Chocolate and other food preparations with cocoa – 073 0.01 0.99 0.20 0.04 0.32 0.74 0.18 1.11
Animal food (not including unmilled cereals) - 081 -0.42 0.55 -0.02 -1.40 0.39 0.68 0.28 1.35
Margarine and other edible fats - 091 0.48 0.49 0.04 1.60 -0.10 0.91 0.01 -0.35
Edible products and preparations - 098 -0.36 0.60 0.00 -1.21 -0.18 0.85 0.07 -0.63
Non-alcoholic beverages - 111 0.43 0.54 0.09 1.44 1.33 0.19 0.39 4.63
Alcoholic beverages – 112 0.18 0.79 0.27 0.62 0.27 0.77 0.28 0.94Tobacco, processed - 122 -1.66 0.04 -0.21 -5.56 -0.44 0.64 -0.03 -1.53

686 EP 2014 (61) 3 (677-693)
Svetlana Ignjatijević, Miroslav Čavlin, Dragomir Đorđević
Product groups 2005 2011RCA GL LFI Sm RCA GL LFI Sm
Animal oils and fats - 411 -0.38 0.59 0.00 -1.26 -0.19 0.84 0.00 -0.65Fixed vegetable fats, soft oils - 421 1.09 0.15 0.34 3.65 1.67 0.11 0.72 5.78
Fixed vegetable fats, oils – 422 -1.79 0.03 -0.04 -6.03 -2.29 0.04 -0.06 -7.94
Animal and vegetable fats, oils - 431 -0.18 0.79 0.01 -0.61 0.32 0.74 0.03 1.10
Essential oils, perfumery products - 551 -1.41 0.07 -0.10 -4.72 -2.05 0.06 -0.12 -7.10
Source: The Statistical Office of the Republic of Serbia and calculation by authors
Chart 1 shows the ratio of the number of commodity groups processed food sector and the value of RCA indicators. The horizontal axis shows the values of RCA indices, and the ordinate the number of products which have the corresponding value of RCA indicators. Analyzing the competitive advantages it can be concluded that the 2011th, had the highest sectors with positive comparative advantage in value of -0.05 to 0.05.
Chart 1. The distribution of values RCA index products processed food sector in 2005 and the 2011
Source: The Statistical Office of the Republic of Serbia and calculation by authors
In research of specialization in international trade, we established the existence of inter-industry, intra-industry trade and a number of products with simultaneous inter-and intra-character exchange. The obtained values indicate that the positive comparative advantage resulting from the absence of imports in certain commodity groups, rather than as a result of the openness of the Trade.

687EP 2014 (61) 3 (677-693)
MEASUREMENT OF COMPARATIVE ADVANTAGES OF PROCESSED FOOD SECTOR OF SERBIA IN THE INCREASING THE EXPORT
Chart 2. Distribution of GL index values of products processed food sector in 2005 and the 2011
Source: The Statistical Office of the Republic of Serbia and calculation by authors
Chart 2 shows the ratio of the number of products processed food sector and GL values of the indicators. Abscissa shows the values of the indicators GL, and the ordinate the number of products that have a corresponding indicator value GL. Analyzing the specialization in intra-industry trade it can be concluded that in the 2011th the highest product of the inter-character exchanges in the index values of 0.10 to 0.20, and the character of intra-industry trade in the index values of 0.70 to 0.80.
Increasing competitive advantage in exports of products processed food sector measured by Lafay index, have the following product groups: milk products, except butter or cheese (LFI 2005 = 0,04, LFI 2011 = 0,16); Cheese and curd - 024 (LFI 2005 = 0,02, LFI 2011 = 0,06); Flour, groats and meal of wheat - 046 (LFI 2005 = 0,08, LFI 2011 = 0,20); Groats and meal of other cereals - 047; (LFI 2005 = 0,02, LFI 2011 = 0,04); Animal food (not including un milled cereals) - 081(LFI 2005 = -0,02, LFI 2011 = 0,28); Edible products and preparations - 098 (LFI 2005 = 0,00, LFI 2011 = 0,07); Non-alcoholic beverages - 111 (LFI 2005 = 0,09, LFI 2011 = 0,39); Alcoholic beverages - 112 (LFI 2005 = 0,27, LFI 2011 = 0,28); Fixed vegetable oils and soft oils - 421 (LFI 2005 = 0,34, LFI 2011 = 0,72); Animal and vegetable fats, oils 431 (LFI 2005 = 0,01, LFI 2011 = 0,03);

688 EP 2014 (61) 3 (677-693)
Svetlana Ignjatijević, Miroslav Čavlin, Dragomir Đorđević
Chart 3. The distribution of values LFI index of commodity groups processed food sector in 2005 and 2011
Source: The Statistical Office of the Republic of Serbia and calculation by authors
Chart 3 shows the ratio of the number of products processed food sector and the value of LFI indicators. The horizontal axis shows the values of MFI indicator, and on the ordinate the number of products processed food sector with an appropriate value of the LFI indicators. Analyzing the competitive advantages it can be concluded that in the 2011, the highest products with positive comparative advantage in value from 0.00 to 0.10.
Analysis of the comparative advantages of using a modified Sm index confirms the presence of high comparative advantages of the analyzed products processed food sector measured RCA index. Displayed values of the modified index of comparative advantage have higher values , but the same range of products, which is consistent with earlier findings Ignjatijević et al. (2012) on the values of the modified index. The high value of the RCA and Sm index of comparative advantage is the result of a significant export commodity groups analyzed in the total exports of processed food sector.
Chart 4. The distribution of values Sm index products processed food sector in 2005 and 2011
Source: The Statistical Office of the Republic of Serbia and calculation by authors

689EP 2014 (61) 3 (677-693)
MEASUREMENT OF COMPARATIVE ADVANTAGES OF PROCESSED FOOD SECTOR OF SERBIA IN THE INCREASING THE EXPORT
Chart 4 shows the ratio of the number of products processed food sector and the value of Sm ratios. The horizontal axis shows the values of Sm indicators, and on the ordinate the number of products processed food sector with an appropriate value Sm indicators. Analyzing the competitive advantages it can be concluded that in the 2011th years, the highest product of positive comparative advantage in value from 0.10 to 0.30.
Conclusion
Results of this research are very important to point out the position of the processed food sector of Serbia within Danube region. We have determined an existence of positive comparative advantage for all five indexes RXA, RTA, ln RXA, RC I RCA in period from 2005 until 2011. Further analysis of variance of data obtained, we concluded that the differences between the indexes are statistically significant. Coefficient of variation is from 12,31% (RC) to 29,37% (RTA), indicating the high stability of the group indexes inside the analyzed period.
Using Persons and Spermans coefficient we examined coefficients correlation for ten matched pairs. Empirical values of the F level are higher than a critical, which implies that no one can reject the null hypothesis that the disparities between the indexes and that is statistically significant. The coefficient of determination of 83.62% indicates that much of the variation of present data is due to the conditions that define a group of five indices. In Serbia we have 8 pairs with strong correlation measured by Pearson index and 6 pairs measured by Spearman index.
After we measured the level of comparative advantage and correlation of RCA index processed food sector as a whole, we have defined the products that belong to the processed food sector, and have a positive comparative advantage. We found that following products showed an increase of comparative advantage (RCA); Milk products, cheese and curd, groats and meal of other cereals, cereal, flour, starch, vegetables, roots and tubers, processed, and prepared fruit, sugar, molasses and honey, chocolate and other food preparations with cocoa, animal feed (not including un milled cereals), edible products and preparations, alcoholic beverages, non-alcoholic beverages, solid vegetable fats, soft oils, animal and vegetable fats, oils. Research specialization in international trade of goods processed food sector using the GL index, we conclude that we have represented and the inter-and intra-industry exchange, which indicates the absence of imports for individual products, but also increase the openness of those products where the present intra-industry trade. Application of modified Sm index, measuring the comparative advantage of exports processed food sector, we found that the same manufacture of the products (which have a comparative advantage as measured by the RCA index) have a positive comparative advantage, but rank much higher.
In terms of the development of cooperation with the countries of the Danube region, as well as the increasing demand for quality products of the food industry exports of agricultural and food products Serbian gains in importance. Improvement the level of competitiveness of the food industry in Serbia was positively influenced by: a stable environment and macroeconomic stability, developed market inputs and equipment, restitution market chains, development of farmers’ awareness of the role and importance of market forces. The areas

690 EP 2014 (61) 3 (677-693)
Svetlana Ignjatijević, Miroslav Čavlin, Dragomir Đorđević
of activity in order to improve the competitiveness of the food industry in Serbia is primarily an increase in productivity of agricultural production, horizontal and vertical integration of companies in agribusiness, construction of new and improvement of existing irrigation systems, the application of the latest scientific and technical achievements in the field of agriculture, greenfield and brownfield investments into processing capacity.
While we research, the so-called “ex post” analysis of the competitiveness of the food industry, we found that a significant number of products has a positive comparative advantage in exports is needed in the coming period taken a series of measures for further improvement of the status of the product processed food sector. It is necessary to intensify the financing of production for export, market research and promotion of export of agricultural products. Finding alternative models for financing small farmers by forming savings - credit cooperatives and the formation of the Development Bank for lending to agriculture as the way to solve the lack of financial resources. It is necessary to create conditions for the enlargement of (min 5 ha) and incentives for farmers who increasing possessions. In order to reduce the grey market it is necessary to establish a collection of distribution centers and wholesale markets to build regional centers. Finally, we can conclude that we have defined products to can be holders of increasing exports and improving the competitiveness of the food industry in Serbia in the international market.
Literature
1. Affortunato, F., Ciommi, M., Furia, D., Voccaro, E. (2010): International Specialization And Vertical Differentiation, The Journal of the Faculty of Economics, Economic, Vol. 1, No. 1, pp. 146-150, University of Oradea, Faculty of Economics, Oradea, Romania.
2. Arsić, S., Čavlin., M. (2013): Analysis of organic agriculture and its significance in terms of enviroment protection in Serbia, International Scientific Conference „Sustainable agriculture and rural development in terms of the Republic of Serbia strategic goals realization within the Danube region“ - achieving regional competitiveness, Thematic Proceedings, pp. 1176-11193, IAE Belgrade, online at http://mpra.ub.uni-muenchen.de/52472/
3. Balassa, B. (1965): Trade Liberalization and Revealed Comparative Advantage, The Manchester School, vol. 33, pp.99-123, John Wiley & Sons Ltd and The University of Manchester, UK.
4. Ballance, R. H., Forstner, H., Murray, T. (1987): Consistency Test of Alternative Measures of Comparative Advantage, The Review of Economics and Statistics, Vol. 69, No. 1, pp. 157-161, The MIT Press, Cambridge, UK.
5. Belová, A., Smutka, L., Rosochatecká, E., Bazina, A. (2012): Competitiveness of Domestic Production of Poultry Meat on the EU Market and on the World Market; Agris on-line Papers in Economics and Informatics, Vol. 4, No. 4, Czech University of Life Sciences Prague, Faculty of Economics and Management, Papers in Economics and Informatics, Prague, Czech Republic.
6. Bojnec, Š., Fertö, I. (2007): Comparative advantages in agro-food trade of Hungary, Croatia and Slovenia with the European Union, Leibniz Institute of Agricultural Development in Central and Eastern Europe (IAMO), Discussion paper No. 106,

691EP 2014 (61) 3 (677-693)
MEASUREMENT OF COMPARATIVE ADVANTAGES OF PROCESSED FOOD SECTOR OF SERBIA IN THE INCREASING THE EXPORT
Halle, Germany.7. Bojnec, Š., Majkovič, D., Turk, J. (2005): Trade types in Slovenian primary and processed
agricultural trade, Paper prepared for presentation at the XI EAAE Congress - The Future of Rural Europe in the Global Agri-Food System, August 24-27, Copenhagen, pp. 24-27.
8. Buturac, G. (2008): Komparativne prednosti i izvozna konkurentnost hrvatske prerađivačke industrije, Ekonomska istraživanja, Vol. 21, No. 2, pp. 47-59, Sveučilište Jurja Dobrile u Puli, Pula, Republika Hrvatska.
9. Buturac, G. (2009): Regionalne sličnosti i razlike strukture međunarodne trgovine u Hrvatskoj, Zbornik Ekonomskog fakulteta u Zagrebu, Vol. 7, No. 1, pp.1-16, Zagreb, Republika Hrvatska.
10. Buturac, G., Lovrinčević, Ž., Mikulić, D. (2010): Macroeconomic Performance, Trade and Competitiveness of South-East European Countries, The Western Balkans Policy Review, Vol. 1, No. 1, Kosovo Public Policy Center, Prishtina, Republic of Kosovo.
11. Fertö, I., Hubbard, L. J. (2002): Revealed comparative advantage and competitiveness in Hungarian agri–food sectors, KTK/IE Discussion Papers 2002/8, Institute of Economics, Hungarian Academy of Sciences, Budapest, Hungary.
12. Fertö, I., Hubbard, L. J. (2001): Regional comparative advantage and competitiveness in Hungarian agri-food sectors, 77 EAAE Seminar / NJF Seminar No. 325, August 17-18, Helsinki, pp. 1-13.
13. Gagović, N. (2003): Komparativne prednosti izvoza Srbije i Crne Gore, Privredna izgradnja, Savez ekonomista Vojvodine, Vol. 46, No. 3-4, pp.153-175, Novi Sad, Republika Srbija.
14. Grubel, H., Lloyd, P. (1975), Intra-industry Trade: The Theory and Measurement of International Trade in Differentiated Products, Wiley, New York, USA.
15. Ignjatijević, S., Matijašević, J., Milojević, I. (2014): Economic analysis of Competitiveness Processed food sector - A case study for the Danube Countries, Jökull Journal, Vol. 64, No. 3, pp. 83-104, Reykjavik, Iceland.
16. Ignjatijević, S. (2011): Komparativne prednosti agrara Srbije u spoljnoj trgovini, Doktorska disertacija, Univerzitet Privredna akademija, FIMEK, Novi Sad, Republika Srbija.
17. Ignjatijević, S. (2012): Konkurentnost i specijalizacija prerađivačke industrije Srbije na međunarodnom tržištu, Ekonomija teorija i praksa, Vol. 4, No. 4, pp. 40-48, FIMEK, Novi Sad, Republika Srbija.
18. Ignjatijević, S., Babović, J., Đorđević, D. (2012): Balasa indeks u određivanju komparativnih prednosti poljoprivrednih proizvoda u izvozu, Teme, Vol. 36, No. 4, pp. 1783-1800, University of Niš, Niš, Republika Srbija.
19. Ignjatijević, S., Ćirić, M., Carić, M. (2013): International Trade Structure of Countries from the Danube Region: Comparative Advantage Analysis of Export, Ekonomický časopis, Vol. 61, No. 3, pp. 251-269, Institute of Economic Research of Slovak Academy of Sciences and Institute for Forecasting of Slovak Academy of Sciences, Bratislava, Slovak Republic.
20. Ignjatijević, S., Milojević, I. (2011): Komparativna prednost izvoza poljoprivrednih proizvoda i hrane Srbije i zemalja dunavske regije, Ekonomika poljoprivrede, Vol. 58, SI-1 (1-412), pp. 103-110, BSAAE, Beograd, Republika Srbija.

692 EP 2014 (61) 3 (677-693)
Svetlana Ignjatijević, Miroslav Čavlin, Dragomir Đorđević
21. Ignjatijević, S., Milojević, I. (2012): Competitive food production as a stimulus to economic development in Serbia, International Scientific Meeting „Sustainable agriculture and rural development in terms of the Republic of Serbia strategic goals realization within the Danube region“ - preservation of rural values, Thematic Proceedings, pp. 1496-1512, IAE Belgrade, online at http://mpra.ub.uni-muenchen.de/43195/
22. Ignjatijević, S., Milojević, I., Božić, D. (2010): Economic aspects of Serbian comparative advantages in exports of vegetable matter, Agricultural Economics, Vol. 57, SI. 2, pp. 161-165, BSAAE, Belgrade, Republika Srbija.
23. Majkovič, D., Turk, J., Chevassus Lozza, E. (2006): Agri-food Trade Analysis: Comparison of Slovenia with the Nine new Member States, Journal of Central European Agriculture, Vol. 7, No. 3, pp. 401-408, Faculty of Agriculture, University of Zagreb, Zagreb, Croatia.
24. Malešević, Đ., Čavlin, M. (2009): Poslovna analiza, FIMEK, Novi Sad, Republika Srbija.25. Qineti, A., Rajcaniova, M., Matejkova, E. (2009): The competitiveness and comparative
advantage of the Slovak and the EU agri-food trade with Russia and Ukraine. Agric. Econ.–Czech, Vol. 55, No. 8, pp. 375-383, Czech Academy of Agricultural Sciences, Prague, Czech Republic.
26. Raičević, V., Ignjatijević, S., Matijašević, J. (2012): Economic and legal determinants of export competitiveness of the food industry of Serbia, Industry, Vol. 40, No. 1, pp. 201-226, Economics Institute, Belgrade, Republic of Serbia.
27. Svatoš, M., Smutka, L. (2012): Comparative Advantages of the Czech Agrarian Foreign Trade in Relation to the EU and Third Countries, Acta Universitatis Agriculturae et Silviculturae Mendelianae Brunensis, Vol. 38, No. 4, Mendel University of Agriculture and Forestry, Brno, Czech Republic.
28. Török A., Jambor A. (2013): Agri-food trade of the New Member States since the EU accession, AGRICULTURAL ECONOMICS-ZEMEDELSKA EKONOMIKA, Vol. 59, No. 3, pp. 101-112, Czech Academy of Agricultural Sciences, Prague, Czech Republic.
29. Vollrath, T. L. (1991): A Theoretical Evaluation of Alternative Trade Intensity Measures of Revealed Comparative Advantage, Weltwirtschaftliches Archiv, The Review of World Economics, pp. 265–279, Institute for the World Economy, Kiel, Germany.
30. Vološin, J., Smutka, L., Selby, R. (2011): Analysis of external and internal influences on CR agrarian foreign trade, Agric. Econ – Czech, Vol. 57, No. 9, pp. 422–435, Czech Academy of Agricultural Sciences, Prague, Czech Republic.
693EP 2014 (61) 3 (677-693)
MEASUREMENT OF COMPARATIVE ADVANTAGES OF PROCESSED FOOD SECTOR OF SERBIA IN THE INCREASING THE EXPORT
MERENJE KOMPARATIVNE PREDNOSTI PREHRAMBENO PRERAĐIVAČKOG SEKTORA REPUBLIKE SRBIJE U FUNKCIJI
POVEĆANJA IZVOZA
Svetlana Ignjatijević4, Miroslav Čavlin5, Dragomir Đorđević6
Apstarkt
Predmet istraživanja je analiza komparativne prednosti izvoza proizvoda prehrambeno prerađivačkog sektora, sa ciljem da se definiše položaj prehrambeno prerađivačkog sektora Srbije u odnosu na dunavsku regiju i istaknu proizvodi koji su u ranijem periodu i koji će u narednom periodu biti nosioci izvoza poljoprivrede Srbije. U istraživanju smo primenili sledeće indekse: RXA, RTA, ln RXA, RC, RCA, LFI, GL, Sm. Dinamički smo sagledali kretanje indeksa u periodu od 2005- 2011. Godine. Istražili smo postojanje korelacije RCA indeksa prehrambeno prerađivačkog sektora i primenom Pearsonovog i Spearmanovog indeksa ustanovili koliko RCA varijable međusobno kovariraju. Ustanovili smo da je kod sledećih proizvoda ostvareno povećanje komparativne prednosti izvoza mereno Balassa indeksom: Mleko i proizvodi, Sir i urda, Prekrupa i brašno od ostalih žitarica, Proizvodi od žitarica, brašna, skroba, Povrće, korenje i gomolje, prerađeno, Voće pripremljeno i proizvodi, Šećer, melase i med, Čokolada i ostali prehrambeni proizvodi sa kakaom, Stočna hrana (osim žita u zrnu), Jestivi proizvodi i prerađevine, Bezalkoholna pića, Alkoholna pića, Čvrste biljne masti, ulja’meka’ i Životinjska i biljne masti, ulja.
Ključne reči: Srbija, Dunavska regija, komparativna prednost, prehrambeno prerađivački sektor
4 Doc. dr Svetlana Ignjatijević, FIMEK, Cvećarska 2, 21000 Novi Sad, Telefon: +381 21 400 484, E-mail: [email protected]
5 Doc. dr Miroslav Čavlin, FIMEK, Cvećarska 2, 21000 Novi Sad, Telefon: +381 21 400 484, E-mail: [email protected]
6 Prof. dr Dragomir Đorđević, redovni profesor, FIMEK, Cvećarska 2, 21000 Novi Sad, Telefon: +381 21 400 484, E-mail: [email protected]

Economics of Agriculture, Year 61, No. 3 (553-828) 2014, Belgrade
UDC 338.43:63 ISSN 0352-3462
ECONOMICS OF AGRICULTURE
CONTENT
1. Čolović Vladimir, Mrvić Petrović Nataša CROP INSURANCE – RISKS AND MODELS OF INSURANCE . . . . 561
2. Munćan Petar, Todorović Saša, Munćan Mihajlo PROFITABILITY OF FAMILY FARMS DIRECTED AT CROP PRODUCTION . . . . . . . . . . . . . . . . . . . . . . . . . . . . . . . . . . . . . 575
3. Njegomir Vladimir, Tepavac Rajko, Obradović Miloje AGRICULTURAL INSURANCE UNDER THE SOLVENCY II DIRECTIVE . . . . . . . . . . . . . . . . . . . . . . . . . . . . . . . . . . . 587
4. Pavlović Sanja, Čavlin Gordana COMPETITIVENESS OF DESTINATIONS WITHIN THE RURAL TOURISM CLUSTER: ZLATAR, ZLATIBOR . . . . . . . . . 603
5. Stratan Alexandru MOLDOVAN AGRI-FOOD SECTOR DILEMMA: EAST OR WEST? . . . . . 615
6. Szőllősi László, Szűcs István, Nábrádi András ECONOMIC ISSUES OF BROILER PRODUCTION LENGTH . . . . . . . . . 633
7. Bešić Cariša, Ćoćkalo Dragan, Đorđević Dejan, Bogetić Srđan THE ANALYSIS OF ASPECTS OF FOOD INDUSTRY COMPETITIVENESS IN SERBIA . . . . . . . . . . . . . . . . . . . . . . 647
8. Doitchinova Julia, Stoyanova Zornitsa ACTIVATION OF LOCAL COMMUNITIES FOR DEVELOPMENT OF RURAL AREAS . . . . . . . . . . . . . . . . . . . . 661
9. Ignjatijević Svetlana, Čavlin Miroslav, Đorđević Dragomir MEASUREMENT OF COMPARATIVE ADVANTAGES OF PROCESSED FOOD SECTOR OF SERBIA IN THE INCREASING THE EXPORT . . . . . . . . . . . . . . . . . . . . . . . . 677
10. Nikolić Vladimir, Ivaniš Marko, Stevović Ivan INNOVATION OF ORGANIZATION MODEL FOR INTEGRAL RURAL DEVELOPMENT - SERBIA CASE STUDY . . . . . . . . . . . . 695

Economics of Agriculture, Year 61, No. 3 (553-828) 2014, Belgrade
11. Pavlović Vladan, Cvijanović Janko, Milačić Srećko REPORTING ON THE REASONS FOR THE ACQUISITION OF OWN SHARES . . . . . . . . . . . . . . . . . . . . . . . . . . . . . . . . . . 707
12. Petrović Zdravko, Manojlović Dragan, Jović Vojislav LEGAL PROTECTION OF LAND FROM POLLUTION . . . . . . . . . . 723
13. Popović Vesna, Kljajić Nataša, Subić Jonel NEGOTIN LOWLAND IRRIGATION SYSTEM UPGRADING . . . . . . . 739
14. Puzić Goran, Klevernić Aleksandar, Pavlović Zoran THE COMMON AGRICULTURAL POLICY THROUGH REFORMS TOWARD EUROPE 2020 . . . . . . . . . . . . . . . . . . . . . . . . . . . . . . 759
15. Veselinović Branislav, Drobnjaković Maja QUALITATIVE AND QUANTITATIVE ANALYSIS OF MICRO AND MACRO ASPECTS OF AGRICULTURAL FINANCE . . . . . . . . . 771
16. Vujko Aleksandra, Gajić Tamara THE GOVERNMENT POLICY IMPACT ON ECONOMIC DEVELOPMENT OF TOURISM . . . . . . . . . . . . . . . . . . . . . . . . 789
17. Vukelić Nataša, Rodić Vesna FARMERS’ MANAGEMENT CAPACITIES AS A SUCCESS FACTOR IN AGRICULTURE: A REVIEW . . . . . . . . . . . . . . . . . . 805