Embed Size (px)
Citation preview

Measurement of Electrostatic Dissipation on GRS for LISA / LPF
F. Antonucci, A. Cavalleri, R. Dolesi, M. Hueller, D. Nicolodi, H. B. Tu, S. Vitale, and W. J. Weber
University of Trento and INFN, Italy
1
Istituto NazionaleDi Fisica Nucleare

9thLISA
Sym
posium
, Jun
. 21~25
, 201
2, Paris
Measurement of Electrostatic Dissipation on GRS Istituto NazionaleDi Fisica Nucleare
/20Hai‐Bo Tu
Content
1. Electrostatic dissipation noise on GRS
2. New measurement challenge with two
techniques
3. Discussion and implication to LISA
2
9thLISA
Sym
posium
, Jun
. 21~25
, 201
2, Paris
Measurement of Electrostatic Dissipation on GRS Istituto NazionaleDi Fisica Nucleare
/20Hai‐Bo Tu
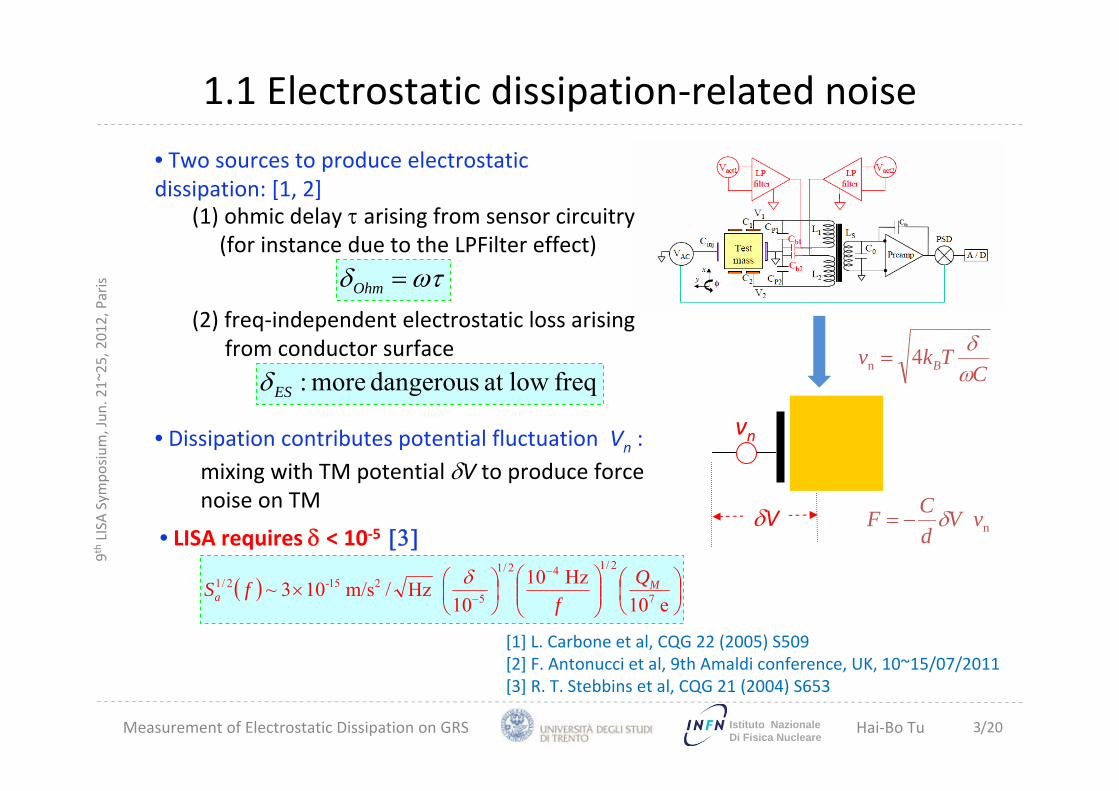
1.1 Electrostatic dissipation‐related noise
n vVdCF δ−=
• Two sources to produce electrostatic dissipation: [1, 2]
• Dissipation contributes potential fluctuation Vn :
CTkv B ω
δ4n =
• LISA requires δ < 10‐5 [3]
[1] L. Carbone et al, CQG 22 (2005) S509[2] F. Antonucci et al, 9th Amaldi conference, UK, 10~15/07/2011[3] R. T. Stebbins et al, CQG 21 (2004) S653
vn
δV
3
ωτδ =Ohm
freqlow at dangerous more :ESδ
( ) ⎟⎠⎞
⎜⎝⎛
⎟⎟⎠
⎞⎜⎜⎝
⎛⎟⎠⎞
⎜⎝⎛×
−
− e 01 Hz10
10 Hz/m/s 103~ 7
2/142/1
5215-2/1 M
aQ
ffS δ
(1) ohmic delay τ arising from sensor circuitry (for instance due to the LPFilter effect)
(2) freq‐independent electrostatic loss arising from conductor surface
mixing with TM potential δV to produce force noise on TM

9thLISA
Sym
posium
, Jun
. 21~25
, 201
2, Paris
Measurement of Electrostatic Dissipation on GRS Istituto NazionaleDi Fisica Nucleare
/20Hai‐Bo Tu
1.2 Dissipation model
Actuation / Sensing Circuitry(ohmic losses δohm)
Intrinsic surface losses(model for freq‐ind δΕS) *
Ideal test mass (electrode capacitance C)
( )( ) dC
CCC
MINMAXe
eES
1)ln(2Re
Im∝≈≡
Δ ττπδ
( ) 11221 CRCRR ++≈τ
ωτδ =Ohm
* S. Vitale and C. C. Speake, Proc 2nd Int. LISA Symp., AIP Conf. Proc. 456 (1998)* C. C. Speake, et al, Physics Letters A 263 (1999)
( ) ( )( )
[ ]MAXMINMAXMINMAX
MIN
MAXMINMAX
MINMAX
iC
CCi
iCi
Z
τωτωτπττ
πω
ωτωτωτωτ
ττωδ
<<<<⎟⎠⎞
⎜⎝⎛ +⎥
⎦
⎤⎢⎣
⎡≈
⎪⎭
⎪⎬⎫
⎪⎩
⎪⎨⎧
⎥⎦
⎤⎢⎣
⎡
++
+−=
−
Δ
−−
Δ
1
2
211
ln2)ln(2
1
11ln
21tantan
)ln(1
4
MAXiMIN CR τττ <<=<< Δ
δωω ZCiCi e+= 11
21d
Fele ∝

9thLISA
Sym
posium
, Jun
. 21~25
, 201
2, Paris
Measurement of Electrostatic Dissipation on GRS Istituto NazionaleDi Fisica Nucleare
/20Hai‐Bo Tu
1.3 Recent measurements on electrode noise (2012)
5
vn
δV⎟⎟⎠
⎞⎜⎜⎝
⎛×⎟⎟
⎠
⎞⎜⎜⎝
⎛×≈
∂∂
= ΔΔ 1/2
2/1
71/22/12/1
V/Hz 100 10fN/Hz 3.1
μx
x
Se
qS
xC
Cq
ST
F
• In general, noisy electrostatic potentials mix with DC voltage differences –such as that caused by TM charging – to create force noise
• Recent experimental upper limit on Dx of 80 mV / Hz1/2 at 1 mHz *
marginally OK for LISA
• δ = 10‐5 would give 20 mV / Hz1/2 at 0.1 mHz
* F. Antonucci et al, PRL 108 181101 (2012)* R. Dolesi, talk on 9th LISA Symp., Paris, 2012

9thLISA
Sym
posium
, Jun
. 21~25
, 201
2, Paris
Measurement of Electrostatic Dissipation on GRS Istituto NazionaleDi Fisica Nucleare
/20Hai‐Bo Tu
1.4 Previous measurements on surface loss (2005)
Tech: directly measure transient force due to dissipation by square wave modulation [1, 2]
[1] L. Carbone, PHD thesis, 2005[2] L. Carbone et al, CQG 22 (2005) S509–S519
6
• Results: For 1W2E pair, δ = ( ‐0.3±1.0)*10‐7For 2W1E pair, δ = (10.6±0.6)*10‐7
•Motivation of next step: investigate dielectric loss for LPF
GRS flight model with higher precision
2E
1E
2W
1W
Square mod and Comp voltages
Transient force and loss extraction
‐Vcom
Vcom
Object: A GRS prototype, Au‐coated Mo electrodes, 2 mm capacitive gap

9thLISA
Sym
posium
, Jun
. 21~25
, 201
2, Paris
Measurement of Electrostatic Dissipation on GRS Istituto NazionaleDi Fisica Nucleare
/20Hai‐Bo Tu
0 2 4 6 8 10-2
-1.5
-1
-0.5
0
0.5
1
1.5
2
time
ampl
itude
0 1 2 3 4 5 6 7
2
4
6
8
10
12
x 10-8
1/τ
(1/s
)
-ΓES (nN m / rad)
3 free parameter (δ F,δ ES,τv-1)
2 free parameter (δ F = 0,δ ES,τv-1)
2 free parameter (δ F,δ ES=0,τv-1)
2 free parameter (δ F,δ ES,τv-1 measured)
VBIASX
VBIASXY
VBIASno-inj
2.1 Measurement with ringdown tech (2010~2012)
Tech1: measure pendulum amplitude decay as a function of electrode voltages
( )( )ESESFF
ESFvexp
111 δδττ
⋅Γ−⋅Γ⋅Γ+Γ
+=I
Viscousdamping
fiber damping
Electrostaticdamping
Fit condition
δES
(10−7)δF
(10−7 )1/τv
(10−8 /s)χ2 Remark
3 free parameters
7.6(7.5)
-4(12)
1.1(1.6)
1.2 (20 DOF)
Physical
Assuming 1/τv only from gas
4.5(1.3)
8.7(.4) 0.43 1.2
(21 DOF)Physical
AssumingδES =0
-- 16(.03)
-.5(.3)
1.2(21 DOF)
Not physical
7
Result: upper limit of δES 1.5*10−6.
Object: A LPF flight model, Au‐coated electrodes, 4 mm capacitive gap along x
C4
C3
C2
C1
Bias DC voltages
Decay time extraction
V1
V2
V3
V4

9thLISA
Sym
posium
, Jun
. 21~25
, 201
2, Paris
Measurement of Electrostatic Dissipation on GRS Istituto NazionaleDi Fisica Nucleare
/20Hai‐Bo Tu
2COMVCNDC ϕ∂
∂≡
( )∑=oddj
MM
MOD tjVV
,
sin4 ωπ
* L. Carbone et al, 6th Amaldi, Japan, 2005
Tech2: Use perfect Square Wave modulation (ideally gives constant torque proportional to V2), delays due to lossy elements cause force transients proportional to delta at every square wave transition *
8
2.2 Measurement with modulation tech (2011~2012)
C4
C3
C2
C1
Square mod and Com voltages
Circuit and surface losses (τ & δES)
‐Vcom
Vcom
Ideal SW to one diagonal pair
Compensation voltages to the other pair
• +/- Vcom and out of phase square wave applied to diagonal pairs, to avoid the change of TM potential• enable to measure circuit loss and surface loss τ & δES together• Huge DC torque (~10-10 N m) cancelled, small transient torque left (~10-17 N m ↔ δES~10-7) for losses extraction
Huge DC torque cancelled Small transient torque left

9thLISA
Sym
posium
, Jun
. 21~25
, 201
2, Paris
Measurement of Electrostatic Dissipation on GRS Istituto NazionaleDi Fisica Nucleare
/20Hai‐Bo Tu 9
2.3 Illustration of measured signalElectrode voltage:
No losses
Ohmic delay
Frequency independent δ
Resulting torque (∝V2):
• 2f signal (+ other even harmonics)• Nearly “Dirac δ-function” for ohmic delay (all cosine)• Longer lived signal for frequency independent δΕS (both sine and cosine)
( )( ) ( ) ( )ttf
jjjj
NN
MMjDC
f ωπ
δωτππ
δ 2sin 41 2cos 8 2
2ln24 2
ESModd ,
2
ES2
⎥⎥⎦
⎤
⎢⎢⎣
⎡⎟⎠⎞
⎜⎝⎛⋅+
⎥⎥⎦
⎤
⎢⎢⎣
⎡+⎟⎟
⎠
⎞⎜⎜⎝
⎛+
+⎟⎠⎞
⎜⎝⎛⋅≈
−∑
≈0.681 =1( )
( ) ( ) ( )ttfjj
jjNN
MMjDC
f ωπ
δωτππ
δ 4sin 432 4cos 8
33ln
44ln24 2
ESModd ,
2
ES4
⎥⎥⎦
⎤
⎢⎢⎣
⎡⎟⎠⎞
⎜⎝⎛⋅+
⎥⎥⎦
⎤
⎢⎢⎣
⎡+⎟⎟
⎠
⎞⎜⎜⎝
⎛−
++
⎟⎠⎞
⎜⎝⎛⋅≈
−∑
≈0.574 ≈0.67

9thLISA
Sym
posium
, Jun
. 21~25
, 201
2, Paris
Measurement of Electrostatic Dissipation on GRS Istituto NazionaleDi Fisica Nucleare
/20Hai‐Bo Tu
2.4 Sensitivity requirements
10
For resolution δES= 10-7
with VM = 8 V need 2f torque resolution 0.02 fNmNoise of current TP ~ 1 fNm/Hz1/2 @ 1mHz10000 s statistical resolution 0.01 fNm @ 1mHz
External torque noise of TP with fused silica fiber
10-3 10-2
10-1
100
101
S N1/2 (f
N m
/ H
z1/2 )
Frequency (Hz)

9thLISA
Sym
posium
, Jun
. 21~25
, 201
2, Paris
Measurement of Electrostatic Dissipation on GRS Istituto NazionaleDi Fisica Nucleare
/20Hai‐Bo Tu
2.5 Experimental noises and suppression
11
Challenges and solutions:• Actuation filter gives 400 μs ohmic delay (δ 10-5 at 3 mHz)
Short filter (and also 100 kHz injection, readout transformer circuitry, also responsible for 2f force transients)
• Large DC bias torque signals at odd harmonics (non-linear coupling into 2f/4f/6f signal)
Correct mod electrode potential difference to < 1 bit resolution+/- 150 μV still gives 3 fNm signal
Compensation of mean electrode potential to null translation dependence• AC detector non-linearities, semi-periodic jumps of up to 100 nrad (1 fN m)
Calibrate and correct in data pre-processing• Modulation of electrostatic stiffness at 1f mixes with DC bias signals to give 2f signal
Measure period difference, correct stiffness in time domain torque extraction
• Vm modulates VTM when off-centred, fake delta signal due to switch of VTM (∆x = 50 um ↔ δ = 3e-8)
Calibrate and correct in data post-processing

9thLISA
Sym
posium
, Jun
. 21~25
, 201
2, Paris
Measurement of Electrostatic Dissipation on GRS Istituto NazionaleDi Fisica Nucleare
/20Hai‐Bo Tu 12
2.6 Experimental transient torque
• Tests for both pairs: fM = 1.25 mHz, VM = 8 V, integral time > 80 h;
• Get the averaged transient torque and compare with theoretical prediction ;
• The signal form is as expected for model!
(model works well, δES ~3e‐7)
0 500 1000 1500-0.6
-0.4
-0.2
0
0.2
0.4
0.6
time (s)
torq
ue (f
Nm
)
averaged residual torque (1N/2S pair, 200 modulation cyc)
averaged torqueafter LPFilter (fcut=10mHz)
VMOD (f=1.25mHz,amp=8V)
theroretical Prediction ( δES=3.48e-7)
TMOD
0 500 1000 1500
-0.2
0
0.2
0.4
0.6
0.8
time (s)
torq
ue (f
Nm
)
averaged residual torque (1S/2N pair, 368 modulation cyc)
averaged torqueafter LPFilter (fcut=10mHz)
VMOD (f=1.25mHz,amp=8V)
theroretical Prediction ( δES=3.32e-7)
TMOD

9thLISA
Sym
posium
, Jun
. 21~25
, 201
2, Paris
Measurement of Electrostatic Dissipation on GRS Istituto NazionaleDi Fisica Nucleare
/20Hai‐Bo Tu 13
2.7 Torque demodulation and δ extraction
4.767 4.768 4.769 4.77 4.771x 10⁷
-0.3
-0.2
-0.1
0
0.1
0.2
dem
od to
rque
(fN
m)
Time (s)
3-Nov-2011, run#289, VMOD
= 8 V on 1N/2S, fMOD
= 0.65 m
2f-cos2f-sin
(1) Several tests at different freq in [0.2 2] mHz,
(2) For each run, demod sin/costorque for 2f/4f/6f
(3) Fit to sin torque of one group to get δES and fit to cos torque to get both δES and τ
Data Process:
Result: δES and τ from different harmonics consistent in 2σ
…
2f-cos 2f-sin 4f-cos 4f-sin 6f-cos 6f-sin one-fit0
1
2
3
4
5 x 10⁻⁷
δ ES
1N2S: group101
2f-cos 4f-cos 6f-cos one-fit-2
-1
0
1
2
3x 10⁻⁵
τ (s
)
1N2S: group101

9thLISA
Sym
posium
, Jun
. 21~25
, 201
2, Paris
Measurement of Electrostatic Dissipation on GRS Istituto NazionaleDi Fisica Nucleare
/20Hai‐Bo Tu 14
dCC
MINMAXES
1)ln(2
∝≈Δ ττ
πδ
2.8 Investigation of dependence of delta on gap
• Purpose for further study:(1) Experimentally study if δES proportional to C, compare with theoretical analysis
→ Rotate housing (or TM) to change capacitance(2) Test δES in different freq to see if δES freq‐ind
→ test at different fMOD as wider as our experimental resolution allows
d1N2S ↓, δ1N2S↑
rotating housing clockwise
For each diagonal pair, test δES at three configurations:
2N
1N
2S
1S
V1S
V2S
V1N
V2N
ϕ
ϕ=0 ϕ=30mrad
d0=4mm∆d≈0.4mm ϕ=‐30 mrad

9thLISA
Sym
posium
, Jun
. 21~25
, 201
2, Paris
Measurement of Electrostatic Dissipation on GRS Istituto NazionaleDi Fisica Nucleare
/20Hai‐Bo Tu 15
Pair τt (μs)* τe (μs)
1N/2S 3.4 ‐1.6(0.7)
2N/1S 3.4 3(1)
2.9 Result of residual τ
* residual ohmic delay from slew rate of mod switch
Result:• residual τ consistent with theoretical expectation in few σ;• δES is freq‐independent in freq range tested• for 1N2S, there still some systematic error
For each pair, fit all data from all three configurations:
⎟⎟⎠
⎞⎜⎜⎝
⎛ Δ⎟⎠⎞
⎜⎝⎛×≈Δ −
μs .43mHz 1102 M8 τδ f
0.5 1 1.5 20
0.1
0.2
0.3
0.4
0.5
0.6
0.7
δ ES *
106
fMOD (mHz)
1N2S: group101
τ = 3.3 μs
0.2 0.4 0.6 0.8 1 1.2 1.40
0.1
0.2
0.3
0.4
0.5
0.6
δ ES *
106
fMOD (mHz)
2N1S: group121
τ = -0.8 μs
9thLISA
Sym
posium
, Jun
. 21~25
, 201
2, Paris
Measurement of Electrostatic Dissipation on GRS Istituto NazionaleDi Fisica Nucleare
/20Hai‐Bo Tu
0 0.2 0.4 0.6 0.8 1 1.2 1.40
1
2
3
4
capacitance (pF)
freq
-ind
δ ES *
107
2N/1S
slope = 2.52(0.04)e-7 /pFchi2 = 3.4 (2 DOF)
0 0.2 0.4 0.6 0.8 1 1.2 1.40
0.5
1
1.5
2
2.5
3
3.5
capacitance (pF)
freq
-ind
δ ES *
107
1N/2S
slope = 2.44(0.03)e-7 /pFchi2 = 1.1 (2 DOF)
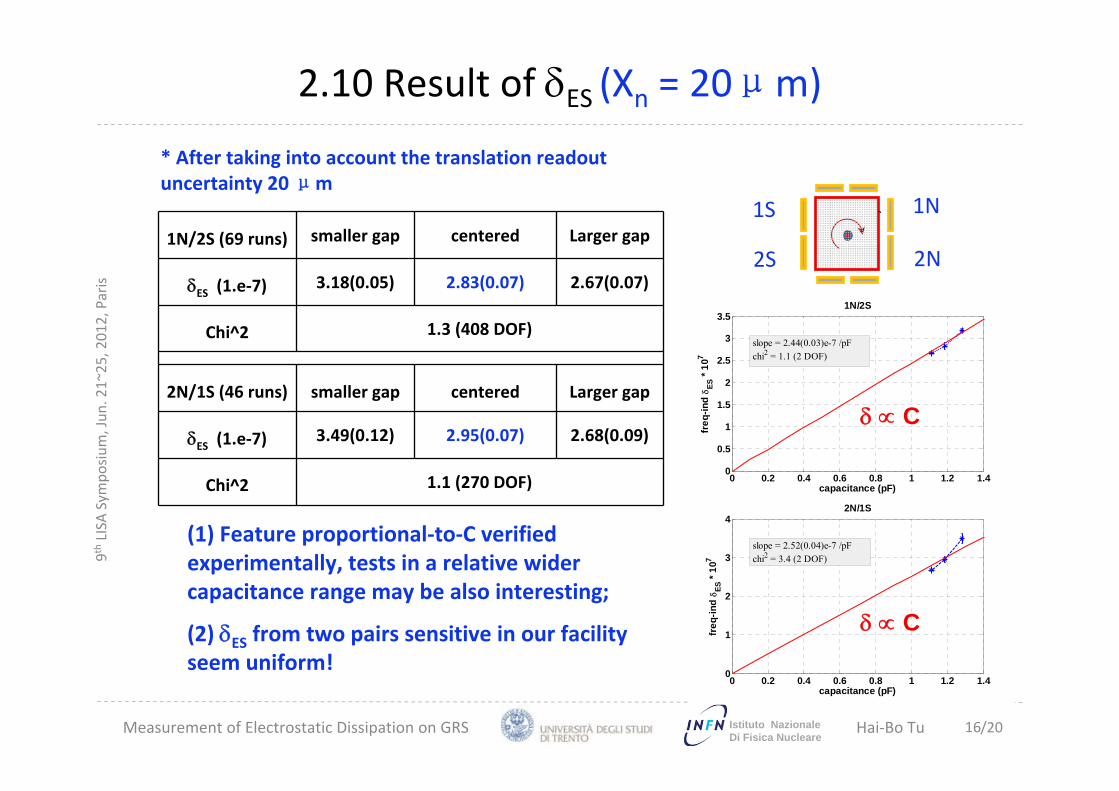
2.10 Result of δES (Xn = 20μm)
1N/2S (69 runs) smaller gap centered Larger gap
δES (1.e‐7) 3.18(0.05) 2.83(0.07) 2.67(0.07)
Chi^2 1.3 (408 DOF)
2N/1S (46 runs) smaller gap centered Larger gap
δES (1.e‐7) 3.49(0.12) 2.95(0.07) 2.68(0.09)
Chi^2 1.1 (270 DOF)
16
(1) Feature proportional‐to‐C verified experimentally, tests in a relative wider capacitance range may be also interesting;
(2) δES from two pairs sensitive in our facility seem uniform!
* After taking into account the translation readout uncertainty 20 μm
1S
2N2S
1N
δ ∝ C
δ ∝ C

9thLISA
Sym
posium
, Jun
. 21~25
, 201
2, Paris
Measurement of Electrostatic Dissipation on GRS Istituto NazionaleDi Fisica Nucleare
/20Hai‐Bo Tu
3.1 Discussion: possible sources of δES
Position When TM is centered
2N/1S46 runs
(before venting)8 runs
(after venting)
δES (1.e‐7) 2.95(0.07) 3.16(0.09)
τe (μs) 3(1) ‐8(3)
Chi^2 1.1 (270 DOF) 1.3 (46 DOF)
17
Result:
(1) Tests are basically reproducible, δES before/after venting consistent in 2σ (difference only 5%)
(2) δES should not arise from the surface layers condense quickly from lab atmosphere
* Before venting: GRS kept staying in 3 10‐6 Pa for more than two years* Venting: venting chamber to lab atmosphere for three days by a φ2.5 cm tube of length ~ 30 cm (to absorb dielectric)* After venting: pump chamber to pressure lower than 10‐5 Pa
0.8 1 1.22
2.5
3
3.5
4
capacitance (pF)
freq
-ind
δ ES
2N/1S
Before ventingfit to δ = k*CAfter venting
*10-7

9thLISA
Sym
posium
, Jun
. 21~25
, 201
2, Paris
Measurement of Electrostatic Dissipation on GRS Istituto NazionaleDi Fisica Nucleare
/20Hai‐Bo Tu 18
d
t( )εδεε jrr −= 10�
( )
( )dtdt
tttd
r
r
<<⋅≈
⋅+−
=
ES
εδε
δδ
ε
ε
δES = 2.9e-7, d = 4 mmεr ~ 8, δε ~ 0.01, t ~ 1 μm
0
50
100
0
0.005
0.0110-2
100
102
εr
δES=2.9e-7
δε
thic
knes
s ( μ
m)
Materials * εr δε(10‐4) t (μm)
Fused quartz 3.8 10 (@50Hz) 4.4
Alumina 8.5 20 (@50Hz) 4.9
Air 1 100? 0.12
*http://www.kayelaby.npl.co.uk/general_physics/2_6/2_6_5.html
Assuming some dielectric materials absorbed by conductor surface:
Unlikely that a surface absorbate could be so thick! Need more study …
3.1 Discussion: possible sources of δES

9thLISA
Sym
posium
, Jun
. 21~25
, 201
2, Paris
Measurement of Electrostatic Dissipation on GRS Istituto NazionaleDi Fisica Nucleare
/20Hai‐Bo Tu
3.2 Summary
(1) 1N2S pair: δES = (2.83±0.07)×10‐7
2N1S pair: δES = (2.95±0.07)×10‐7
Loss angle from delay: δohm < 2.5×10⁻⁸ (at 1 mHz)
For LISA, force noise due to the loss lower than 0.1 fm/s2/Hz1/2 near 1mHz
(2) Torque wave form due to the losses obeys model very well
(3) The tests varying gap: δ ∝ C (match model well)
(4) δ is freq‐independent in freq range tested (match model well)
(5) δ unchanged by venting to air for three days
(6) What causes δ? Need more study …
19
0 500 1000 1500-0.6
-0.4
-0.2
0
0.2
0.4
0.6
time (s)
δ co
ntrib
utio
n to
rque
(fN
m)
averaged residual torque (1N/2S electrodes,from 200 modulation cyc)
averaged torqueafter LPFilter (fcut=10mHz)
VMOD (f=1.25mHz,amp=8V)
theroretical Prediction ( δES=3.48e-7)
TMOD

20
Thank you!Any questions are welcome!
9thLISA
Sym
posium
, Jun
. 21~25
, 201
2, Paris
Measurement of Electrostatic Dissipation on GRS Istituto NazionaleDi Fisica Nucleare
/20Hai‐Bo Tu
980 990 1000 1010 1020 1030
-0.1
-0.05
0
0.05
0.1
absolute φ (μrad)
resi
dual
φ ( μ
rad)
Residual err comparison for all runs
run #13 start file #3906run #19 start file #4038run #20 start file #4152run #21 start file #4176
Shift along xmainly caused byground tilt, can befurther correctedby eta output of AC
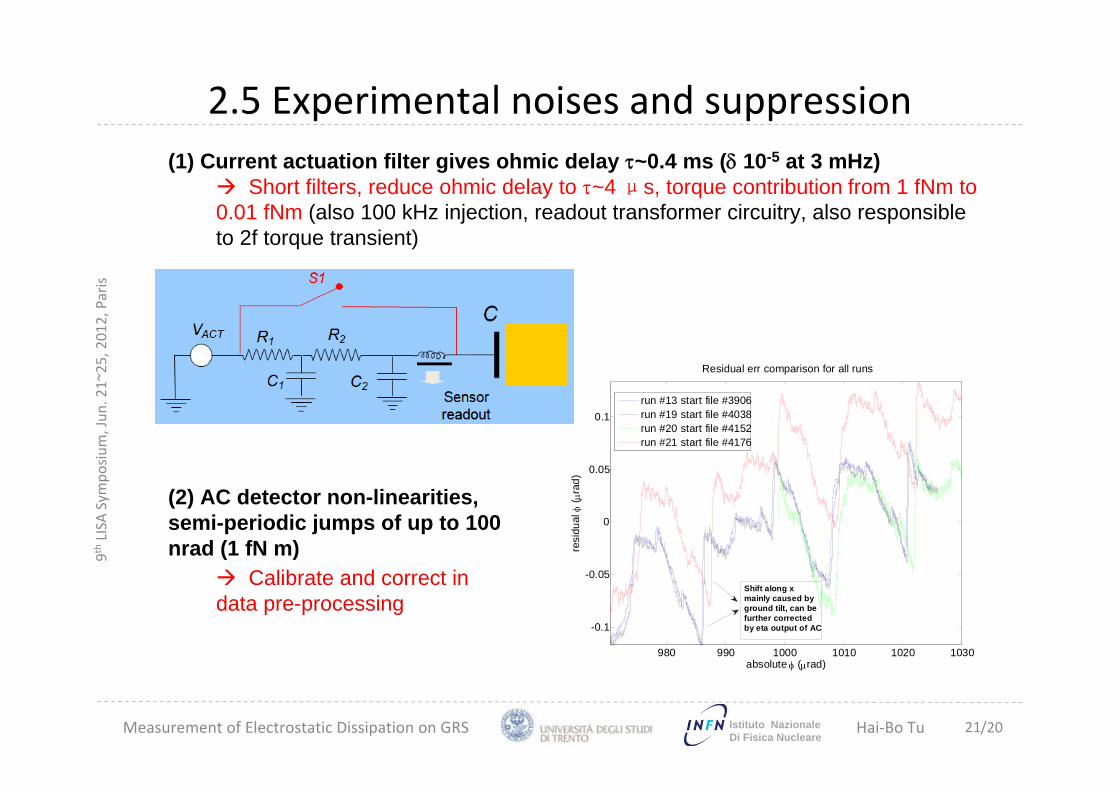
2.5 Experimental noises and suppression(1) Current actuation filter gives ohmic delay τ~0.4 ms (δ 10-5 at 3 mHz)
Short filters, reduce ohmic delay to τ~4 μs, torque contribution from 1 fNm to 0.01 fNm (also 100 kHz injection, readout transformer circuitry, also responsible to 2f torque transient)
(2) AC detector non-linearities, semi-periodic jumps of up to 100 nrad (1 fN m)
Calibrate and correct in data pre-processing
21

9thLISA
Sym
posium
, Jun
. 21~25
, 201
2, Paris
Measurement of Electrostatic Dissipation on GRS Istituto NazionaleDi Fisica Nucleare
/20Hai‐Bo Tu
4.61 4.612 4.614 4.616x 10⁷
0.35
0.4
0.45
0.5
0.55
δ V 2N
- δ
V 1S (m
V)
Time (s)
16-Oct-2011, run#264, VMOD = 9.132 V on 2N/1S, fMOD = 0.2 mH
Harmonic 1Harmonic 3Harmonic 5
4.61 4.612 4.614 4.616x 10⁷
1040
1050
1060
1070
1080
1090
1100
time (s)
φ AC
( μra
d)
Residual correction with model #22
3.6575 3.658 3.6585 3.659 3.6595 3.66 3.6605 3.661x 10⁷
669
669.5
670
670.5
671
671.5
672
672.5
673
673.5
time (s)
perio
d (s
)
#9 for group15,VMOD=8V,1N/2S,filter
for first half fitfor second half fitmean of T0rising edgetrailing edge
(3) Large DC bias torque signals at odd harmonics (non-linear coupling into 2f/4f/6f signal)
Carefully compensate stray DC bias of electrodes, minimize variable torque at odd harmonics (Correct mod electrode potential difference to < 1 bit resolution +/- 150 μV still gives 3 fNm signal; Compensation of mean electrode potential to null translation dependence)
( ) ( ) ( ) ( )⎥⎥⎦
⎤
⎢⎢⎣
⎡
∂∂∂
−+⋅−+⎟⎟⎠
⎞⎜⎜⎝
⎛
∂∂
+∂∂
−⋅≈0
2
2100
2
2
021 2)(
xCVVVxxCCVVtsqrVtN TMSNSNM ϕ
δδϕ
ϕϕ
δδωω
22
(4) Modulation of electrostatic stiffness at 1f (ΔΓ ~ 2e-11 Nm/rad) mixes with DC bias signals to give 2f signal
Measure period difference, correct stiffness in time domain torque extraction
2.5 Experimental noises and suppression

9thLISA
Sym
posium
, Jun
. 21~25
, 201
2, Paris
Measurement of Electrostatic Dissipation on GRS Istituto NazionaleDi Fisica Nucleare
/20Hai‐Bo Tu 23
• TM translation has another effect: TM potential fluctuation VTM caused by VMOD. The imperfect switch of VTM on transient moment also produces loss mixing with δES.
( ) ( )[ ] 2VT0T0MM
2
VT0 2 xtsqVtsqVxx
CN Δ∝⋅⋅−Δ⋅∂∂
∂= ωω
ϕ
( )tsqxdVV M
0
MT0
4 ω⋅Δ⋅=
-1000 -500 0 500-10
0
10
20
30
η (μrad)
δ sin *
107
δsin Vs. eta
2f4f6f
-1000 -500 0 500-10
0
10
20
30
40
η (μrad)δ co
s * 10
7
δcos Vs. eta
2f4f6f
C4
C3
C2
C1
‐Vcom
Vcom
Δx VT0
→ calibrate tilt-charge effect, correct in data post-processing. (Near centred position: x=50um ↔ 10%δ)
2.5 Experimental noises and suppression

9thLISA
Sym
posium
, Jun
. 21~25
, 201
2, Paris
Measurement of Electrostatic Dissipation on GRS Istituto NazionaleDi Fisica Nucleare
/20Hai‐Bo Tu
Summary and discussion
Sources damping Q
Residual gas viscous
(fixed)
dβ/dp = 5.6e‐8 Nm/s
(at p = 3.3e‐6 Pa)3,100,000
Dielectric loss
(fixed)δf = 2.9e‐7 26,700,000
Fiber structural loss δES = 9.0(0.3)e‐7 1,020,000 *
Totally 750,000
Dissipations of 1TM torsion pendulum associated with GRS flight model surrounding (suspending by fused silica fiber, Vinj = 3.5 V)
* The rest damping could also come from other sources like magnetic field
(1) The study focus on the dielectric dissipation of GRS flight model(2) Ringdown tech and square‐wave mod tech employed. Final result of δES is 2.9e‐7, with uncertainty lower than 10%, for all electrodes tested. The value implies its contributed noise for LISA is lower than 0.1 fm/s2/Hz1/2. (3) Features proportional‐to‐C and freq‐ind are experimentally tested, and match model very well(4) Dielectric dissipation on the electrodes studied seem have a good uniformity(5) The physical sources and distributions on electrodes of δESneed more study
24

9thLISA
Sym
posium
, Jun
. 21~25
, 201
2, Paris
Measurement of Electrostatic Dissipation on GRS Istituto NazionaleDi Fisica Nucleare
/20Hai‐Bo Tu
3.2 Example of δES and τ extraction
Fitting to all tests from one group to get τ & δES (2N/1S pair, large gap)
Demod even torques for each test (2N/1S pair, large gap, fM = 0.35 mHz)
25
4.525 4.526 4.527 4.528 4.529x 10⁷
-0.2
0
0.2
0.4
0.6
dem
od to
rque
(fN
m)
Time (s)
06-Oct-2011, run#246, VMOD = 7 V on 2N/1S, fMOD = 0.5 mHz
2f-cos2f-sin
4.525 4.526 4.527 4.528 4.529x 10⁷
-0.1
0
0.1
0.2
0.3
dem
od to
rque
(fN
m)
Time (s)
06-Oct-2011, run#246, VMOD = 7 V on 2N/1S, fMOD = 0.5 mHz
4f-cos4f-sin
4.525 4.526 4.527 4.528 4.529x 10⁷
-0.1
-0.05
0
0.05
0.1
0.15
0.2
0.25
dem
od to
rque
(fN
m)
Time (s)
06-Oct-2011, run#246, VMOD = 7 V on 2N/1S, fMOD = 0.5 mHz
6f-cos6f-sin
0.2 0.4 0.6 0.8 1 1.2 1.4 1.6
0.4
0.5
0.6
0.7
0.8
0.9
1
-N2f
-sin
/ N
DC *
106
fMOD (mHz)
torque-demod-analysis
1S / 2N, 7V-Mea. group2031S / 2N, 7V-Fit. group203
0.2 0.4 0.6 0.8 1 1.2 1.4 1.60.2
0.3
0.4
0.5
0.6
0.7
0.8
-N2f
-cos
/ N
DC
* 10
6
fMOD (mHz)
torque-demod-analysis
1S / 2N, 7V-Mea. group2031S / 2N, 7V-Fit. group203
from cos torque: δES & τfrom sin torque: only δESdo the same analysis to
2f/4f/6f torque

9thLISA
Sym
posium
, Jun
. 21~25
, 201
2, Paris
Measurement of Electrostatic Dissipation on GRS Istituto NazionaleDi Fisica Nucleare
/20Hai‐Bo Tu
3.3 Example of preliminary result: 2N1S pair
C Gap Smaller gap(group203: 6 runs)
Centered (group121: 7 runs)
Larger gap(group191: 8 runs)
2f cosine δES = 3.50(0.71)e‐7τ = 4.2(9.5) μschi^2 = 2.0 (4 DOF)
δES = 3.05(0.36)e‐7τ = ‐2.1(5.3)μschi^2 = 1.0 (5 DOF)
δES = 1.84(0.33)e‐7τ = 18.6(5.0)μschi^2 = 2.1(6 DOF)
2f sine δES = 3.6.(0.17)e‐7chi^2 = 0.5(5 DOF)
δES = 3.14(0.12)e‐7chi^2 = 0.5 (6 DOF)
δES = 2.55 (0.13)e‐7chi^2 = 0.9 (7 DOF)
4f cosine δES = 2.73(0.77)e‐7τ = 13.7(8.7)μschi^2 = 0.8 (4 DOF)
δES = 1.50(0.70)e‐7τ = 16.3(7.1)μschi^2 = 0.2 (5 DOF)
δES = 2.15(0.67)e‐7τ = 12.5(6.6) μschi^2 = 1.2 (6 DOF)
4f sine δES = 3.19(0.24)e‐7chi^2 = 0.5 (5 DOF)
δES = 3.05(0.17)e‐7chi^2 = 1.3(6 DOF)
δES = 2.78(0.17)e‐7chi^2 = 1.4(7 DOF)
6f cosine δES = 3.82(1.49)e‐7τ = ‐8.9(13.8)μschi^2 = 1.4 (4 DOF)
δES = 3.68(1.2)e‐7τ = ‐2.0(11.0)μschi^2 = 1.0 (5 DOF)
δES = 2.14(0.92)e‐7τ = 1.0(8.8) μschi^2 = 2.9 (6 DOF)
6f sine δES = 3.56(0.29)e‐7chi^2 = 1.85 (5 DOF)
δES = 3.34(0.25)e‐7chi^2 = 0.7 (6 DOF)
δES = 2.64(0.22)e‐7chi^2 = 1.1(7 DOF)
One‐fit δES = 3.49(0.12)e‐7τ = 3.1(2.6)μschi^2 = 1.1 (34 DOF)
δES = 3.10(0.09)e‐7τ = ‐0.8(2.0)μschi^2 = 1.1 (40 DOF)
δES = 2.58(0.09)e‐7τ = 6.7(1.9)μschi^2 = 1.6 (46 DOF)
26
(1) δES from 2f/4f/6f components consistent in 2σ(2) τ from 2f/4f/6f components consistent in 2σ and close to zero, as expected(3) these features also found on 1N2S pair (the other sensitive diagonal pair)
1S
2N
1S2N
1S2N