Embed Size (px)
Citation preview

Measurement of Fluid Film Thickness on Curved Surfaces by Raman Spectroscopy
ERIK J. HUTCHINSON, DARREN SHU, FRED LaPLANT, and D O R BEN-AMOTZ* Department of Chemistry, Purdue University, West Lafayette, Indiana 47907
The Raman scattering intensity from a polyphenylether fluid film en- trapped between a diamond window and a one-inch-diameter steel ball is found to correlate linearly with fluid film thickness over a 0.1 to 10 #m thickness range. The calibration and precision of the technique, as well as comparisons with other methods, are discussed.
Index Headings: Film thickness; Raman spectroscopy; Tribology.
INTRODUCTION
The thickness of fluid and solid films is often a critical parameter in material design and application. An im- portant example includes the thin fluid films which lu- bricate and prevent wear in rotating mechanical com- ponents. Such films have been measured with the use of interferometry, ellipsometry, X-ray fluorescence, and la- ser fluorescence. ~-7 Raman spectroscopy, on the other hand, has primarily been applied to the chemical char- acterization of thin films, 8-~2 although it has also recently been used to measure the thickness of solid films. 13-~6 Here we demonstrate that Raman scattering may be used to obtain accurate fluid film thickness information, under conditions that resemble those at mechanical ball bear- ings, pistons, and gear contacts.
The basic principle behind the application of Raman scattering to film thickness measurements relies on the fact that the Raman scattering intensity should be pro- portional to the number of molecules in an optical col- lection volume, and thus to the thickness of a fluid sam- ple. In other words, the excitation laser beams acts like a "dip stick" in determining the amount of lubricant present. The diameter of the laser beam (~ 7 ~m in this work) determines the resolution parallel to the fluid film. The Raman scattering efficiency (laser intensity, collec- tion efficiency, etc.) determines the depth resolution of the instrument (~_+0.3 ~m in this work). The propor- tionality between Raman signal intensity and film thick- ness is expected to hold as long as the film is not thicker than the depth of field of the optical system (which in our apparatus is about 100 urn).
A number of previous studies have reported the use of a similar optical film thickness measurement technique based on laser-induced fluorescence. Jullien et al. used laser fluorescence of a trace dye and reported a linear relationship between film thickness and signal intensity, for thicknesses from 1 to 6 urn, with the smallest mea- surement being extrapolated to 0.5 urn. 3 Hoult et al. used a similar fluorescent tracer technique to measure films from 1.5 to 15 um thickness? Lux et al. also used fluo-
Received 1 November 1994; accepted 10 May 1995. * Author to whom correspondence should be sent.
rescence to measure thicker films (100-300 um) in a diesel engine, s and Driscoll et al. used the same technique to measure very thick films (~300 to 1200 urn). 6 Finally, Richardson and Borman used the inherent fluorescence in various formulated lubricants to measure film thick- nesses up to 40 um 7 in a model diesel engine (Cameron Plint wear tester). The typical thickness resolution of these techniques is less than 10% of the thickness being mea- sured.
A significant limitation of fluorescence-based methods is associated with temperature sensitivity of the fluores- ence intensity, which may give rise to errors in the re- sulting thickness measurements that are difficult to quan- tify. 7 Another possible complication of fluorescence methods arises from possible differences in chromophore concentration and optical properties at the interface and in the bulk. Correcting for these requires properly ac- counting for the adsorption thermodynamics and fluo- rescence quenching of the chromophore at the interface of interest. Raman scattering holds the promise of min- imizing, or even eliminating, many of these limitations inherent in fluorescence techniques.
Previous work on the use of Raman scattering for thick- ness measurement on solid films has yielded varying re- sults. For instance, Ohyama and Mori investigated solid films with good results to 0.2 tzm. ~3 England et al. mea- sured chromium oxide films of 600 A thickness.X4 McCarty compared simultaneous Raman scattering and interfer- ometric-thickness measurements during the growth of so- dium sulfate films on Pt/10% Rh substrates. 15 His results revealed oscillations which were attributed to interference and polarization effects. These were particularly evident in films thinner than 0.8 ~m. Finally, Connell et al. in- vestigated very thin films (less than 1 ~m) and noted the appearance of some thickness-dependent oscillations, also attributed to optical interference e f f e c t s . ~6
The only previous attempts to measure liquid films (to our knowledge) were reported by Ohyama and Mori. 13 These researchers did not succeed in making measure- ment of sufficient quality to be practically useful, pri- marily as a result of the mechanical limitations of their apparatus. Here we report the measurement of poly- phenylether lubricant films at the interface between a di- amond window and a steel sphere. The results indicate that films of thickness between 1 and 10 ~m can readily be measured with a low-power helium-neon excitation laser.
EXPERIMENTAL APPARATUS
Figures 1A and 1B are block diagrams of the Raman system. The Raman system consists of a microscope
Volume 49, Number 9, 1 9 9 5 0003-7028/95/4909-127552.00/0 APPLIED SPECTROSCOPY 1275 © 1995 Society for Applied Spectroscopy

Turning Prism
[ He-Ne Laser ] ........
CCD Detector Raman _ / Signal
MonoS~na t ~ @ l 1 Spatial Filter Holographic Microscope
Notch Filter
Fro. I A. Block diagram of Raman system.
(Olympus BH-2), a 20 x objective with a working distance of 11 mm (part No. BH2-UMA-2). The laser is directed towards the sample by a holographic 633-nm beamsplit- ter (Kaiser Optical). The back-scattered signal is collected by the objective and directed towards the detector by means of a fight-angle prism. A holographic 633-nm notch filter (Kaiser Optical) is placed in the beam line to further reduce Rayleigh scattering. A 100-urn pinhole spatial fil- ter is used to reject extraneous room lights or Raman signal from the diamond window. A single monoehro- mator (ISA HR320), with a 600-grooves/mm grating, and a liquid nitrogen charge-coupled device (CCD) detector (Princeton Instruments, CCD-1152) are used. Unless oth- erwise noted, a 10-mW He-Ne laser (Uniphase) is used as the Raman scattering excitation source, and the re- sulting Raman signal is integrated for 10 s at each position in the sample.
Since the eventual purpose of these studies is appli- cation to problems involving lubrication of machine parts such as ball bearings, the measured films are produced with a one-inch-diameter stainless steel bearing (grade 10; maximum deviation from spherical form, 0.25 um; maximum surface roughness average, 0.025 um) as one of the lubricated solid surfaces. The other surface is a Drukker cut diamond (0.15 carat, 3-mm girdle diameter, and 1.2-mm culet diameter), mounted on a sapphire win- dow. The interfacial region (between the ball and the diamond culet) is then flooded with the fluid of interest.
6.3 mm
T
Raman Signal
L--77
/ Microscope Objective
~__[_Sapphirc ~-~J1 ~ Plate
~ Diamond
S~lnl] ~SeSa~itne~ 1
FIG. 1B. Close-up of bearing surface.
Oo oOoOoO Fro. 2. Structure of one isomer of bis-(bisphenoxyphenoxy)-benzene (SP4E).
Raman spectra are obtained by rastering the ball under the laser focus. The fluid used in all the studies presented here is the polyphenylether (5P4E, Monsanto Santovac 5), consisting of a mixture of isomers of bis-(bisphen- oxyphenoxy) benzene (Fig. 2). This fluid is ideal for these studies because of its good Raman scattering strength, low volatility, and lack of fluorescent impurities.
DATA ANALYSIS AND RESULTS
In order to relate measured peak intensities to film thickness, a rastering grid was created about the ball bear- ing center. Figure 3 shows the relationship between the relative 2D position increment from the center to the calculated film thickness, as described by the following equation:
T = r - k/r 2 - ( x - x 0 ) 2 - ( y - y 0 ) 2 (1)
where Tis the film thickness; r is the radius of the stainless steel ball; x0 and Y0 are the coordinates of the center of the ball contact; and x and y are the positions on the fluid film surface.
The data were taken in two rastering increment grids. The first used a 200-gin increment in both the X and Y directions. The second stage of 50-gm increments was applied to create a smaller rastering grid around the center of the ball contact. The results are shown in Figs. 5-8 and discussed below.
Raman spectra were collected at each rastering grid point. The intensity of the Raman band at ~ 1011 cm- (phenyl ring breathing mode) was determined either from its peak height above baseline or with the use of a cir- cumscribed rectangular polygon fit (using Igor Pro graph- ics and data analysis package by WaveMetries).
Figure 4 shows a typical Raman spectrum of 5P4E. The most intense fluid band is the phenyl ring breathing mode for 5P4E located at - 1 0 0 2 cm -~, which was used for
5.0000
4.0000
3,0000
2.0000
1.0000
0.0000 0 50 100 150 200 250 300 350
Increment (gm)
Fro. 3. Calculated film thickness vs. two-dimensional increment from center of ball bearing.
1276 Volume 49, Number 9, 1995
12x1¢
1 0 -
0 8 -
06
0 4 - -
02 -
[ I 200 400 6(10 8~0
Wavenumber (era I)
, , ~ , g 10co
FIo. 4. Raman spectrum of 5P4E, and the diamond window band (1330 cm '). FIG. 5.
8000- ~ . I "~
-I~ 6.3
%e 2.7
'~o~y 6 7 2 1 Re/Drive ~ pos~or~ [gx ~
~vlOOOO
9000
8000
7000
6000 5000
4000
3000
---P2000
- - + 1 0 0 0
7 o 2 9
6 ~Lm
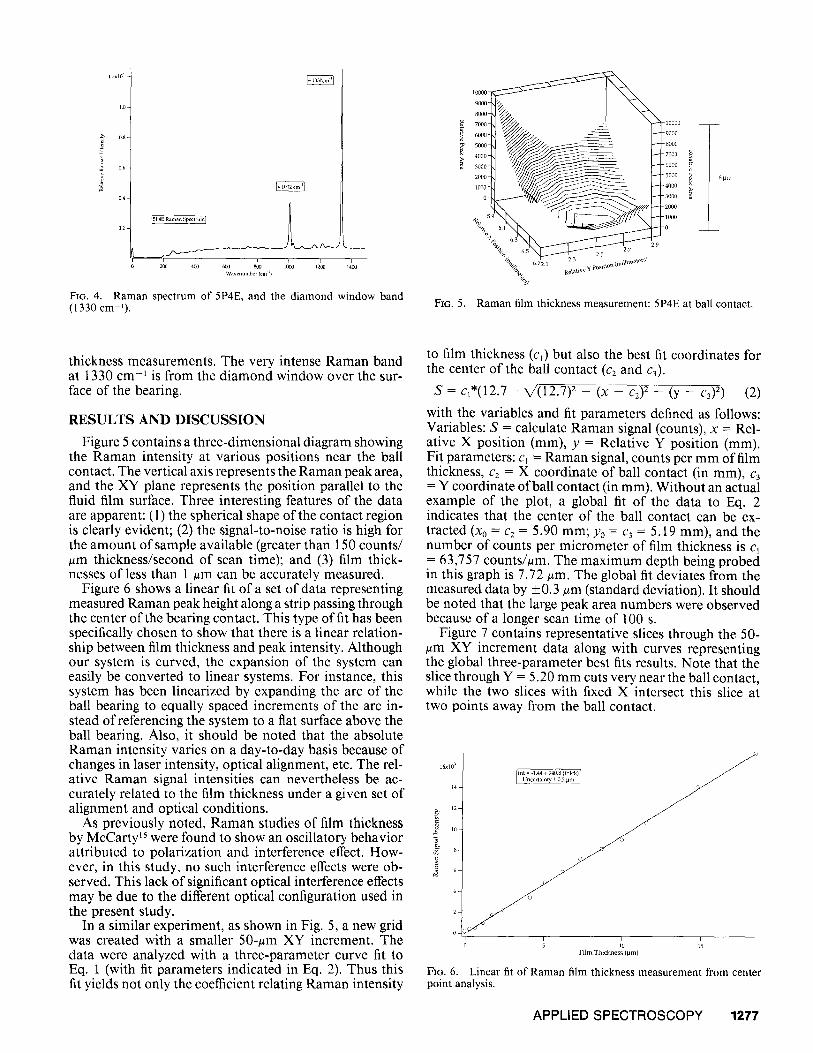
Raman film thickness measurement: 5P4E at ball contact.
thickness measurements. The very intense Raman band at 1330 cm -~ is from the diamond window over the sur- face of the bearing.
RESULTS AND DISCUSSION
Figure 5 contains a three-dimensional diagram showing the Raman intensity at various positions near the ball contact. The vertical axis represents the Raman peak area, and the XY plane represents the position parallel to the fluid film surface. Three interesting features of the data are apparent: (1) the spherical shape of the contact region is clearly evident; (2) the signal-to-noise ratio is high for the amount of sample available (greater than 150 counts/ ~m thickness/second of scan time); and (3) film thick- nesses of less than 1 um can be accurately measured.
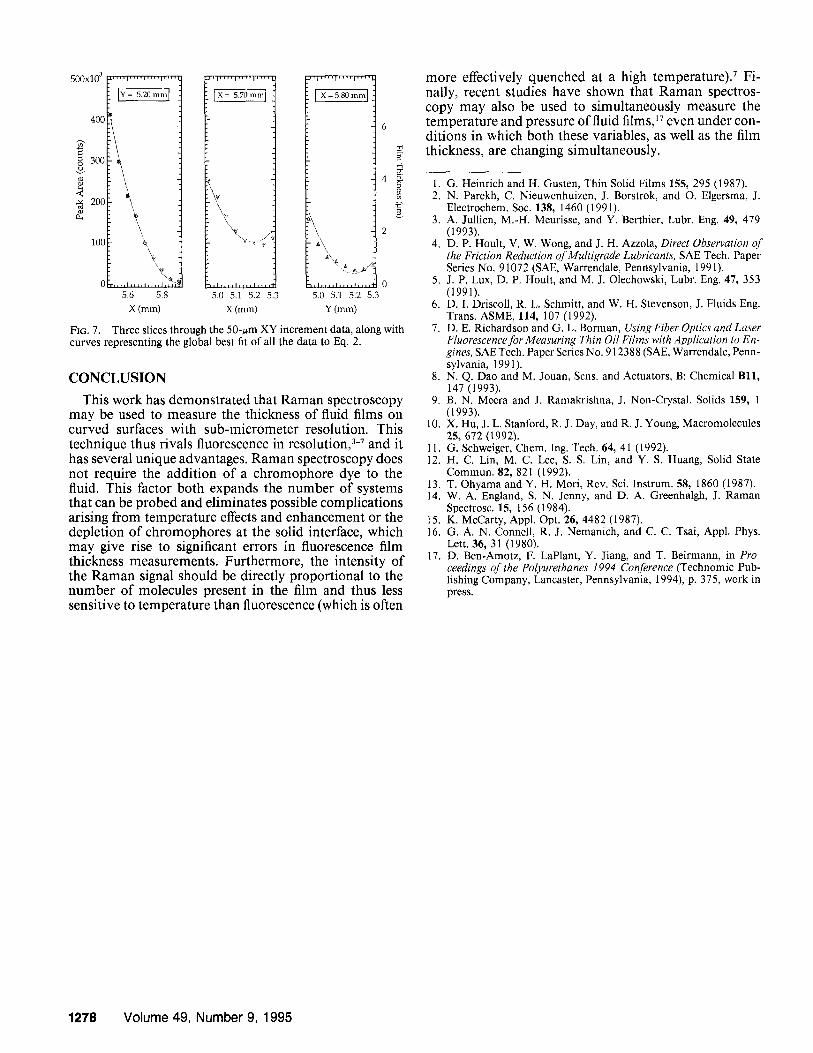
Figure 6 shows a linear fit of a set of data representing measured Raman peak height along a strip passing through the center of the bearing contact. This type of fit has been specifically chosen to show that there is a linear relation- ship between film thickness and peak intensity. Although our system is curved, the expansion of the system can easily be converted to linear systems. For instance, this system has been linearized by expanding the arc of the ball bearing to equally spaced increments of the arc in- stead of referencing the system to a fiat surface above the ball bearing. Also, it should be noted that the absolute Raman intensity varies on a day-to-day basis because of changes in laser intensity, optical alignment, etc. The rel- ative Raman signal intensities can nevertheless be ac- curately related to the film thickness under a given set of alignment and optical conditions.
As previously noted, Raman studies of film thickness by McCarty 15 were found to show an oscillatory behavior attributed to polarization and interference effect. How- ever, in this study, no such interference effects were ob- served. This lack of significant optical interference effects may be due to the different optical configuration used in the present study.
In a similar experiment, as shown in Fig. 5, a new grid was created with a smaller 50-am XY increment. The data were analyzed with a three-parameter curve fit to Eq. 1 (with fit parameters indicated in Eq. 2). Thus this fit yields not only the coefficient relating Raman intensity
to film thickness (c~) but also the best fit coordinates for the center of the ball contact (c2 and c3).
S = c1"(12.7- k/(12.7) 2 - (x - c2) 2 - (y - c3) 2) (2)
with the variables and fit parameters defined as follows: Variables: S = calculate Raman signal (counts), x = Rel- ative X position (mm), y = Relative Y position (ram). Fit parameters: c~ = Raman signal, counts per mm of film thickness, c2 = X coordinate of ball contact (in ram), c3 = Y coordinate of ball contact (in ram). Without an actual example of the plot, a global fit of the data to Eq. 2 indicates that the center of the ball contact can be ex- tracted (x0 = c2 = 5.90 mm; Yo = c3 = 5.19 ram), and the number of counts per micrometer of film thickness is cl = 63,757 counts/urn. The maximum depth being probed in this graph is 7.72 ~m. The global fit deviates from the measured data by +0.3 um (standard deviation). It should be noted that the large peak area numbers were observed because of a longer scan time of 100 s.
Figure 7 contains representative slices through the 50- um XY increment data along with curves representing the global three-parameter best fits results. Note that the slice through Y = 5.20 mm cuts very near the ball contact, while the two slices with fixed X intersect this slice at two points away from the ball contact.
16x103 -
.~, 1 2 -
,.~ l t ] -
5 l 15 F i l m T h i c k n e s s (Nm)
FIo. 6. Linear fit of Raman film thickness measurement from center point analysis.
APPLIED SPECTROSCOPY 1277
5 0 0 X 1 0 3
400
300
< 200
100
L , , , , I . . . . l , , , , l , , , , i
, , , , . . . . . . . . . i ~ , 5.6 5.8
X (ram)
~ ' 1 . . . . I . . . . I . . . .
I× ~ s.7o n~m I
f
M r I . . . . [ , , , , I , N , I
I ×=5.S0mml
6
.g
, \
I . . . . I . . . . I . . . . , I , , , , I . . . . I , , , , 4 ~ 0
5.0 5.1 5.2 5.3 5.0 5.1 5.2 5.3 X (mm) Y (ram)
FIo, 7. Three slices through the 50-#m XY increment data, along with curves representing the global best fit of all the data to Eq. 2.
CONCLUSION
This work has demonstrated that Raman spectroscopy may be used to measure the thickness of fluid films on curved surfaces with sub-micrometer resolution. This technique thus rivals fluorescence in resolution, 3-7 and it has several unique advantages. Raman spectroscopy does not require the addition of a chromophore dye to the fluid. This factor both expands the number of systems that can be probed and eliminates possible complications arising from temperature effects and enhancement or the depletion of chromophores at the solid interface, which may give rise to significant errors in fluorescence film thickness measurements. Furthermore, the intensity of the Raman signal should be directly proportional to the number of molecules present in the film and thus less sensitive to temperature than fluorescence (which is often
more effectively quenched at a high temperature). 7 Fi- nally, recent studies have shown that Raman spectros- copy may also be used to simultaneously measure the temperature and pressure of fluid films,17 even under con- ditions in which both these variables, as well as the film thickness, are changing simultaneously.
1. G. Heinrich and H. Gusten, Thin Solid Films 155, 295 (1987). 2. N. Parekh, C. Nieuwenhuizen, J. Borstrok, and O. Elgersma, J.
Electrochem. Soc. 138, 1460 (1991). 3. A. Jullien, M.-H. Meurisse, and Y. Berthier, Lubr. Eng. 49, 479
(1993). 4. D. P. Hoult, V. W. Wong, and J. H. Azzola, Direct Observation of
the Friction Reduction of Multigrade Lubricants, SAE Tech. Paper Series No. 91072 (SAE, Warrendale, Pennsylvania, 1991).
5. J. P. Lux, D. P. Hoult, and M. J. Olechowski, Lubr. Eng. 47, 353 (1991).
6. D. I. Driscoll, R. L. Schmitt, and W. H. Stevenson, J. Fluids Eng. Trans. ASME, 114, 107 (1992).
7. D. E. Richardson and G. L. Borman, Using Fiber Optics and Laser Fluorescence for Measuring Thin Oil Films with Application to En- gines, SAE Tech. Paper Series No. 912388 (SAE, Warrendale, Penn- sylvania, 1991).
8. N. Q. Dao and M. Jouan, Sens. and Actuators, B: Chemical B l l , 147 (1993).
9. B. N. Meera and J. Ramakrishna, J. Non-Crystal. Solids 159, 1 (1993).
10. X. Hu, J. L. Stanford, R. J. Day, and R. J. Young, Macromolecules 25, 672 0992).
11. G. Schweiger, Chem. Ing. Tech. 64, 41 (1992). 12. H. C. Lin, M. C. Lee, S. S. Lin, and Y, S. Huang, Solid State
Commun. 82, 821 (1992). 13. T. Ohyama and Y. H. Mori, Rev. Sci. Instrum. 58, 1860 (1987). 14. W. A. England, S. N. Jenny, and D. A. Greenhalgh, J. Raman
Spectrosc. 15, 156 (1984). 15. K. McCarty, Appl. Opt. 26, 4482 (1987). 16. G. A. N. Connell, R. J. Nemanich, and C. C. Tsai, Appl. Phys.
Lett. 36, 31 (1980). 17. D. Ben-Amotz, F. LaPlant, Y. Jiang, and T. Beirmann, in Pro-
ceedings of the Polyurethanes 1994 Conference (Technomic Pub- lishing Company, Lancaster, Pennsylvania, 1994), p. 375, work in press.
1278 Volume 49, Number 9, 1995