Embed Size (px)
Citation preview
Composites Science and Technology 39 (1990) 193-205
Measurement of Gic and Gnc in Carbon/Epoxy Composites
P. Davies, C. Moulin, H. H. Kausch
Polymers Laboratory, Swiss Federal Institute of Technology, CH-1007 Lausanne, Switzerland
&
M. Fischer
Ciba-Geigy Composite Research, Marly, Switzerland
(Received 27 June 1989; revised version received 2 October 1989; accepted 24 October 1989)
ABSTRACT
The measurement of mode I and mode II delamination resistance of a unidirectional carbon~epoxy composite is examined. First, the results of a round-robin exercise organised b)' the Polymer and Composites Task Group of the European Group on Fracture (EGF), involving 10 laboratories, are presented. Values of Gtc and Gll¢ at initiation and propagation have been measured using double cantilever beam ( DCB), end notched flexure (ENF) and end loaded split (ELS) specimens. The influence of defect type and specimen geometry on the values of delamination resistance of this material is then discussed.
I N T R O D U C T I O N
Delamination is one of the most common failure modes in composite materials. In recent years, much effort has been devoted to improving the delamination resistance of composites, and values of G~c are now commonly
193 Composites Science and Technology 0266-3538/90/$03"50 ,© 1990 Elsevier Science Publishers Ltd, England. Printed in Great Britain
194 P. Davies, C. Moulin, H. H. Kausch, M. Fischer
quoted in material suppliers' data sheets. Unfortunately, at the time of writing no widely accepted standard test method exists for the determin- ation of mode I interlaminar fracture toughness, even though this type of test has been performed on composites for around 20 years. 1 A number of groups, e.g. ASTM Task Group D30.02.02, VAMAS and the European Group on Fracture, are therefore currently studying test procedures to establish standards. This paper presents some of the results from one of the series of round-robin tests carried out by the Polymers and Composites Task Group of the European Group on Fracture. The activities of this group have been described recently elsewhere, z
Until a few years ago, the consensus of opinion was in favour of the use of propagation values of G~c to characterise the delamination resistance of unidirectional composites. Although resistance was sometimes observed to increase during propagation (an R curve effect, e.g. Ref. 3), this appeared independent of initial crack length and could be explained in terms of fibre bridging and multiple cracking. More recently, however, the work of Chai and others has strongly weighed in favour of the adoption of initiation values, L'4-6 as, for a number of materials, the R curve obtained has been shown to depend on the stiffness of the specimen. Unfortunately, few data are available to show whether initiation values can be unambiguously defined or reliably measured. One of the principal aims of the tests described here is therefore to present such data.
Mode II tests on polymeric composites are more recent than those in mode I, and test methods, particularly for tough composites, are still controversial. The mode II results presented here are intended as a first step to establishing the reproducibility of G,c values.
MATERIALS AND METHODS
The material studied here was a unidirectional carbon fibre/epoxy composite, supplied in the form of four 300 m m x 300 mm panels 4.2 mm thick. Fibre volume was c. 60%. Two of the panels contained 60 pm thick PTFE starter films at mid-thickness. These were cut into 20 mm wide strips and distributed to 10 laboratories (see Acknowledgements). Two other panels contained single (20~m) and folded (40/zm) aluminium foil starter films at mid-thickness and were tested in one laboratory (Swiss Federal Institute of Technology, EPFL).
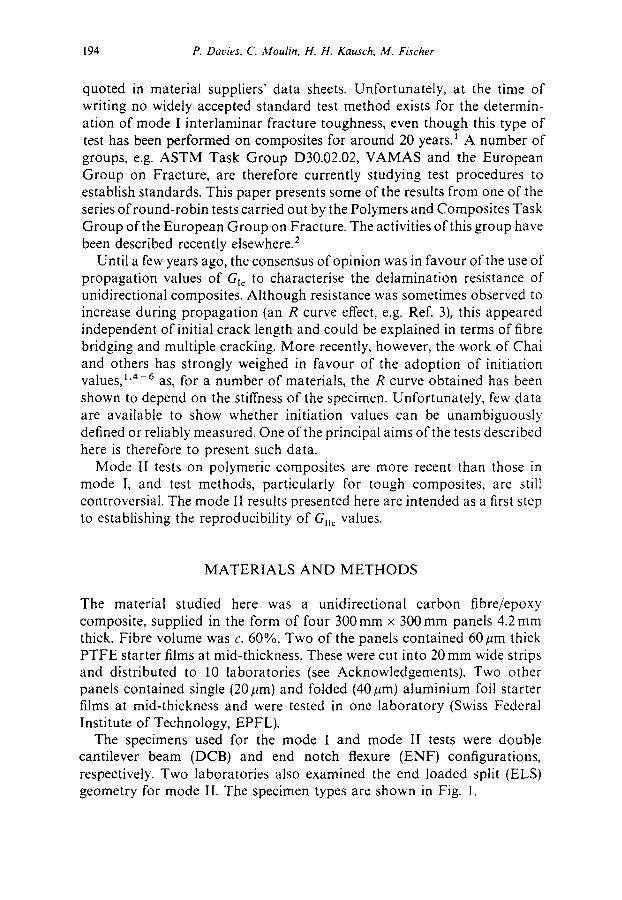
The specimens used for the mode I and mode II tests were double cantilever beam (DCB) and end notch flexure (ENF) configurations, respectively. Two laboratories also examined the end loaded split (ELS) geometry for mode II. The specimen types are shown in Fig. 1.
GI¢ and Guc measurements in carbon/epoxy composites 195
2h
Mode I. Double Cant i lever Beam (DCB)
l @
I
2L
2h
L
Mode II. End Notched Flexure (ENF)
a
L '-
Mode II End Loaded Split (ELS).
Fig. 1. Mode I and mode II specimens.
R O U N D - R O B I N RESULTS
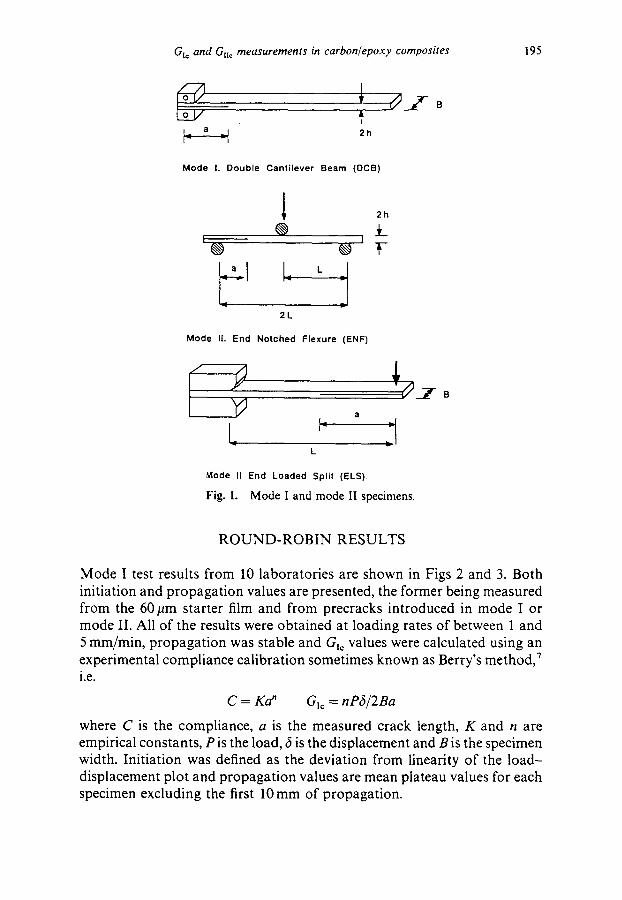
Mode I test results from 10 laboratories are shown in Figs 2 and 3. Both initiation and propagation values are presented, the former being measured from the 60pm starter film and from precracks introduced in mode I or mode II. All of the results were obtained at loading rates of between 1 and 5 mm/min, propagation was stable and G~c values were calculated using an experimental compliance calibration sometimes known as Berry's method, 7 i.e.
C -- Ka" Glc --- n P 6 / 2 B a
where C is the compliance, a is the measured crack length, K and n are empirical constants, P is the load, 6 is the displacement and B is the specimen width. Initiation was defined as the deviation from linearity of the load- displacement plot and propagation values are mean plateau values for each specimen excluding the first 10 mm of propagation.
196 P. Davies, C. Moulin, H. H. Kausch, M. Fischer
Fig. 2.
GIc (J/m2)
MODE I, INITIATION CARBON/EPOXY
• Slarter film 60pro o Mode 1 precraek • Mode II precrack
250
200
150
100]
'°ot
o o ! • • D
o g • • 0
• e
, , , , , , , , ,
2 4 6 8 10
G R O U P
Round-robin results, mode I initiation. (Group 7 data:" two points superimposed, film 156J/m 2 and mode I precrack 158 J/m-'.)
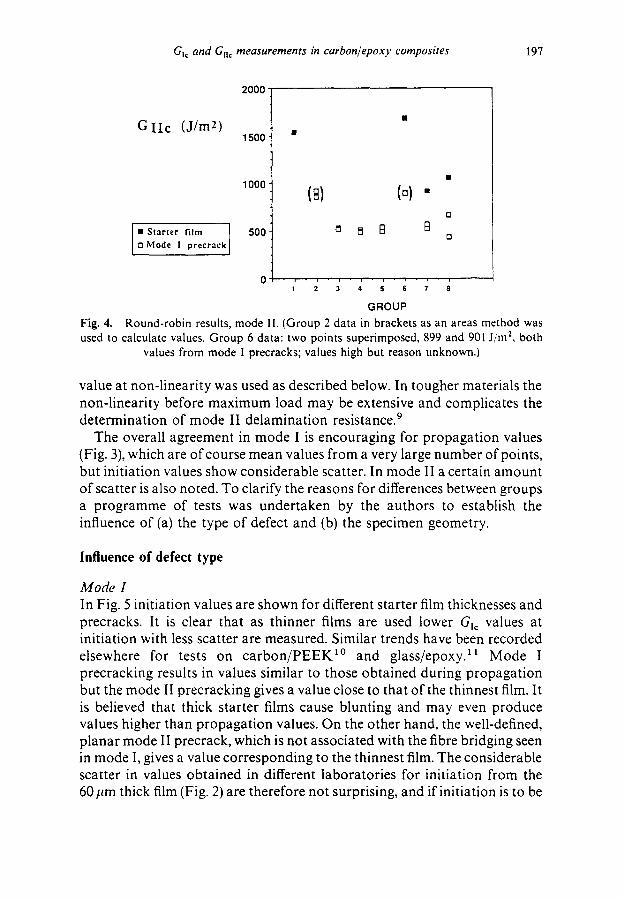
Mode II results are shown in Fig. 4. A few values were obtained directly from the PTFE starter film but most were determined after propagation of a precrack in mode I. Load-displacement plots were almost completely linear up to a maximum load at which unstable crack propagation occurred. Values of GHc were calculated using beam theory expressions, s i.e.
GIt¢ = 9a2p6/[2B(3L 3 + 2a3)]
where 2L is the distance between supports. Most groups used the maximum load value to calculate GHc, ignoring any non-linear behaviour. The values in Fig. 4 are these values, but in the subsequent work at Lausanne an initiation
G Ic (J/m2) MODE I, PROPAGATION C A R B O N / E P O X Y
250"
200"
150"
100'
50"
m • •
| • •
2 4s67 GROUP
10
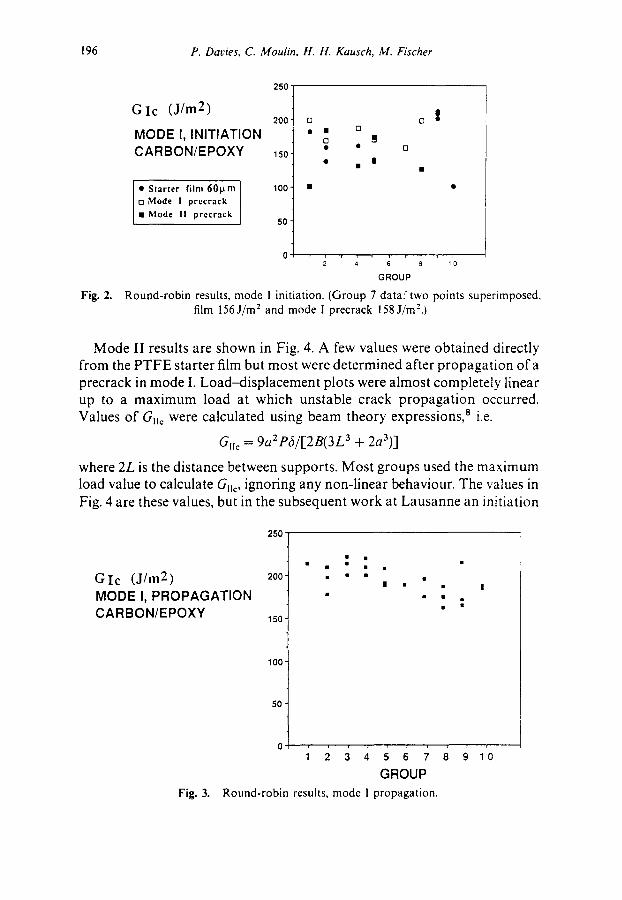
Fig. 3. Round-robin results, mode I propagation.
Gl¢ and GI1 = measurements in carbon/epoxy composites 197
G I I c (J/m2)
Starter film
Mode I precrack
2000
1500
1000
500
(o) •
Q
0 B Et D
GROUP Fig. 4. Round-robin results, mode H. (Group 2 data in brackets as an areas method was used to calculate values. Group 6 data: two points superimposed, 899 and 901 J/m 2, both
values from mode [ precracks; values high but reason unknown.)
value at non-linearity was used as described below. In tougher materials the non-linearity before maximum load may be extensive and complicates the determination of mode II delamination resistance. 9
The overall agreement in mode I is encouraging for propagation values (Fig. 3), which are of course mean values from a very large number of points, but initiation values show considerable scatter. In mode II a certain amount of scatter is also noted. To clarify the reasons for differences between groups a programme of tests was undertaken by the authors to establish the influence of (a) the type of defect and (b) the specimen geometry.
Influence of defect type
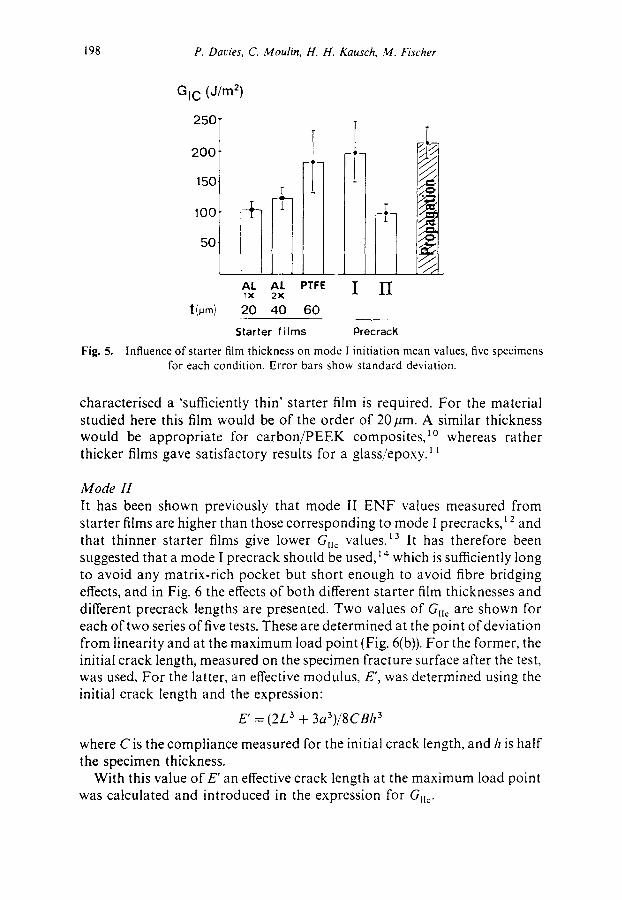
Mode I In Fig. 5 initiation values are shown for different starter film thicknesses and precracks. It is clear that as thinner films are used lower Gt¢ values at initiation with less scatter are measured. Similar trends have been recorded elsewhere for tests on ca rbon /PEEK 1° and glass/epoxy, it Mode I precracking results in values similar to those obtained during propagation but the mode II precracking gives a value close to that of the thinnest film. It is believed that thick starter films cause blunting and may even produce values higher than propagation values. On the other hand, the well-defined, planar mode II precrack, which is not associated with the fibre bridging seen in mode I, gives a value corresponding to the thinnest film. The considerable scatter in values obtained in different laboratories for initiation from the 60 pm thick film (Fig. 2) are therefore not surprising, and if initiation is to be
198 P. Davies, C. Moulin, H. H. Kausch, M. Fischer
Fig. 5.
GIC (J/m 2)
250"
2 o o I
150 r
5O
AL AL PTFE ~X 2X
t(~m) 20 40 60
Starter f i lms Precracl~
Influence of starter film thickness on mode I initiation mean values, five specimens for each condition. Error bars show standard deviation.
characterised a 'sufficiently thin' starter film is required. For the material studied here this film would be of the order of 20/.tm. A similar thickness would be appropriate for ca rbon/PEEK composites, t° whereas rather thicker films gave satisfactory results for a glass/epoxy.tt
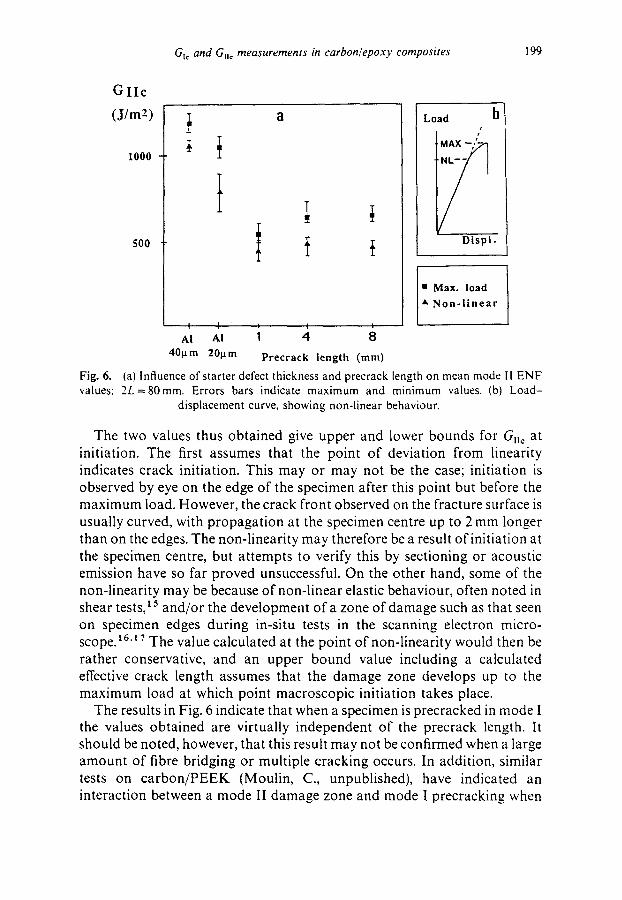
Mode H It has been shown previously that mode II ENF values measured from starter films are higher than those corresponding to mode I precracks, t2 and that thinner starter films give lower G,¢ values, t3 It has therefore been suggested that a mode I precrack should be used, ~'~ which is sufficiently long to avoid any matrix-rich pocket but short enough to avoid fibre bridging effects, and in Fig. 6 the effects of both different starter film thicknesses and different precrack lengths are presented. Two values of Gn¢ are shown for each of two series of five tests. These are determined at the point of deviation from linearity and at the maximum load point (Fig. 6(b)). For the former, the initial crack length, measured on the specimen fracture surface after the test, was used. For the latter, an effective modulus, E', was determined using the initial crack length and the expression:
E' = (2L 3 + 3a3)/SCBh 3
where C is the compliance measured for the initial crack length, and h is half the specimen thickness.
With this value o r E ' an effective crack length at the maximum load point was calculated and introduced in the expression for Gn¢.
Gtc and Gac measurements in carbon~epoxy composites 199
G I I c
(J/m2)
1000
500
' I ~ I t
AI AI 4 8
40gm 20p.m Precrack length (mm)
Load b t
Displ.
• Max. load ~, N o n - l i n e a r
Fig. 6. (a) Influence of starter defect thickness and precrack length on mean mode II ENF values; 2L=80mm. Errors bars indicate maximum and minimum values. (b) Load-
displacement curve, showing non-linear behaviour.
The two values thus obtained give upper and lower bounds for G,,¢ at initiation. The first assumes that the point of deviation from linearity indicates crack initiation. This may or may not be the case; initiation is observed by eye on the edge of the specimen after this point but before the maximum load. However, the crack front observed on the fracture surface is usually curved, with propagation at the specimen centre up to 2 mm longer than on the edges. The non-linearity may therefore be a result of initiation at the specimen centre, but attempts to verify this by sectioning or acoustic emission have so far proved unsuccessful. On the other hand, some of the non-linearity may be because of non-linear elastic behaviour, often noted in shear tests,~5 and/or the development of a zone of damage such as that seen on specimen edges during in-situ tests in the scanning electron micro- scope.L6'~7 The value calculated at the point of non-linearity would then be rather conservative, and an upper bound value including a calculated effective crack length assumes that the damage zone develops up to the maximum load at which point macroscopic initiation takes place.
The results in Fig. 6 indicate that when a specimen is precracked in mode I the values obtained are virtually independent of the precrack length. It should be noted, however, that this result may not be confirmed when a large amount of fibre bridging or multiple cracking occurs. In addition, similar tests on carbon/PEEK (Moulin, C., unpublished), have indicated an interaction between a mode II damage zone and mode ! precracking when
200 P. Davies, C. Moulin, H. H. Kausch, M. Fischer
precracks were short (1 ram), so that the practice of performing several ENF tests on the same specimen is not recommended.
Specimen geometry
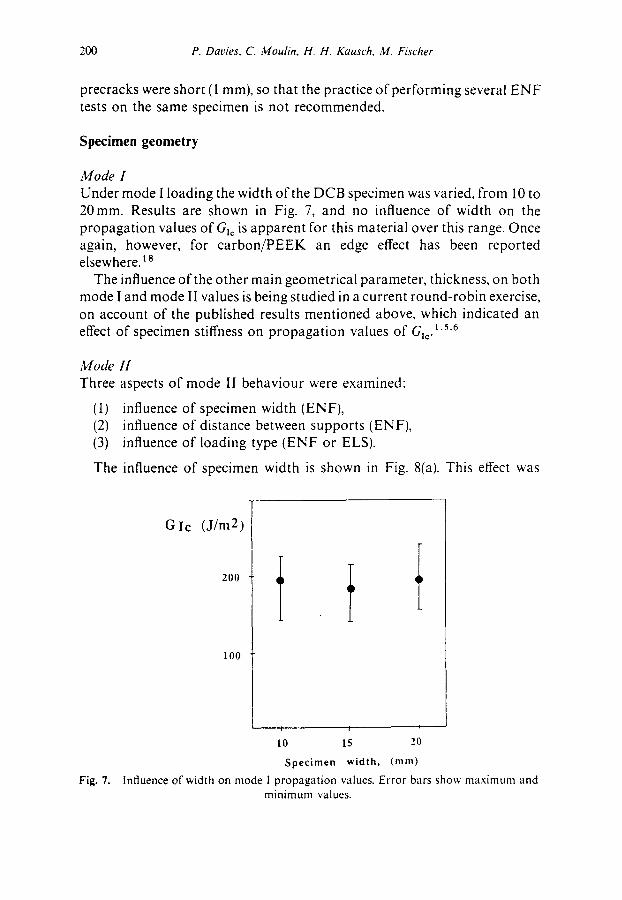
Mode I Under mode I loading the width of the DCB specimen was varied, from 10 to 20mm. Results are shown in Fig. 7, and no influence of width on the propagation values of Gl¢ is apparent for this material over this range. Once again, however, for carbon/PEEK an edge effect has been reported elsewhere, t 8
The influence of the other main geometrical parameter, thickness, on both mode I and mode II values is being studied in a current round-robin exercise, on account of the published results mentioned above, which indicated an effect of specimen stiffness on propagation values of Gtc. l 'L6
Mode H Three aspects of mode II behaviour were examined:
(I) influence of specimen width (ENF), (2) influence of distance between supports (ENF), (3) influence of loading type (ENF or ELS).
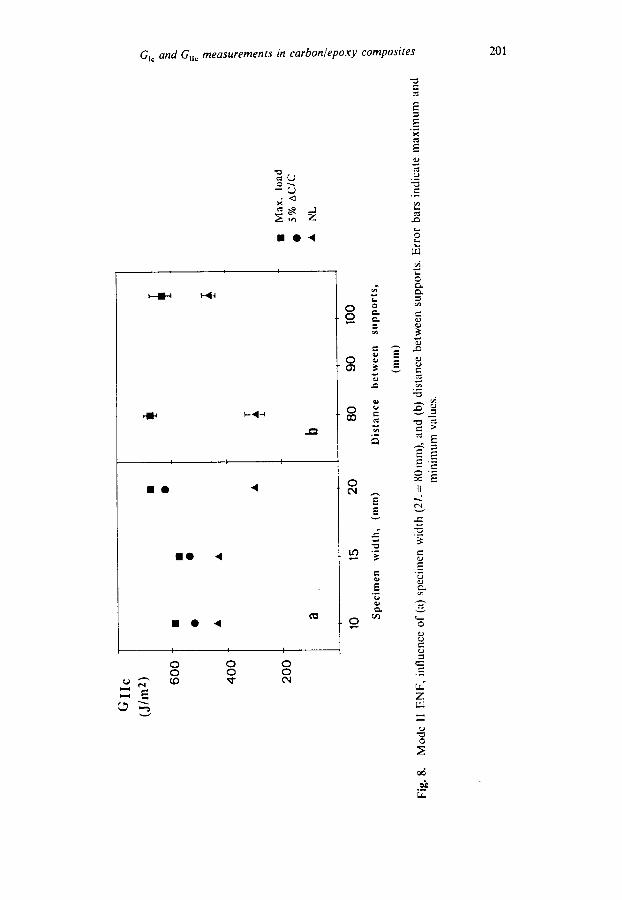
The influence of specimen width is shown in Fig. 8(a). This effect was
Fig. 7.
GIc (J/m2)
200
lO0
t t t
I0 15 20
Specimen width, (ram)
Influence of width on mode I propagation values. Error bars show maximum and minimum values.
Gl¢ and Gu, measurements in carbon/epoxy composites 201
i
)-(4
N O
,,~ Z
n o , (
I I I
I 0 •
I
0 0
I
0 0 cO
I
0 0
,g r -
g °
c-
O
.g
g ,- t ~
° -
0 t"q
e--
t O '7.
e..
E ° - e~
e-t
0
e -
E F.
, 4
E
0
e-,
e -
8
E
II ¢ .q
e "
e -
e'~
e...
e -
Z
0
E
rv
202 P. Dat, ies, C. Moulin, H. H. Kausch, M. Fischer
unexpected and tests were repeated, so that results from a total of eight specimens at each thickness are presented. It is not clear why lower G,~ values at non-linearity and higher values at maximum load are obtained for 20mm wide specimens. An effect is also revealed in Fig. 8(b) when the distance between supports is varied, though in this case maximum load values are not affected. In published work on a relatively brittle carbon/epoxy, ~3 higher values were obtained when the distance between supports was increased from 75 to 100 ram. It is interesting to note, however, that if an alternative initiation criterion is used, such as a 5% increase in compliance, the influence of width is reduced (Fig. 8(a)). The results in Figs 8(a) and 8(b) suggest that the deviation fron linearity on the load-displacement curve may reflect a geometrical effect, as both are inversely related to specimen stiffness. In spite of the rather arbitrary nature of a 5% compliance change criterion, it is easier to define than the deviation from linearity and may be more useful in a standard test method.
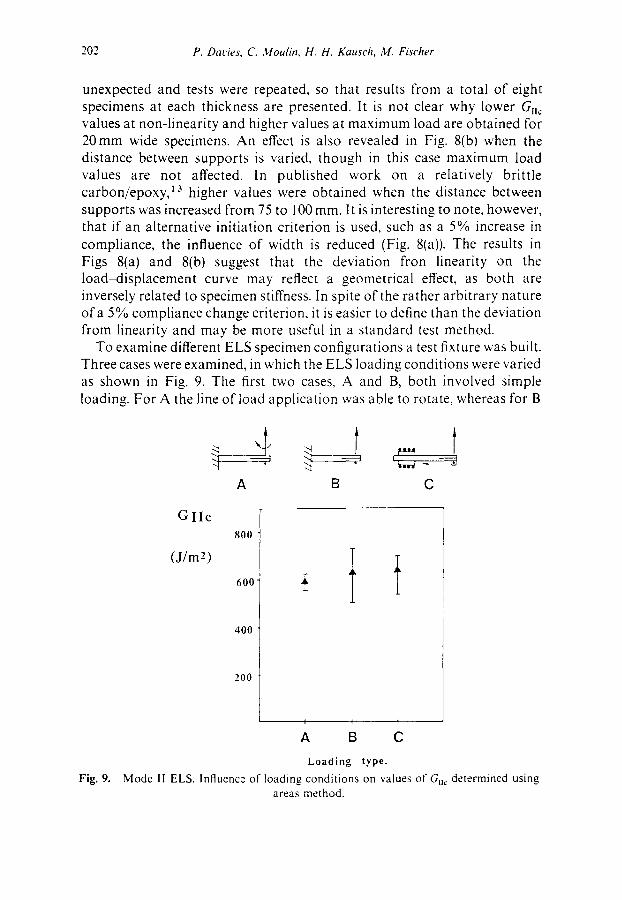
To examine different ELS specimen configurations a test fixture was built. Three cases were examined, in which the ELS loading conditions were varied as shown in Fig. 9. The first two cases, A and B, both involved simple loading. For A the line of load application was able to rotate, whereas for B
t t t I~nn/
A B C
G I I c
( J / m 2 )
800
600
400
200
I I
A B C
Loading type.
Mode II ELS. Influence of loading conditions on values of G.c areas method.
Fig. 9. determined using
GI¢ and Gu¢ measurements in carbon~epoxy composites 203
load application was fixed vertically and the loading pin slipped along the specimen as the displacement increased. Finally, in case C, the load application was fixed vertically via a hinge bonded to the specimen and the other end of the specimen could slide in a bearing fixture. In all three cases, propagation was stable and so an areas method with full loading and unloading cycles was used to measure Guc during propagation. The results shown in Fig. 9 indicate that the loading fixture does not affect the values determined for this material.
These values cannot be directly compared with those obtained on the ENF specimen, as propagation was unstable in the latter. However, in published work, similar values were found for a brittle carbon/epoxy composite by ENF and ELS tests, but large discrepancies were noted for a tougher composite. ~6 Further tests are now being performed on carbon/PEEK specimens to investigate these discrepancies.
DISCUSSION
The significance of initiation as a characteristic of delamination resistance has not been clearly established. The criterion employed here, which involves the point of deviation from linearity, will result in a lower bound value signalling the critical strain-energy release rate at which 'something' happens. This may be non-linear elastic behaviour, either material or geometry induced (in thin specimens), viscoelastic behaviour in low fibre volume fraction composites, plastic deformation or the initiation of damage. These values are often around 50% of the stable propagation values, even when little fibre bridging is observed, which suggests that the development of a crack tip damage zone before macroscopic propagation is a major energy dissipation mechanism.
In the light of these results the round-robin tests may now be reviewed. It is clear that a suitable starter film thickness is required if consistent mode I initiation values of GI~ are to be obtained. On the materials tested to date, 20Ftm would seem to be a sensible choice for mode I, but in mode II precracking appears essential as blunting effects are more severe.
The rather high values of Gu¢ obtained by one of the laboratories in Fig. 4 are the result of the use of an areas method of interpretation which is not strictly applicable to unstable propagation. The reasons for the second set of high values have not been identified, but the results of the remaining groups are reasonably consistent.
Further mode I initiation measurements are now required to show whether the good reproducibility seen for propagation values can be achieved in different laboratories. Several other topics such as the relative
204 P. Davies, C. Moulin, H. H. Kausch, M. Fischer
merits of different data analyses, which have not been discussed here, are also being addressed (e.g. Ref. 19). Finally, the detailed study of tougher composites such as carbon/PEEK is necessary if an acceptable standard is to be proposed, and results from current round-robin testing of this material will be presented in a future publication.
CONCLUSIONS
The main conclusions from this series of interlaminar fracture tests on a carbon/epoxy composite are the following:
(1) Mode I propagation values can be reproducibly measured in different laboratories but considerable scatter is noted in initiation values. This is due to the excessively thick starter film (60g~m) used here.
(2) Initiation values are strongly dependent on starter film thickness in both mode I and mode II, lower values with less scatter being obtained for thinner films.
(3) Mode I values are not affected by testing specimens narrower than the usual 20 mm width, but mode II values depend on width.
(4) Mode II values obtained from the ELS specimen are independent of the loading conditions.
ACKNOWLEDGEM ENTS
The contributions of the following participants in the Polymers and Composites Task Group of the European Group on Fracture to this paper are gratefully acknowledged: Dr D. Neville (ABB), Dr F. Ramsteiner (BASF), Professors K. Friedrich and H. Wittich (Technical University of Hamburg-Harburg), Dr D. R. Moore (ICI plc), Professors J. G. Williams and M. Charalambides (Imperial College, London), Dr Torres Marques and C. Rebelo (University of Porto), Dr B. Melve (SINTEF, Norway) Drs S. Th6ry, Z. G. Liu and J. P. Raynaud (UNIREC, France). Partial financial support from the Swiss Fonds National Project NFP19 is also acknowledged.
REFERENCES
1. Davies, P. & Benzeggagh, M. E., in The Application of Fracture Mechanics to Composite Materials. ed. K. Friedrich. Elsevier, Amsterdam, 1989, p. 81.
2. Davies, P. & Roulin. A., Proc. ECCM 3, Bordeaux, March 1989, p. 419.
Gt¢ and GHc measurements in carbon~epoxy composites 205
3. de Charentenay, F. X., Harry, J. M., Prel, Y. J. & Benzeggagh, M. L., ASTM STP 836, 1984, p. 84.
4. Chai, H., Eng. Fract. Mech., 24 (1986) 413. 5. Marais, C. & Sigety, P., Composites, 3 (1987) 57 (in French). 6. Davies, P., Cantwell, W., Moulin, C. & Kausch, H. H., Composites Sci. Technol.,
36 (1989) 153-66. 7. Berry, J. P., J. Appl. Phys., 34(1) (1963) 62. 8. Russell, A. J. & Street, K. N., Proc. ICCM 4, Tokyo, 1982, p. 279. 9. Carlsson, L. A., Gillespie, J. W. & Tretheway, B. R., J. Reinf Plastics
Composites, 5 (1986) 170. 10. Davies, P., Cantwell, W. & Kausch, H. H., Composites Sci. Technol., 35 (1989) 1. 11. Martin, R. H., Proc. 3rd Am. Soc. Composites Conf. 1988. Technomic,
Lancaster, PA, 1988, p. 688. 12. Prel, Y. J., Davies, P., Benzeggagh, M. L. & de Charentenay, F. X., ASTM STP
1012, 1989, p. 251. 13. M urri, G. B. & O'Brien, T. K., Proc. A IA A/A SME/A SCE/A HS 26th Str,wttlres
Conf., April 1985, p. 197. 14. Russell, A. J. & Street, K. N., ASTM STP 876, 1985, p. 349. 15. Weinberg, M., Composites, 18(5) (1987) 386. 16. Corleto, C. R. & Bradley, W. L., ASTM STP 1012, 1989, p. 201. 17. Davies, P., Doctorate thesis, Universit6 de Technologies de Compi6gne (in
French), 1987. 18. Davies, P., Cantwell, W., Richard, H., Moulin, C. & Kausch, H. H., Proc. ECCM
3, Bordeaux, March 1989, p. 747. 19. Hashemi, S., Kinloch, A. J. & Williams, J. G., J. Mater. Sci. Lett., 8 (1989) 125.