Embed Size (px)
Citation preview

PRAMANA c© Indian Academy of Sciences Vol. 74, No. 1— journal of January 2010
physics pp. 123–133
Measurement of high-power microwave pulseunder intense electromagnetic noise
AMITAVA ROY1,∗, S K SINGH1, R MENON1, D SENTHIL KUMAR2,R VENKATESWARAN2, M R KULKARNI1, P C SAROJ1, K V NAGESH1,K C MITTAL1 and D P CHAKRAVARTHY1
1Accelerator and Pulse Power Division, Bhabha Atomic Research Centre, Trombay,Mumbai 400 085, India2Microwave Tube Research & Development Centre (MTRDC),Defence Research Development Organization (DRDO), BE Complex, Jalahalli P.O.,Bangalore 560 013, India∗Corresponding author. E-mail: [email protected]
MS received 22 May 2009; revised 5 August 2009; accepted 1 September 2009
Abstract. KALI-1000 pulse power system has been used to generate single pulsenanosecond duration high-power microwaves (HPM) from a virtual cathode oscillator(VIRCATOR) device. HPM power measurements were carried out using a transmitting–receiving system in the presence of intense high frequency (a few MHz) electromagneticnoise. Initially, the diode detector output signal could not be recorded due to the highnoise level persisting in the ambiance. It was found that the HPM pulse can be successfullydetected using wide band antenna, RF cable and diode detector set-up in the presence ofsignificant electromagnetic noise. Estimated microwave peak power was ∼59.8 dBm (∼1kW) at 7 m distance from the VIRCATOR window. Peak amplitude of the HPM signalvaries on shot-to-shot basis. Duration of the HPM pulse (FWHM) also varies from 52 nsto 94 ns for different shots.
Keywords. Microwave generation; microwave measurements; electromagnetic interfer-ence; electron beams; noise measurements; microwave devices; microwave tubes.
PACS Nos 84.40.Fe; 84.40.Az; 85.10.Ka; 52.70.Gw
1. Introduction
Single-shot nanosecond duration high power microwave (HPM) pulses have beengenerated and characterized for various applications [1,2]. HPM sources are be-ing developed for applications in plasma heating, particle acceleration, high-powerradar, and many other industrial and military fields [2]. One of the crucial part ofthe HPM system development is diagnosing intense single microwave pulses withpowers greater than 100 MW and pulse widths between 5 and 100 ns [3]. Gigawattpower HPM pulses have been generated by various devices [2]. One among several
123

Amitava Roy et al
Figure 1. A photograph of the KALI-1000 pulse power system.
types of pulsed high-power microwave generators is the virtual cathode oscilla-tor (VIRCATOR). The VIRCATOR is considered to be very attractive due to itshigh-power capability, frequency tunability and device simplicity [2,4,5]. In a VIR-CATOR, an electron beam is emitted from a cathode and accelerated through asemitransparent anode. If the current exceeds the space charge limited current,a space charge (virtual cathode) forms behind the anode. The virtual cathode isunstable, and its oscillations can generate microwaves.
Different experimenters have tried various techniques to measure ns pulse du-ration HPM power and frequency [3]. Typically, the HPM power measurement isaccurate within 20% (±1 dB), the pulse energy to within 20%, and the frequencyto within 1% [3]. These diagnostic techniques are not limited to use on any onetype of HPM sources, but can be applied to a variety of HPM sources [6].
For HPM power measurement the most widely used apparatus is thetransmitting–receiving system [3]. Transmitting–receiving systems are useful athigh-power levels because all the HPM energy is broadcast into an anechoic cham-ber where a receiver picks up a known small fraction of the transmitted power. Inthis case, the amount of external attenuation required can be minimized. Thesemeasurements rely on the Friis transmission equation
PT = PR(4πr/λ)2/GRGT, (1)
where the subscript T refers to the transmitter, the subscript R refers to the receiver,P is the power, G is the antenna gain, r is the transmitter to receiver separationdistance and λ is the free space wavelength. The (r/λ)2 characteristics allows largeattenuations.
Experiments were performed using the pulsed power generator KALI-1000 (kiloampere linear injector: maximum output voltage 300 kV, output impedance 15 Ω,
124 Pramana – J. Phys., Vol. 74, No. 1, January 2010

Measurement of high-power microwave pulse
Figure 2. Schematic of the experimental set-up.
Figure 3. Tesla transformer output signal.
and pulse duration 100 ns) to generate and measure HPM signal from a VIRCA-TOR device. KALI-1000 consists of a radial tesla transformer, a water transmissionline and electron beam diode with voltage and current diagnostics. During the ex-periment it was observed that along with HPM the KALI-1000 system radiatesintense electromagnetic noise (of a few MHz frequencies). This article describesHPM power measurements by transmitting–receiving systems and various experi-mental techniques used to override the noise signal to improve the microwave signalamplitude from the diode detector.
Pramana – J. Phys., Vol. 74, No. 1, January 2010 125

Amitava Roy et al
Figure 4. Electron beam diode voltage and current waveform for 6 mm A–Kgap with 70 mm diameter graphite cathode.
2. KALI-1000 pulse power system and high-power microwave generationfrom virtual cathode oscillator
Figure 1 shows a picture of the KALI-1000 pulse power system. Figure 2 displaysthe schematic of the KALI-1000 system along with the VIRCATOR. The KALI-1000 pulse power system developed at APPD, BARC, has a Tesla transformer,water pulse forming transmission line (PFL) and a gas spark gap to generate highvoltage pulse. The Tesla transformer has a turn ratio of 1 : 60. The PFL is 1.3 mlong and uses demineralized water as dielectric and the capacitance is 4 nF. Thespark gap contains two electrodes of Rogowski profile separated by 2 cm and usesSF6 gas pressure. A vacuum field emission diode was used to generate intenserelativistic electron beams (IREB). The high voltage pulse generated from the pulsepower system is applied to the field emission diode. The diode consists of a planargraphite cathode (70 mm diameter) and copper anode mesh (240 mm diameter) atvarious anode–cathode (A–K) gaps and various voltage levels. A resistive CuSO4
voltage divider and a self-integrating Rogowski coil were used to measure the diodevoltage and current pulses respectively. The Tesla transformer output voltage signalhas been measured by a capacitive voltage divider. Figure 3 shows a typical Teslatransformer output signal. The outer body of the Tesla transformer has been madeof FRP sheet. Tesla transformer acts as a source of intense electromagnetic noiseduring the operation of the KALI-1000 pulse power system.
After the copper mesh anode flange, there is an axial virtual cathode oscillatorchamber (length 25 cm, diameter 25 cm) for microwave generation. The IREBis injected to the VIRCATOR chamber for HPM generation. In the VIRCATOR
126 Pramana – J. Phys., Vol. 74, No. 1, January 2010

Measurement of high-power microwave pulse
Figure 5. Calibration set-up of HPM diagnostic components.
chamber, the beam front forms a virtual cathode at a distance equal to the A–Kgap if the injected current is greater than the space charge limiting current by fourtimes. It is given by [4]
Il =4πε0m0c
3(γ2/3 − 1)3/2
e[1 + 2 ln(R/rb)], (2)
where rb is the beam radius, R is the drift column radius, γ is the relativistic factorand e and m0 are the electron charge and rest mass respectively. The estimatedlimiting current from (2) for the KALI-1000 VIRCATOR chamber is ∼0.8 kA.
The virtual cathode reflects the electrons that follow the beam front. The elec-trons thus oscillate between the cathode and virtual cathode causing microwaveemission. The reflection frequency is given by [2]
fr =v
4d, (3)
where v is the velocity of electrons and d is the A–K gap.The virtual cathode oscillation frequency in GHz is given by [2]
fvc = 10.0(
J
βγ
)1/2
, (4)
where J is the current density in kA/cm2.
Pramana – J. Phys., Vol. 74, No. 1, January 2010 127
Amitava Roy et al
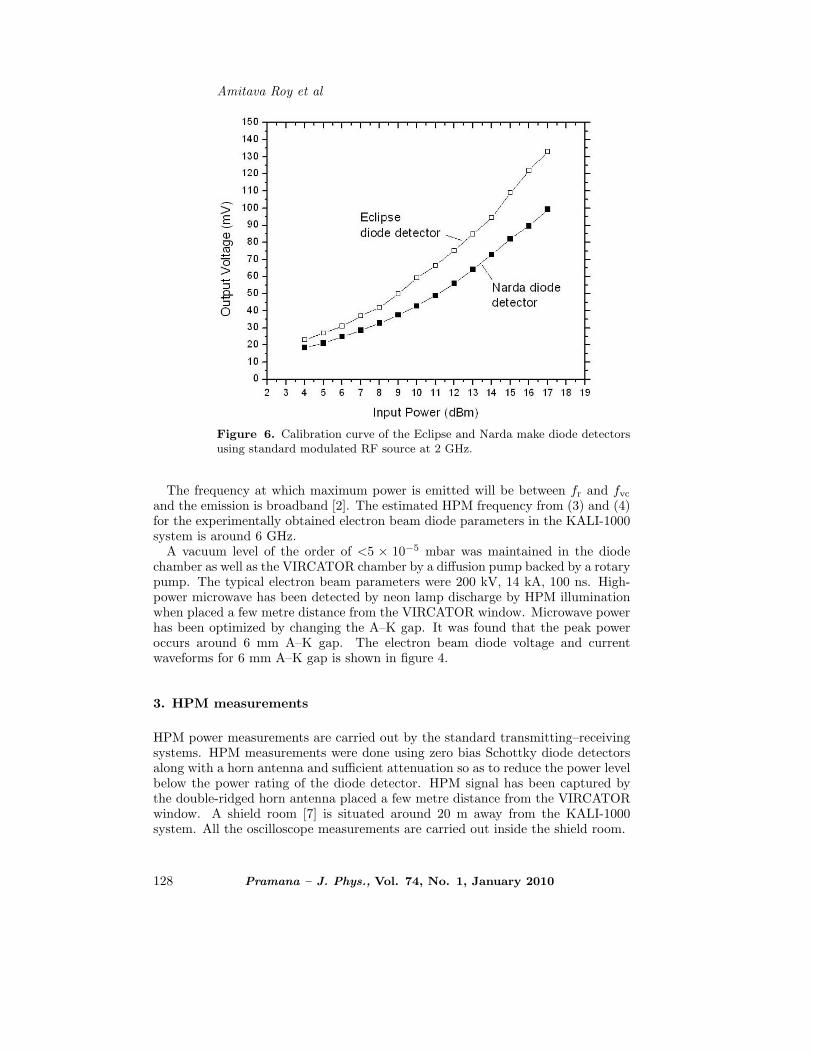
Figure 6. Calibration curve of the Eclipse and Narda make diode detectorsusing standard modulated RF source at 2 GHz.
The frequency at which maximum power is emitted will be between fr and fvc
and the emission is broadband [2]. The estimated HPM frequency from (3) and (4)for the experimentally obtained electron beam diode parameters in the KALI-1000system is around 6 GHz.
A vacuum level of the order of <5 × 10⁻⁵ mbar was maintained in the diodechamber as well as the VIRCATOR chamber by a diffusion pump backed by a rotarypump. The typical electron beam parameters were 200 kV, 14 kA, 100 ns. High-power microwave has been detected by neon lamp discharge by HPM illuminationwhen placed a few metre distance from the VIRCATOR window. Microwave powerhas been optimized by changing the A–K gap. It was found that the peak poweroccurs around 6 mm A–K gap. The electron beam diode voltage and currentwaveforms for 6 mm A–K gap is shown in figure 4.
3. HPM measurements
HPM power measurements are carried out by the standard transmitting–receivingsystems. HPM measurements were done using zero bias Schottky diode detectorsalong with a horn antenna and sufficient attenuation so as to reduce the power levelbelow the power rating of the diode detector. HPM signal has been captured bythe double-ridged horn antenna placed a few metre distance from the VIRCATORwindow. A shield room [7] is situated around 20 m away from the KALI-1000system. All the oscilloscope measurements are carried out inside the shield room.
128 Pramana – J. Phys., Vol. 74, No. 1, January 2010

Measurement of high-power microwave pulse
Figure 7. HPM signal after detection when carried to the scope by a BNCcable.
3.1 With BNC cable
Initially the diode detector has been kept near the KALI-1000 system and thedetector signal has been taken to the shield room by a BNC cable. For each shot,the beam parameters were recorded using Lecroy model WS 454 (500 MHz, 2 GS/s)scope. Microwave detector output was recorded using Tektronics make oscilloscopeTDS 520D (500 MHz, 1 GS/s).
Various components used in the diagnostics were calibrated using standard mod-ulated (a few ms to ns) RF source. The calibration set-up for various componentshas been shown in figure 5. It was found that the output of the detector signal isnothing but noise. This is because of the fact that the noise signal amplitude wasmore than the detector output signal (a few mV).
Figure 6 displays the calibration curve of the Eclipse and Narda make diodedetectors using standard modulated RF source at 2 GHz. The microwave signalafter detection was carried to the scope by a BNC cable. Figure 7 shows a diodedetector signal. One can see from figure 7 that the signal amplitude is quite high(∼1 V) and the duration is ∼700 ns. A few shots were taken only with the BNCcable with and without 50 Ω terminations (antenna, attenuators and the diodedetector have been removed). It was found that the recorded signal is the sameas that of figure 7. So this signal is nothing but noise picked up by the BNCcable. Also the noise signal varies on shot-to-shot basis. To reduce the noiselevel, different techniques were tried such as putting the BNC cable inside a metal
Pramana – J. Phys., Vol. 74, No. 1, January 2010 129

Amitava Roy et al
Figure 8. Diode detector signal when the BNC cable is kept inside a metalconduit.
conduit, grounding the conduit to the signal cable ground, to the inner wall of theshield room etc. Figure 8 shows a diode detector signal when the BNC cable is keptinside a metal conduit. Isolating the scope supply from the AC mains was also triedduring the recording, but in vain. It was observed that ∼300 mV noise persistedthroughout. A few shots were also taken by shielding the Tesla transformer witha 1.5 mm thick aluminum sheet. This helped reducing the noise level to ≤200mV. But the diode detector output signal is (figure 6) <150 mV. So shielding theTesla transformer could not help as we were unable to cover the Tesla transformercompletely with the aluminum sheet due to some other problems.
3.2 With a preamplifier
To override the noise signal and to improve the microwave signal amplitude from thediode detector, a preamplifier (BMC 1595) was used at the output of the microwavedetector. This preamplifier has a gain of 10 and 50 Ω impedance. This also couldnot help in detecting the microwave signal as the noise level too got amplified.Figure 9 displays a typical signal after a preamplifier is used.
It was observed that noise was picked up by the BNC cable when the BNC cablealong with the conduit was kept inside the shield chamber, though the amplitudewas low. So the use of BNC cable was stopped.
130 Pramana – J. Phys., Vol. 74, No. 1, January 2010

Measurement of high-power microwave pulse
Figure 9. Diode detector signal after a preamplifier is used when the BNCcable is kept inside a metal conduit.
3.3 With an RF cable
Microwave signal was recorded successfully when RF cable was used to carry thesignal from the receiving antenna and the diode detector was at the scope endinside the shield chamber. A few shots were taken replacing the receiving antennawith a 50 Ω termination. No signal was recorded with a 50 Ω termination. Thisconfirms that the noise picked up by the detector with RF cable is zero. Figure10 shows a diode detector (Narda make) signal with the antenna at 7 m distancefrom the VIRCATOR window after 30 dB attenuation. Estimated microwave peakpower is ∼59.8 dBm (∼1 kW) at 7 m distance from the VIRCATOR window. Thecorresponding beam peak voltage and current was 256 kV and 9 kA. It was observedthat there was a shot-to-shot variation in the microwave peak power. Duration ofthe HPM pulse (FWHM) also varies from 52 to 94 ns for different shots. Figure11 shows the HPM diagnostics set-up by which HPM signal has been measuredsuccessfully in the presence of significant electrical high frequency noise. A fewattempts were also made to measure the frequency of radiation using YIG basetunable band pass filter. As the pass band frequency of the filter is only ∼100 MHzwe are unable to detect any signal using the filter. Detailed frequency analysis willbe carried out in our future experiments.
Pramana – J. Phys., Vol. 74, No. 1, January 2010 131

Amitava Roy et al
Figure 10. HPM signal from the diode detector when measured with an RFcable.
Figure 11. HPM diagnostics set-up by which HPM signal has been measuredsuccessfully in the presence of significant electrical high frequency noise.
4. Conclusions
High-power microwave has been generated from the KALI-1000 pulse power systemusing a virtual cathode oscillator device. The typical electron beam parameterswere 200 kV, 12 kA, 100 ns, with a few hundreds of A/cm2 current density. HPM
132 Pramana – J. Phys., Vol. 74, No. 1, January 2010

Measurement of high-power microwave pulse
power measurements were carried out with a transmitting–receiving system. Duringthe initial measurements, BNC cable enclosed by a metal conduit was used todetect microwave signal from the diode detector. It was observed that noise wasoverriding the actual microwave pulse. Several attempts were made to minimizethe noise level. Finally, HPM pulse has been successfully detected using wideband antenna, RF cable and diode detector set-up. Signal-to-noise ratio improveddue to inherent shielding present in the RF cable. Also diode detectors are verysensitive to electromagnetic noise and X-rays. Placing them in close proximity topulsed power and e-beam diode that emits X-rays will produce much noise. Inthe improved set-up we have placed the diode detector inside the shield room faraway from the pulse power source. At 7 m distance from the VIRCATOR windowthe estimated microwave peak power was ∼59.8 dBm (∼1 kW). The correspondingbeam peak voltage and current was 256 kV and 9 kA. It was observed that therewas a shot-to-shot variation in the microwave peak power.
Acknowledgemets
The authors are very much thankful to Dr L M Gantayet, Associate Director, BTDGroup, BARC and Dr A K Ray, Ramanna Fellow, BARC for providing useful guid-ance, facilities and efficient manpower. They are also grateful to Dr Lalit Kumar,Director MTRDC for providing the microwave diagnostic set-up and technical sup-port. The authors would like to place on record their sincere thanks to Dr K SBhat, Additional Director, MTRDC, Dr S K Datta, Scientist F, MTRDC and MrVenugopala Rao, SO(G), BARC for their continuous encouragement and support.The authors are thankful to Mr Sailesh Khole, Electronics Division, BARC for pro-viding the preamplifier. They are also thankful to Mrs C I Sujo and Mr GopalJoshi of Electronics Division, BARC for providing the calibration facility.
References
[1] James Benford, IEEE Trans. Plasma Sci. 36(3), 569 (2008)[2] J Benford, J Swegle and E Schamiloglu, High power microwaves, 2nd ed. (Taylor &
Francis, Boca Raton, FL, 2007)[3] L M Earley, W P Ballard, L D Roose and C B Wharton, Rev. Sci. Instrum. 57(9),
2283 (1986)[4] D J Sullivan, J E Walsh and E A Coutsias, Virtual cathode oscillator (VIRCATOR)
theory, in: High power microwave sources edited by V Granastein and I Alexeff (ArtechHouse, Norwood, MA, 1987) p. 441
[5] L E Thode, Virtual cathode microwave device research: Experiment and simulation,in: High power microwave sources edited by V Granastein and I Alexeff (Artech House,Norwood, MA, 1987) p. 508
[6] Y J Chen, A A Neuber, J Mankowski, J C Dickens, M Kristiansen and R Gale, Rev.Sci. Instrum. 76, 104703 (2005)
[7] J Raimbourg, Rev. Sci. Instrum. 75(10), 4234 (2004)
Pramana – J. Phys., Vol. 74, No. 1, January 2010 133


![[PPT]Infrared Radiation, Microwave, Ultraviolet . · Web viewInfrared Radiation, Microwave, Ultraviolet Radiation. Infrared Infrared lamps emits electromagnetic radiation within frequency](https://img.pdfslide.net/doc/110x75/5aa9b1b37f8b9a90188d2f50/pptinfrared-radiation-microwave-ultraviolet-viewinfrared-radiation-microwave.jpg)