Embed Size (px)
Citation preview

1
Measurement of in-plane sheet thermal conductance of single-walled carbon nanotube thin films
by steady-state infrared thermography
Ya Feng1, Taiki Inoue1, Makoto Watanabe1, Shuhei Yoshida1, Yang Qian1, Rong Xiang1, Esko I.
Kauppinen2, Shohei Chiashi1, Shigeo Maruyama1,3
1. Department of Mechanical Engineering, The University of Tokyo, Tokyo 113-8656, Japan
2. Department of Applied Physics, Aalto University School of Science, 15100, FI-00076 Aalto,
Finland
3. Energy NanoEngineering Lab., National Institute of Advanced Industrial Science and
Technology, Tsukuba 305-8564, Japan

2
Abstract
A useful and rapid method for measuring the in-plane sheet thermal conductance of single-walled
carbon nanotube (SWNT) thin films by steady-state infrared thermography is proposed in this study.
The SWNT thin films are suspended between the free ends of two cantilevered silicon thin plates, and
the two anchored ends are kept at different but constant temperatures to achieve steady-state heat
transfer through this silicon-SWNT-silicon bridge in vacuum. The temperature gradient along the
bridge is captured with an infrared camera. A silicon plate with known thermal conductivity acts as a
reference to calculate the heat flux, so that the sheet thermal conductance of SWNT thin films can be
calculated using Fourier’s law after deducting the influence of thermal radiation. The thermal
conductivity of the 50 nm thick SWNT thin film is 68.1 W m−1 K−1.
I. Introduction
Waste heat utilization has attracted worldwide attention due to the acute energy crisis; hence,
thermoelectric (TE) materials, due to their simple and direct conversion of low-grade waste heat into
high-grade electric power, stand out as a promising candidate to alleviate this century’s energy problem
[1, 2]. Of the current commercially available TE materials, high cost, toxicity, inflexibility, and
heaviness hinder their broad application. Therefore, extensive research has been invested in other TE
materials [3-8] that are cheaper, non-toxic, flexible, and lighter, among which single-walled carbon
nanotube (SWNT) thin film shows great potential [5-8]. Although the electrical properties of SWNT
thin films are easily measured using well-established theories and techniques, there are few verified
methods for determining the thermal properties. The reported values vary widely, due to diverse
preparation methods of carbon nanotube (CNT) films or mats, from good conductors to good insulators
[9]. Otherwise, with orders of magnitude thicker supporting substrate [7, 8], parasitic heat loss to the
substrate causes the measured thermal conductance to deviate considerably from the true heat transfer
capability of the thin film under investigation, as do local heaters or contact thermometers. Therefore,
substrate-free and contact-free methods are preferable.
Current substrate-free and contact-free techniques include Raman spectroscopy, which has
proved successful in confirming the superior thermal conductance of graphene sheet [10, 11], although
its imperative and intricate calibration limits its application to more materials. Four-probe
measurement on suspended resistance thermometer microdevices [12] is also frequently adopted,
being independent of the material type [13, 14] and free of calibration, but the demanding sample
preparation procedures restrict its broader application. Another alternative is ultrafast
thermoreflectance [15], yet its calibration and requirement for smooth surfaces without diffuse
3
reflection are also challenging. On the other hand, infrared (IR) thermography is a straightforward and
rapid method for recording the temperature profiles of the targets; along with some ad hoc methods
for calculating the heat flux, it can be developed into an easy and useful technique for contactless
thermal conductance determination [16, 17]. In this study, we establish steady-state IR thermography
measurement to investigate the in-plane sheet thermal conductance of four SWNT thin films with
transparencies of 60%, 70%, 80%, and 90%. The thin films are suspended between the free ends of
two cantilevered silicon thin plates, with a steady-state heat flux flowing through the silicon-SWNT-
silicon bridge and generating a constant temperature gradient, which is recorded with an IR camera.
A silicon plate with known thermal conductivity is the reference for calculating the constant heat flux,
to obtain the sheet thermal conductance of SWNT thin films using Fourier’s law after deducting the
influence of thermal radiation. This novel but simple method can be extended to any other free-
standing thin films.
II. Experimental setup
To measure the thermal conductance, a temperature gradient should be generated in the material
under investigation with a known heat flux. Our experimental setup is arranged to produce quasi-one-
dimensional steady-state heat transportation. Figure 1(b) shows an exploded view of the measurement
setup. A copper heater is placed in the cavity of the insulator and covered with an aluminum plate; on
the other side, parallel to it, is bulk copper. These are the heat source and heat sink, respectively; two
pairs of silicon plates (with widths of 3 or 2 mm and a thickness of 100 μm) with black paint on their
surfaces are then aligned with each other on the heat source and sink. The SWNT thin film is dry-
transferred and suspended between the free ends of one pair of aligned silicon cantilevers. Four
thermocouples are attached with Kapton tape to the surfaces of the silicon plates at the edge of the
heat source or sink, in view of the IR camera, to calibrate the emissivity of the silicon and also to
measure temperature. Moreover, the whole system is kept in a vacuum aluminum chamber with a ZnSe
window (with a diameter of 25 mm), which barely impedes the IR radiation. Below the chamber is a
cooler, to keep the aluminum chamber and the cuboid copper heat sink fixed within it at a constant
lower temperature, while an outside controller provides power to maintain the heater at a constant
higher temperature. Therefore, steady-state quasi-one-dimensional heat transportation is eventually
established along the silicon-SWNT-silicon bridge. Since the measurement is performed under
vacuum, heat convection can be ignored, while the control experiment without free-standing SWNT
thin films and the other unloaded pair of silicon cantilevers are designed to eliminate the influence of
thermal radiation and IR camera fluctuation, respectively, in later calculations.
The IR camera records the thermal behavior of samples from above through the ZnSe window,

4
and Figure 1(a) shows the temperature profile of the quasi-one-dimensional steady-state heat transfer
with a SWNT thin film of 60% transparency. Between the heat source and heat sink is a real-time
thermal image taken with the IR camera, and above is the IR thermography legend. The temperature
on the higher-temperature silicon plate at left is out of the current display range in order to clearly
illustrate the temperature gradient on the SWNT thin film and the lower-temperature silicon plate at
right, which is the reference for calculating the heat flux. However, the temperature on the SWNT thin
film is not real since the emissivity of this image is set at 0.94; this will be calibrated in the following
section. The Avio H2640 high resolution (0.03°C) IR thermal imaging camera with a 25 μm close-up
lens gives a minimum detectable size of 25 μm by 25 μm, with a resolution of 640 by 480 pixels,
giving a 16 mm by 12 mm scan range, and the working distance is 11 mm. This detects IR signals in
the wavelength range from 8 μm to 14 μm.
FIG. 1 (a) The temperature profile of the quasi-one-dimensional steady-state heat transfer. Between the heat
source and heat sink is the real-time thermal image taken by the IR camera, and the thermography legend is

5
placed above. The temperature on the higher-temperature silicon plate at left is out of the current display range
in order to clearly illustrate the temperature gradient on SWNT thin film and the lower-temperature silicon
plate at right. The SWNT in this image has 60% transparency, and the temperature of the SWNT is not real
since the emissivity of the image is set at 0.94; (b) Exploded view of the measurement setup.
The samples in this study are high quality SWNT thin films, which are prepared by aerosol
chemical vapor deposition synthesis method [18], as shown in Figure 2. The SWNT thin films are
collected on low-adhesion filters; thus, they can be easily transferred to practically any substrate, such
as flexible polymers, glass, quartz, silicon, and various metals. Therefore, it is not surprising that we
successfully dry-transfer them to suspend them between the free ends of two silicon cantilevers. These
transparent conductive thin films are expected to be useful in various applications [18], such as solar
cells [19]. Four types of free-standing SWNT thin films with transparencies of 60%, 70%, 80%, and
90%, are examined in this study. Figure 2(a–d) shows optical images of these four thin films, which
indicate that the films become lighter with increasing transparency from left to right. In addition,
Figure 2(e) shows a scanning electron microscopy (SEM) image of SWNT thin film with 80%
transparency and Figure 2(f) a transmission electron microscopy (TEM) image of film with 90%
transparency; these indicate that the thin films are composed of very long SWNTs and that the bundle
sizes are fundamentally quite small, even in some of the isolated SWNT in the TEM image. Figure
2(g) shows Raman spectra of the four SWNT thin films under laser excitation at a wavelength of 532
nm, demonstrating that the films are highly consistent and reproducible [19].

6
FIG. 2 (a–d) the four SWNT thin films with transparencies of 60%, 70%, 80%, and 90%, respectively; the light
color on the very top is the filter paper; (e) is an SEM image of SWNT thin film with 80% transparency; (f) is a
TEM image of that with 90% transparency and (g) shows the Raman spectra of the four SWNT thin films under
laser excitation at a wavelength of 532 nm.
III. Temperature measurement
The cantilevered silicon plates, which are critical for calculating the heat flux, are covered with
black paint of emissivity around 0.94, and the IR camera is calibrated by comparing the temperature
in the thermal image with that of the thermocouples in the same area on the anchored part of the silicon
plate at different temperatures; the IR image taken at the adjusted emissivity then reflects the true
temperature on the silicon. However, the IR image cannot indicate the true temperature of the
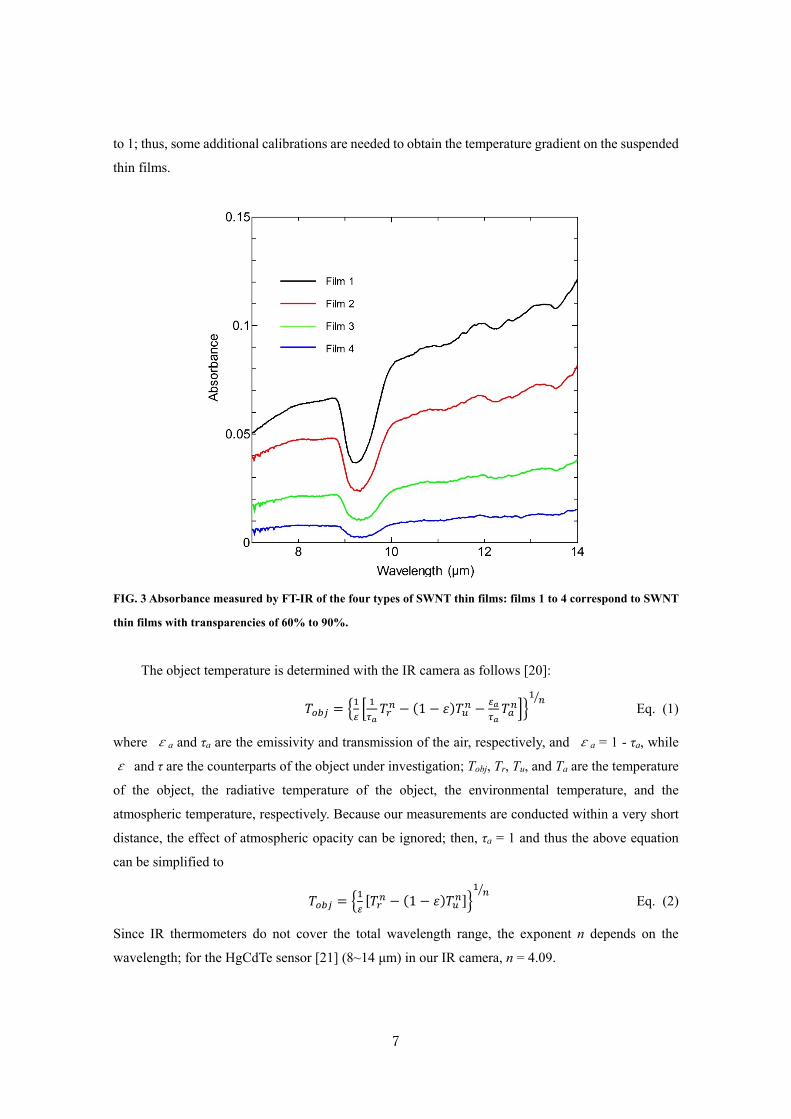
suspended SWNT thin film since its emissivity is significantly different. Via Fourier transform infrared
spectroscopy (FT-IR), the absorbance of the four SWNT thin films is measured and is shown in Figure
3, which indicates that the emissivity of the four highly transparent thin films can be as low as below
0.1, because Kirchhoff’s law states that the emissivity equals the absorptivity when the surface of the
object can be approximated as a gray body. The adjustable emissivity of the IR camera varies from 0.1
7
to 1; thus, some additional calibrations are needed to obtain the temperature gradient on the suspended
thin films.
FIG. 3 Absorbance measured by FT-IR of the four types of SWNT thin films: films 1 to 4 correspond to SWNT
thin films with transparencies of 60% to 90%.
The object temperature is determined with the IR camera as follows [20]:
1 Eq. (1)
where εa and τa are the emissivity and transmission of the air, respectively, and εa = 1 - τa, while
ε and τ are the counterparts of the object under investigation; Tobj, Tr, Tu, and Ta are the temperature
of the object, the radiative temperature of the object, the environmental temperature, and the
atmospheric temperature, respectively. Because our measurements are conducted within a very short
distance, the effect of atmospheric opacity can be ignored; then, τa = 1 and thus the above equation
can be simplified to
1 Eq. (2)
Since IR thermometers do not cover the total wavelength range, the exponent n depends on the
wavelength; for the HgCdTe sensor [21] (8~14 μm) in our IR camera, n = 4.09.

8
IR camera reads temperature Tobj at different setting ε as the blank circles shown in Figure 4, then
the data is fitted to Eq. (2). The fitting curve (red solid line in Figure 4) gives value to fitting parameters
Tr and Tu for the sample under investigation. The obtained Tr and Tu enable us to calculate temperature
in SWNT thin film according to Eq. (2) even with emissivity out of range of the IR camera, so the
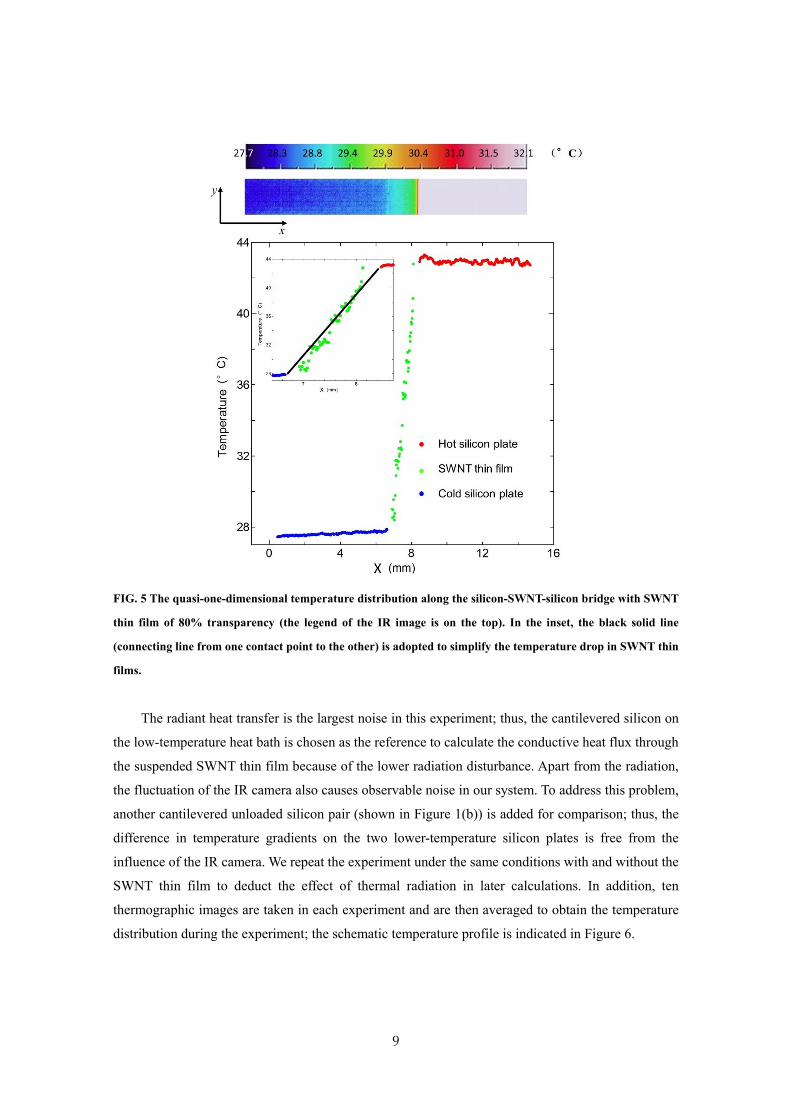
temperature distribution of the suspended thin film can be determined in this way. The temperature on
the y axis at the same x is averaged to obtain the quasi-one-dimensional temperature distribution along
the silicon-SWNT-silicon bridge, as demonstrated in Figure 5. The edge of the suspended thin film is
blurred due to the focus of the IR camera, which leads to some discrete temperature points.
Summarizing, this careful calibration verifies the linear temperature profile in the suspended SWNT
thin film and thus proves the validity of our method. Another indication of this calibration is that the
thermal contact resistance can be ignored, as the continual temperature profile at contacts shown in
Figure 5. This is because the size of thin films and contacts are on the macroscale. Therefore, we take
the temperature of the silicon at the contacts as the temperature of the thin film at those points to
calculate the temperature drop in suspended SWNT thin films, as illustrated by the black solid line in
the inset of Figure 5. This simplification benefits from but leaves out the above intricate calibration
and analyses in future measurements.
FIG. 4 Fitting reading temperature of objects (Tobj) vs. setting emissivity to Eq. (2) to extrapolate the true
temperature gradient in the suspended SWNT thin film.
9
FIG. 5 The quasi-one-dimensional temperature distribution along the silicon-SWNT-silicon bridge with SWNT
thin film of 80% transparency (the legend of the IR image is on the top). In the inset, the black solid line
(connecting line from one contact point to the other) is adopted to simplify the temperature drop in SWNT thin
films.
The radiant heat transfer is the largest noise in this experiment; thus, the cantilevered silicon on
the low-temperature heat bath is chosen as the reference to calculate the conductive heat flux through
the suspended SWNT thin film because of the lower radiation disturbance. Apart from the radiation,
the fluctuation of the IR camera also causes observable noise in our system. To address this problem,
another cantilevered unloaded silicon pair (shown in Figure 1(b)) is added for comparison; thus, the
difference in temperature gradients on the two lower-temperature silicon plates is free from the
influence of the IR camera. We repeat the experiment under the same conditions with and without the
SWNT thin film to deduct the effect of thermal radiation in later calculations. In addition, ten
thermographic images are taken in each experiment and are then averaged to obtain the temperature
distribution during the experiment; the schematic temperature profile is indicated in Figure 6.

10
FIG. 6 Schematic temperature profiles along the silicon-SWNT-silicon bridge with and without SWNT thin film
to calculate the heat flux through suspended thin film.
IV. Results and discussion
One-dimensional steady-state heat transfer from conduction as illustrated in Figure 5 indicates
that the heat flux through SWNT thin film QSWNT thin film equals to that through cooler silicon plate
Qcooler silicon,
Eq. (3)
By incorporating Fourier’s Law into Eq. (3), the following equation is satisfied.
∆
∆ Eq. (4)
In Eq. (4), λ, t, and W are the thermal conductivity, thickness, and width, respectively, of the material
denoted in the subscript. The widths of the silicon plate and SWNT thin film are the same; furthermore,
the thermal conductivity of the silicon plate is available in the literature [22] and its thickness is 100
μm. The temperature gradient on the silicon plate and the SWNT thin film can be calculated from
thermography according to the analyses in the previous section. Then, the product of the thermal
conductivity and the thickness of the SWNT thin film remains to be determined. The thickness of the
SWNT thin film is not easily confirmed, as it is proportional to its transparency or growth time and
varies according to the conditions [18]. Therefore, we decided to treat this product as a new term and
call it the sheet thermal conductance.
The sheet thermal conductance is coined analogously to the sheet resistance. Eq. (5) determines
the sheet resistance, where R is the electrical resistance, σ is the resistivity, A, L, W, and t are the section
area, length, width, and thickness of the material, respectively, RS is the sheet resistance, and its unit
is Ω −1. The electrical conductance Ge is the reverse of the electrical resistance, so Eq. (5) leads to
Eq. (6). Accordingly, the thermal conductance Gt can be expressed as the thermal conductivity λ

11
multiplied by the cross-sectional area A then divided by the length L; the cross-sectional area A can
then be split into the width W and sheet thickness t. Upon combining the film thickness with the
thermal conductivity, the thermal conductance can be written as the second column in Eq. (7), where
Gst is our new term, the sheet thermal conductance. If the film thickness is known, the bulk thermal
conductivity is the quotient of the sheet thermal conductance over its film thickness. The sheet thermal
conductance is a special case of conductivity for materials with a uniform sheet thickness, and the
SWNT thin films investigated in this work fit this description. As the unit Ω −1 is used exclusively
for the sheet resistance, we suggest WK−1 −1 to be the unit of the sheet thermal conductance. In the
measurement of thermoelectric figure of merit, sheet thermal conductance is a convenient alternative
owing to the cancelling out of thickness in calculation.
; ; 1 ∙⁄ ( ) Eq. (5)
; ; Eq. (6)
; ; ⁄ ( ) Eq. (7)
The relationship between the sheet thermal conductance and transparency is plotted in Figure 7.
The sheet thermal conductance decreases as the transparency increases due to the decreasing film
thickness at higher transparency. However, the decrease of sheet thermal conductance with
transparency is not linear. This might be due to the relationship between the non-linear portion of the
transparency and the film thickness. Besides, the TEM image in Figure 2 shows that the density of the
SWNT thin film is not uniform; that is to say, the number of SWNTs is not necessarily linear with the
thickness, while the heat transfer capability of the sheet is the net effect of the individual SWNTs;
hence, there is no guarantee that the sheet thermal conductance should increase linearly with the
thickness or the transparency.
As well as the IR measurement, Raman spectroscopy was also conducted to explore the thermal
properties of the same four SWNT thin films [23], which are denoted by the red dots in Figure 7. The
trend of the Raman results is the same as that of the IR measurements, but the values are 1.9 to 2.5
times lower. Contrary to the well-accepted assumption that near thermal equilibrium is realized
between different phonon polarizations in Raman measurements, a first-principles study with
monolayer graphene has revealed that strong nonequilibrium is common in electrons, optical phonons,
and acoustic phonons, which would result in underestimation of thermal conductivity in experiments
by a factor of 1.35–2.6 at room temperature due to the conditions of the Raman measurements [24],
in which the flexural acoustic, the main heat carrier in suspended graphene [25], shows the largest
nonequilibrium. Flexural acoustic phonons are also major contributors to the high thermal conductivity
[26] in SWNT, and nonequilibrium between different phonon polarizations is expected [27]. Therefore,
this nonequilibrium in the Raman measurement might be the main reason for the differences from the

12
thermal conductivities of SWNT thin films determined by IR measurements.
FIG. 7 The sheet thermal conductance of the four SWNT thin films measured in this work is denoted by the
black squares; those from left to right correspond to the thin films with transparencies of 60%, 70%,
80%, and 90% (the errors originate from standard error of several repeated measurements); the red
dots were determined by Raman spectroscopy [23] with the same SWNT thin films.
Atomic force microscopy and optical interference were adopted to estimate the thickness of the
90% transparency film as around 50 nm. According to the definition of sheet thermal conductance in
Eq. (7), the thermal conductivity of this film can be calculated as around 68.1 W m−1 K−1. This value
is higher than those of the previously measured multi-walled random CNT films and most of the sorted
multi-walled CNT films [9], but this is reasonable because the thin films in this study are composed
of high-quality and very long SWNTs [18, 28], as shown in Figure 2; meanwhile, a single SWNT
possesses very high thermal conductivity [29, 30], which increases with its length [31, 32].
Furthermore, the intrinsic thermal conductivity of a SWNT in the network contributes significantly to
the overall thermal conductance of the thin films [33]. In comparison with other measurements [8, 34],
which indicate much lower thermal conductivity of CNT thin films, the TEM images suggest that the
bundle sizes of the thin films in this study are smaller, and these were expected to contribute the most
to decreasing the thermal conductivity of bulk CNT thin films [35]. Therefore, the less bundled
SWNTs in the thin films in this study might be another main contributor to the high thermal

13
conductivity [36].
V. Conclusion
In summary, we have presented here a substrate-free and contact-free method for the
measurement of in-plane sheet thermal conductance of SWNT thin films with steady-state IR
thermography. The SWNT thin films are free-standing between two cantilevered silicon thin plates,
which work as a reference to calculate the heat flux through SWNT thin film. The temperature profile
along the silicon-SWNT-silicon bridge is recorded with the IR camera. Besides, another unloaded
parallel silicon pair is set to offset the noise from the camera. A control experiment without film is
also conducted to account for thermal radiation. Since the thickness of the SWNT thin film in this
study is hard to determine and is changeable under different conditions, we propose the sheet thermal
conductance to evaluate the capacity for heat transfer of uniform SWNT thin films. The results indicate
the sheet thermal conductance to be 15613.4 ± 2672.5 nW K−1, 9925.4 ± 1417.1 nW K−1, 5454.8 ±
594.9 nW K−1, and 3405.7 ± 773.8 nW K−1 at room temperature for SWNT thin films with a
transparency of 60%, 70%, 80%, and 90%, respectively. Therefore, the 50 nm SWNT thin film of 90%
transparency has a thermal conductivity of around 68.1 W m−1 K−1. The less bundled SWNTs in these
thin films might be an important contributor to the relatively high thermal conductivity. This method
is applicable to any other films that can be free-standing.
VI. Acknowledgement
Part of this work was financially supported by JSPS KAKENHI Grant Numbers JP15H05760,
JP25107002, JP17K06187, and JP17K14601.
References
[1] Bell, L.E., Cooling, heating, generating power, and recovering waste heat with thermoelectric systems. Science,
2008. 321(5895): p. 1457-1461.
[2] Dresselhaus, M.S., et al., New Directions for Low‐Dimensional Thermoelectric Materials. Advanced Materials,
2007. 19(8): p. 1043-1053.
[3] Poehler, T.O. and Katz, H.E., Prospects for polymer-based thermoelectrics: state of the art and theoretical
analysis. Energy & Environmental Science, 2012. 5(8): p. 8110-8115.
[4] Zhang, Q., et al., Organic thermoelectric materials: Emerging green energy materials converting heat to
electricity directly and efficiently. Advanced Materials, 2014. 26(40): p. 6829-6851.
[5] Fukumaru, T., Fujigaya, T. and Nakashima, N., Development of n-type cobaltocene-encapsulated carbon

14
nanotubes with remarkable thermoelectric property. Scientific Reports, 2015. 5: p. 7951.
[6] Nakai, Y., et al., Giant Seebeck coefficient in semiconducting single-wall carbon nanotube film. Applied Physics
Express, 2014. 7(2): p. 025103.
[7] Yanagi, K., et al., Tuning of the thermoelectric properties of one-dimensional material networks by electric
double layer techniques using ionic liquids. Nano Letters, 2014. 14(11): p. 6437-6442.
[8] Avery, A.D., et al., Tailored semiconducting carbon nanotube networks with enhanced thermoelectric properties.
Nature Energy, 2016. 1: p. 16033.
[9] Qiu, L., et al., Remarkably enhanced thermal transport based on a flexible horizontally-aligned carbon nanotube
array film. Scientific Reports, 2016. 6: p. 21014.
[10] Chen, S., et al., Raman measurements of thermal transport in suspended monolayer graphene of variable sizes
in vacuum and gaseous environments. ACS Nano, 2010. 5(1): p. 321-328.
[11] Balandin, A.A., et al., Superior thermal conductivity of single-layer graphene. Nano Letters, 2008. 8(3): p. 902-
907.
[12] Shi, L., et al., Measuring thermal and thermoelectric properties of one-dimensional nanostructures using a
microfabricated device. Journal of Heat Transfer, 2003. 125(5): p. 881-888.
[13] Xu, X., et al., Length-dependent thermal conductivity in suspended single-layer graphene. Nature
Communications, 2014. 5: p. 3689.
[14] Wang, C., et al., Superior thermal conductivity in suspended bilayer hexagonal boron nitride. Scientific Reports,
2016. 6: p. 25334.
[15] Zhu, J., et al., Ultrafast thermoreflectance techniques for measuring thermal conductivity and interface thermal
conductance of thin films. Journal of Applied Physics, 2010. 108(9): p. 094315.
[16] Greppmair, A., et al., Measurement of the in-plane thermal conductivity by steady-state infrared thermography.
Review of Scientific Instruments, 2017. 88: p. 044903.
[17] Lian, F., et al., Thermal Conductivity of Chirality-Sorted Carbon Nanotube Networks. Applied Physics Letters,
2016. 108: p. 103101.
[18] Nasibulin, A.G., et al., Multifunctional free-standing single-walled carbon nanotube films. ACS Nano, 2011.
5(4): p. 3214-3221.
[19] Cui, K., et al., Air-stable high-efficiency solar cells with dry-transferred single-walled carbon nanotube films. Journal of Materials Chemistry A, 2014. 2: p. 11311-11318
[20] Yang, L., Calculation and error analysis of temperature measurement using thermal imager. Infrared Technology,
1999. 21: p.20
[21] Rogalski, A., HgCdTe infrared detector material: history, status and outlook. Reports on Progress in Physics,
2005. 68(10): p. 2267.
[22] Shanks, H., et al., Thermal conductivity of silicon from 300 to 1400 K. Physical Review, 1963. 130(5): p. 1743.
[23] Yoshida, S., et al., Morphology dependence of the thermal transport properties of single-walled carbon
nanotube thin films. Nanotechnology, 2017. 28(18): p. 185701.

15
[24] Vallabhaneni, A.K., et al., Reliability of Raman measurements of thermal conductivity of single-layer graphene
due to selective electron-phonon coupling: A first-principles study. Physical Review B, 2016. 93(12): p. 125432.
[25] Seol, J.H., et al., Two-dimensional phonon transport in supported graphene. Science, 2010. 328(5975): p. 213-
216.
[26] Mahan, G. and Jeon, G.S., Flexure modes in carbon nanotubes. Physical Review B, 2004. 70(7): p. 075405.
[27] Steiner, M., et al., Phonon populations and electrical power dissipation in carbon nanotube transistors. Nature
Nanotechnology, 2009. 4(5): p. 320-324.
[28] Lian, F., Thermal imaging and analysis of carbon nanotube composites. Master Thesis, University of Illinois
at Urbana-Champaign, 2013.
[29] Berber, S., Kwon, Y.K. and Tomanek, D., Unusually high thermal conductivity of carbon nanotubes. Physical
Review Letters, 2000. 84(20): p. 4613-4616.
[30] Yu, C., et al., Thermal conductance and thermopower of an individual single-wall carbon nanotube. Nano
Letters, 2005. 5(9): p. 1842-1846.
[31] Maruyama, S., A molecular dynamics simulation of heat conduction in finite length SWNTs. Physica B:
Condensed Matter, 2002. 323(1): p. 193-195.
[32] Maruyama, S., A molecular dynamics simulation of heat conduction of a finite length single-walled carbon
nanotube. Microscale Thermophysical Engineering, 2003. 7(1): p. 41-50.
[33] Volkov, A.N. and Zhigilei, L.V., Heat conduction in carbon nanotube materials: Strong effect of intrinsic
thermal conductivity of carbon nanotubes. Applied Physics Letters, 2012. 101(4): p. 043113.
[34] Sahoo, S., et al., Thermal Conductivity of Freestanding Single Wall Carbon Nanotube Sheet by Raman
Spectroscopy. ACS Applied Materials & Interfaces, 2014. 6(22).
[35] Prasher, R.S., et al., Turning carbon nanotubes from exceptional heat conductors into insulators. Physical
Review Letters, 2009. 102(10): p. 105901.
[36] Feng, Y., et al., Quantitative study of bundle size effect on thermal conductivity of single walled carbon
nanotubes. Submitted, 2018.