Embed Size (px)
Citation preview

Measurement of Trade Costs
and its Business Implications
Prabir De
RIS, New Delhi
Guest Lecture to MBA (International Business) Students, Indian Institute of
Foreign Trade (IIFT), New Delhi
14 - 16 August 2013

Sections
• Background of trade cost
• Case study
• Online demonstration of trade
cost database and application

Background of trade cost -
discussion Points • Broad understanding of trade facilitation
• Trade facilitation and trade theory
• Relevance trade facilitation
– Trade costs
• Trade facilitation, regional cooperation
and integration

Understanding trade facilitation
• Transaction (e.g. trade) is costly
– intra – and inter – country
• Why?
– Presence of ‘frictions’ of many types
– Objective: To reduce frictional impediments
• What are the broad impediments?
– Visible (hardware, non-price)
• Connectivity (overland, sea, air, etc.)
– Invisible (software, price)
• Trade facilitation (border delay, EDI, etc.)
– Combination of both called ‘Trade Costs’

Price vs. non-price factors • Ricardian model – Classical
– Comparative advantage (factor abundance / technology / price)
• Hecksher-Ohlin-Samuelson (HOS) model – Neo-classical – Relative factor abundance [comparative advantage is determined by
cross-country differences in relative abundance of factor endowments]
– Factor price equalisation
– Assumptions - perfect competition, homogeneous goods, production with constant returns to scale, no transport costs, and mobility of factors between industries and not between countries. [price factor]
• Krugman model - New Trade Theory – Transport cost is incorporated as a factor of determinant,
– Assumptions - Increasing returns to scale, and monopolistic competition (Dixit and Stiglitz, 1977)
– Non-price factor => Transport costs
– Transport costs play a pivotal role in integrating the countries and/or factors.

New trade theory
• In new trade theory, transport cost is incorporated as a factor of determinant, where trade is analyzed in models in a world of increasing returns to scale, and monopolistic competition (e.g. Dixit and Stiglitz, 1977; Krugman 1979, 1980; Krugman and Venables (1990) ).
• One of the implications of the new trade theory is growing interdependence between countries through increased trade and/or increased factor mobility where transport costs play a pivotal role in integrating the countries and/or factors. – Trade network (e.g. FTA – multilateral or regional or
bilateral)
– Production network across countries (e.g. e.g. FTA – multilateral or regional or bilateral)

New flows
• How does trade expand?
– Intensive margin:
• larger quantities of fixed set of goods
– Extensive margin:
• more goods, more destinations
• Exporting firms face two kinds of trade costs
– Marginal costs: tariffs, transportation
– Fixed costs: information, distribution
• Given fixed costs, firms must sell a sufficiently high quantity to make profits
– A fall in marginal costs expands trade along both intensive and extensive margin.
• Existing exporters ship high quantities. More firms export.
– A fall in fixed costs expands trade along the extensive margin.
• More firms can trade.

Trade costs
• Explicit assumptions in trade equilibrium
– Trade costs
• Costs due to policy (tariff, NTB, Quota, ADD)
• Costs due to environment (infrastructure)
• Positive relation
– Infrastructure and trade

Case for trade facilitation
• Barriers to trade above
tariff cause huge loss of
economic welfare.
– Production loss goes
up from abc to ab1c1
– Consumer loss goes
up from def to de1f1
• A move to just free trade
(with FTA) eliminates tariff
barrier but not necessarily
other border barriers.
• Trade facilitation
measures increase the net
economic welfare.
Price, P
Quantity, Q
Supply, S Demand, D
World Price
World Price
+ Tariff
World Price
+ Tariff+ Other
Barriers*
Production
distortion
*Transport, transit, financial, trade procedures, etc.
Consumer
distortion
a
b
c
b1
c
1
d
e
f f
1
e
1

Importance of trade costs
• A growing literature has documented the negative impact of trade costs on the volume of trade
• Tariff barriers are now low in most countries - • Less than 5% for rich countries
• Between 10 – 20%for developing countries
• Between 6- 10% in Northeast Asian countries (>20% in 1991)
• Most of the studies show poor institutions and poor infrastructure penalize trade, differentially across countries.
• Many studies show that liberalisation of international transport services foster international trade very much the same way as tariff liberalization does, e.g. Baier &Bergstrand (2001); Andriamananjara (2004)
• Attention is now being focused on minimization of trade costs through facilitation of merchandise and services trade logistics, both inbound and outbound
• Strategy of trade thus goes beyond the traditional mechanisms of tariffs and quotas.

Definition of trade costs and its
relevance
• Trade costs account all the direct and indirect costs that an exporter / importer incurs. – Transport costs
– Border related costs
– Distribution costs
• Trade costs are richly linked to economic policy. 1. Policy instruments =
Tariffs, NTBs, Quotas, Exchange rates
2. Environmental barriers = infrastructure, language)
• Trade costs have large welfare implications
Trade Costs (170%)
Transport costs (21%)
Freight costs
Transit costs* (9%)
Border related trade
barriers** (44%)
Policy barriers
(Tariff and NTBs) (8%)
Language barrier (7%)
Currency barrier (14%)
Information costs barrier (6%)
Security barrier (3%)
Retail and wholesale distribution costs (55%)

Trade cost and comparative
advantage
Source: Brooks (2008)

Implications of trade costs • Implications for high transport costs at firm level
– Trade costs and firm’s exports are theoretically found to be inversely related (Bernard et al., 2004).
• Long journeys have a negative effect on trade – Doubling the distance increases overall freight rates by 20 to 30 percent
(Hummels, 1999).
• Time delays affect international trade very much the way long journeys do. – On an average each additional day that a product is delayed prior to being
shipped reduces trade by at least 1 percent (Djankov et al., 2006).
• Delivery time is found to have a more pronounced effect for imports of intermediate products.
– The fast delivery of goods is crucial for the maintenance of multinational vertical product chains. Quality aspects of transportation are thus likely to be an important factor in the location decisions of multinational companies (Hummels, 2000).
• Poor institutions and poor infrastructure act as impediments to trade, differentially across countries.
– Quality of infrastructure is an important determinant of trade performance wherein port efficiency alone has the largest impact on trade among all indicators of infrastructure (Nordås and Piermartini, 2004).
• Large welfare implications – For each 1 percent reduction of trade transaction costs, world income could
increase by US$ 30 to 40 billion (Francois et al., 2005)

The Gravity analogy
• Newton’s theory of gravity postulates that the gravitational
force between two objects is directly proportional to each of
their masses, and inversely proportional to the square of the
distance between them.
1
ji
ij
w
ji
ijP
t
Y
YYX
k
ijij7ij7ij6ij5
k
ij4
k
j3j2i1
ji
ij
k
ij RTALang)Adj()D(LntcLn1LnYLnYLnXLn

Case Study (ADB/ESCAP BPA
Study on SASEC Trade
Facilitation) –
applied trade cost

Data Model and Digital
Documents
Data Analysis and
Simplification
Document
Simplification
Business Process
Analysis and
Simplification
Develop electronic
documents
Simplify paper
documents
Analyse information
in the documents
Understand and
simplify business
processes
Trade facilitation: Way to paperless trade

Moving from paperbased to paperless trade
Business Process Analysis
Process simplification and harmonization
Document simplification and alignment
Cross-border data harmonization & exchange
e-Single Window & paperless trade
National data
harmonization

BPA to implement paperless trade
• BPA is the first technical step in preparing for paperless trade and SW.
• International model, universal methodology (UML)
• It provides
– Inventory of processes, documents, data, parties, rules & regulations..
– Description of the processes
– Specifications for harmonizing data and development of electronic documents
– Specifications to develop software for the automation of procedures
– Business Models for operation of SW
– A basis for maintenance and improvement

Commercial Procedures
Transport Procedures
Regulatory Procedures
Financial Procedures
Establish contract
Order goods
Advise on delivery
Request payment
Establish transport contract
Collect, transport and deliver goods
Provide waybill, gods receipt and status reports
Obtain export/import licenses, etc.
Provide customs declaration
Provide cargo declaration
Apply trade security procedures
Clear goods for import/export
Provide credit rating
Provide insurance
Provide credit
Execute payment
Issue statements
Buy Ship Pay
Supplier – Intermediary – Authorities – Customer
Prepare for export
Export Transport Prepare for import
Import
Comprehensive understanding of the
supply chain with help of BPA

A typical Customs process*
Vessel Arrival
Ports
Shipping Line
Cargo Manifest filing
Air/ Shipping Line
Air/ Sea Cargo &
Consol Agents
Cargo Transshipment
Source/ Dest.
Ports
Carrier Agents
License Management
Customs
DGFT
Importer/ CHA
Goods Assessment
Importer/ CHA
Other Govt.
Agencies
Goods Declaration
Importer
Customs Broker
(CHA)
Tax Payment
Banks
Importer/ CHA
Cargo Examination
Custodians
Carrier
Importer/ CHA
Port/ WH Charges
Importer/ CHA
Port Authorities
Cargo Release
Port Custodians
Carriers/ CHA *Import process at an India seaport,
Cargo Release
End
Start
Source: CBEC, Govt. of India

BPA and Single Window Architecture
Preliminary
B
Business
Architecture
C
Information
Systems
Architecture
D
Technology
Architecture
F
Migration
Planning
H
Architecture
Change
Management
A
Architecture
Vision
E
Opportunities
and
Solutions
G
Implementation
Governance
Requirements
Management
Obtain political will Policy: vision & scope
Mandate SW implementation
Appoint SW Task Force
Develop a Master Plan
Conduct Business
Process Analysis
Simplify and standardize
documents and data
Develop an application
Architecture
Enact e-Transaction laws
Establish Standards for Interoperability
Conduct financial
model study
Oversee the
deployment
Migration planning
Establish service
level agreement
Ensure business
continuity & security
Collect lessons learned
Propose next improvement(s)
Source: Somnuk

Business Process Modeling
What
• A technique for documenting a business process and its attributes – Activities that come in a specific order and decision points
– Actors who perform those activities
– Defined inputs and outputs of each activity
– Criteria for entering and exiting the business process
– Relationships among actors
– Information flow
– Associated rules and regulations
– Quantitative indicators such as number of steps as well as time and cost required to complete a particular business process
Why
• To establish a common understanding about a business process that is shared by all relevant parties
• To communicate better all aspects of a business process
Source: Somnuk

Unified Modeling Language (UML)
• A set of standard graphical notations for
documenting a business process and
business requirements�
http://en.wikipedia.org/wiki/Unified_Modeling_Language
Is widely recognized and
used among practitioners in
business community as well
as those in IT and software
industry
Allows business domain
experts to communicate
procedural and
documentary requirements
with IT implementation or
software development team
Source: Somnuk
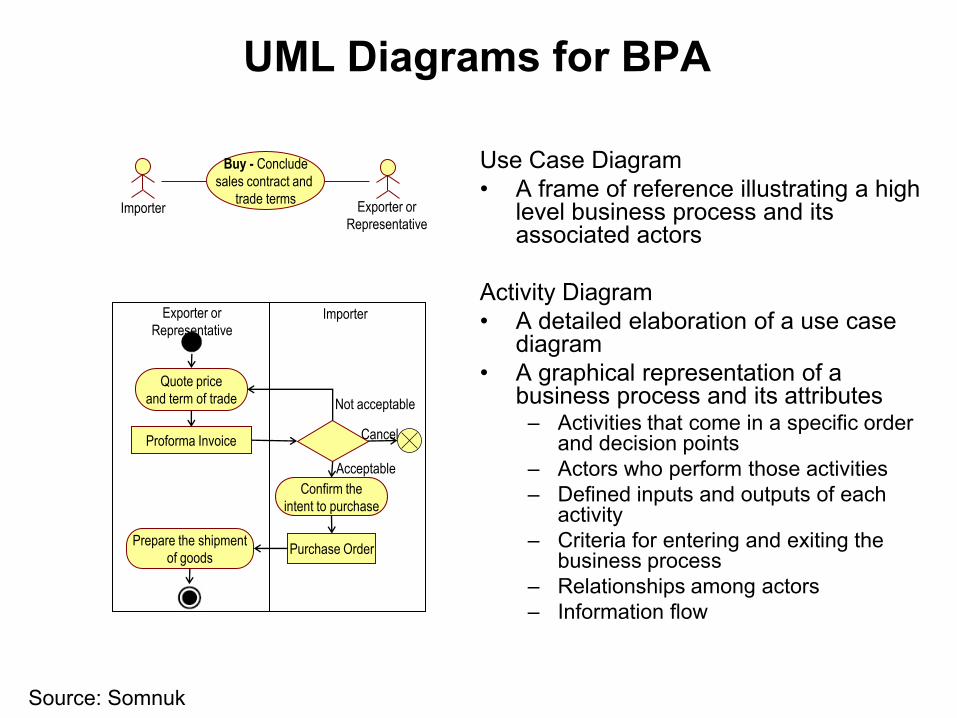
UML Diagrams for BPA
Use Case Diagram
• A frame of reference illustrating a high level business process and its associated actors
Activity Diagram
• A detailed elaboration of a use case diagram
• A graphical representation of a business process and its attributes
– Activities that come in a specific order and decision points
– Actors who perform those activities
– Defined inputs and outputs of each activity
– Criteria for entering and exiting the business process
– Relationships among actors
– Information flow
Buy - Conclude
sales contract and
trade terms Exporter or
Representative Importer
Quote price
and term of trade
Confirm the
intent to purchase
Proforma Invoice
Purchase Order
Not acceptable
Acceptable
Cancel
Prepare the shipment
of goods
Exporter or
Representative Importer
Source: Somnuk

Exercise – Read the Activity Diagram
Exporter (or Representative) Department of Fisheries
(DoF)
Authorized Private
Inspector 2.1) Have
product sampled
and examined Exporter or
Representative Department
of Fisheries (DoF)
Authorized Private
Inspector
Collect
sample
Examine
sample
Record the result
of examination
Test Report
Deliver
sample
Collect
Test Report
Additional
examination required
Additional examination
not required Schedule the
sampling date
Record result
of examination
Examine
sample
Collect
Test Report Test Report
Have product
ready for sampling
Notify the date for
sample collection
Submit Request
for Sampling
Record sampling
result
Request for
Sampling
Collect
sample
Source: Somnuk

Using UML Modeling Tool for BPA
Source: Somnuk

Three Phases of a BPA Project
Project
Sponsor
Project Manager/
Project Leader
Process
Analysts
Process Participants/
Business Domain Experts
1) Define a
project scope
2) Develop a
detailed plan and
secure resources
3) Acquire
background
information
4) Conduct
interviews and document
captured data
5) Analyze the “as-is”
process and identify
bottlenecks
6) Develop and
propose
recommendations
Phase I
Phase II
Phase III
Source: Somnuk

BPA Activities in a Nutshell
I. Scope setting – Specify a scope of processes to be analyzed
– e.g. import and/or export processes of a specified product,
through a certain mode of transportation (trucks, trains, ships or airplanes)
II. Data collection and process documentation – Define and
document a sequence of steps in actual practices and their
attributes
– Who involved (stakeholders/actors)
– Procedures and documents required (input to/output from)
– Related rules and regulation
III. Process analysis – Locate bottlenecks, examine what causes
them, and develop measurable and quantitative process
indicators (e.g. the number of steps, time and costs required to fulfill those
processes)
Recommendation development – Determine how to eliminate
each bottleneck and prioritize improvement actions
Source: Somnuk

Outputs of BPA
Step Deliverable
Step 1: Define project
scope
Use case diagram illustrating business domain, process areas, process participants, and key
business processes
Step 2: Develop a detailed
plan and secure resources
Detailed project plan including an estimation of human resources required, schedules, and
software supported tools
A list of potential interviewees and their contact information
Step 3: Acquire background
information
A folder of background information about the business processes under the investigation
A list of guiding questions for the interview
Step4: Conduct interview
and document captured
data
A set of activity diagrams illustrating activities that come in a specific order and decision points,
actors who perform those activities, defined inputs and outputs of each activity, criteria for entering
and exiting the business process, relationships among actors, and information flow
A set of business process descriptions that describes activity diagram and lists all related rules
and regulations
Activity diagram illustrating integrated processes in the business domain
Time-Procedure chart displaying time required to complete each business process
Step 5: Analyze the “as-is”
processes and identify
bottlenecks
A set of observations of the as-is business processes that have the potential for improvement
Step 6: Develop and
propose recommendations
Final report with recommendations which may include diagrams of “to-be” business processes
Ph
ase
I P
has
e II
Ph
ase
III
Source: Somnuk

Phase I: Scope Setting
Example:
• Regulatory and business
requirements related to the operation
and management of port before,
upon, and after the import and export
of containerized ordinary cargoes
through all modes of transportations
(road, rail, air, and sea) – Carrier scheduling for port use
– Cargo handling
• Import – Starting point: when a carrier enters port
– Ending point: when cargo is picked up and
transferred to an importer
• Export – Starting point: when cargo arrives port
– Ending point: when cargo is on board and
ready to be transferred to the country of
importer
•Airport (Chiengmai)
•Sea Port (Chiengsan)
•Dry Port (Maesai)
•Dry Port (Mukdahan)
•Dry Port (Nongkai)
•Train Station
•Dry Port
•ICD (Ladkrabang)
•Suvannabhumi Airport
•Sea Port (Unithai)
•Etc. •Sea Port
(Lamchabang)
- Site Visited
No. of Interviews = 45
- Phone & email interviews
No. of Interviews = 16
Source: Somnuk

Phase I: Scope Setting Example: Importation by Sea
• Vessel Agent
• Maritime Pilot’s Station
• Marine Department
• Port Operator
• Customs
• Other Government Agencies
• Importer or Representative
• Terminal Operator
• Haulage/Truck
Example: Capturing the
Stakeholders involved in
importation by sea
Draw a use case diagram to
illustrate the business domain
with process areas and
high-level business processes
as well as stakeholders
associated with each of them
Vessel Agent
Port Operator
Marine
Department
Terminal
Operator
Haulage/Truck
Maritime Pilot’s
Station
Customs
Importer
or Representative
Other Government
Agencies
Business Processes
Actor
Enter a seaport
Report cargo
manifest
Unload cargo
Clear goods
through customs
Arrange the
transport for the
pick-up of goods
Handle cargo at
the terminal
Prepare to
enter a seaport
Prepare documents
for import
Pay for goods Bank
Source: Somnuk

Phase II: Data Collection and Process Documentation Example: Prepare to Enter a Seaport Process
For each process, draw an
activity diagram that describes
activities and associated
documentary requirements Vessel Agent
Port Operator
Marine
Department
Maritime Pilot’s
Station Prepare to
enter a seaport
Maritime Pilot’s Station Marine Department Port Operator Vessel Agent
Prepare
documents
Request for
Maritime Pilotage
General
Declaration
Application for
Vessel Entering
Port Area
Prepare the
allocation of
equipments
Assign pilot officer Receive
Receive
Receive
Source: Somnuk

Phase II: Data Collection and Process Documentation Example: Activity Diagram of Prepare to Enter a Seaport Process
Maritime Pilot’s Station Marine Department Port Operator Vessel Agent
Prepare
documents
Request for
Maritime Pilotage
General
Declaration
Application for
Vessel Entering
Port Area
Prepare the
allocation of
equipments
Assign pilot officer Receive
Receive
Receive
Sequence of
actions carried
out to achieve
a specific goal
Swimlane shows a boundary of activities
to be carried out by a responsible actor.
Document associated
with each action
Initial State shows the starting
point for the sequence of
activities.
Final State shows where the sequence of activities reaches its end.
Source: Somnuk

Phase III-1: Process Analysis Example: Prepare to Enter a Seaport Process (Existing Process)
Maritime Pilot’s Station Marine Department Port Operator Vessel Agent
Prepare
documents
Request for
Maritime Pilotage
General
Declaration
Application for
Vessel Entering
Port Area
Prepare the
allocation of
equipments
Assign pilot officer Receive
Receive
Receive
Duplicated data submission:
Three documents with
almost identical data are
handed-in to different
receivers.
Problems :
- Duplicated Information
- High Cost and Time for sending and receiving documents
- Data Inconsistency
Source: Somnuk

Phase III-2: Recommendation Development Example: Prepare to Enter a Seaport Process
Maritime Pilot’s Station Marine Department Port Operator Vessel Agent
Prepare
documents
Request for
Maritime Pilotage
General
Declaration
Application for
Vessel Entering
Port Area
Prepare the
allocation of
equipments
Assign pilot officer Receive
Receive
Receive
Process simplification
Single submission
(electronic means)
Proposed Recommendations :
- Remove unnecessary data requirements
- Harmonize and standardize data requirements
- Automate “prepare to enter a seaport” process
Source: Somnuk

Phase III-2: Recommendation Development Example: Prepare to Enter a Seaport Process (Proposed New Process)
Vessel Agents send
electronic documents to
Marine Dept through NSW
Exchange
Maritime
Pilot’s Station
Port Operator Marine Dept.
Stakeholders :
1) Vessel
2) Value Added Service
3) NSW Exchange
4) Marine Dept.
5) Port Operator
6) Maritime Pilot’s Station
Vessel Agent
Prepare
Update Status
Update Log
Update Log
Update Log
Application for
Vessel Entering
The Port Area
Pilot
Request Form
General
Declaration
NSW Exchange Value-added
Service
Provider
Marine Dept.
Source: Somnuk

Phase III-2: Recommendation Development Example: Time – Procedure Chart of Importation by Sea
9 Main processes
1. Prepare documents for import
2. Prepare to enter a seaport (Vessel)
3. Enter a seaport (Vessel)
4. Report cargo manifest
5. Unload cargo
6. Clear goods through customs
7. Arrange the transport for the pick-up of goods
8. Handle cargo at the terminal
9. Pay for goods
1 2 3 4 5 6 7 8 9
Days
Process
20
10
0
5
15 1 days
1 day
3
8
6
1 day 1 day 4
7
2 day
1
10 day
9
4 day
1
2 3 4 5 6
7
8
9
20 days
12 days 2
2 day 1 day
5
Source: Somnuk

Transport Mode As-Is Usage Time (day)
To-Be Usage Time
(day)
Expected Reduced
Time (day)
Expected Reduced Time (%)
Import by Ship 20 12 8 40.00
Import by Airplane 10 8 2 20.00
Import by Truck 10 7 3 30.00
Import by Train 11 9 2 18.18
Criteria (following UN/CEFACT Recommendation No 18, and other)
• Reduce time for Traveling, Sending and Receiving Documents by humans
• Reduce time for Preparing Documents for next step
• Reduce time for Making Payment
• Reduce time for Searching Information
• Reduce time for Verifying Information
Summary of a study: Usage Time for
Import
Source: Somnuk

ADB/ESCAP Study - Products analyzed Im
po
rt P
roc
es
se
s
Export Processes
Bhutan Bangladesh Nepal
Third
Country
Bhutan
Fruit juice
(0.0, 1.83)
Bangladesh
Orange
(1.54, 6.57)
Lentil
(1.03, 42.56)
Nepal
LAA
(0.06, 1.56)
CSO**
(8.72,82.01)
Third country
Carpet*
(146.36,
60.61)
*Import processes excluded from analysis. ** Export processes excluded from analysis.
LAA and CSO mean lead acid accumulator and crude soya bean oil, respectively.
Data in parentheses are trade volumes in US$ million for the years 2000 and 2010), sourced from
COMTRADE

Study corridors
Corridor Countries
Linked
Distance,
Total
Distance
,
Transit
Products
Traded
Corridor 1 (Nepal corridor)
Kakarvitta-Panitanki-Fulbari-
Banglabandha
Nepal –
India -
Bangladesh
1152 km# 54 km Lentil
LAA*
Corridor 2 (Bhutan corridor)
Phuentsholing-Jaigaon-
Hasimara-Changrabandha-
Burimari
Bhutan –
India -
Bangladesh
630 km^ 115 km Orange
Fruit
juice
Corridor 3 (Nepal corridor)
Kathmandu-Birgunj-Raxaul -
Kolkata
Nepal -
India
1287 km$ 1047 km Carpet
CSO**
*Lead acid accumulator **Crude soya bean oil #Kathmandu to Dhaka. ^Thimpu to
Dhaka $Kathmandu to Kolkata
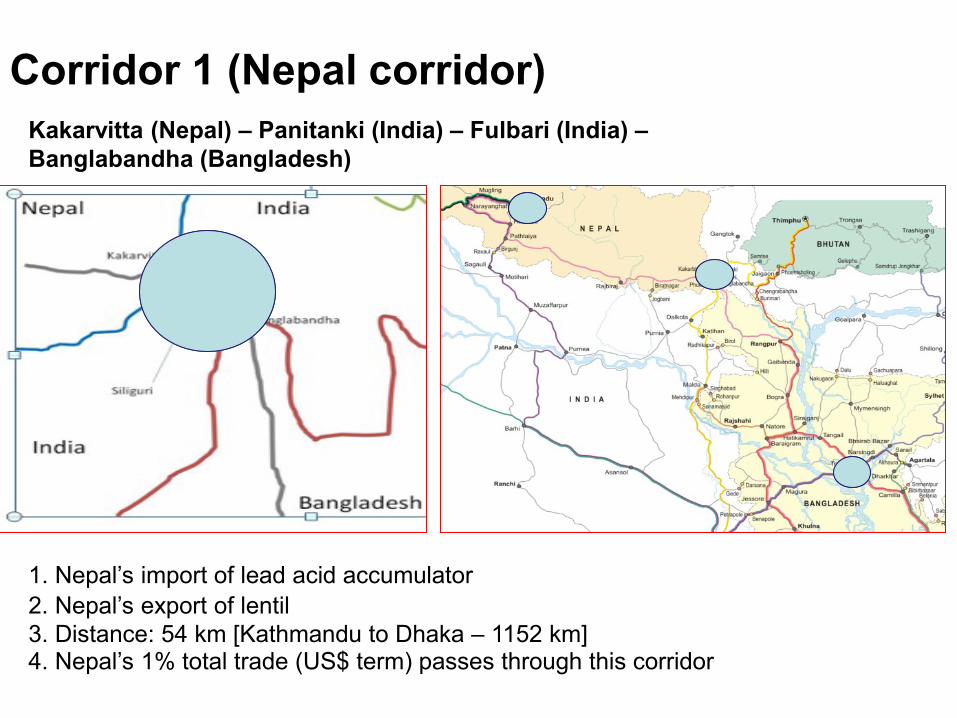
Corridor 1 (Nepal corridor)
Kakarvitta (Nepal) – Panitanki (India) – Fulbari (India) –
Banglabandha (Bangladesh)
4. Nepal’s 1% total trade (US$ term) passes through this corridor
2. Nepal’s export of lentil
1. Nepal’s import of lead acid accumulator
3. Distance: 54 km [Kathmandu to Dhaka – 1152 km]

Corridor 2 (Bhutan corridor)
Phuentsholing (Bhuatn) –Jaigaon (India) –Hasimara (India) –
Changrabandha (India) – Burimari (India)
3. Distance: 115 km
1. Bhutan’s import of fruit juices
2. Bhutan’s export of oranges

Corridor 3 (Nepal corridor) Kathmandu (Nepal) – Birgunj (Nepal) –
Raxaul (India) – Kolkata (India)
1. Nepal’s import of Crude soya bean
oil 2. Nepal’s export of carpet
3. Distance: 704 km (Kolkata port), 832
km (Haldia port)
4. Share of Birgunj customs to total
trade: 44%
Containerized
Cargo
Break Bulk Cargo
No of
Train
Total
TEUs
No of
Train
Total
MT
2008/09 178 14702 7 18242
2009/10 207 17616 81 194313
2010/11 222 19440 128 326826
Growth (%) 12.36 16.11 864.29 845.81
Handling of cargo by ICD Birgunj
Source: Rajkarnikar (2013)

Business processes, time, cost
Corridor Exporter Importer Products Procedures (No.) Time Cost
Exporter Importer Total (Day) (US$/TEU)
Corridor 1:
Kakarvitta-
Panitanki-Fulbari-
Banglabandha
Nepal Banglades
h
Lentil 18 13 31 23.40
791.8
Bangladesh Nepal LAA 12 16 28 29.26
1402.05
Corridor 2:
Phuentsholing-
Jaigaon-
Hasimara-
Changrabandha -
Burimari
Bhutan Banglades
h
Orange 18 14 32 18.60 569.84
Bangladesh Bhutan Fruit
Juice
9 16 25 20.13 527.61
Corridor 3:
Kathmandu-
Birgunj-Raxaul-
Kolkata
Nepal Third
country*
Carpet 23 23 26.00 2285.40
Third
country**
Nepal CSO
21 21
18.00
689.74
**Excluding import processes *Excluding export processes

Parties engaged in export and import
processes
Corridor Exporter Importer Products Parties (No.)
Exporter Importer Total
Public Private Total Public Private Total
Corridor 1:
Kakarvitta-Panitanki-
Fulbari-
Banglabandha
Nepal Bangladesh Lentil 7 7 14 4 5 9 23
Bangladesh Nepal LAA 3 4 7 7 5 12 19
Corridor 2:
Phuentsholing-
Jaigaon-Hasimara-
Changrabandha-
Burimari
Bhutan Bangladesh Orange 10 4 14 3 4 7 21
Bangladesh Bhutan Fruit
Juice
3 4 7 11 2 13 20
Corridor 3:
Kathmandu-Birgunj-
Raxaul-Kolkata
Nepal Third
country*
Carpet 8 7 15 15
Third
country**
Nepal CSO
7 6 13
13
**Excluding import processes *Excluding export processes

Parties dealing procedures by country and
corridor
Sr.
No.
Procedures Public /
Private
1 Contacting importers Private
2 Fixing terms of trade with importer
via Local office
Private
3 Sending draft contract and proforma
invoice
Private
4 Receiving acceptance letter and
acknowledge L/C copy
Private
5 Obtaining cargo insurance2 Private
6 Preparing documents for export3 Private
7 Load in truck and deliver to port Private
8 Deposit chalan fee, VAT and
customs declaration
Public and
Private
9 Customs inspection and clearance
by C& F agent
Public
10 Out Pass handing over by C&F
Agent to importer’s representative
and unloading of the commodity to
importer’s carrier
Private
11 Receive payment Private
Parties Involved in Export of LAA from
Bangladesh to Nepal
Source: Yunus (2013)

Documents and copies required
Corridor Exporter Importer Products Documents & Copies
(No.)
Exporter Importer Total
Corridor 1: Kakarvitta-
Panitanki-Fulbari-
Banglabandha
Nepal Bangladesh Lentil 18
(44)
18
(71)
36
(115)
Bangladesh Nepal LAA 15
(50)
15
(33)
30
(83)
Corridor 2: Phuentsholing-
Jaigaon-Hasimara-
Changrabandha-Burimari
Bhutan Bangladesh Orange 14
(26)
18
(69)
32
(95)
Bangladesh Bhutan Fruit
Juice
9
(30)
16
(44)
25
(74)
Corridor 3: Kathmandu-
Birgunj-Raxaul-Kolkata
Nepal Third
country*
Carpet 19
(44)
19
(44)
Third country** Nepal CSO 22
(49)
22
(49)
**Excluding import processes *Excluding export processes
Numbers in parentheses are copies needed for export and import.
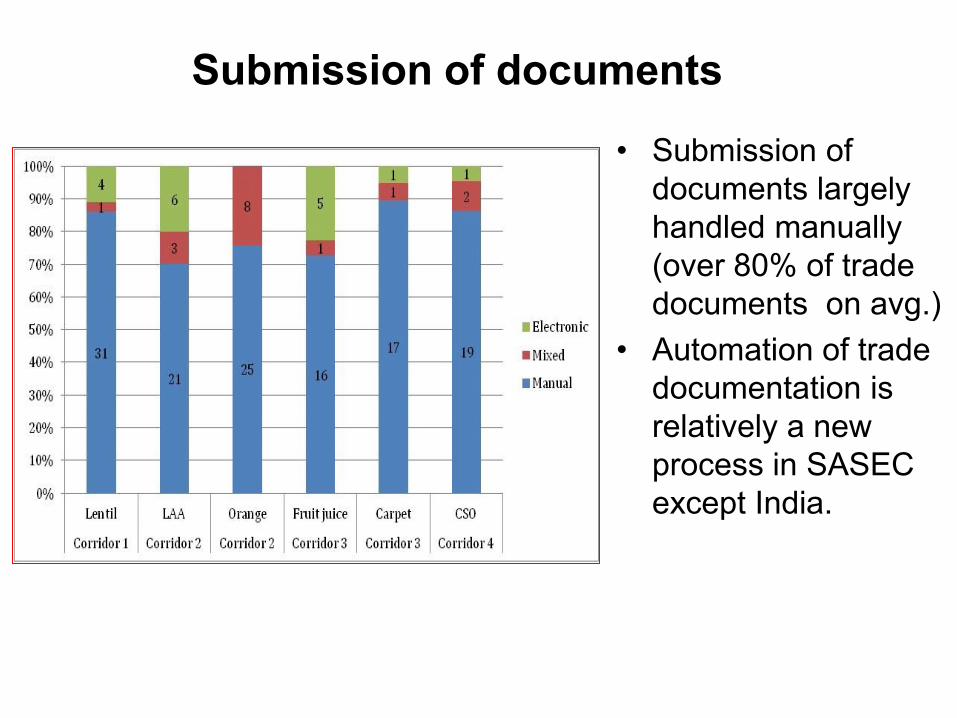
Submission of documents
• Submission of
documents largely
handled manually
(over 80% of trade
documents on avg.)
• Automation of trade
documentation is
relatively a new
process in SASEC
except India.

Performance of ICEGATE in India • ICEGATE - Indian Customs Electronic
Commerce/Electronic Data Interchange
(EC/EDI) Gateway, covers 98% trade of the
country.
• Over 10,000 users registered with ICEGATE,
serving over 1 million importers and exporters,
through 111 Customs locations across India.
• The airlines and shipping agents file manifests
using this facility.
• As on 2011-12, about 9.2 million export/import
documents and about 3.9 million other
documents such as IGMs, EGMs, Consol
Manifests, Query Replies, etc. were transacted.
• About Rs. 5.5 billion was made electronically
through EDI system every day, and about Rs.
139.60 billion was disbursed as export incentive
in 2011-12.
• ICEGATE has saved about Rs. 3.39 billion
transaction costs in 2011-12.
• Its Risk Management System (RMS) received
Prime Minister’s Award.
Sr.
No. Process
Submission of
Documents
1
Buy
Electronic and
manual
2 Obtain export permit Electronic
3 Contract registration and
inspection
Electronic and
manual
4
Excise inspection
Electronic and
manual
5 Obtain cargo insurance Electronic
6 Arrange pre-shipment
inspection
Electronic and
manual
7
Obtain certificate of origin
Electronic and
manual
8
Obtain SAFTA certificate
Electronic and
manual
9 Submit customs declaration Electronic
10
Arrange transport for loading
Electronic and
manual
11 Transfer to LCS Manual
12 Parking of goods at LCS Manual
13
Customs clearance at LCS
Electronic and
manual
14 Send the goods to importer’s
warehouse
Manual
15 Pay Electronic
Indian Export Processes of Export of
Fabrics to Bangladesh

Direct costs of trade in LAA in Corridor 1
Sr. No. Procedures Cost (US$)# Share (%)
1 Fixing terms of trade with importer via local agent 6.00 0.37
2 Cargo Insurance*
3 Documents preparing for export 19.50 1.22
4 Custom Declaration 6.90 0.43
5 VAT*
6 C&F charge 221.00 13.78
7 Customs inspection and clearance 200.00 12.47
8 Out pass from port 1.10 0.07
9 Unload to importers vehicle 8.75 0.55
10 Transport cost 202.00 12.59
Sub-total (export process costs at Bangladesh)
665.25
(1,025) 41.47
11 Contact export agent 0.70 0.04
12 Fix trade term 0.80 0.05
13 Sign and exchange contract 7.40 0.46
14 Service charge for opening L/C 47.00 2.93
15 Obtain approval from AEPC 0.00 0.00
16 Labor charge for loading/unloading at Phulbari/ Banglabandha Custom 31.00 1.93
17 Freight from Phulbari to Kathmandu 573.20 35.74
18 Custom clearing cost for clearing Agent 6.10 0.38
19 Custom clearing cost for NTWLC 203.00 12.66
20 ICD entry fee 1.80 0.11
21 Custom service charge 6.90 0.43
22 Other cost (including informal costs) 60.90 3.80
Sub-total (import process costs at Nepal) 938.80
(2,095) 58.53
Total trade process cost 1604.05 100.00
Exporter: Bangladesh Importer: Nepal

Direct costs of trade in orange in Corridor 2 Sr. No. Procedure Cost (US$) Share (%)
1 Buy 0.00 0.00
2 Obtain trade license 74.55 10.95
3 Membership in BCCI 136.36 20.04
4 Obtain Token No. 9.09 1.34
5 Membership in BEA, Phuentsholing (one-time) 62.51 9.18
6 Open L/C 0.00 0.00
7 Apply for Phyto-sanitary Certificate (PSC) 5.18 0.76
8 Apply for Certificate of Origin 0.27 0.04
9 Apply for labor permit 0.00 0.00
10 Obtain work permit 4.55 0.67
11 Complete Export Documentation 8.75 1.29
12 Obtain export declaration 1.82 0.27
13 Transport to Changrabandha 138.18 20.30
14 Transit to Burimari 0.00 0.00
15 Receive payment 3.18 0.47
Sub-total (export process costs in Bhutan) 444.44
(2,230)
65.30
16 Representative of the importer visits Bhutan and fixes terms of trade with exporter 64.00 9.40
17 Preparing documents for opening Import L/C 8.00 1.18
18 L/C opening in bank 3.75 0.55
19 L/C copy sent to the exporter(via Courier) 5.00 0.73
20 Documents prepared for customs declaration (to be used by C&F agent) 2.50 0.37
21 C&F charge 27.40 4.03
22 Transport from port to trading place 113.00 16.60
23 Customs inspection and clearance 12.50 1.84
24 Collect Out pass from port 0.00 0.00
Sub-total (import process costs in Bangladesh)
236.15
(1,430)
34.70
Total trade process cost 680.59 100.00
Exporter: Bhutan; Importer: Bangladesh
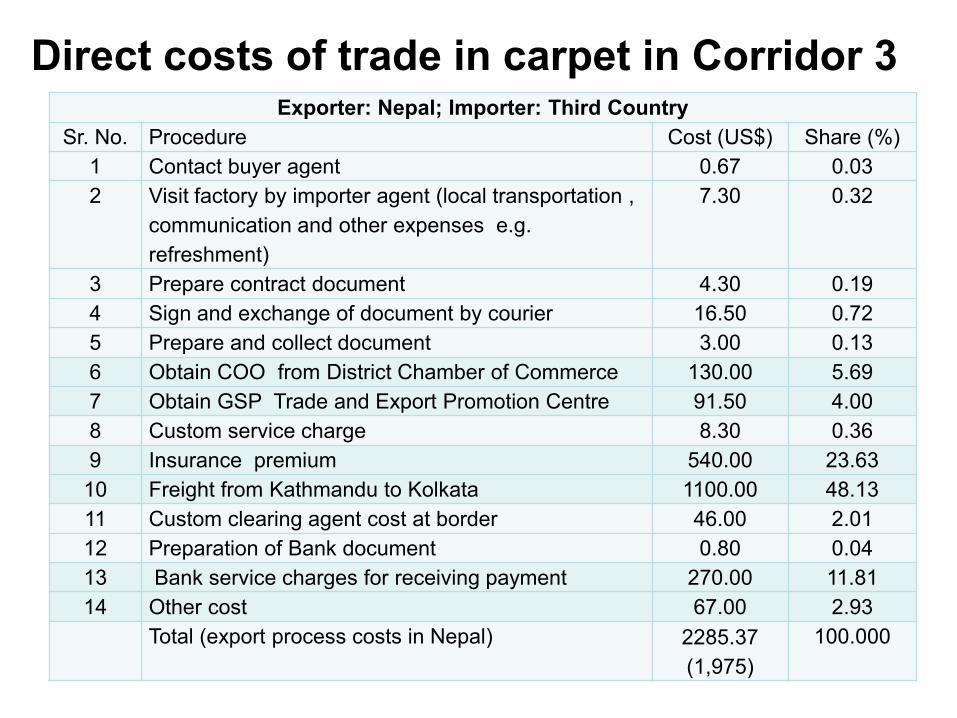
Direct costs of trade in carpet in Corridor 3 Exporter: Nepal; Importer: Third Country
Sr. No. Procedure Cost (US$) Share (%)
1 Contact buyer agent 0.67 0.03
2 Visit factory by importer agent (local transportation ,
communication and other expenses e.g.
refreshment)
7.30 0.32
3 Prepare contract document 4.30 0.19
4 Sign and exchange of document by courier 16.50 0.72
5 Prepare and collect document 3.00 0.13
6 Obtain COO from District Chamber of Commerce 130.00 5.69
7 Obtain GSP Trade and Export Promotion Centre 91.50 4.00
8 Custom service charge 8.30 0.36
9 Insurance premium 540.00 23.63
10 Freight from Kathmandu to Kolkata 1100.00 48.13
11 Custom clearing agent cost at border 46.00 2.01
12 Preparation of Bank document 0.80 0.04
13 Bank service charges for receiving payment 270.00 11.81
14 Other cost 67.00 2.93
Total (export process costs in Nepal) 2285.37
(1,975)
100.000

Export of Lentil by Nepal in Corridor 1 Product: Lentil
Time procedure
chart
Preparation of Customs
documents
Receiving payment

Export of orange by Bhutan in Corridor 2
Product: Orange
Time procedure chart

Export of carpet by Nepal in Corridor 3 Product: Carpet
Time procedure chart

Travel speed at SASEC corridors
• Unlike corridors 2
and 3, speed of
vehicle in transit
(India) is slow in
corridor 1.
• Congestion, bad
quality of road,
inflexible transit time,
narrow width, etc.
force the vehicle to
move slow in corridor
1.

Time spent in transit (India)
• Corridor 3 takes
longer time to cross
transit route (in India)
• Nepal spends over
1/4th of export or
import time in transit in
Corridor 3
– 9 days for export of
carpet (35% of total
export time)
– 5 days for import of
CSO (28% of total
import time)
Caveat: Length varies across corridors

Cost of transit
• Corridor 3
witnesses higher
cost for transit of
goods
– 48 percent in
export of carpet;
– 58 percent in
import of CSO
8.82 6.86
20.30 21.85
48.43
58.41
0
10
20
30
40
50
60
70
Lentil LAA Orange Fruit juice Carpet CSO
Corridor 1 Corridor 2 Corridor 3
%
(75) (110)
(138)(115)
(1095)
(403)
Note: Data in parentheses are actual cost in US$ spent
on transit in India

Export time in Corridor 1
Proces
s Product Exporter Importer Procedure Time (Days)
Export
Lentil
Nepal
Bangladesh
Buy (pre-shipment procedure) 1.00
Export/Import procedures
Documents preparation 8.00
Inland transportation 1.00
Time at Customs 1.00
Time at border 1.00
Time at transit 1.00
Pay (post-shipment procedure) 1.00
Export
LAA
Bangladesh
Nepal
Buy (pre-shipment procedure) 4.00
Export/Import procedures
Documents preparation 12.50
Inland transportation 1.00
Time at Customs 0.56
Time at border 0.76
Pay (post-shipment procedure) 5.00
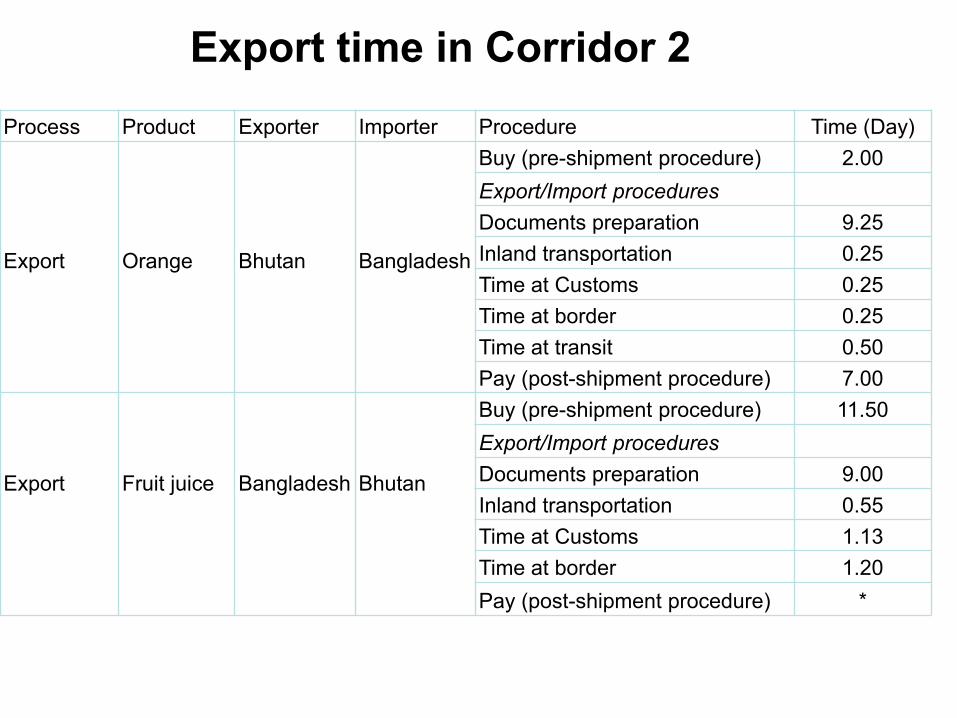
Export time in Corridor 2
Process Product Exporter Importer Procedure Time (Day)
Export
Orange
Bhutan
Bangladesh
Buy (pre-shipment procedure) 2.00
Export/Import procedures
Documents preparation 9.25
Inland transportation 0.25
Time at Customs 0.25
Time at border 0.25
Time at transit 0.50
Pay (post-shipment procedure) 7.00
Export
Fruit juice
Bangladesh
Bhutan
Buy (pre-shipment procedure) 11.50
Export/Import procedures
Documents preparation 9.00
Inland transportation 0.55
Time at Customs 1.13
Time at border 1.20
Pay (post-shipment procedure) *

Export and import time in Corridor 3
Process Product Exporter Importer Procedure
Time
(Days)
Export
Carpet
Nepal
Third
country
Buys (pre-shipment procedure) 5.00
Export/Import procedures
Documents preparation 8.00
Inland transportation 2.00
Time at Customs 2.00
Time at border 2.00
Time at transit 9.00
Pay 1.00
Import
CSO
Third
country
Nepal
Buys (pre-shipment procedure) 4.00
Export/Import procedures
Documents preparation 10.00
Time at transit 11.00
Time at Customs 1.00
Time at border 1.00
Inland transportation 1.00
Pays (post-shipment procedure) 1.00

Submission of documents
• Submission of
documents largely
handled manually
(over 80% of trade
documents on
avg.)
• Automation of
trade
documentation is
relatively a new
process in SASEC
except India.

1. Reduce lengthy Customs and cargo
handling time at Port of Kolkata in Corridor
3 through automation and modernization
Days
3 days
2 days 4
4 days 4 days 3
1 2 Procedures
1 Cargo moves to Kolkata/ Haldia port
2 Custom clearance at Raxoul (India)
3 Custom clearance at Kolkata/Haldia port
4
Loading cargo on vessel at Kolkata/Haldia
port
• Port of Kolkata is a
congested port.
• To ease congestion, faster
loading and unloading at
Kolkata port is essential.
• Cross-border automation
between Customs is
needed
– Cross-border digital CTD
• Need for technical
assistance and capacity
building and training.
9 days

2. Faster opening of L/C account in bank
with the help of ICT
14
days
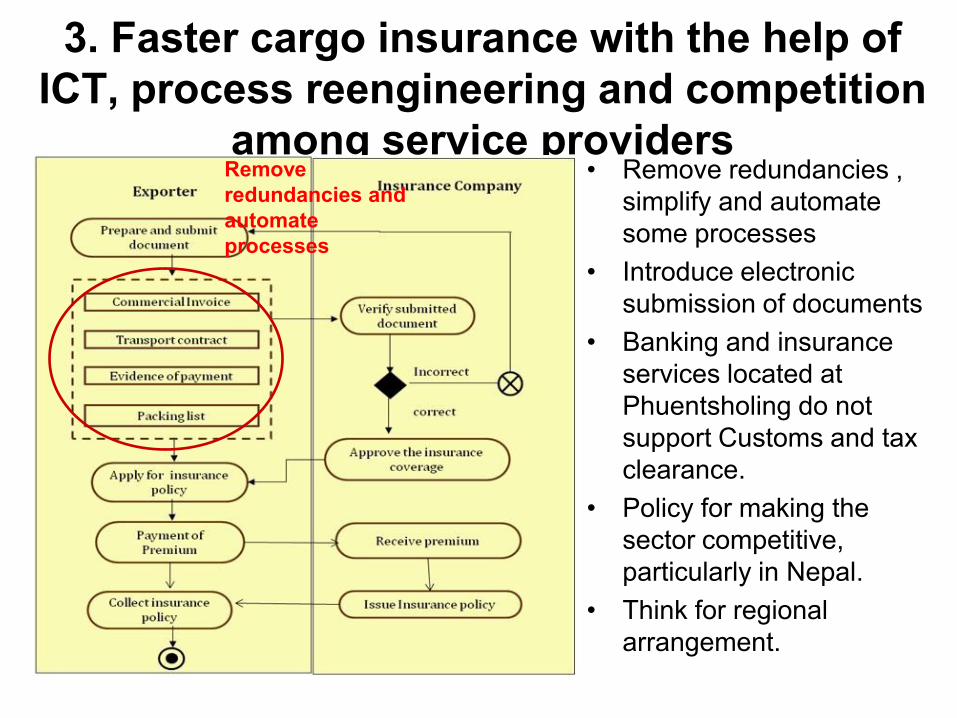
3. Faster cargo insurance with the help of
ICT, process reengineering and competition
among service providers • Remove redundancies ,
simplify and automate
some processes
• Introduce electronic
submission of documents
• Banking and insurance
services located at
Phuentsholing do not
support Customs and tax
clearance.
• Policy for making the
sector competitive,
particularly in Nepal.
• Think for regional
arrangement.
Remove
redundancies and
automate
processes

4. Use of ICT to obtain permits and
certificates
3.50 days 1.50 days
Export of Orange by Bhutan to Bangladesh
Labour Permit Work Permit
Automate
processes

5. Synchronization of cross-border
Customs in SASEC should be the priority
objective. Customs should operate 24x7 basis
Birgunj Custom opens at 8 am whereas Raxaul
Customs opens only at 10 am
Full automation and link-up between Customs
would reduce transaction time and cost
Acceptance of cross-border Bill of Lading
electronically ?
Lead to paperless trade
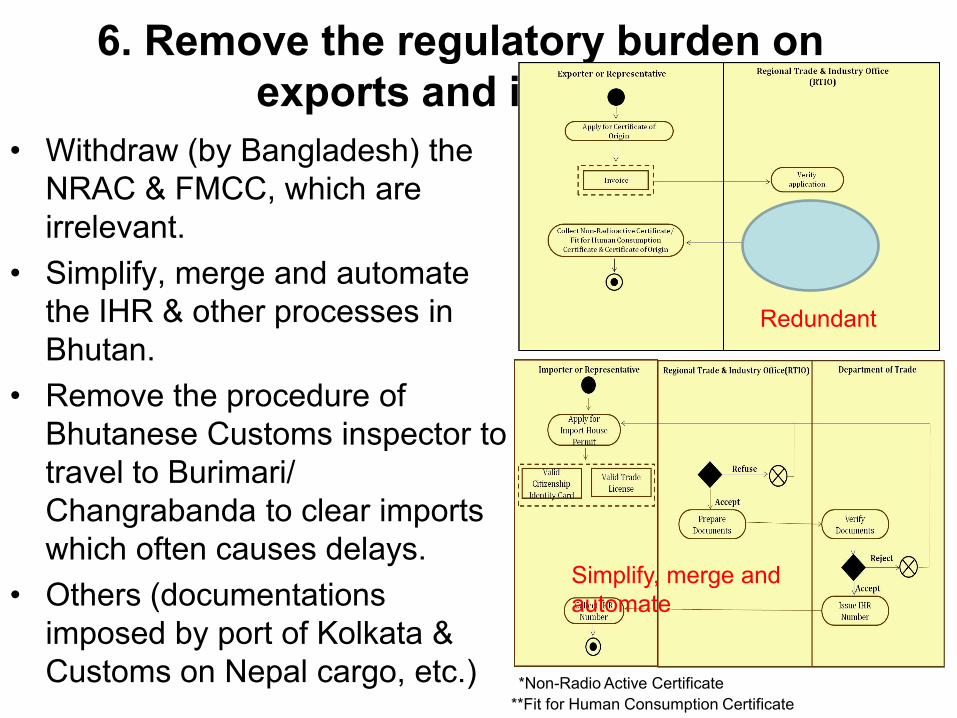
6. Remove the regulatory burden on
exports and imports
• Withdraw (by Bangladesh) the
NRAC & FMCC, which are
irrelevant.
• Simplify, merge and automate
the IHR & other processes in
Bhutan.
• Remove the procedure of
Bhutanese Customs inspector to
travel to Burimari/
Changrabanda to clear imports
which often causes delays.
• Others (documentations
imposed by port of Kolkata &
Customs on Nepal cargo, etc.)
Redundant
Simplify, merge and
automate
*Non-Radio Active Certificate
**Fit for Human Consumption Certificate

7. Trade will be much faster with minimum
process reengineering. • Receiving order from buyer (Bhutan)
takes 11.50 days in case export of fruit
juice from Bangladesh. This procedure
can easily be reduced to just a day or
two with use of ICT.
• Post-shipment payment can be faster;
which can save 2 days for each of the 3
countries in SASEC.
• By making submission of documents
electronically, Bhutan can save over a
week time.
• With application of ICT, opening of L/C
with bank can be reduced to 1-2 days in
Nepal and Bangladesh.
• Harmonization of documentations would
reduce avg. transaction time from over
22 days to less than 10 days in SASEC.
2
10.53 days
(52% improvement)

Actual vs. Target Time for Trade in Lentil
in Corridor 1 Sr. No.
Procedures Location Actual Time (Day)
Target Time (Day)
1 Buy Nepal 1.0 1.0 2 Send Proforma Invoice Nepal 1.0
3 Receive purchase order Nepal 1.0
4 Preparing documents for opening import L/C Bangladesh 1.0 2.0 5 Import L/C opened in Bank Bangladesh 4.5
6 L/C copy sent to exporter by courier Bangladesh 2.5
7 Receive L/C Nepal 3.0 2.0
8 Approval of exporter on L/C Bangladesh 1.0 0.5
9 Preparing documents for customs & sent to CFA Bangladesh 4.5 2.0
10 Deposit Chalan Fee by CFA Bangladesh 0.1 0.1
11 Obtain COO Nepal 1.0 2.0 12 Obtain insurance policy Nepal 1.0
13 Appoint clearing agent Nepal 1.0
14 Arrange transportation Nepal 1.0 1.0
15 Move cargo to border Nepal 1.0 1.0
16 Obtain quarantine certificate Nepal 1.0 1.0
17 Custom clearance at border (Kakarvita) Nepal 1.0 1.0
18 Custom clearance at transit custom India 1.0
0.5 19 Move cargo to importer customs India 1.0
20 Customs inspection and clearance Bangladesh 0.3 0.3
21 Out Pass handed over by CFA to importer’s representative
Bangladesh 0.1 0.1
22 Transport to importer ‘s warehouse Bangladesh 1.0 0.5
23 Pay Bangladesh 4.0 2.0
Total 23.4 15.0 (36%
improvement)
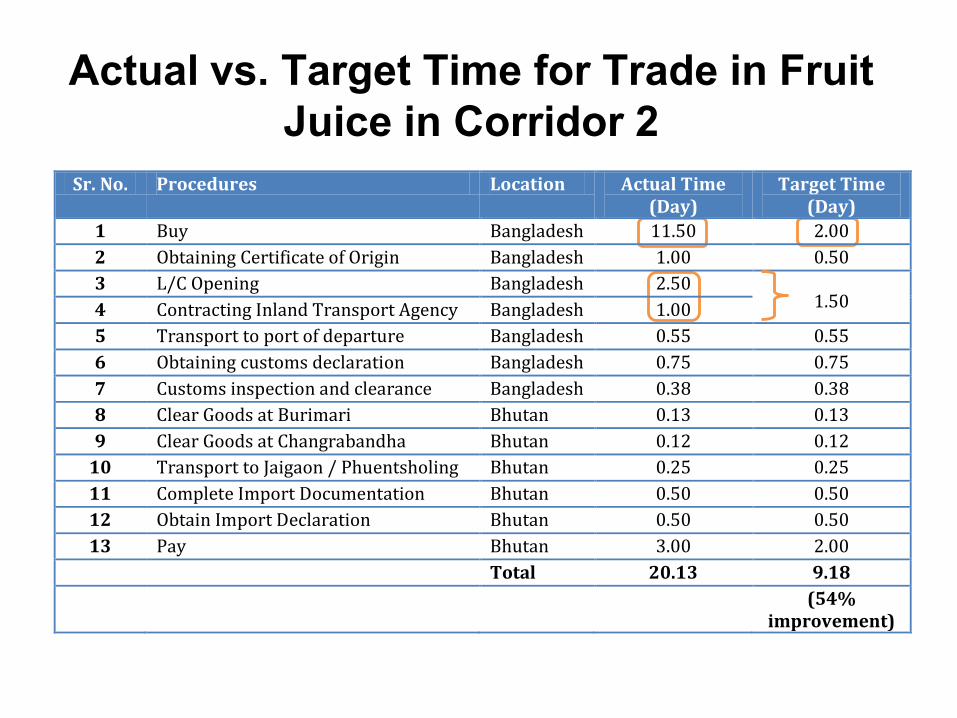
Actual vs. Target Time for Trade in Fruit
Juice in Corridor 2
Sr. No. Procedures Location Actual Time (Day)
Target Time (Day)
1 Buy Bangladesh 11.50 2.00
2 Obtaining Certificate of Origin Bangladesh 1.00 0.50
3 L/C Opening Bangladesh 2.50
1.50 4 Contracting Inland Transport Agency Bangladesh 1.00
5 Transport to port of departure Bangladesh 0.55 0.55
6 Obtaining customs declaration Bangladesh 0.75 0.75
7 Customs inspection and clearance Bangladesh 0.38 0.38
8 Clear Goods at Burimari Bhutan 0.13 0.13
9 Clear Goods at Changrabandha Bhutan 0.12 0.12
10 Transport to Jaigaon / Phuentsholing Bhutan 0.25 0.25
11 Complete Import Documentation Bhutan 0.50 0.50
12 Obtain Import Declaration Bhutan 0.50 0.50
13 Pay Bhutan 3.00 2.00
Total 20.13 9.18
(54% improvement)

Actual vs. Target Time for Trade in Carpet
in Corridor 3 Sr. No. Procedures Location Actual Time
(Day) Target Time
(Day)
1 Buy Nepal 1.0 1.0
2 Factory visit and selection of sample Nepal 1.0 1.0
3 Prepare contract document Nepal 1.0
1.0 4 Sign and exchange of contract Nepal 1.0
5 Sample dispatch to importer Nepal 1.0 1.0
6 Receive purchase order Nepal 1.0 1.0
7 Receive advance payment, or L/C Nepal 1.0 1.0
8 Prepare export document Nepal 1.0
1.0 9 Obtain COO Nepal 1.0
10 Obtain GSP Nepal 1.0
11 Obtain insurance Nepal 1.0 1.0
12 Arrange transportation Nepal 1.0
1.0 13 Appoint CFA and handover document Nepal 1.0
14 Move cargo from factory to Birgunj (Nepal) Nepal 2.0
2.0 15 Custom clearance at exporter custom's premise Nepal 2.0
16 Cargo moves to Kolkata/ Haldia port from Birgunj Nepal 4.0
2.0 17 Custom clearance at Raxaul (India) India 4.0
18 Custom clearance at Kolkata/Haldia port India 2.0 1.0
19 Loading cargo on vessel at Kolkata/Haldia port India 3.0 1.0
20 Preparation of bank document Nepal 1.0 0.5
21 Pay Third country 1.0 1.0
Total 26 17.5 (33%
improvement)

8. Acceptance to subregional transit
• Elimination of transshipment system in Banglabandha
(Bangladesh) can save one day.
• Subregional transit in SASEC is a doable project.
• Transit will help Bangladesh, Bhutan and Nepal to reduce
costs and time of transportation and benefit from
seamless movement of vehicles.
• It would lead to generate cross-border production
networks in SASEC (e.g. food processing, T&C, etc.)
• To start with, subregional transit may be allowed in
Corridors 1 and 2.
• Is GMS CBTA a template to follow? Any lessons from
CAREC? Or any other region?

9. Development of border infrastructure at
Corridors 1 and 2 is must. Banking & finance •Setting-up bank in Panitanki and Phuklbari (India)
Testing lab and
equipment
•Setting-up testing laboratory / facilities at Phuentsholing
•X-ray machines in all the LCSs
Warehouse and
parking
•Add parking spaces and warehouses in Panitanki (India), Jaigaon
(India), Phuentsholing (Bhutan), Changrabandha (India), Birganj (Nepal),
Raxaul (India), etc.
Cargo handling •Phuentsholing needs cranes, loaders, forklifts and scanning machines,
etc.
•Birgunj need modern handling equipment
•Changrabanda and Jaigaon need office and handling equipment.
•Birganj ICD needs modern handling equipment
Approach road •Road to Kakarvitta from Panitanki and Raxaul to Birgunj congested and
narrow. Need to be improved – either separate bypass or underpass
•Road condition is not good between Phuentsholing and Hasimara (18
km) and Birpara and Dhupguri (25 km) in India. Development is needed.
Service facilities • All border posts urgently need addition of service facilities in terms of
hotel, Internet, etc. to operate 24x7.
Electricity •All the border facilities face frequent power cut. Uninterrupted supply of
electricity is essential to have the port work 24x7. Captive power facility?
Rolling stocks and
railway service
•Increase number of trailers in both Raxaul and Birgunj. •Availability of railway engine at Birgunj ICD

10. National single window is essential
for paperless trade in SASEC.
• e-filling of documents in
Bhutan can save lot of
time and cost. Same also
applies to Nepal and
Bangladesh.
• Payment of duties and
incentives should be
done electronically.
• Pilot project may be
initiated in Bhutan.
• This would effectively
lead to establish national
window in Bhutan and
other SASEC countries.
2.1 Obtain Trade
License RTIO
2.3 Obtain Token Number
2.5 Apply for Phyto-sanitary
Certificate
RBP
2.6 Apply for RAC & FHCC
2.7 Apply for Labor Permit
2.8 Obtain Work Permit
MoH
BCCI
BAFRA
2.11 Transport to Jaigoan &
Changrabanda
DOL
BEA
Bhutanese Exporter
Bangladeshi Importer
1. BUY
3. PAY
Importer’s Bank
Exporter’s Bank
2. SHIP
2.4 Obtainer BEA Membership
2.10 Obtain Export Declaration
Indian Customs
2.2 Obtain BCCI Membership
Indian Security
2.9 Complete Export Documentation
2.12 Transport to Burimari
DOI
CFA
RRCO
Transporter
Use Case Diagram: Bhutan’s Export
of Orange to Bangladesh

Suggested policy measures • Minimize physical inspection except special cases (e.g.
security), using risk management techniques (RMS)
• Permits and licences online only and eliminate fees
• Convergence and build common standards
• Accept to SASEC transit , 24x7 Customs, etc.
Procedural
• Harmonize Customs & other trade processes, data, etc.
• Phase-out manual process and move towards electronic system
• Acceptance of electronic signature in trade across borders
Documentary
• National and subregional (SASEC) TF performance monitoring system
• Regular and timely publication of all border measures
• Payment through digital system
Transparency
• Cargo handling equipment, testing lab., banks, etc.
• Improved border corridors and management
• Faster handling of goods at Kolkata/Haldia port
• Capacity building & training
• National and subregional single windows
Infrastructure
Financing
• Availability of Insurance at lower rate
• Eliminate bank charges
• Faster opening of L/C with bank
• Faster post-shipment payment

Trading across Borders: Comparisons
with World Bank DBD, 2013
Economy
Time to export (days) Cost to export (US$/TWE)
WB ESCAP ADB WB ESCAP ADB
Bangladesh1 25.00 13.50 23.26 1025.00 1015.00 [463.25]
Bhutan2 38.00 # 20.00 2230.00 # [435.69]
India3 16.00 22.00 # 1120.00 532.00 #
Nepal4 41.00 40.5 26.00 1975.00 1066.86 2285.40
Economy
Time to import (days) Cost to import (US$/TEU)
WB ESCAP ADB WB ESCAP ADB
Bangladesh1 34.00 9.00 17.10 1430.00 [415.00] [134.15]
Bhutan2 38.00 # 15.00 2330.00 # [303.01]
India3 20.00 13.00 # 1200.00 359.00 #
Nepal4 38.00 22.00 18.00 2095.00 [320.00] 689.74
Notes: 1. Export of garments and import of fabrics for ESCAP and export of LAA and import of lentil in case of ADB. 2. Export of orange and import of
fruit juice in case of ADB. 3. Export of fabrics and import of rubber tyres for ESCAP; 4. Export of vegetable ghee and import of fabrics for ESCAP and
export of carpet and import of CSO for ADB. [ ] indicate that the bracketed numbers are not comparable to those of DBD since they do not reflect the
cost of moving goods to the nearest port; *DBD 2013 presents data for the year 2012 whereas the ESCAP (ARTNeT) data were collected in 2010.
#Bhutan was not considered in ESCAP study, whereas India was not considered for ADB study.
Sources: Calculated based on World Bank’s DBD (2013), ESCAP (2011) and ADB country studies

Online Demonstration of
Trade Cost – ARTNeT Trade
Cost Database
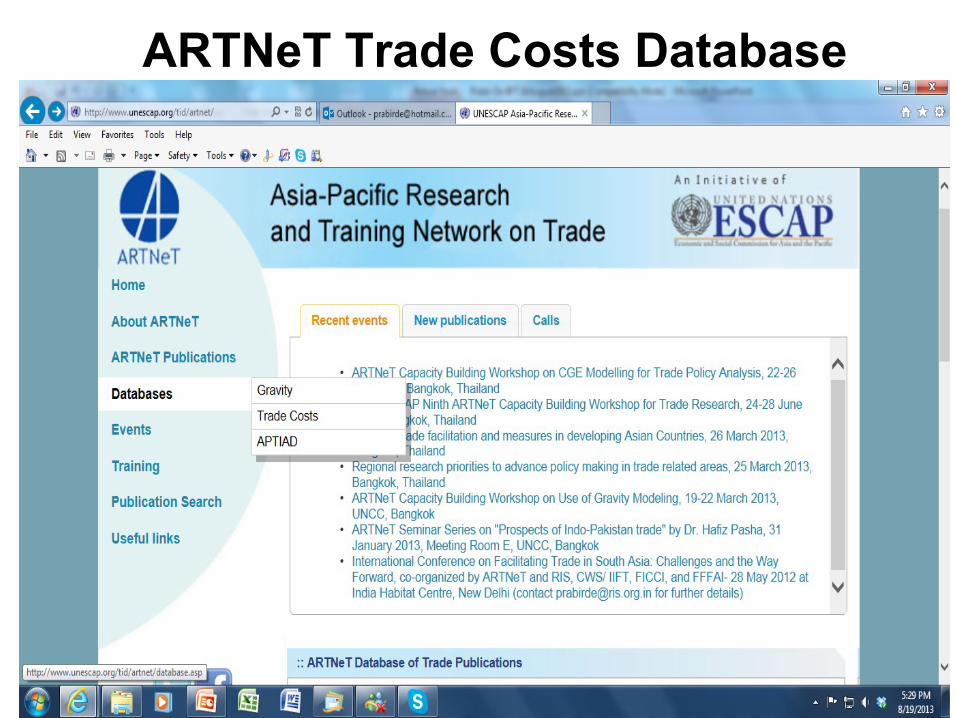
ARTNeT Trade Costs Database

ARTNeT Trade Costs Database