Embed Size (px)
Citation preview
www.ghsp.com
A JSJ Business
Measurement Systems Analysis
Components
and
Acceptance Criteria
Rev: 11/06/2012
www.ghsp.com
A JSJ Business
Purpose
• To understand key concepts of measurement
systems analysis
• To understand potential sources of
measurement error and its affect on both
process and part quality
www.ghsp.com
A JSJ Business
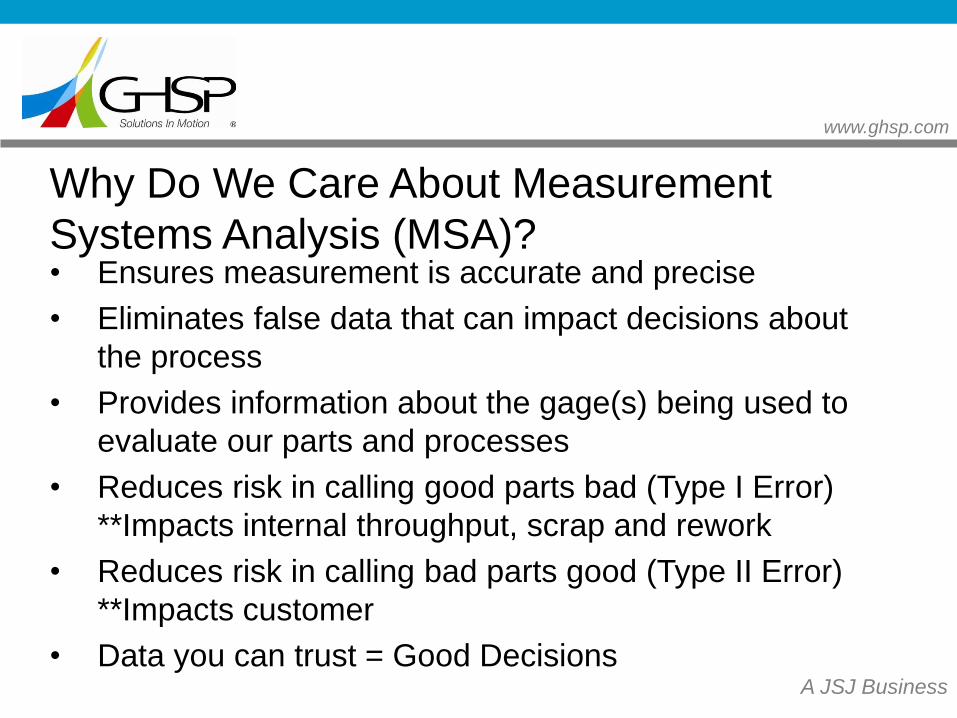
Why Do We Care About Measurement
Systems Analysis (MSA)? • Ensures measurement is accurate and precise
• Eliminates false data that can impact decisions about
the process
• Provides information about the gage(s) being used to
evaluate our parts and processes
• Reduces risk in calling good parts bad (Type I Error)
**Impacts internal throughput, scrap and rework
• Reduces risk in calling bad parts good (Type II Error)
**Impacts customer
• Data you can trust = Good Decisions
www.ghsp.com
A JSJ Business
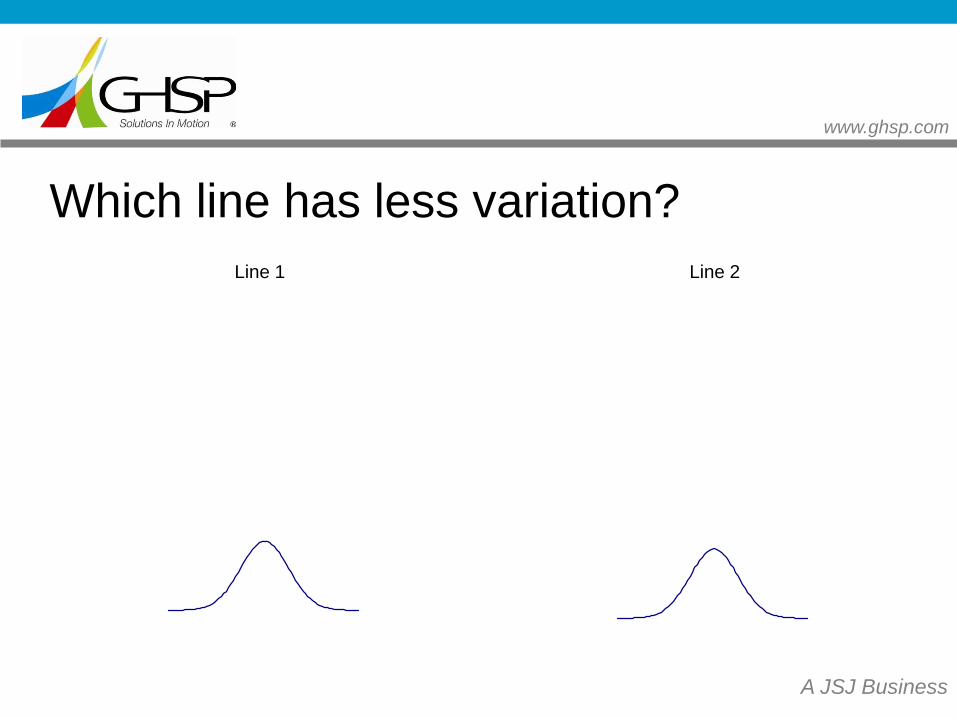
Which line has less variation?
Line 1 Line 2
www.ghsp.com
A JSJ Business
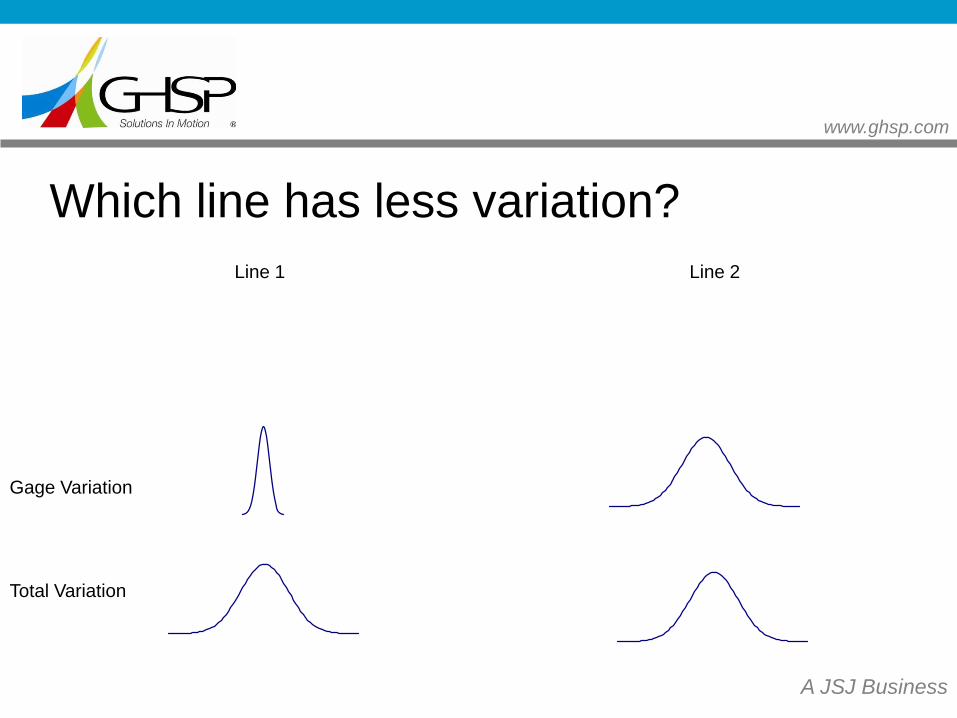
Which line has less variation?
Line 1 Line 2
Gage Variation
Total Variation
www.ghsp.com
A JSJ Business
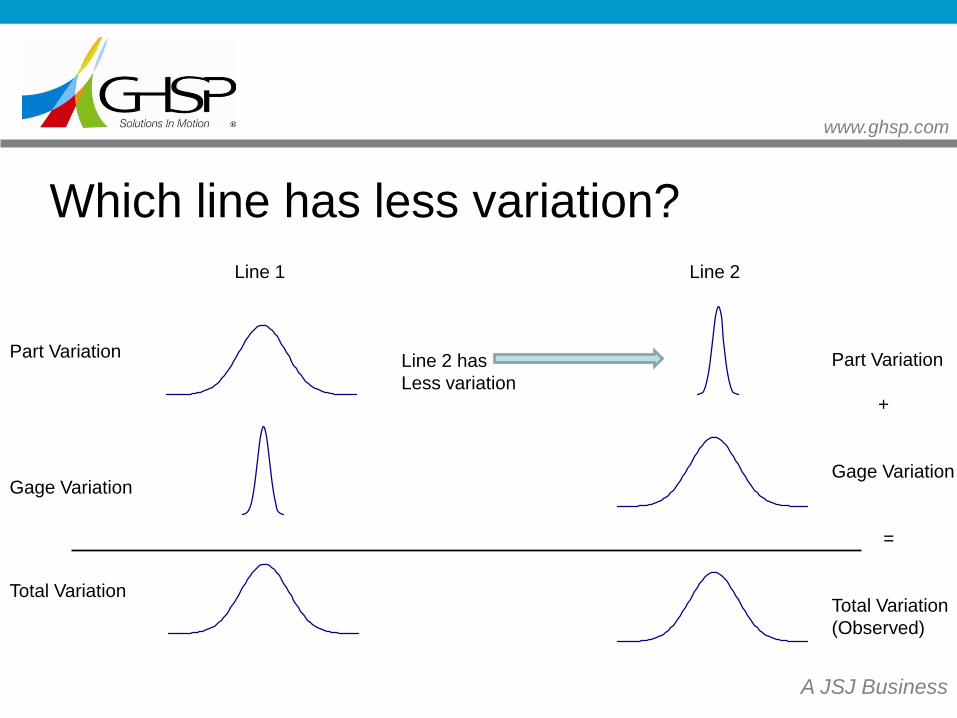
Which line has less variation?
Line 1 Line 2
Gage Variation
Total Variation
Part Variation Part Variation
+
Gage Variation
=
Total Variation
(Observed)
Line 2 has
Less variation
www.ghsp.com
A JSJ Business
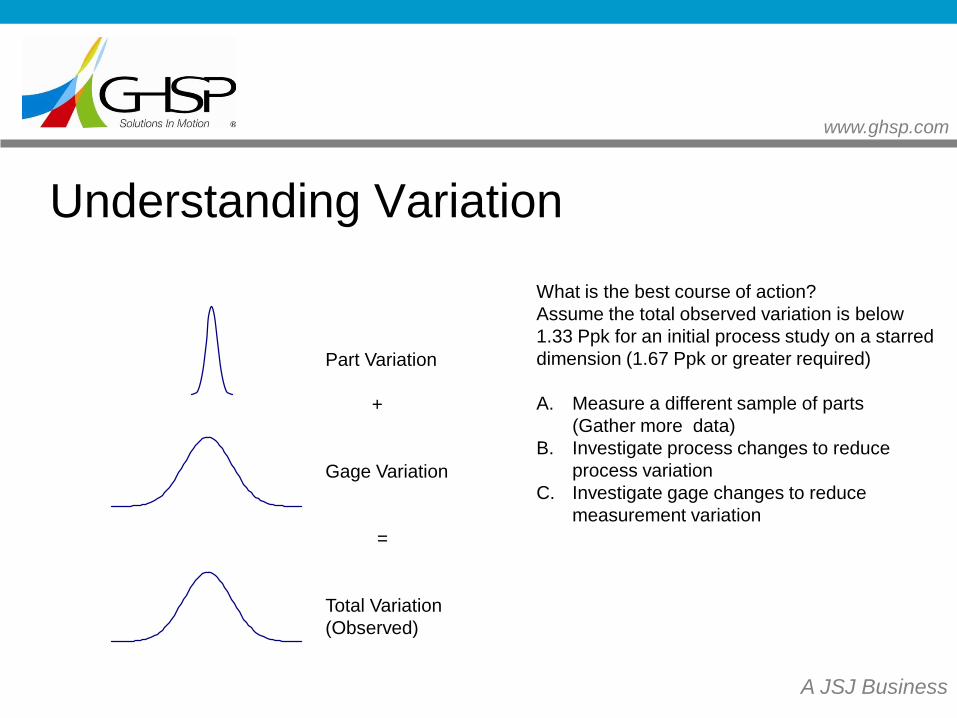
Understanding Variation
Part Variation
+
Gage Variation
=
Total Variation
(Observed)
What is the best course of action?
Assume the total observed variation is below
1.33 Ppk for an initial process study on a starred
dimension (1.67 Ppk or greater required)
A. Measure a different sample of parts
(Gather more data)
B. Investigate process changes to reduce
process variation
C. Investigate gage changes to reduce
measurement variation
www.ghsp.com
A JSJ Business
How do you decide what to do?
• What are typical reactions to measuring a part
out of tolerance?
• Adjust processes / implement additional detection
methods
• Quarantine / Sort / Scrap parts
• Review PFMEAs and Control Plans
• Before doing all this verify the measurement
system
www.ghsp.com
A JSJ Business
MSA Components
• What does a measurement system analysis
consist of?
www.ghsp.com
A JSJ Business
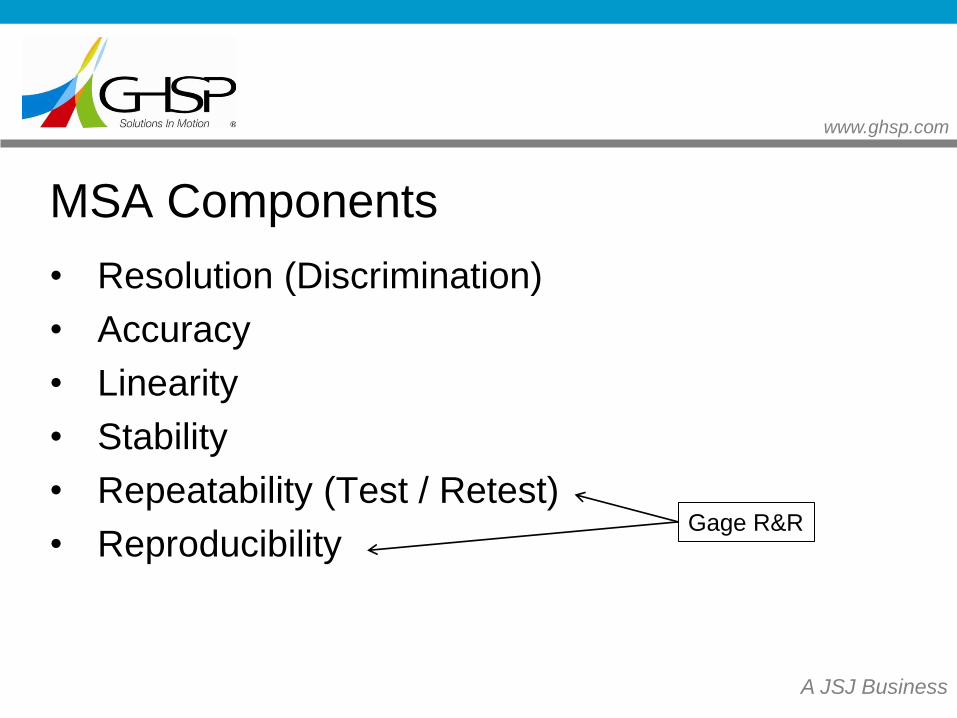
MSA Components
• Resolution (Discrimination)
• Accuracy
• Linearity
• Stability
• Repeatability (Test / Retest)
• Reproducibility Gage R&R
www.ghsp.com
A JSJ Business
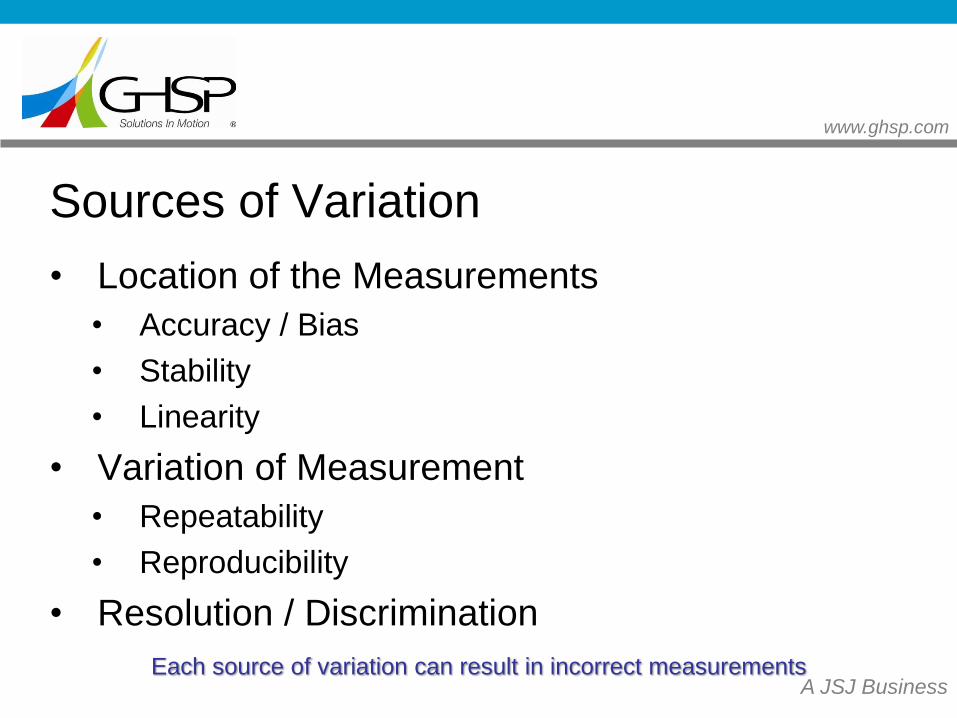
Sources of Variation
• Location of the Measurements
• Accuracy / Bias
• Stability
• Linearity
• Variation of Measurement
• Repeatability
• Reproducibility
• Resolution / Discrimination
Each source of variation can result in incorrect measurements
www.ghsp.com
A JSJ Business
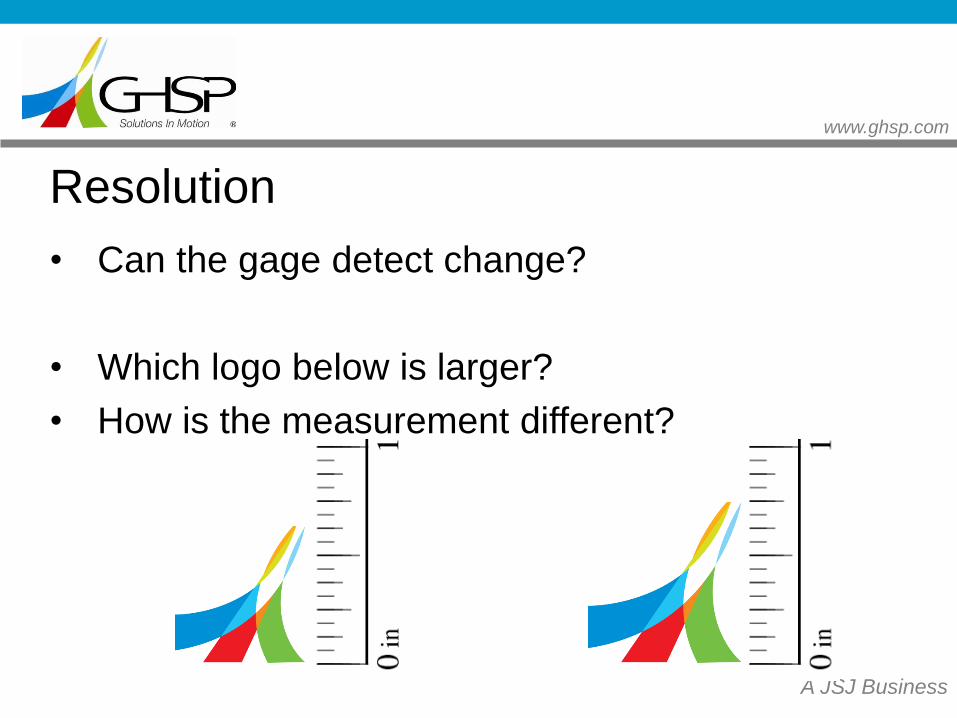
Resolution
• Can the gage detect change?
• Which logo below is larger?
• How is the measurement different?
www.ghsp.com
A JSJ Business
Resolution - Response
• Select gages that have greater levels of
discrimination (smaller increments)
• Record all measurement data, i.e. if a gage
measures to 3 decimal points record all three
• As a general rule gage discrimination should be
1/10th of the product tolerance
• Product tolerance: 0.100
• Gage tolerance: 0.010 (Recommended minimum)
www.ghsp.com
A JSJ Business
Accuracy
What is accuracy?
• The difference between the measured average value and the
master value or the ‘Shift’ from ‘True’ value
• The master value needs to come from a traceable measurement
source (ex. CMM)
• Although accuracy and bias are often used interchangeably it is
best practice to refer to this difference in values as bias
www.ghsp.com
A JSJ Business
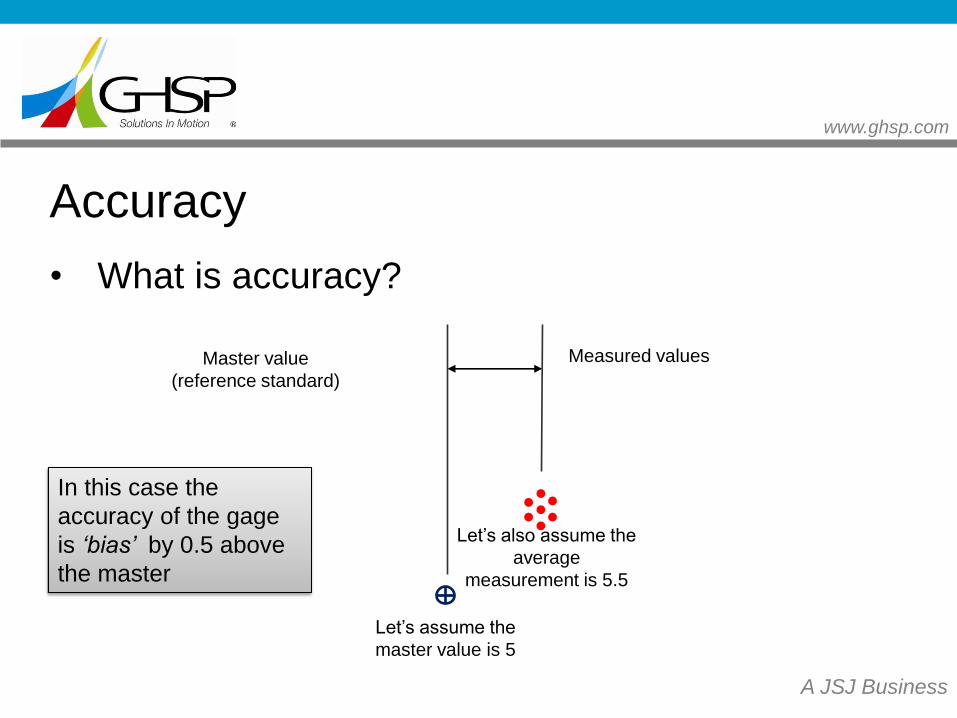
Accuracy
• What is accuracy?
Measured values Master value
(reference standard)
Let’s assume the
master value is 5
Let’s also assume the
average
measurement is 5.5
In this case the
accuracy of the gage
is ‘bias’ by 0.5 above
the master
www.ghsp.com
A JSJ Business
How to Determine Bias
• Take three samples
• Ideally these samples would be at the high, middle and low
ends of the process
• Determine the reference value for each sample using a
traceable measurement method (CMM, calibrated
height gage, etc.)
• Measure each sample at least 10 times. Calculate the
average and subtract from the reference value
• Determine if the accuracy is acceptable or needs to be
corrected
• This is to be determined by the working team
www.ghsp.com
A JSJ Business
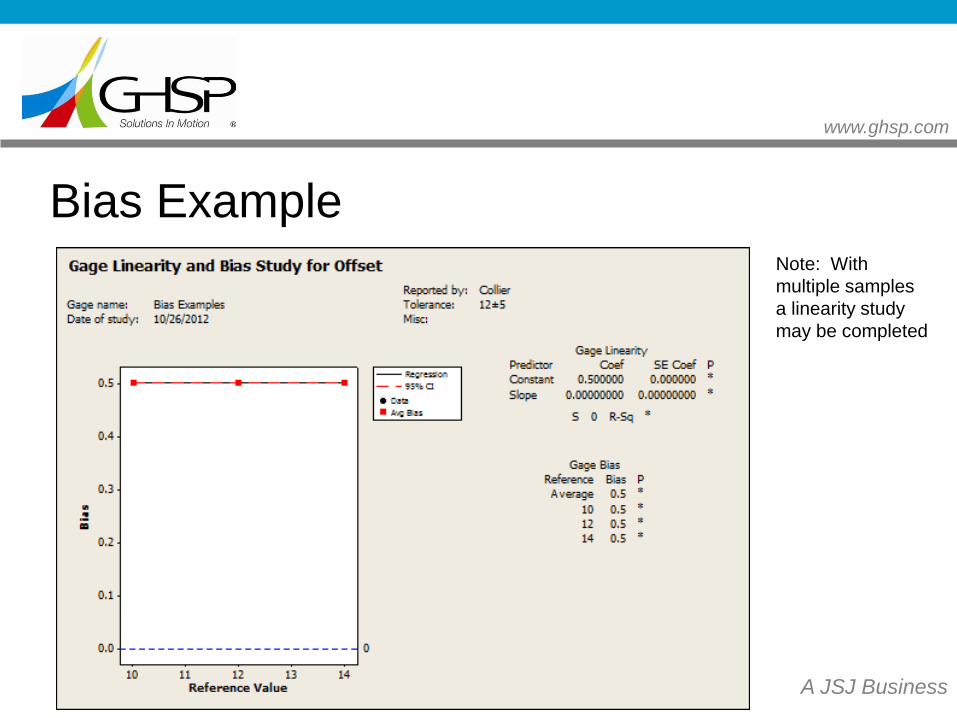
Bias Example Note: With
multiple samples
a linearity study
may be completed
www.ghsp.com
A JSJ Business
Potential Bias Causes
• Gage needs calibration
• Worn gage, equipment or fixture
• Error in master part (worn or damaged)
• Improper setting of master in gage
• Differing measurement methods (set, loading,
clamping, technique, etc.)
• Environment (temperature, humidity, vibration,
cleanliness, etc.)
www.ghsp.com
A JSJ Business
Bias - Response
• Increase calibration schedule
• Implement gage operating instructions
• Verify gage was made to correct specifications
• Check gage for wear
• Cleaning of gage
• Evaluate gage environment
www.ghsp.com
A JSJ Business
Linearity
• What is linearity?
• Linearity is the change in bias across the operating
range of the gage
www.ghsp.com
A JSJ Business
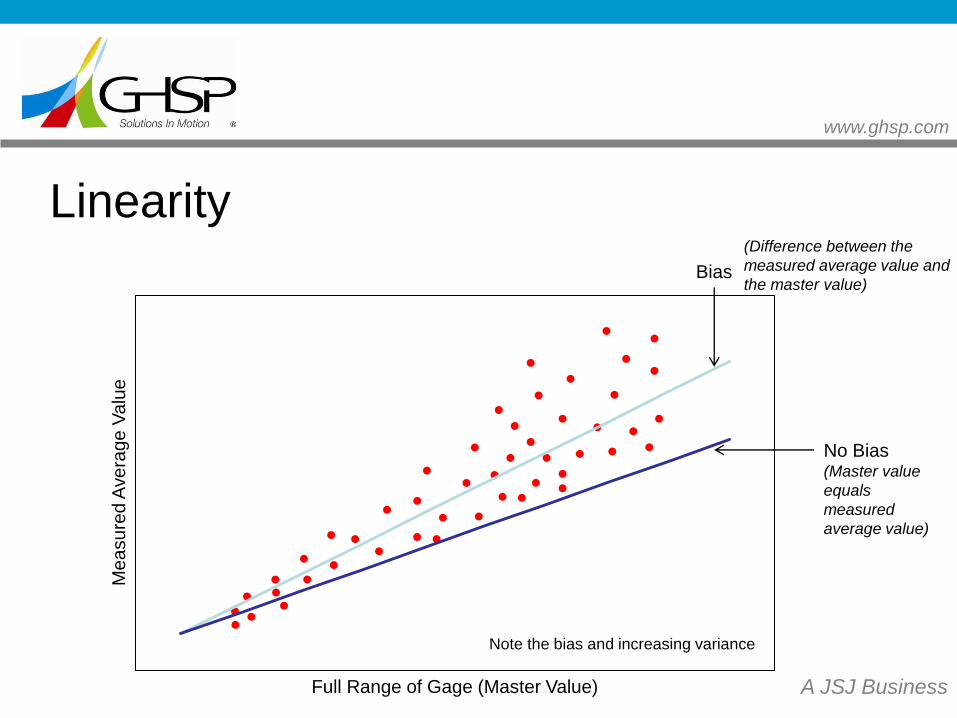
Linearity
Bias
No Bias (Master value
equals
measured
average value)
(Difference between the
measured average value and
the master value)
Full Range of Gage (Master Value)
Me
asu
red
Ave
rag
e V
alu
e
Note the bias and increasing variance
www.ghsp.com
A JSJ Business
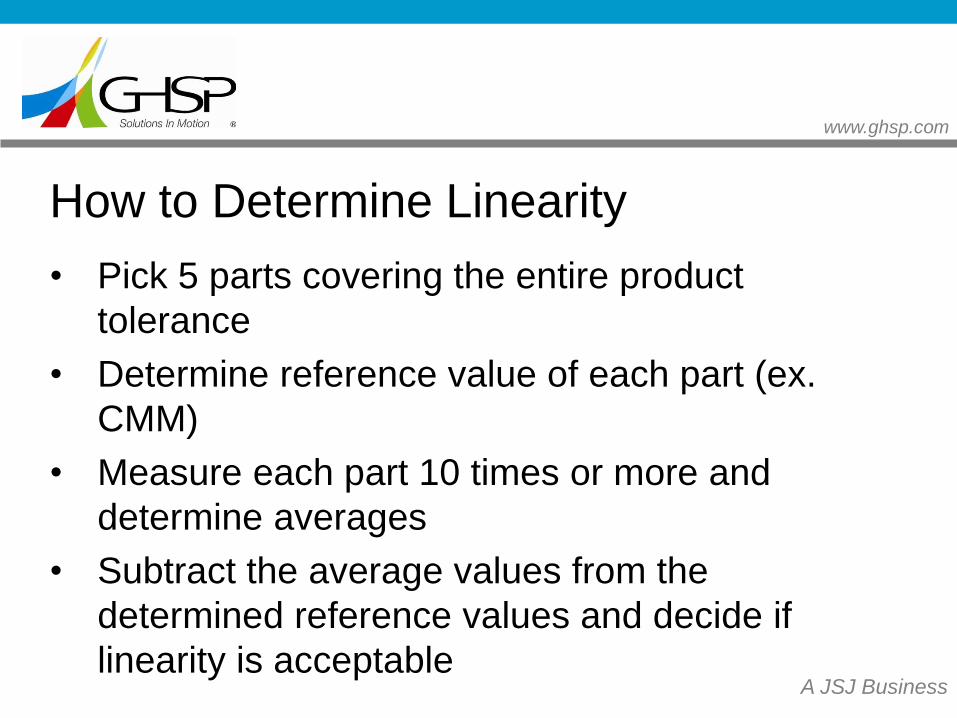
How to Determine Linearity
• Pick 5 parts covering the entire product
tolerance
• Determine reference value of each part (ex.
CMM)
• Measure each part 10 times or more and
determine averages
• Subtract the average values from the
determined reference values and decide if
linearity is acceptable
www.ghsp.com
A JSJ Business
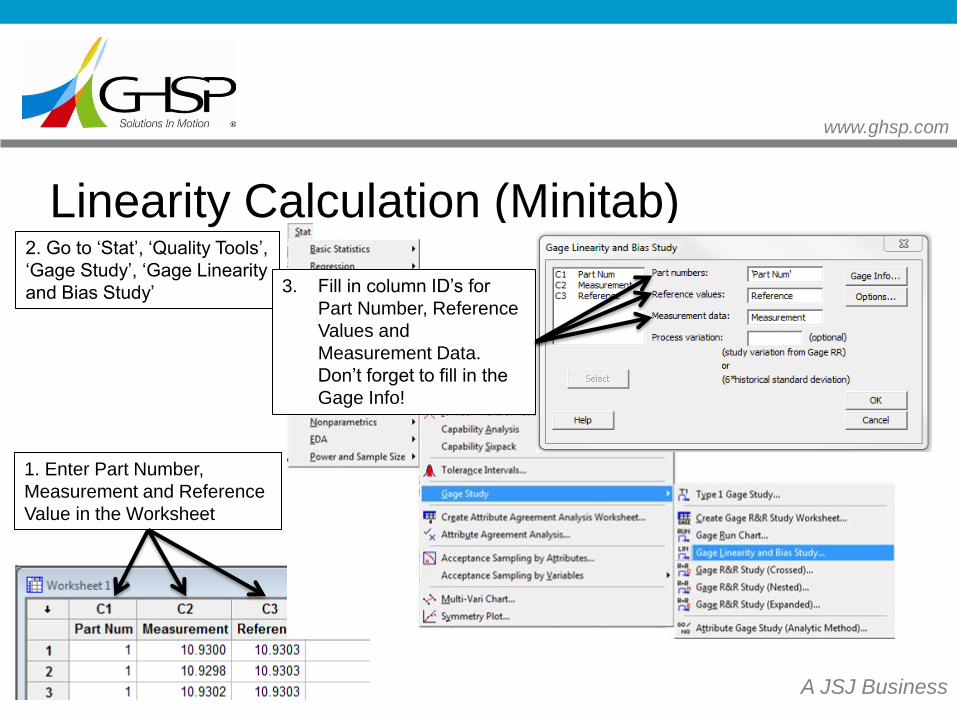
Linearity Calculation (Minitab)
1. Enter Part Number,
Measurement and Reference
Value in the Worksheet
2. Go to ‘Stat’, ‘Quality Tools’,
‘Gage Study’, ‘Gage Linearity
and Bias Study’ 3. Fill in column ID’s for
Part Number, Reference
Values and
Measurement Data.
Don’t forget to fill in the
Gage Info!
www.ghsp.com
A JSJ Business
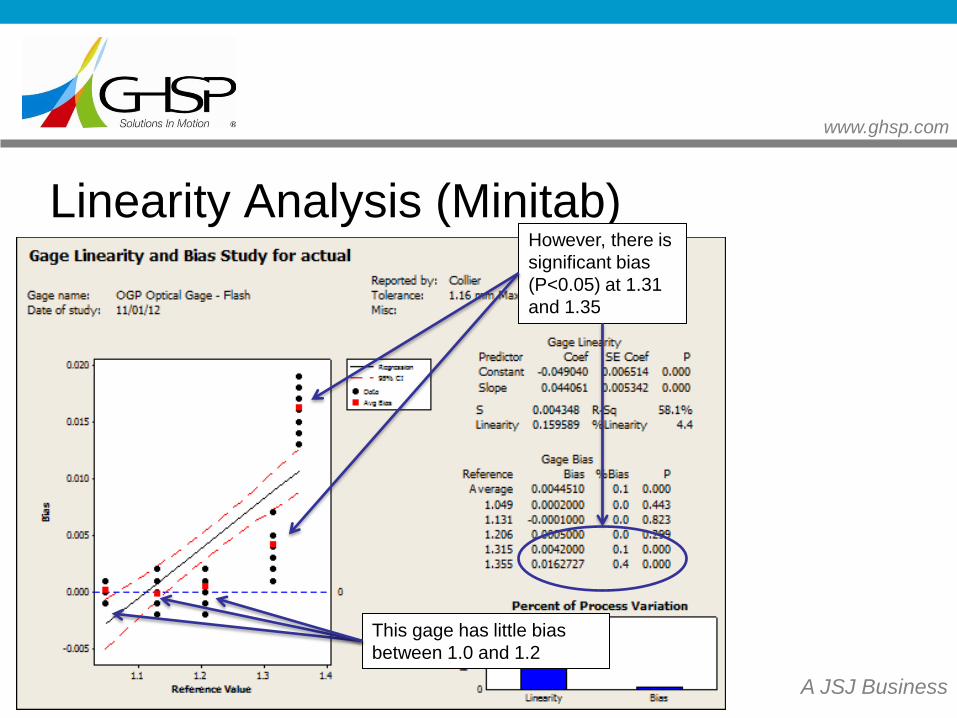
Linearity Analysis (Minitab)
This gage has little bias
between 1.0 and 1.2
However, there is
significant bias
(P<0.05) at 1.31
and 1.35
www.ghsp.com
A JSJ Business
Linearity - Acceptance Criteria
• Study must use 5 or more parts
• Parts must cover entire operating range of gage
• A p-value of less than 0.05 (P<0.05) indicates
statistically significant bias
www.ghsp.com
A JSJ Business
Linearity – Response
• Implement correction factor / table / curve
• Review gage and adjust
• Restrict use of range (Need to consider
specification limits)
• Verify proper calibration (through entire
operating range)
• Verify part / fixture is not distorted with change
in part size
www.ghsp.com
A JSJ Business
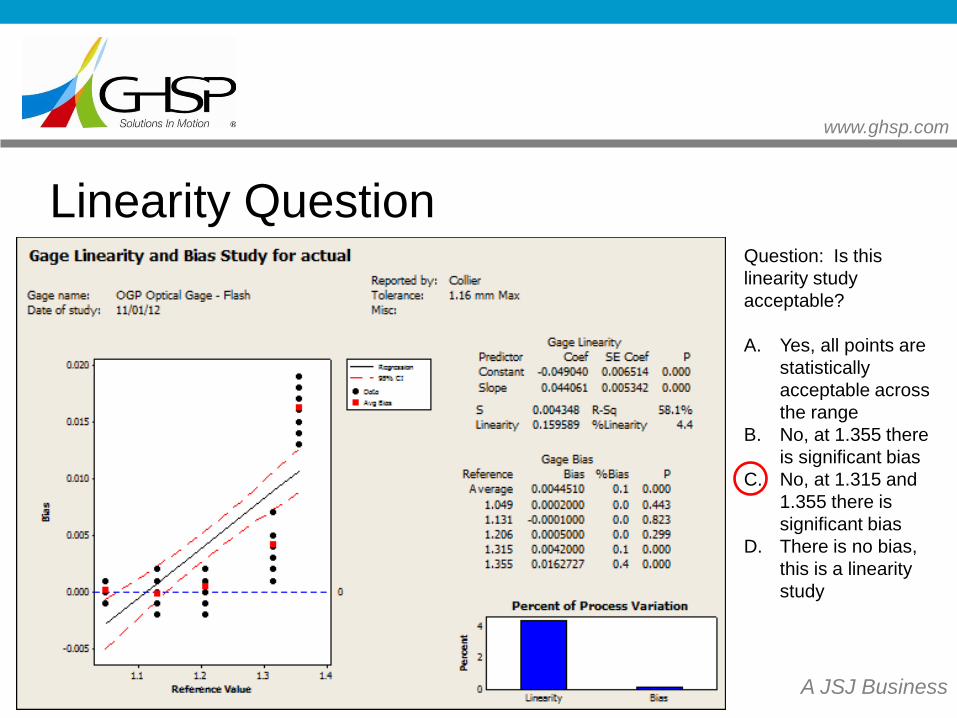
Linearity Question Question: Is this
linearity study
acceptable?
A. Yes, all points are
statistically
acceptable across
the range
B. No, at 1.355 there
is significant bias
C. No, at 1.315 and
1.355 there is
significant bias
D. There is no bias,
this is a linearity
study
www.ghsp.com
A JSJ Business
Stability
• What is stability?
• The variation in measurements obtained with the
same master part(s) on a single feature over a period
of time
• Also known as ‘measurement drift’ and the ‘change
in bias over time’
www.ghsp.com
A JSJ Business
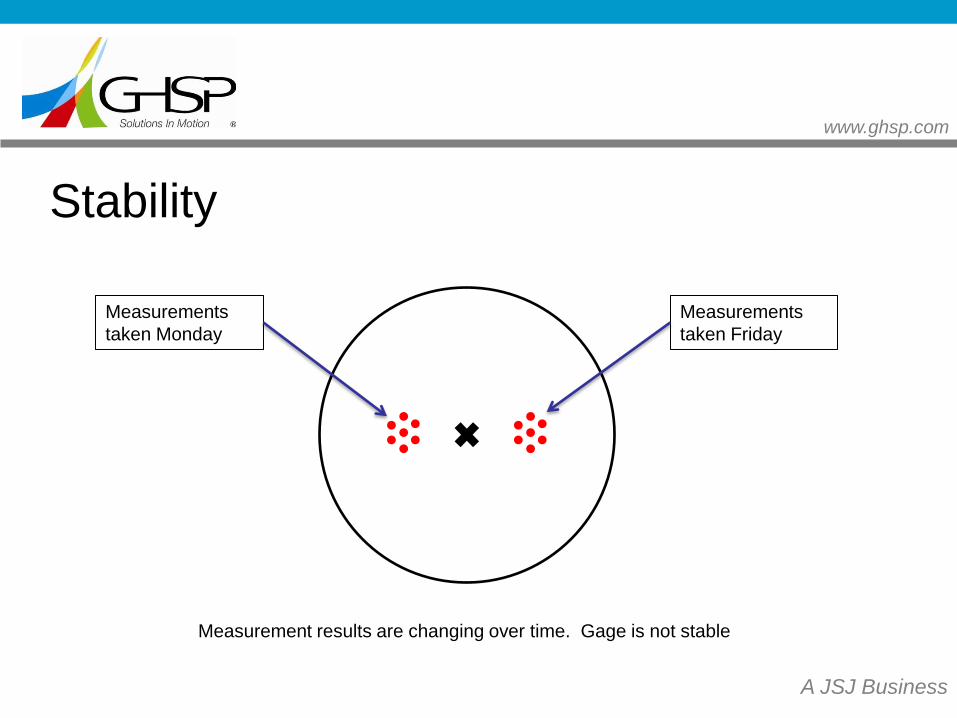
Stability
Measurements
taken Monday
Measurements
taken Friday
Measurement results are changing over time. Gage is not stable
www.ghsp.com
A JSJ Business
How to Determine Stability
• Select a master part
• Part may be a reference part (master) or a production part
• You can select multiple parts (low, middle and high end of expected range) and
track stability for each
• Determine the reference value for each part via a master
measurement method
• Measure each part 3 – 5 times at a chosen interval (daily, weekly,
etc.)
• Frequency should be determined based on knowledge of the gage. If
frequency is unclear you should start at a high frequency and reduce over time
as deemed acceptable.
• Plot the ongoing data on a Xbar & R chart
www.ghsp.com
A JSJ Business
Stability – Potential Causes
• Calibration issues
• Gage wear
• Poor maintenance
• Master part damage / wear
www.ghsp.com
A JSJ Business
Stability – Response
• Increase frequency of calibration
• Increase frequency of PM
• Change / Adjust gage
• Establish ‘life’ of gage or master part
www.ghsp.com
A JSJ Business
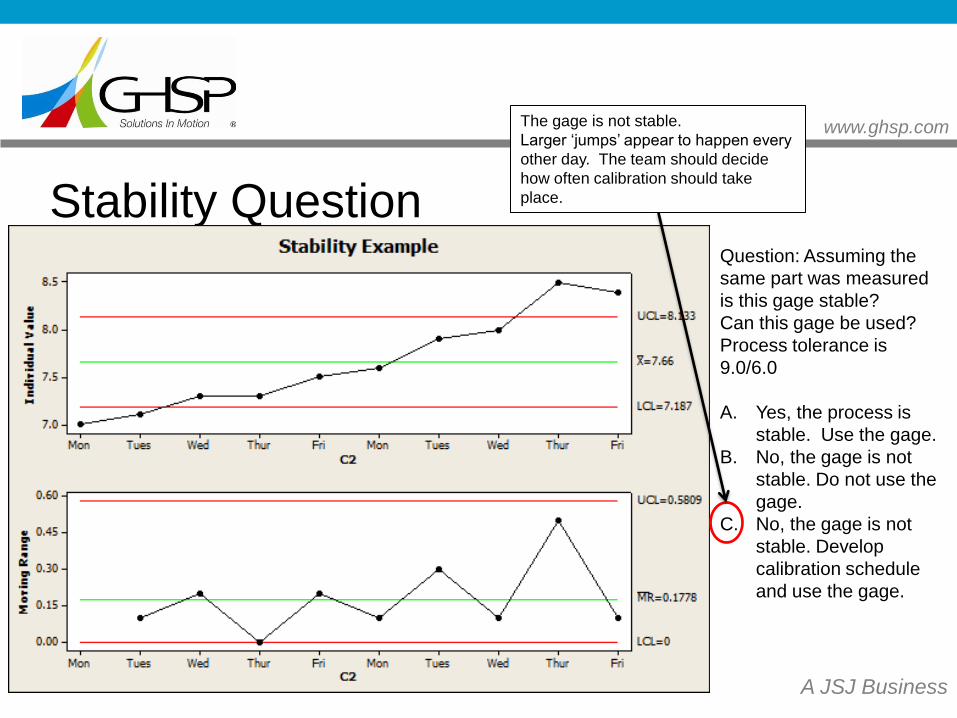
Stability Question Question: Assuming the
same part was measured
is this gage stable?
Can this gage be used?
Process tolerance is
9.0/6.0
A. Yes, the process is
stable. Use the gage.
B. No, the gage is not
stable. Do not use the
gage.
C. No, the gage is not
stable. Develop
calibration schedule
and use the gage.
The gage is not stable.
Larger ‘jumps’ appear to happen every
other day. The team should decide
how often calibration should take
place.
www.ghsp.com
A JSJ Business
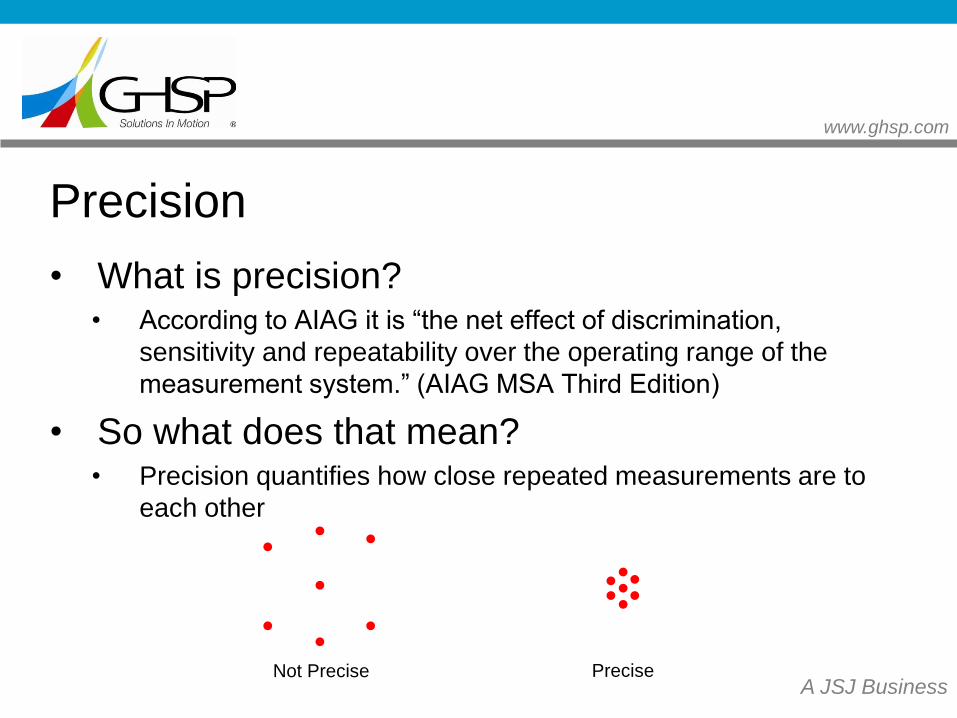
Precision
• What is precision? • According to AIAG it is “the net effect of discrimination,
sensitivity and repeatability over the operating range of the
measurement system.” (AIAG MSA Third Edition)
• So what does that mean? • Precision quantifies how close repeated measurements are to
each other
Not Precise Precise
www.ghsp.com
A JSJ Business
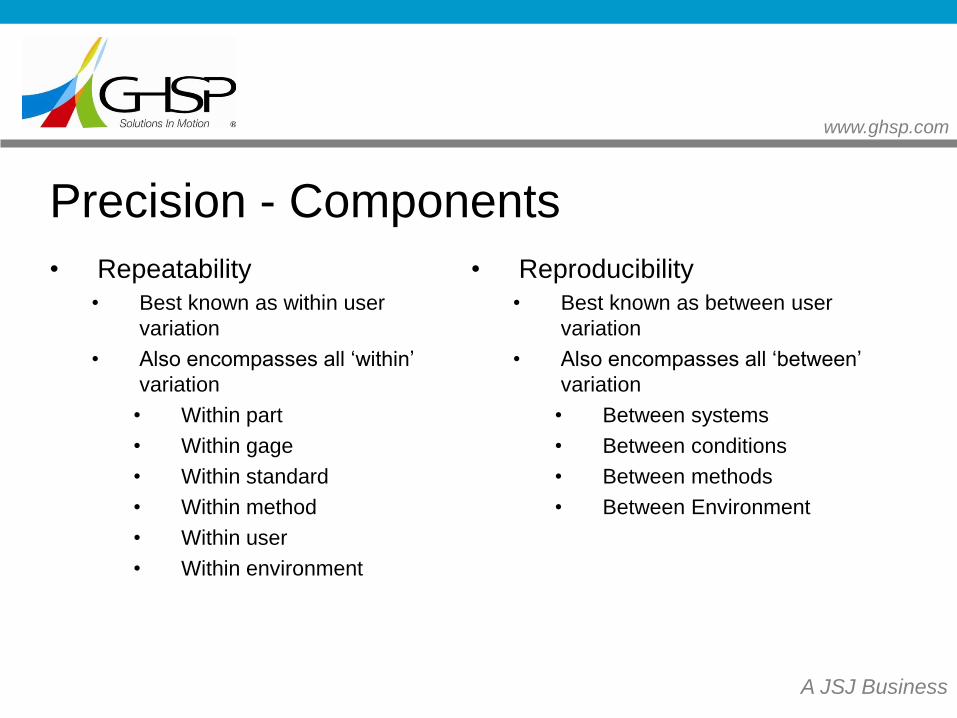
Precision - Components
• Repeatability
• Best known as within user
variation
• Also encompasses all ‘within’
variation
• Within part
• Within gage
• Within standard
• Within method
• Within user
• Within environment
• Reproducibility
• Best known as between user
variation
• Also encompasses all ‘between’
variation
• Between systems
• Between conditions
• Between methods
• Between Environment
www.ghsp.com
A JSJ Business
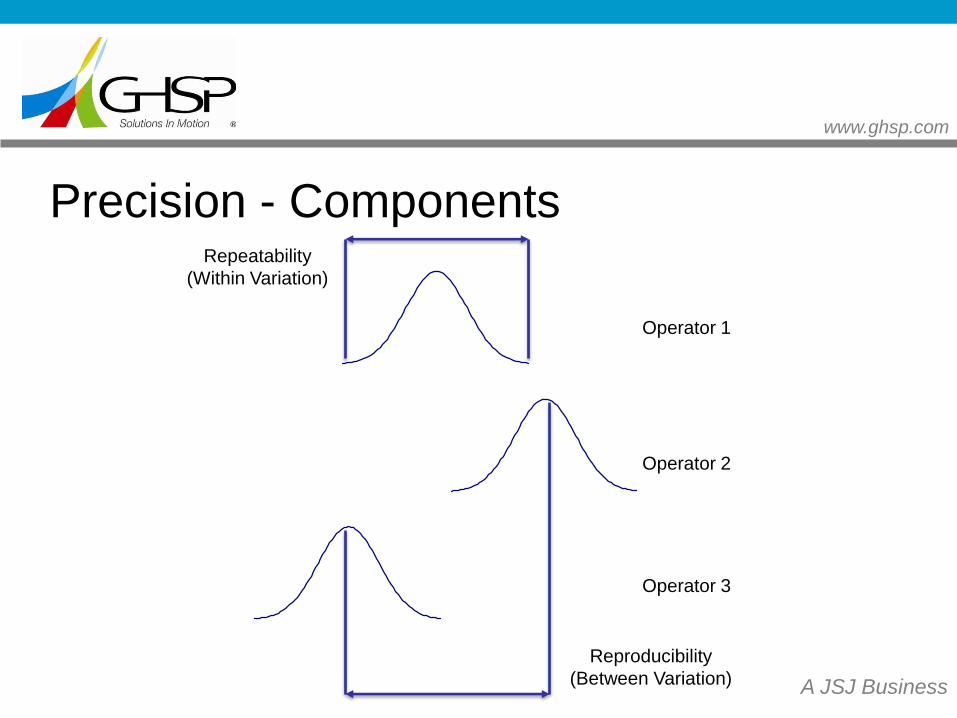
Precision - Components
Operator 1
Operator 2
Operator 3
Repeatability
(Within Variation)
Reproducibility
(Between Variation)
www.ghsp.com
A JSJ Business
Variable Data GRR
www.ghsp.com
A JSJ Business
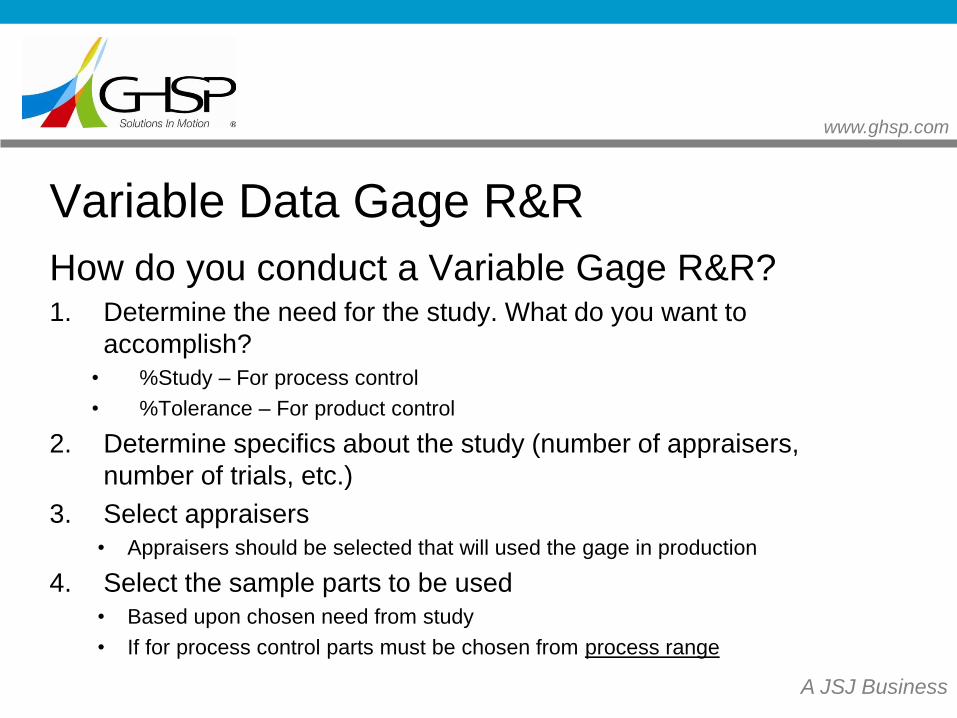
Variable Data Gage R&R
How do you conduct a Variable Gage R&R? 1. Determine the need for the study. What do you want to
accomplish?
• %Study – For process control
• %Tolerance – For product control
2. Determine specifics about the study (number of appraisers,
number of trials, etc.)
3. Select appraisers
• Appraisers should be selected that will used the gage in production
4. Select the sample parts to be used
• Based upon chosen need from study
• If for process control parts must be chosen from process range
www.ghsp.com
A JSJ Business
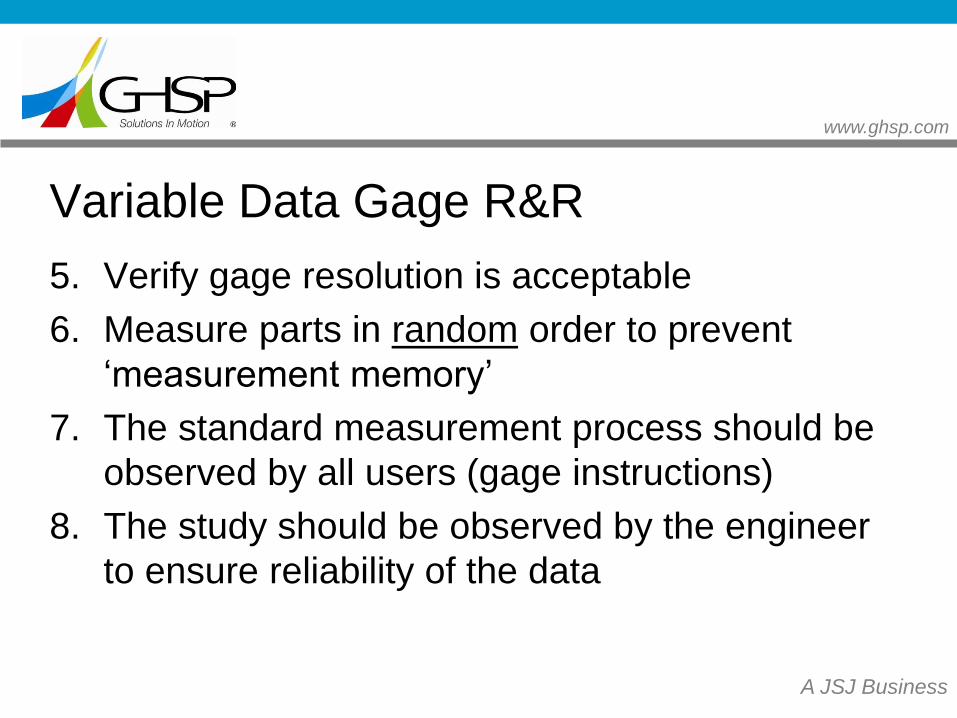
Variable Data Gage R&R
5. Verify gage resolution is acceptable
6. Measure parts in random order to prevent
‘measurement memory’
7. The standard measurement process should be
observed by all users (gage instructions)
8. The study should be observed by the engineer
to ensure reliability of the data
www.ghsp.com
A JSJ Business
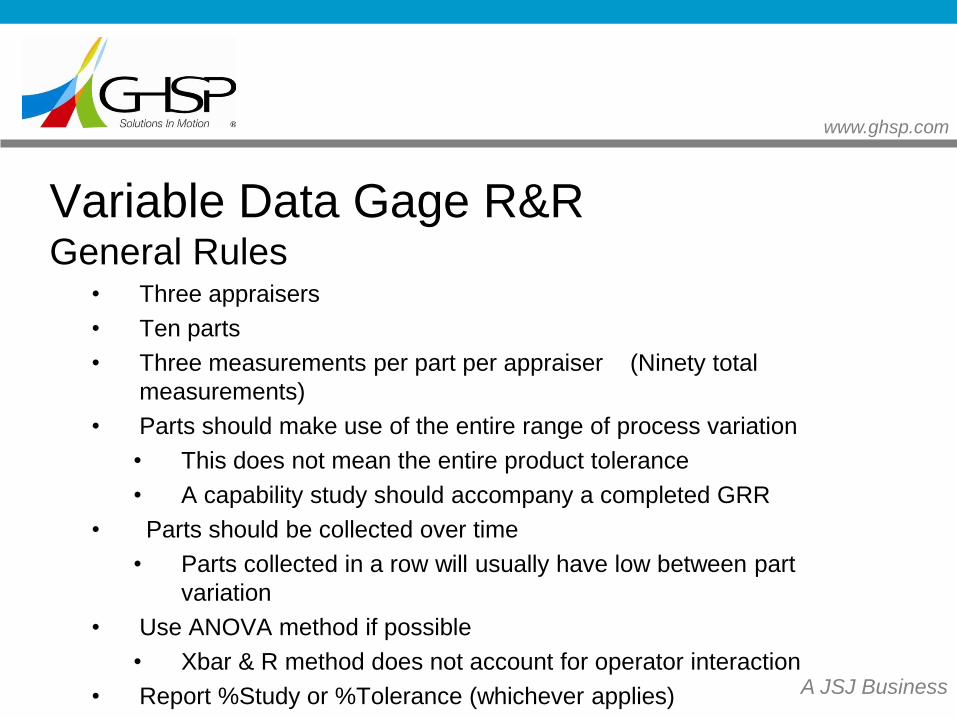
Variable Data Gage R&R General Rules
• Three appraisers
• Ten parts
• Three measurements per part per appraiser (Ninety total
measurements)
• Parts should make use of the entire range of process variation
• This does not mean the entire product tolerance
• A capability study should accompany a completed GRR
• Parts should be collected over time
• Parts collected in a row will usually have low between part
variation
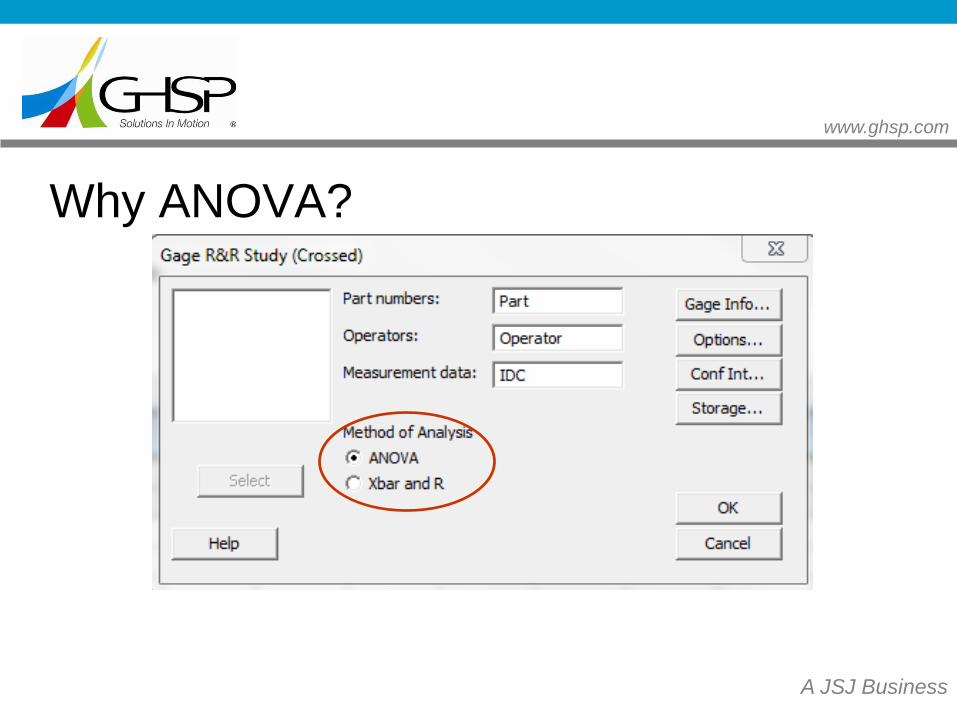
• Use ANOVA method if possible
• Xbar & R method does not account for operator interaction
• Report %Study or %Tolerance (whichever applies)
www.ghsp.com
A JSJ Business
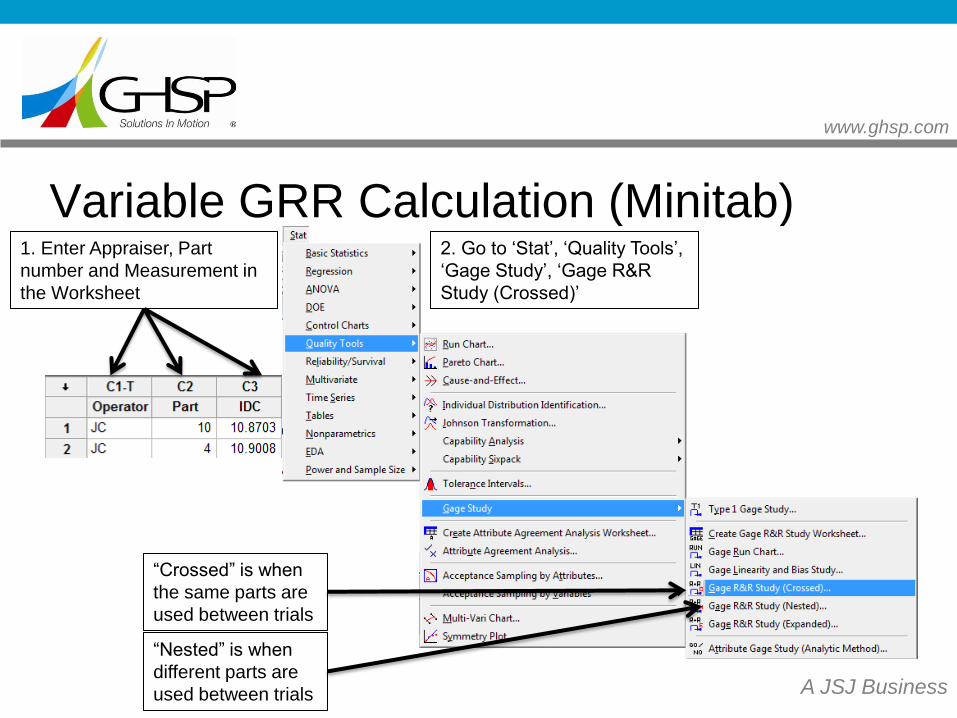
Variable GRR Calculation (Minitab) 1. Enter Appraiser, Part
number and Measurement in
the Worksheet
2. Go to ‘Stat’, ‘Quality Tools’,
‘Gage Study’, ‘Gage R&R
Study (Crossed)’
“Crossed” is when
the same parts are
used between trials
“Nested” is when
different parts are
used between trials
www.ghsp.com
A JSJ Business
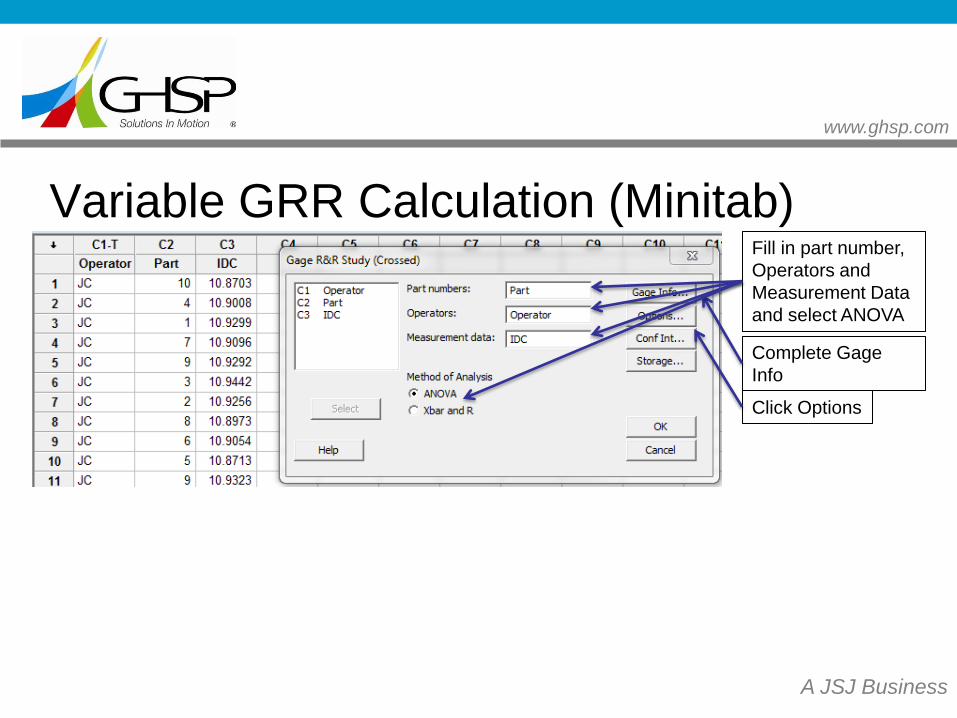
Variable GRR Calculation (Minitab)
Complete Gage
Info
Fill in part number,
Operators and
Measurement Data
and select ANOVA
Click Options
www.ghsp.com
A JSJ Business
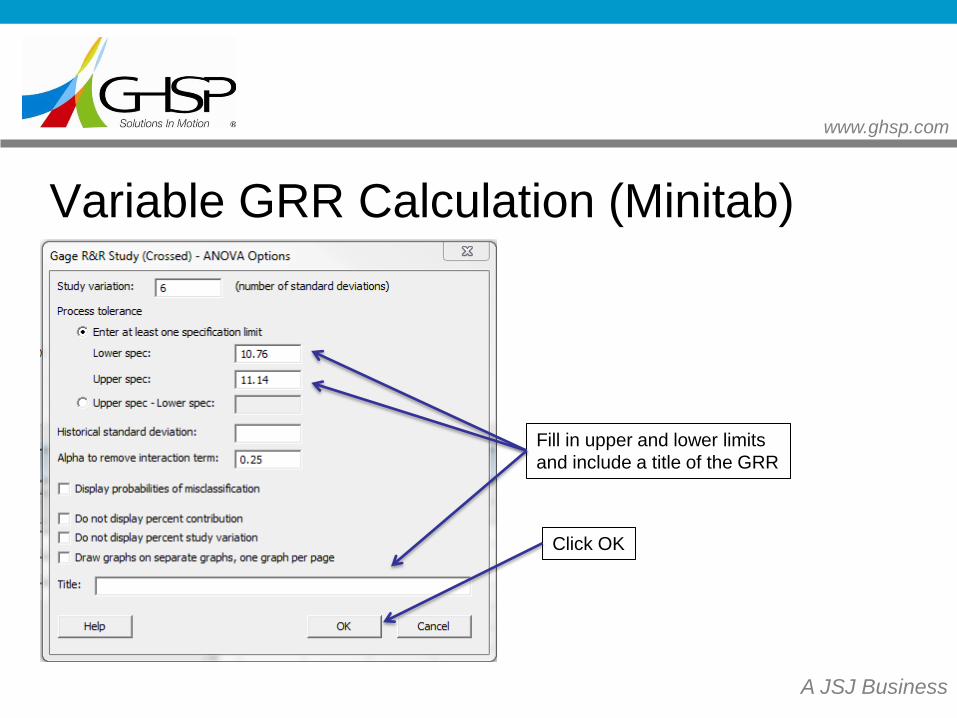
Variable GRR Calculation (Minitab)
Fill in upper and lower limits
and include a title of the GRR
Click OK
www.ghsp.com
A JSJ Business
Part-to-PartReprodRepeatGage R&R
100
50
0
Perc
ent
% Contribution
% Study Var
% Tolerance
10 9 8 7 6 5 4 3 2 110 9 8 7 6 5 4 3 2 110 9 8 7 6 5 4 3 2 1
0.010
0.005
0.000
Part
Sam
ple
Range
_R=0.00427
UCL=0.01099
LCL=0
DK EB JC
10 9 8 7 6 5 4 3 2 110 9 8 7 6 5 4 3 2 110 9 8 7 6 5 4 3 2 1
10.92
10.89
10.86
Part
Sam
ple
Mean
__X=10.90779UCL=10.91215LCL=10.90342
DK EB JC
10987654321
10.95
10.90
10.85
Part
JCEBDK
10.95
10.90
10.85
Operator
10987654321
10.92
10.89
10.86
Part
Avera
ge
DK
EB
JC
Operator
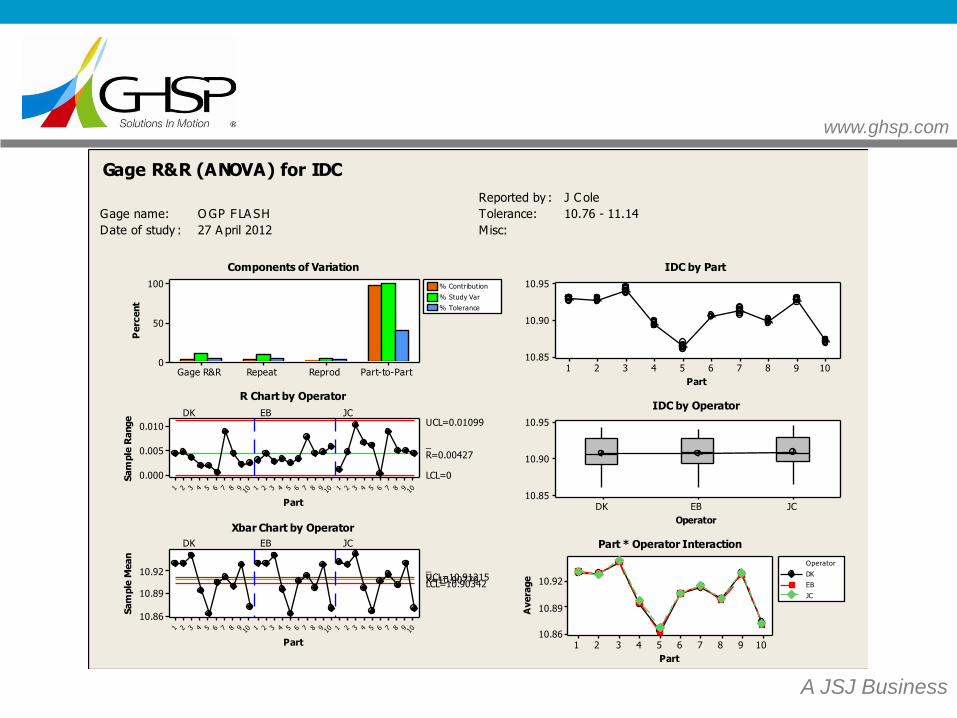
Gage name: O GP FLA SH
Date of study : 27 A pril 2012
Reported by : J C ole
Tolerance: 10.76 - 11.14
Misc:
Components of Variation
R Chart by Operator
Xbar Chart by Operator
IDC by Part
IDC by Operator
Part * Operator Interaction
Gage R&R (ANOVA) for IDC
www.ghsp.com
A JSJ Business
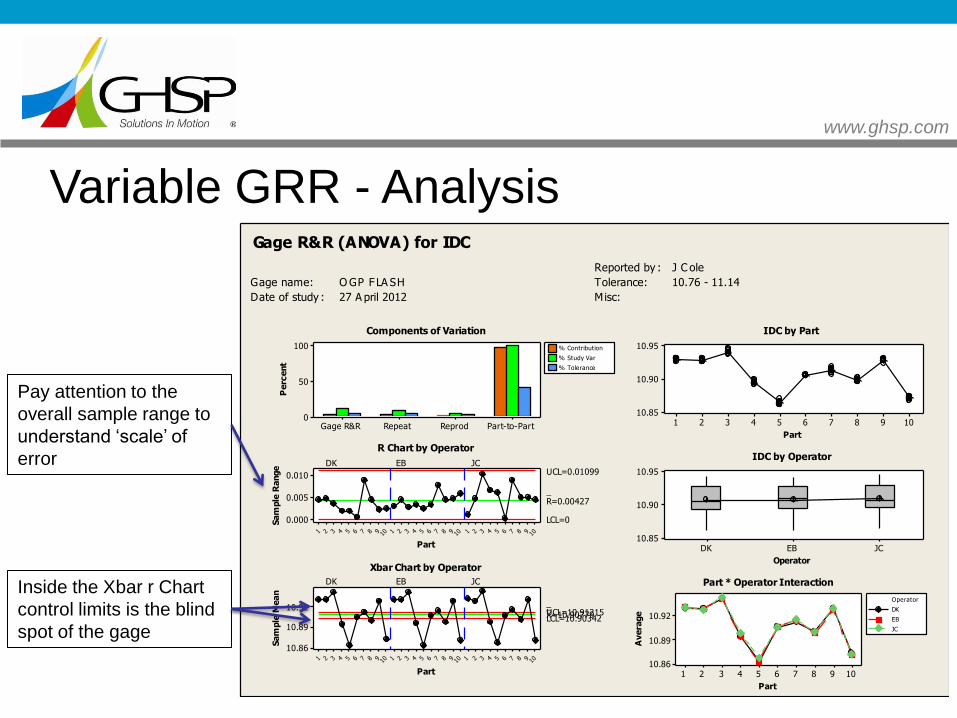
Variable GRR - Analysis
Part-to-PartReprodRepeatGage R&R
100
50
0
Perc
ent
% Contribution
% Study Var
% Tolerance
10 9 8 7 6 5 4 3 2 110 9 8 7 6 5 4 3 2 110 9 8 7 6 5 4 3 2 1
0.010
0.005
0.000
Part
Sam
ple
Range
_R=0.00427
UCL=0.01099
LCL=0
DK EB JC
10 9 8 7 6 5 4 3 2 110 9 8 7 6 5 4 3 2 110 9 8 7 6 5 4 3 2 1
10.92
10.89
10.86
Part
Sam
ple
Mean
__X=10.90779UCL=10.91215LCL=10.90342
DK EB JC
10987654321
10.95
10.90
10.85
Part
JCEBDK
10.95
10.90
10.85
Operator
10987654321
10.92
10.89
10.86
Part
Avera
ge
DK
EB
JC
Operator
Gage name: O GP FLA SH
Date of study : 27 A pril 2012
Reported by : J C ole
Tolerance: 10.76 - 11.14
Misc:
Components of Variation
R Chart by Operator
Xbar Chart by Operator
IDC by Part
IDC by Operator
Part * Operator Interaction
Gage R&R (ANOVA) for IDC
Pay attention to the
overall sample range to
understand ‘scale’ of
error
Inside the Xbar r Chart
control limits is the blind
spot of the gage
www.ghsp.com
A JSJ Business
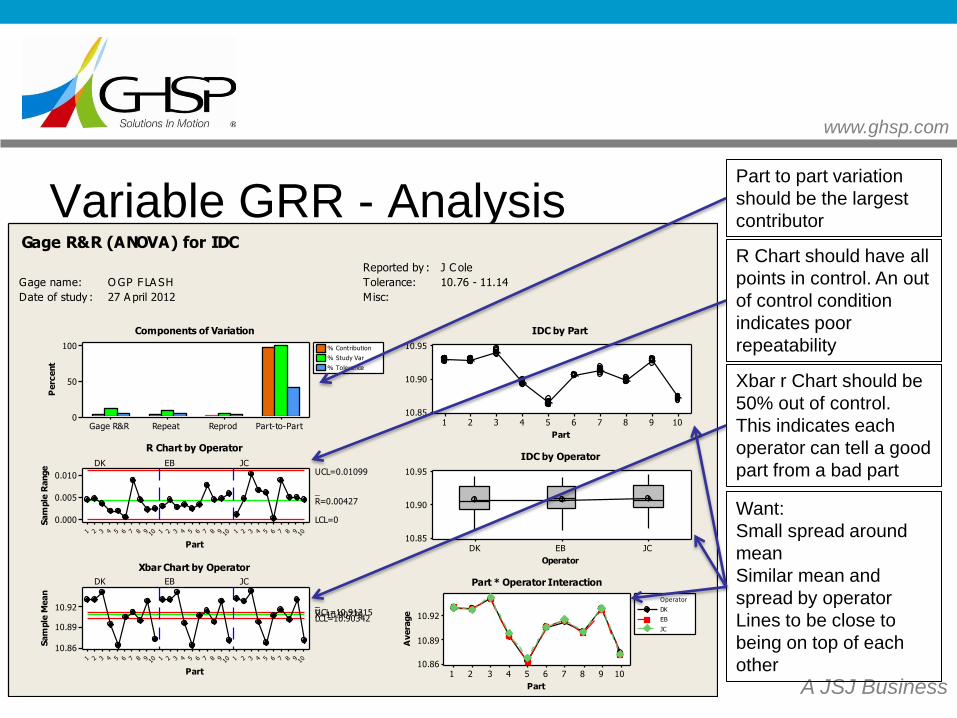
Variable GRR - Analysis
Part-to-PartReprodRepeatGage R&R
100
50
0
Perc
ent
% Contribution
% Study Var
% Tolerance
10 9 8 7 6 5 4 3 2 110 9 8 7 6 5 4 3 2 110 9 8 7 6 5 4 3 2 1
0.010
0.005
0.000
Part
Sam
ple
Range
_R=0.00427
UCL=0.01099
LCL=0
DK EB JC
10 9 8 7 6 5 4 3 2 110 9 8 7 6 5 4 3 2 110 9 8 7 6 5 4 3 2 1
10.92
10.89
10.86
Part
Sam
ple
Mean
__X=10.90779UCL=10.91215LCL=10.90342
DK EB JC
10987654321
10.95
10.90
10.85
Part
JCEBDK
10.95
10.90
10.85
Operator
10987654321
10.92
10.89
10.86
Part
Avera
ge
DK
EB
JC
Operator
Gage name: O GP FLA SH
Date of study : 27 A pril 2012
Reported by : J C ole
Tolerance: 10.76 - 11.14
Misc:
Components of Variation
R Chart by Operator
Xbar Chart by Operator
IDC by Part
IDC by Operator
Part * Operator Interaction
Gage R&R (ANOVA) for IDC
Part to part variation
should be the largest
contributor
R Chart should have all
points in control. An out
of control condition
indicates poor
repeatability
Xbar r Chart should be
50% out of control.
This indicates each
operator can tell a good
part from a bad part
Want:
Small spread around
mean
Similar mean and
spread by operator
Lines to be close to
being on top of each
other
www.ghsp.com
A JSJ Business
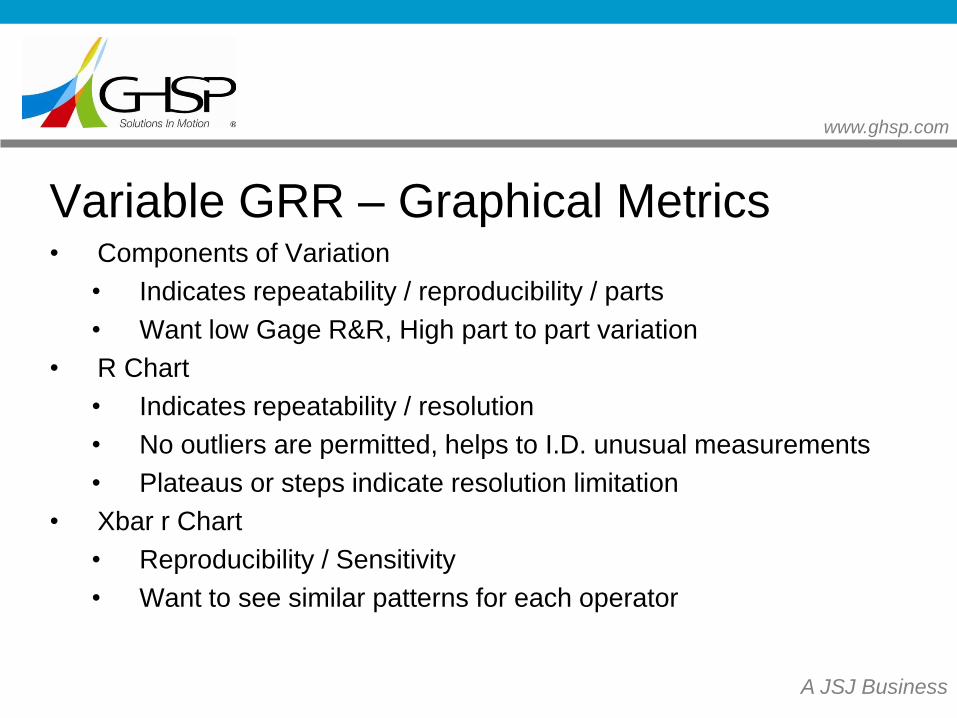
Variable GRR – Graphical Metrics • Components of Variation
• Indicates repeatability / reproducibility / parts
• Want low Gage R&R, High part to part variation
• R Chart
• Indicates repeatability / resolution
• No outliers are permitted, helps to I.D. unusual measurements
• Plateaus or steps indicate resolution limitation
• Xbar r Chart
• Reproducibility / Sensitivity
• Want to see similar patterns for each operator
www.ghsp.com
A JSJ Business
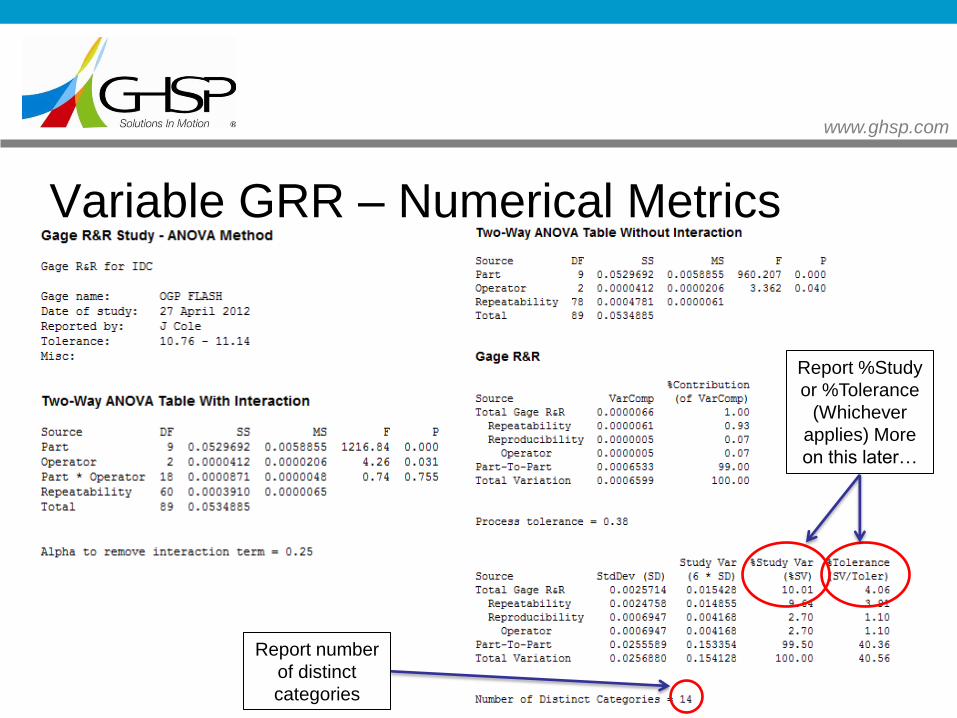
Variable GRR – Numerical Metrics
Report %Study
or %Tolerance
(Whichever
applies) More
on this later…
Report number
of distinct
categories
www.ghsp.com
A JSJ Business
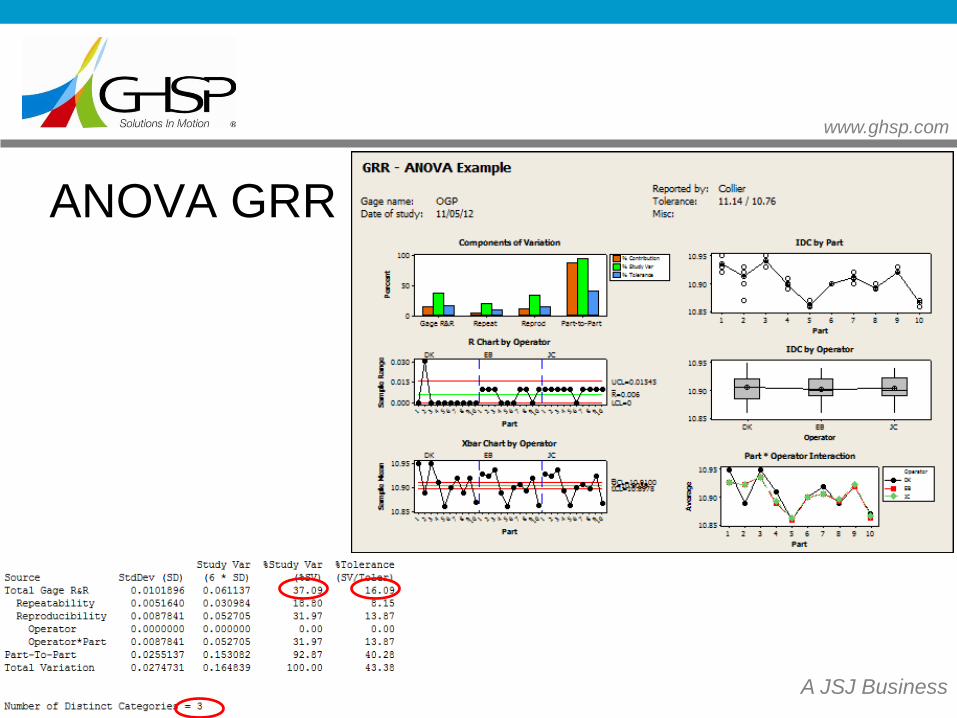
• %Study or %Tolerance should be below 10%
• Between 10% and 30% may be acceptable
• Above 30% is not acceptable
• Number of distinct categories must be at least 5
Variable GRR – Numerical Metrics
www.ghsp.com
A JSJ Business
Why ANOVA?
www.ghsp.com
A JSJ Business
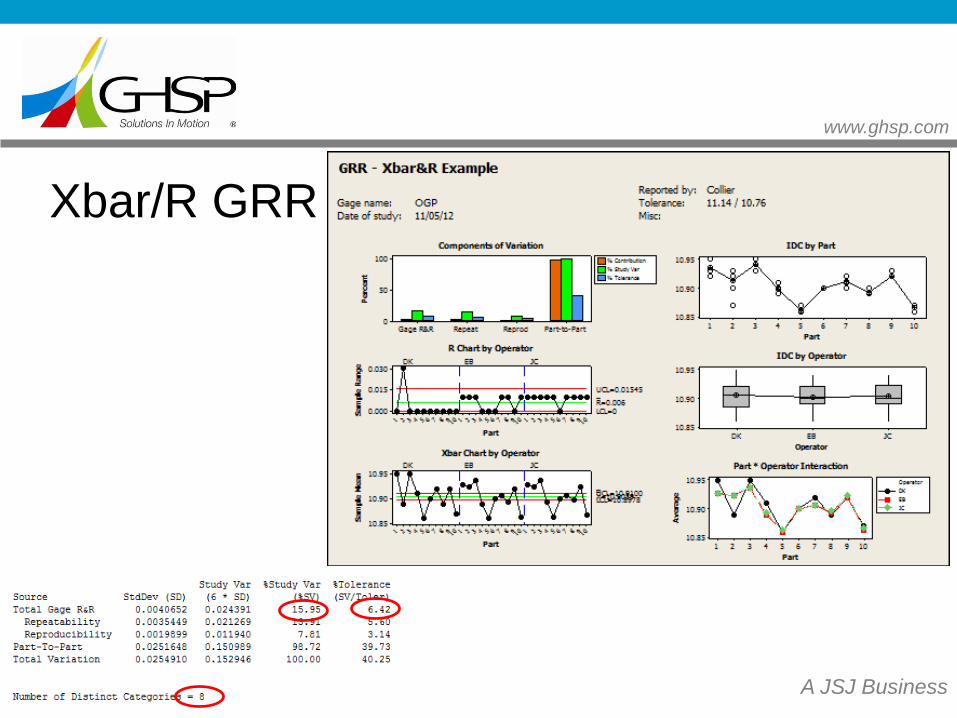
Xbar/R GRR
www.ghsp.com
A JSJ Business
ANOVA GRR
www.ghsp.com
A JSJ Business
• The same data was used for both studies
• The only difference is method used to analyze
the gage
• WHY?
• The Xbar/R method ignores operator to part
interaction and as a result can appear to ‘boost’
gage performance
Xbar/R & ANOVA Comparison
www.ghsp.com
A JSJ Business
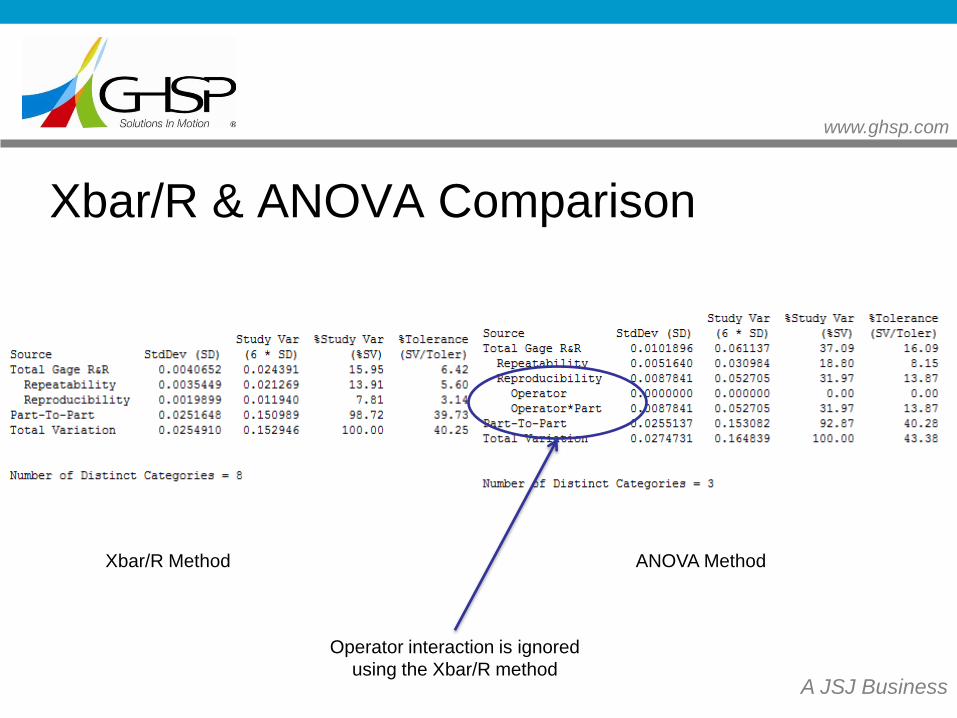
Xbar/R & ANOVA Comparison
Xbar/R Method ANOVA Method
Operator interaction is ignored
using the Xbar/R method
www.ghsp.com
A JSJ Business
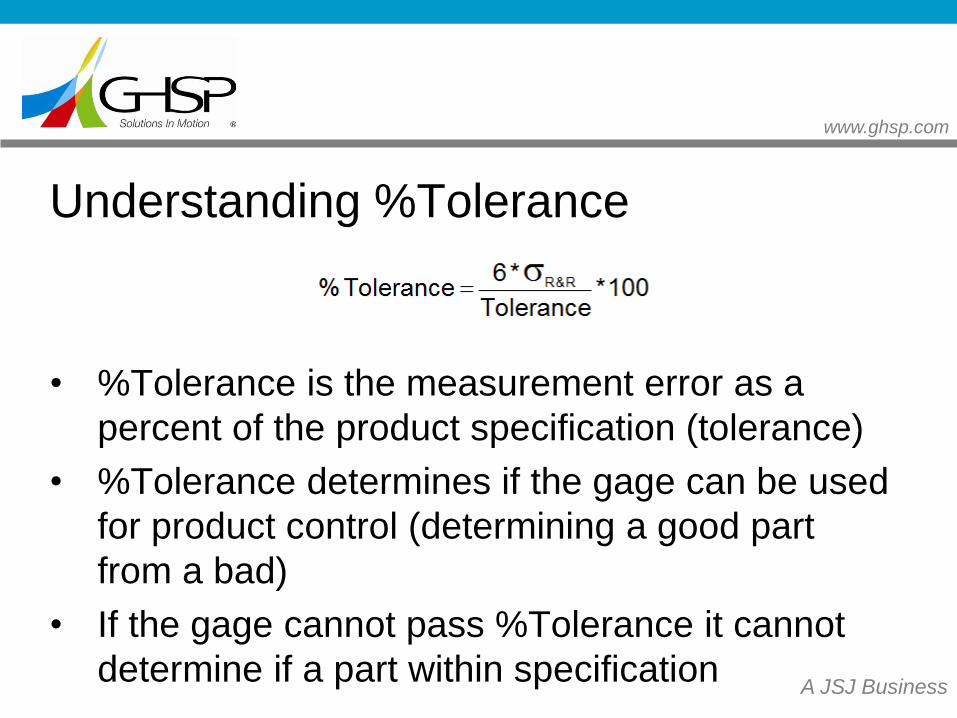
Understanding %Tolerance
• %Tolerance is the measurement error as a
percent of the product specification (tolerance)
• %Tolerance determines if the gage can be used
for product control (determining a good part
from a bad)
• If the gage cannot pass %Tolerance it cannot
determine if a part within specification
www.ghsp.com
A JSJ Business
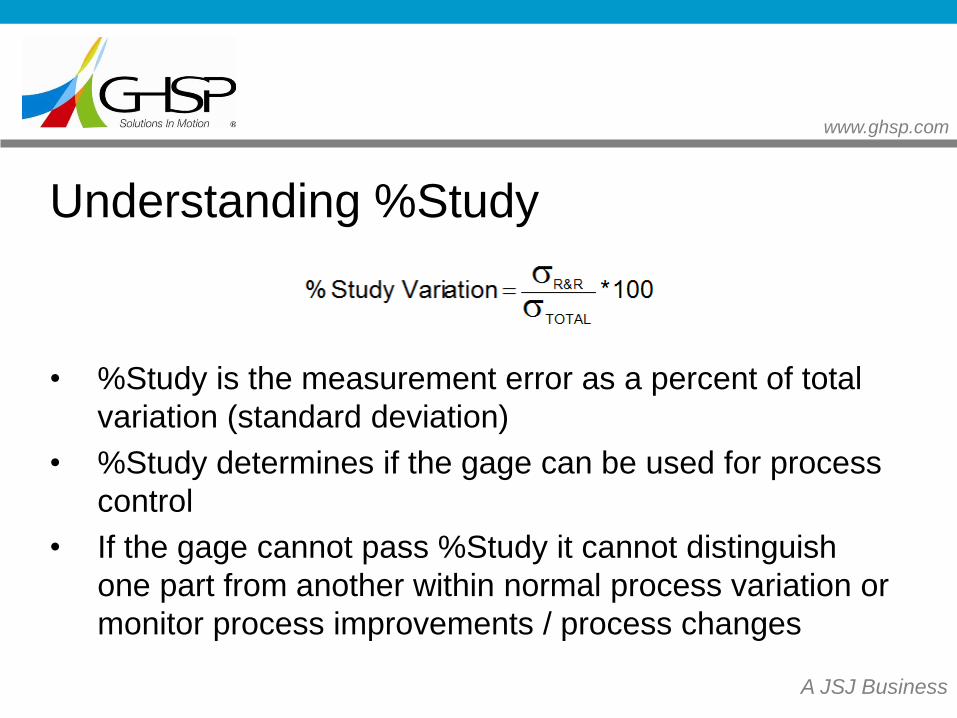
Understanding %Study
• %Study is the measurement error as a percent of total
variation (standard deviation)
• %Study determines if the gage can be used for process
control
• If the gage cannot pass %Study it cannot distinguish
one part from another within normal process variation or
monitor process improvements / process changes
www.ghsp.com
A JSJ Business
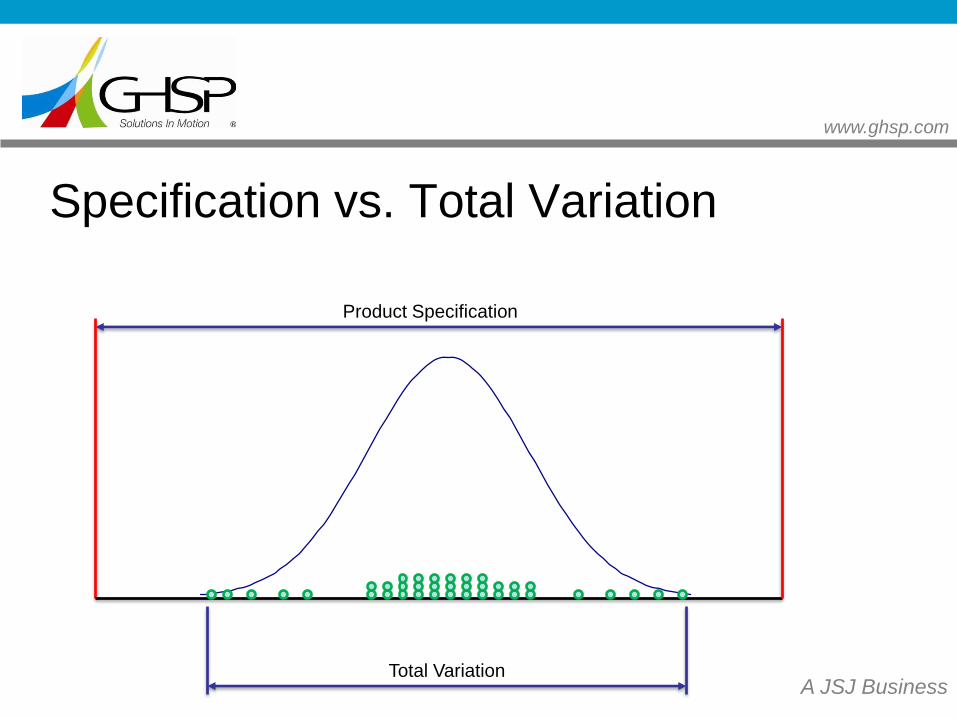
Specification vs. Total Variation
Product Specification
Total Variation
www.ghsp.com
A JSJ Business
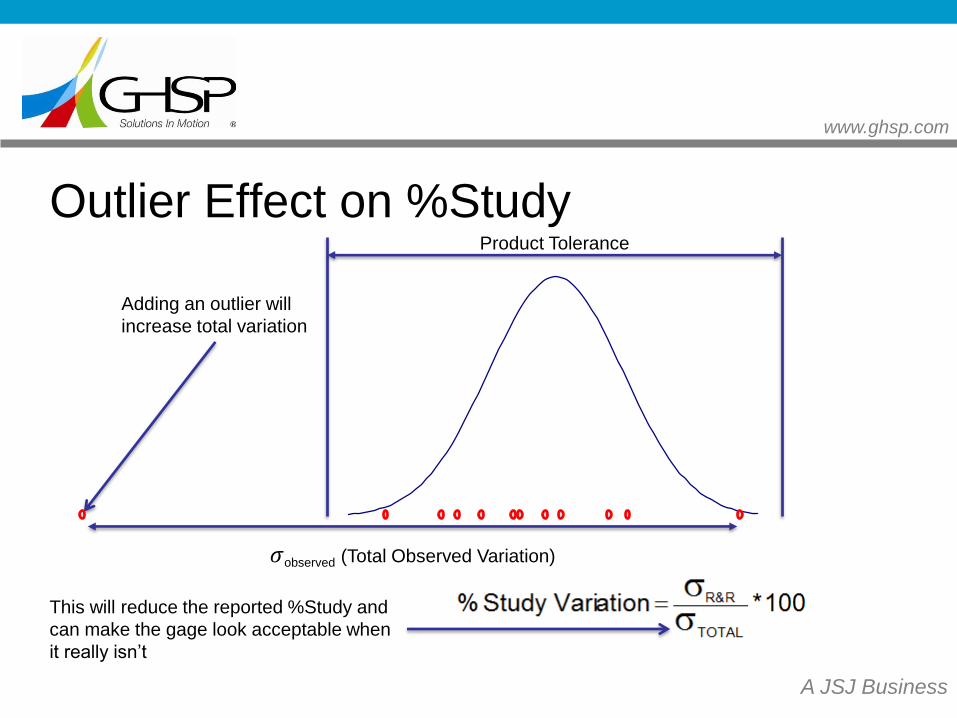
Outlier Effect on %Study
Adding an outlier will
increase total variation
This will reduce the reported %Study and
can make the gage look acceptable when
it really isn’t
𝜎observed (Total Observed Variation)
Product Tolerance
www.ghsp.com
A JSJ Business
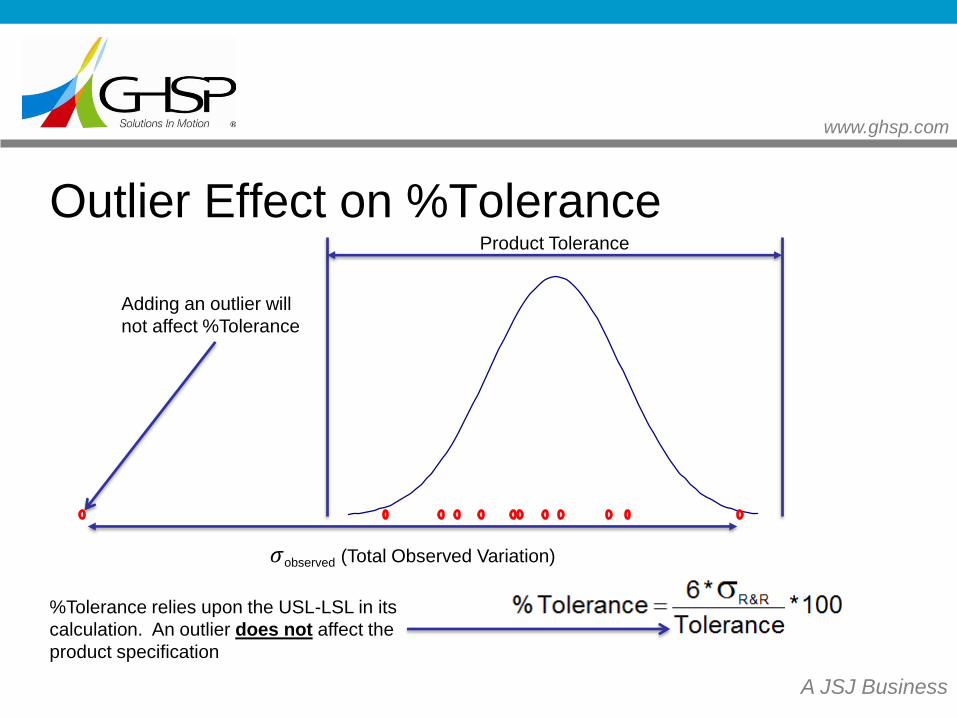
Outlier Effect on %Tolerance
Adding an outlier will
not affect %Tolerance
%Tolerance relies upon the USL-LSL in its
calculation. An outlier does not affect the
product specification
𝜎observed (Total Observed Variation)
Product Tolerance
www.ghsp.com
A JSJ Business
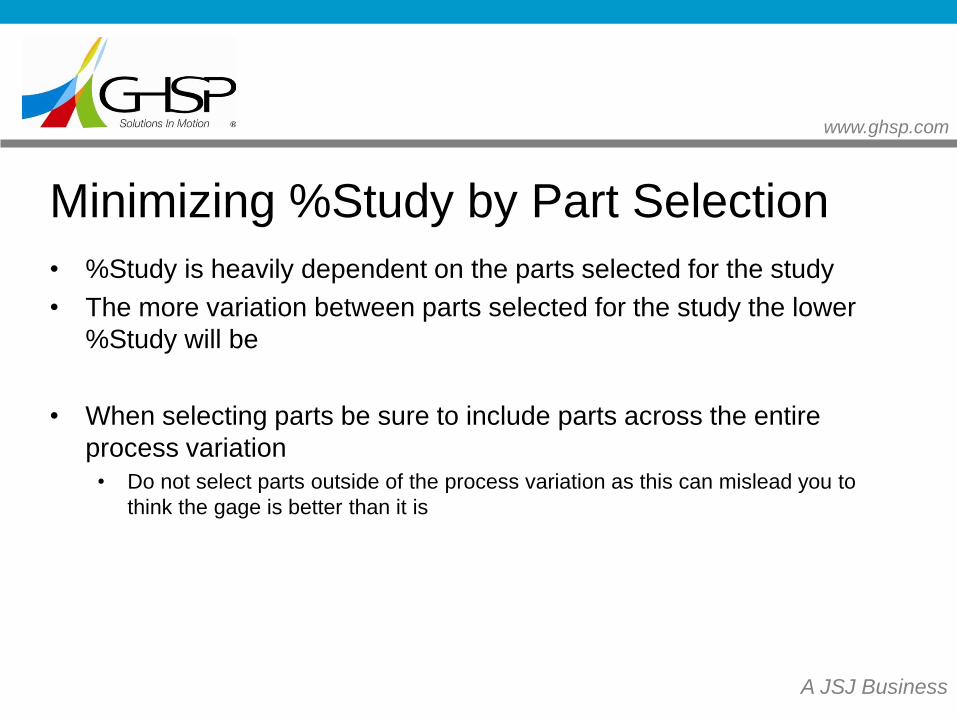
Minimizing %Study by Part Selection
• %Study is heavily dependent on the parts selected for the study
• The more variation between parts selected for the study the lower
%Study will be
• When selecting parts be sure to include parts across the entire
process variation
• Do not select parts outside of the process variation as this can mislead you to
think the gage is better than it is
www.ghsp.com
A JSJ Business
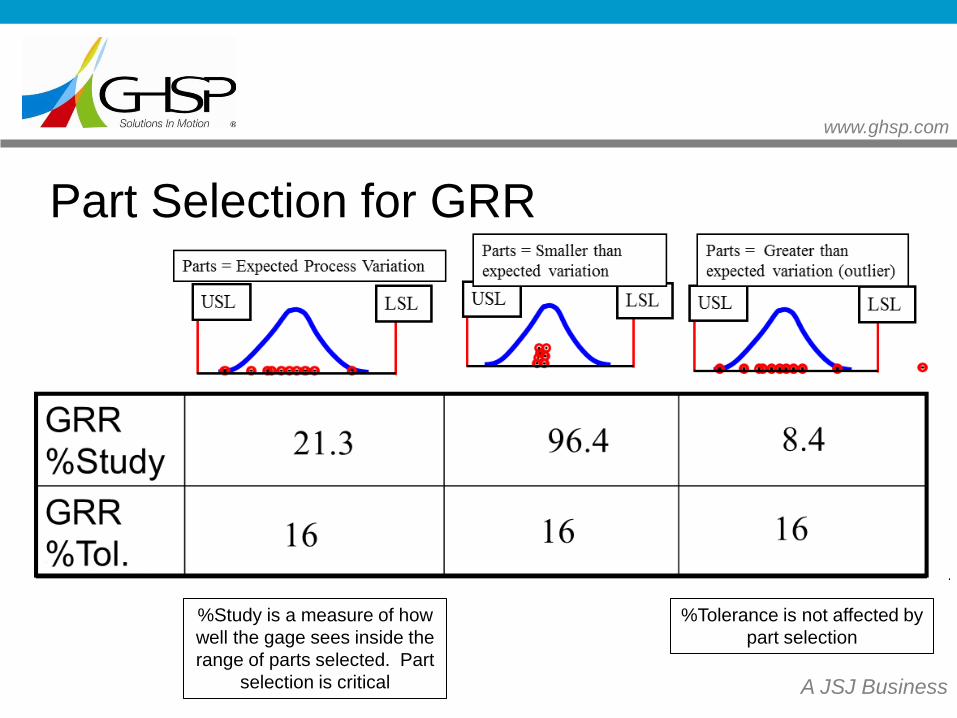
Part Selection for GRR
%Tolerance is not affected by
part selection
%Study is a measure of how
well the gage sees inside the
range of parts selected. Part
selection is critical
www.ghsp.com
A JSJ Business
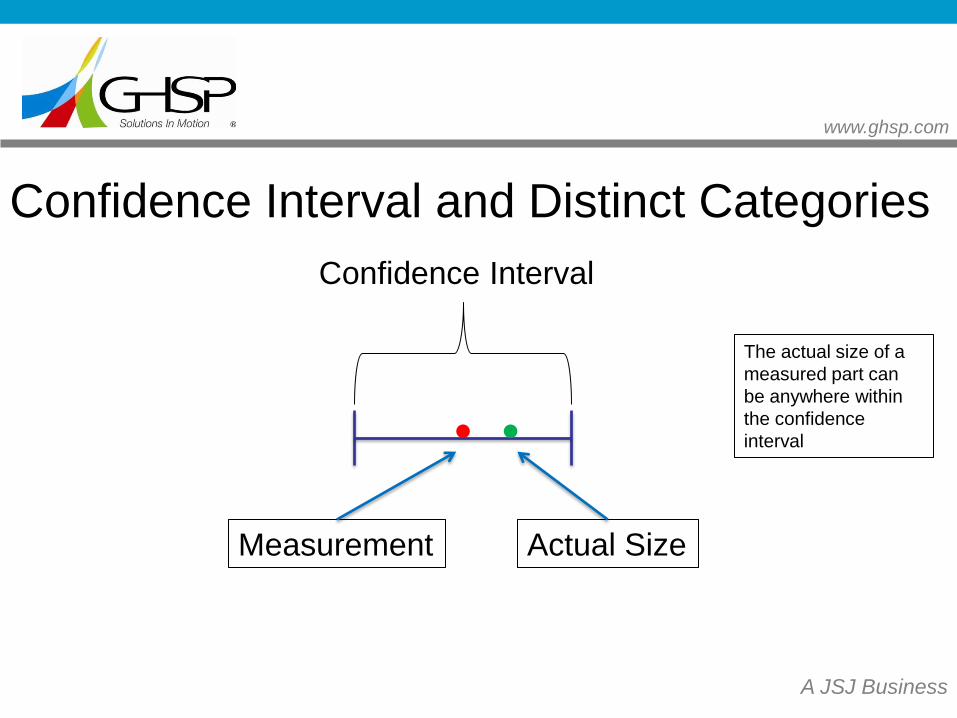
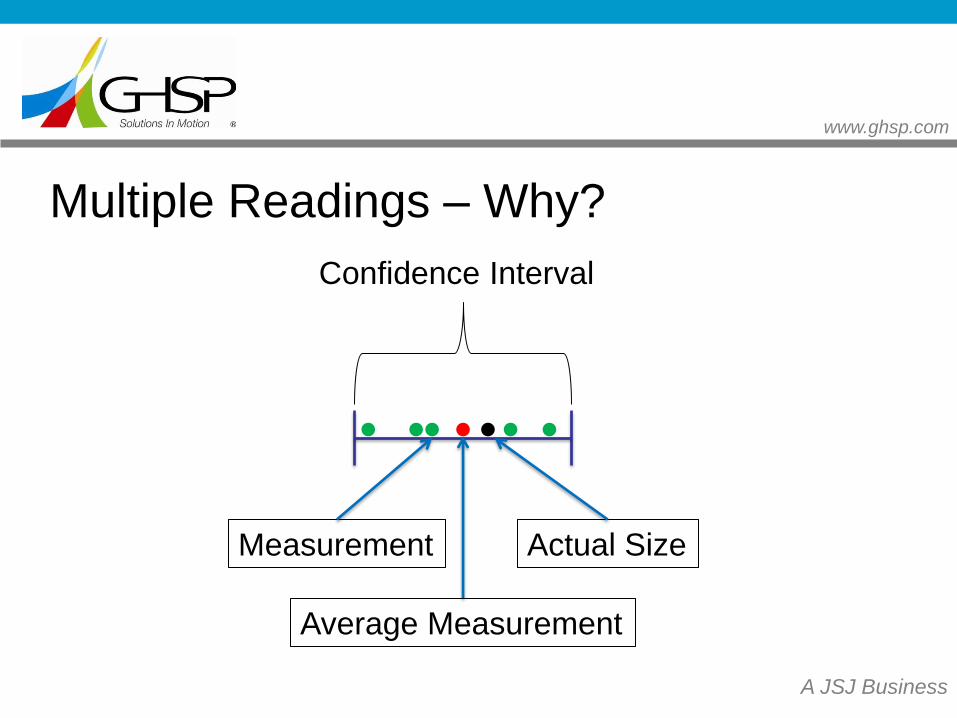
Confidence Interval and Distinct Categories
Confidence Interval
Measurement Actual Size
The actual size of a
measured part can
be anywhere within
the confidence
interval
www.ghsp.com
A JSJ Business
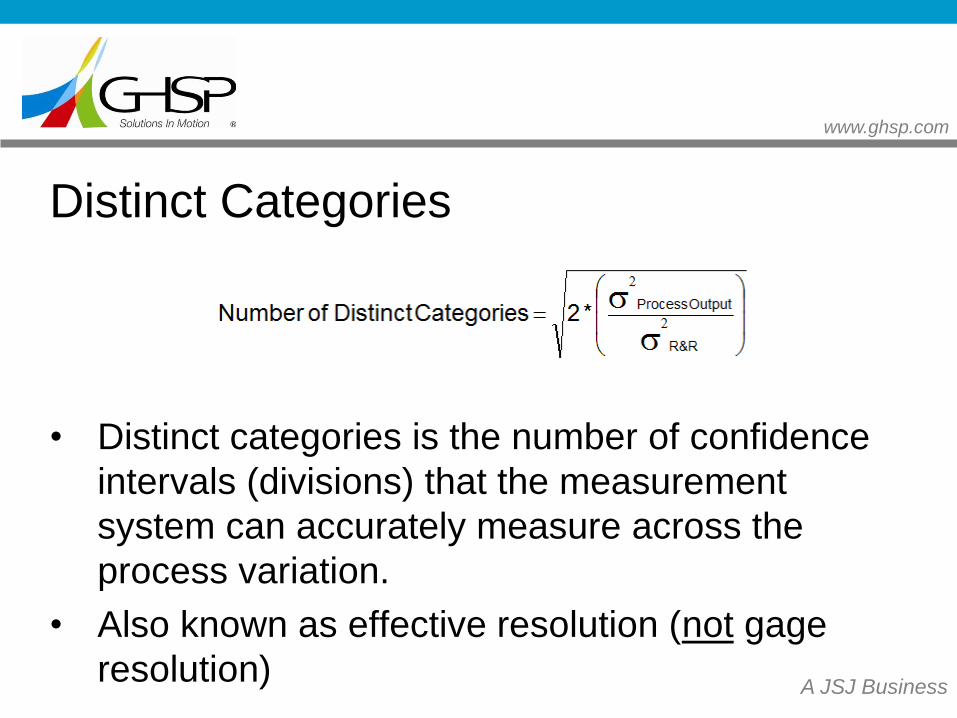
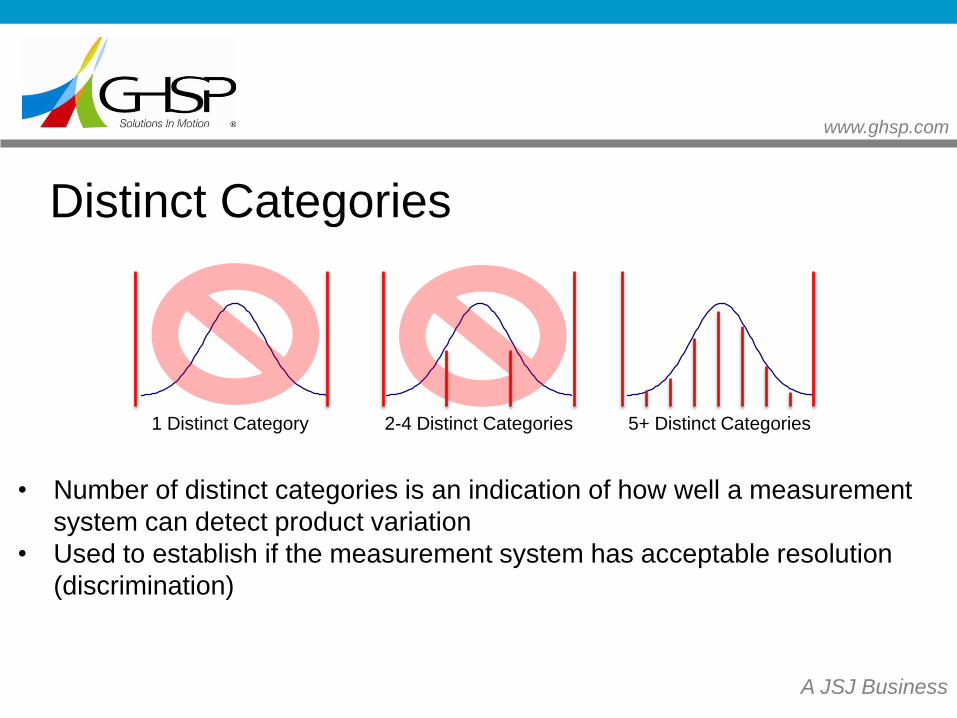
Distinct Categories
• Distinct categories is the number of confidence
intervals (divisions) that the measurement
system can accurately measure across the
process variation.
• Also known as effective resolution (not gage
resolution)
www.ghsp.com
A JSJ Business
Distinct Categories
1 Distinct Category 2-4 Distinct Categories 5+ Distinct Categories
• Number of distinct categories is an indication of how well a measurement
system can detect product variation
• Used to establish if the measurement system has acceptable resolution
(discrimination)
www.ghsp.com
A JSJ Business
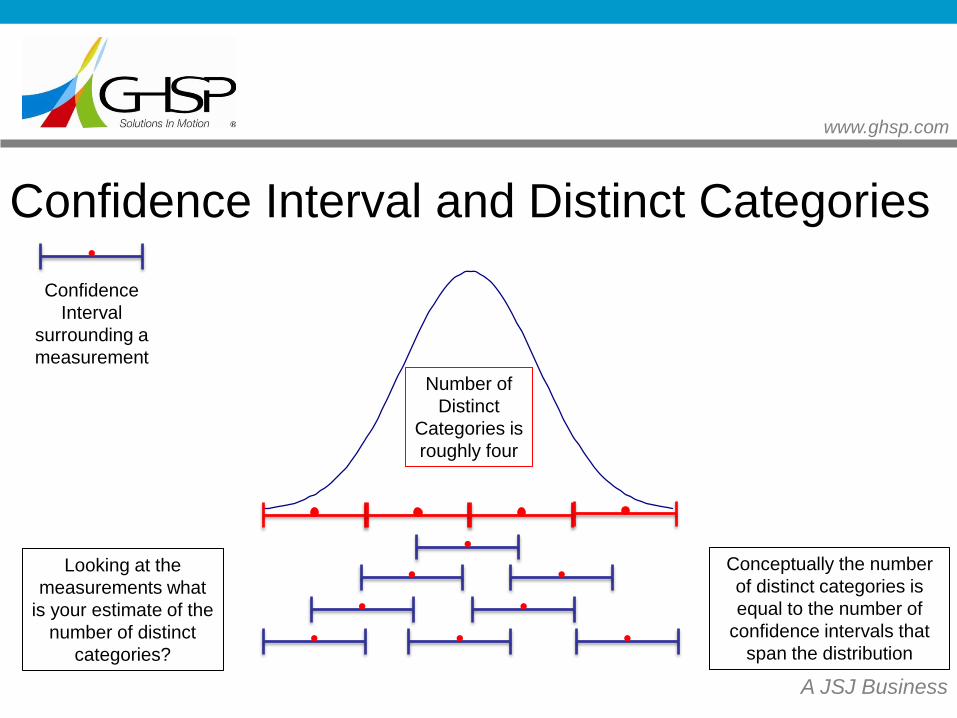
Confidence Interval and Distinct Categories
Confidence
Interval
surrounding a
measurement
Looking at the
measurements what
is your estimate of the
number of distinct
categories?
Conceptually the number
of distinct categories is
equal to the number of
confidence intervals that
span the distribution
Number of
Distinct
Categories is
roughly four
www.ghsp.com
A JSJ Business
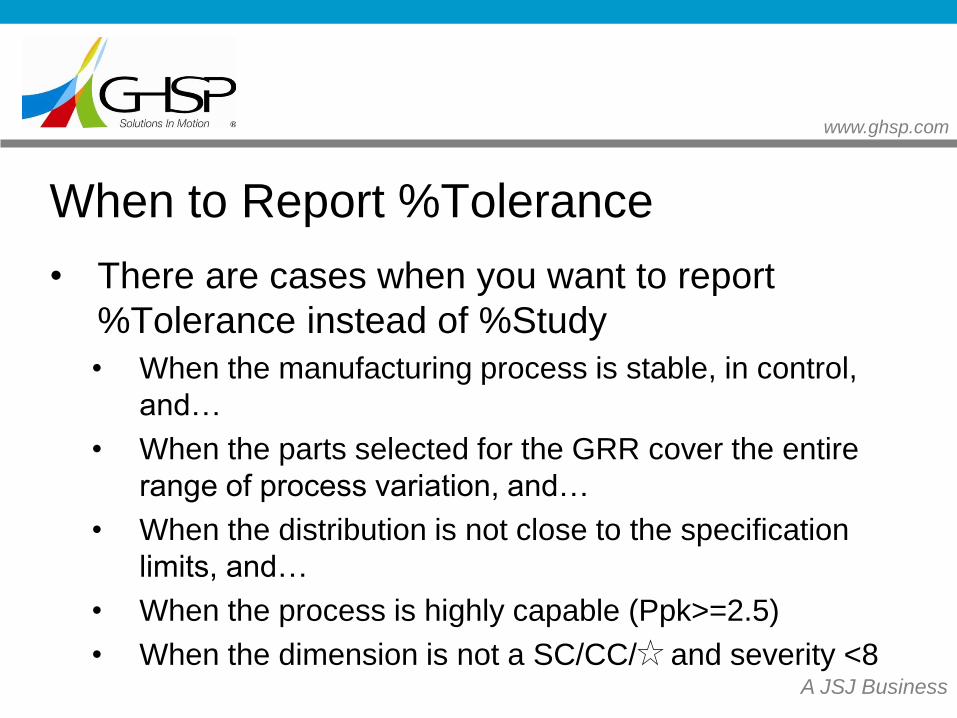
When to Report %Tolerance
• There are cases when you want to report
%Tolerance instead of %Study
• When the manufacturing process is stable, in control,
and…
• When the parts selected for the GRR cover the entire
range of process variation, and…
• When the distribution is not close to the specification
limits, and…
• When the process is highly capable (Ppk>=2.5)
• When the dimension is not a SC/CC/ and severity <8
www.ghsp.com
A JSJ Business
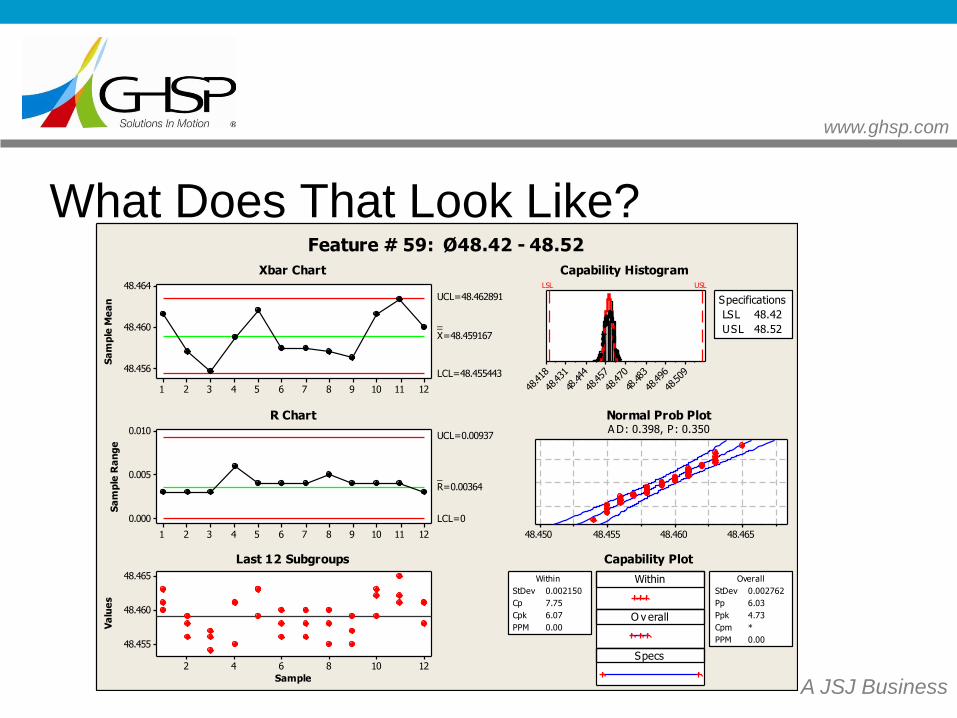
What Does That Look Like?
121110987654321
48.464
48.460
48.456
Sa
mp
le M
ea
n
__X=48.459167
UCL=48.462891
LCL=48.455443
121110987654321
0.010
0.005
0.000
Sa
mp
le R
an
ge
_R=0.00364
UCL=0.00937
LCL=0
12108642
48.465
48.460
48.455
Sample
Va
lue
s
48.509
48.496
48.483
48.470
48.457
48.444
48.431
48.418
LSL USL
LSL 48.42
USL 48.52
Specifications
48.46548.46048.45548.450
Within
O v erall
Specs
StDev 0.002150
Cp 7.75
Cpk 6.07
PPM 0.00
Within
StDev 0.002762
Pp 6.03
Ppk 4.73
Cpm *
PPM 0.00
Overall
Feature # 59: Ø48.42 - 48.52
Xbar Chart
R Chart
Last 12 Subgroups
Capability Histogram
Normal Prob PlotA D: 0.398, P: 0.350
Capability Plot
www.ghsp.com
A JSJ Business
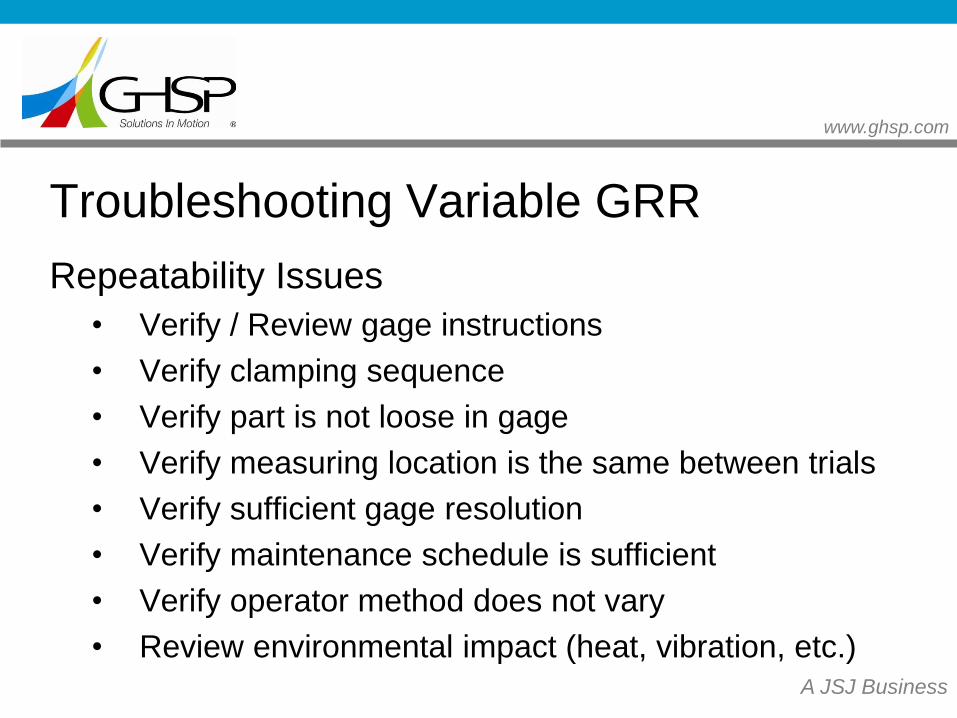
Troubleshooting Variable GRR
Repeatability Issues
• Verify / Review gage instructions
• Verify clamping sequence
• Verify part is not loose in gage
• Verify measuring location is the same between trials
• Verify sufficient gage resolution
• Verify maintenance schedule is sufficient
• Verify operator method does not vary
• Review environmental impact (heat, vibration, etc.)
www.ghsp.com
A JSJ Business
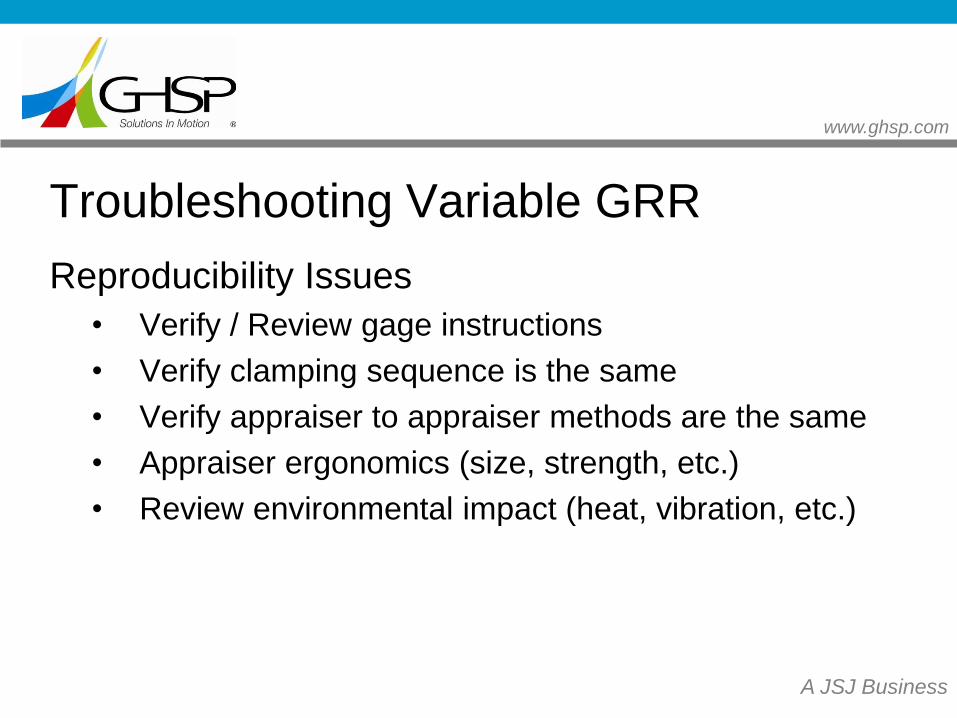
Reproducibility Issues
• Verify / Review gage instructions
• Verify clamping sequence is the same
• Verify appraiser to appraiser methods are the same
• Appraiser ergonomics (size, strength, etc.)
• Review environmental impact (heat, vibration, etc.)
Troubleshooting Variable GRR
www.ghsp.com
A JSJ Business
Reducing Variation – Multiple Readings
• If improving of gage instructions and appraiser
training fail to provide an acceptable outcome you
can use multiple readings to gain a better result
• One drawback to this is that it can take significantly
longer to conduct the study and this method will need
to be used until further gage improvements can be
made
www.ghsp.com
A JSJ Business
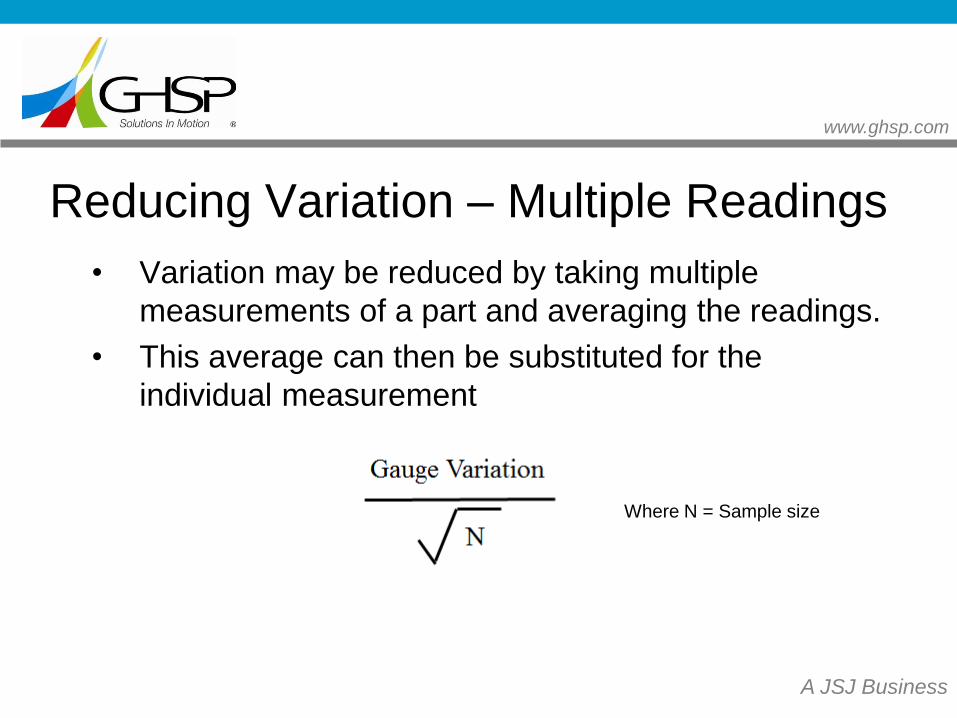
• Variation may be reduced by taking multiple
measurements of a part and averaging the readings.
• This average can then be substituted for the
individual measurement
Reducing Variation – Multiple Readings
Where N = Sample size
www.ghsp.com
A JSJ Business
Multiple Readings – Why?
Measurement Actual Size
Confidence Interval
Average Measurement
www.ghsp.com
A JSJ Business
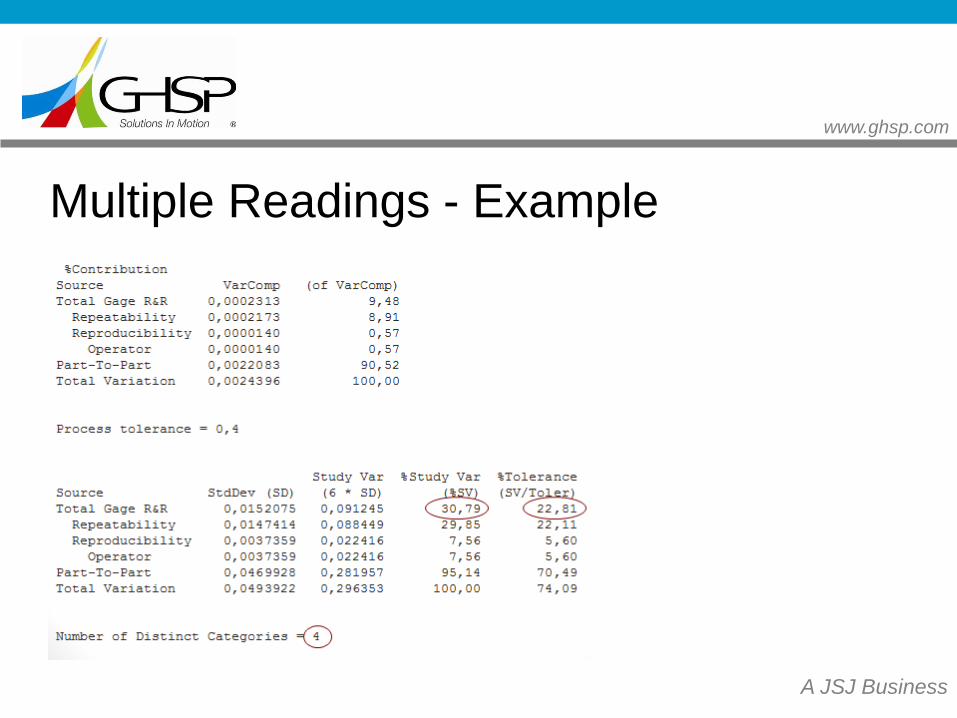
Multiple Readings - Example
www.ghsp.com
A JSJ Business
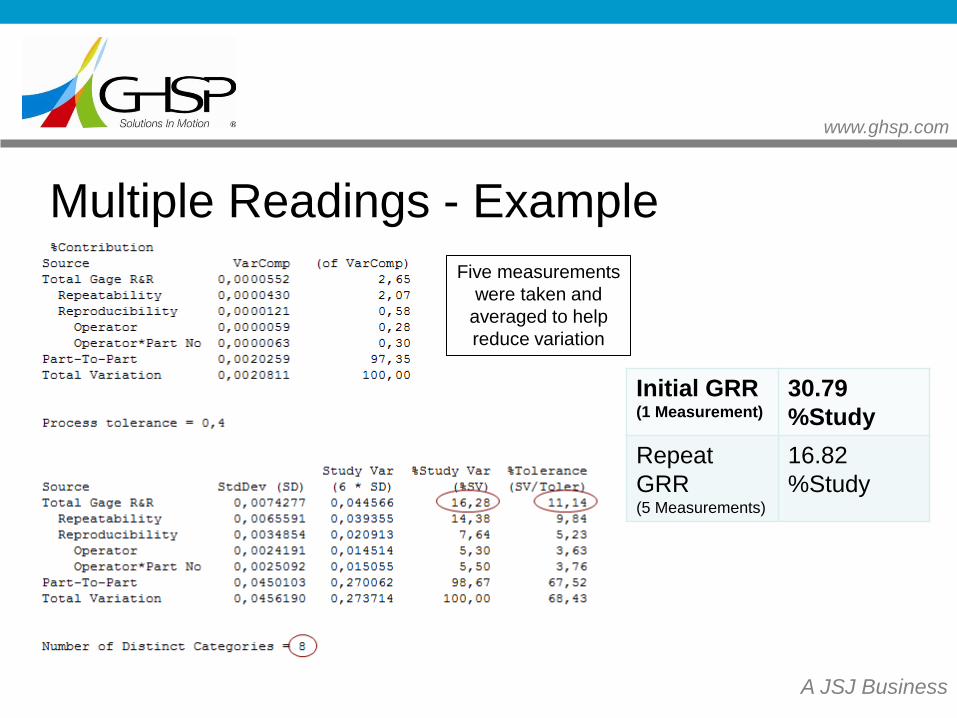
Multiple Readings - Example
Five measurements
were taken and
averaged to help
reduce variation
Initial GRR (1 Measurement)
30.79
%Study
Repeat
GRR (5 Measurements)
16.82
%Study
www.ghsp.com
A JSJ Business
Attribute Data GRR
www.ghsp.com
A JSJ Business
Attribute GRR
What is the goal of an attribute GRR?
• 100% match within and between operators
measurement and the correct (master) attribute
• To have all Kappa values greater than 0.75
www.ghsp.com
A JSJ Business
Attribute GRR
What you need
1. At least 50 parts
2. At least 3 appraisers
3. Each appraiser should measure each part 3 times
www.ghsp.com
A JSJ Business
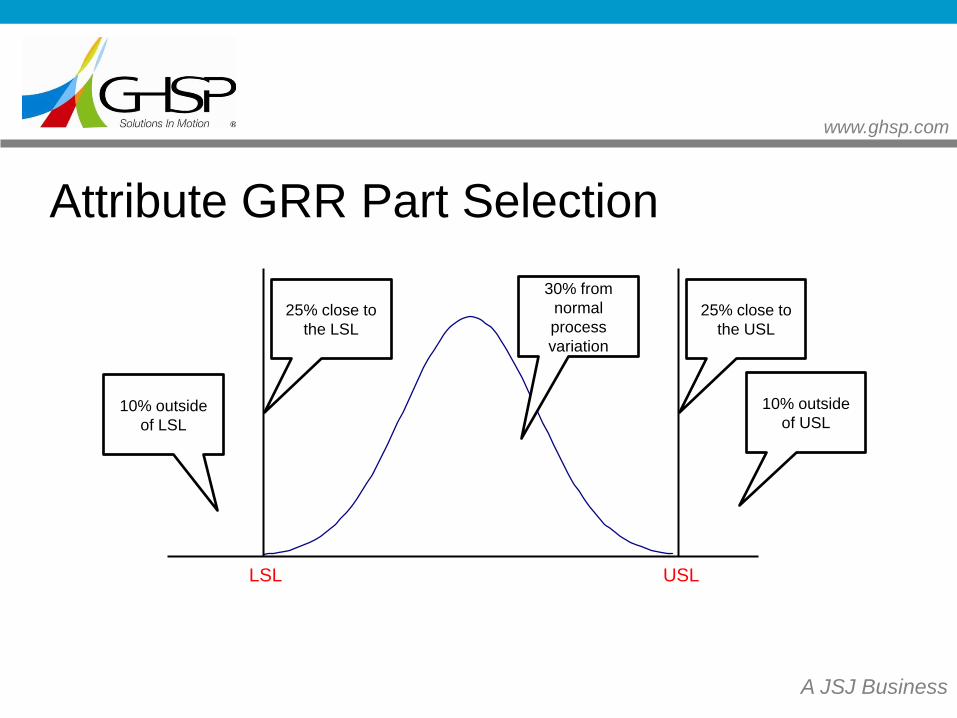
Attribute GRR Part Selection
30% from
normal
process
variation
25% close to
the LSL
25% close to
the USL
10% outside
of USL 10% outside
of LSL
LSL USL
www.ghsp.com
A JSJ Business
Attribute GRR
How to conduct an attribute GRR
1. Select parts for study (50 minimum)
2. Select appraisers for study (recommend 3)
3. Measure all 50 parts on a master measurement
system (ex. CMM)
4. Build a master truth table
This table lists the known disposition of each part
(pass/fail) as well as associated variable data
www.ghsp.com
A JSJ Business
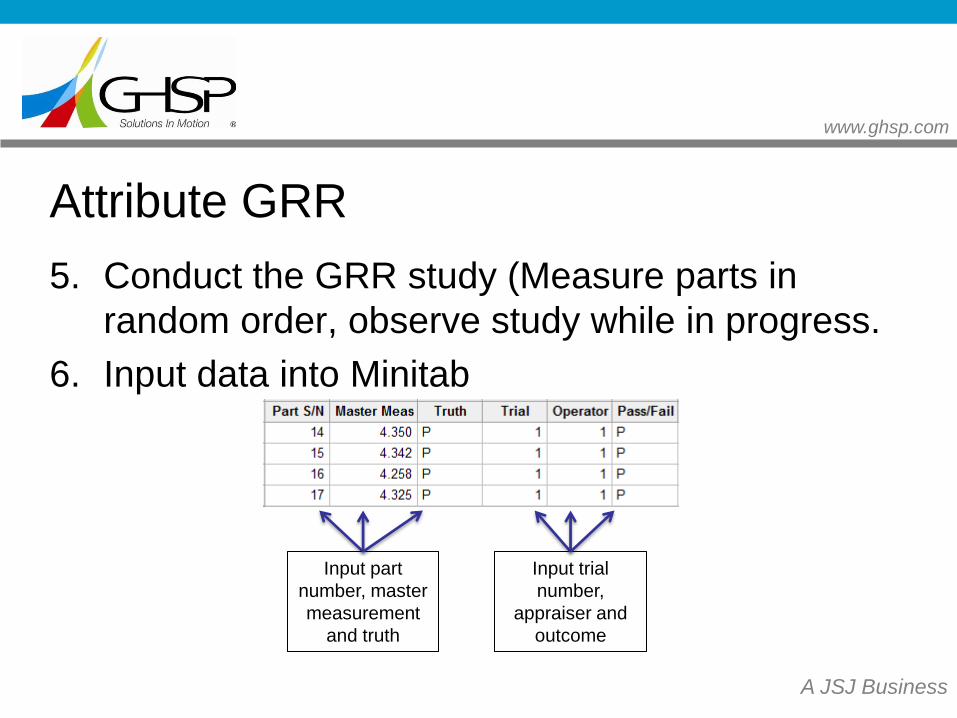
Attribute GRR
5. Conduct the GRR study (Measure parts in
random order, observe study while in progress.
6. Input data into Minitab
Input part
number, master
measurement
and truth
Input trial
number,
appraiser and
outcome
www.ghsp.com
A JSJ Business
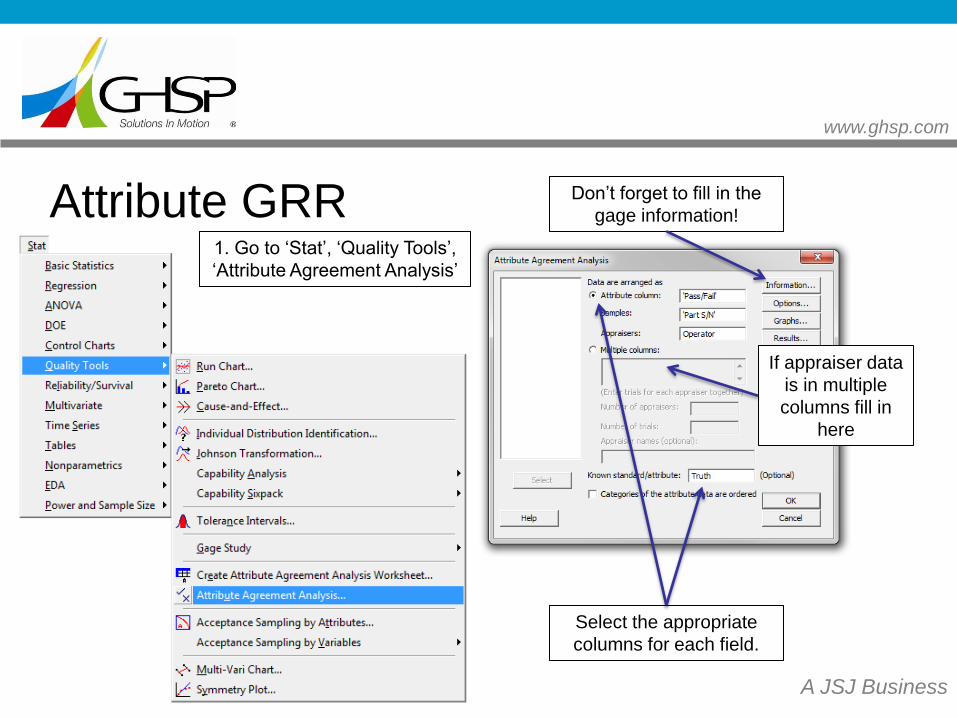
Attribute GRR 1. Go to ‘Stat’, ‘Quality Tools’,
‘Attribute Agreement Analysis’
Select the appropriate
columns for each field.
Don’t forget to fill in the
gage information!
If appraiser data
is in multiple
columns fill in
here
www.ghsp.com
A JSJ Business
321
100
99
98
97
96
95
94
Appraiser
Pe
rce
nt
95.0% C I
Percent
321
100
99
98
97
96
95
94
Appraiser
Pe
rce
nt
95.0% C I
Percent
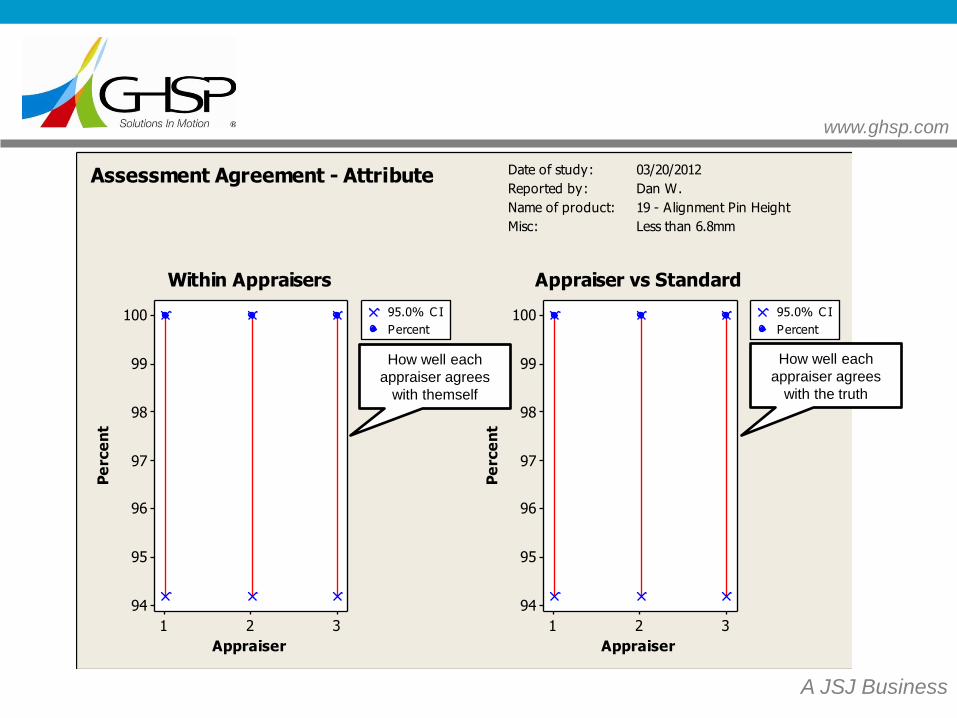
Date of study: 03/20/2012
Reported by: Dan W.
Name of product: 19 - Alignment Pin Height
Misc: Less than 6.8mm
Assessment Agreement - Attribute
Within Appraisers Appraiser vs Standard
How well each
appraiser agrees
with themself
How well each
appraiser agrees
with the truth
www.ghsp.com
A JSJ Business
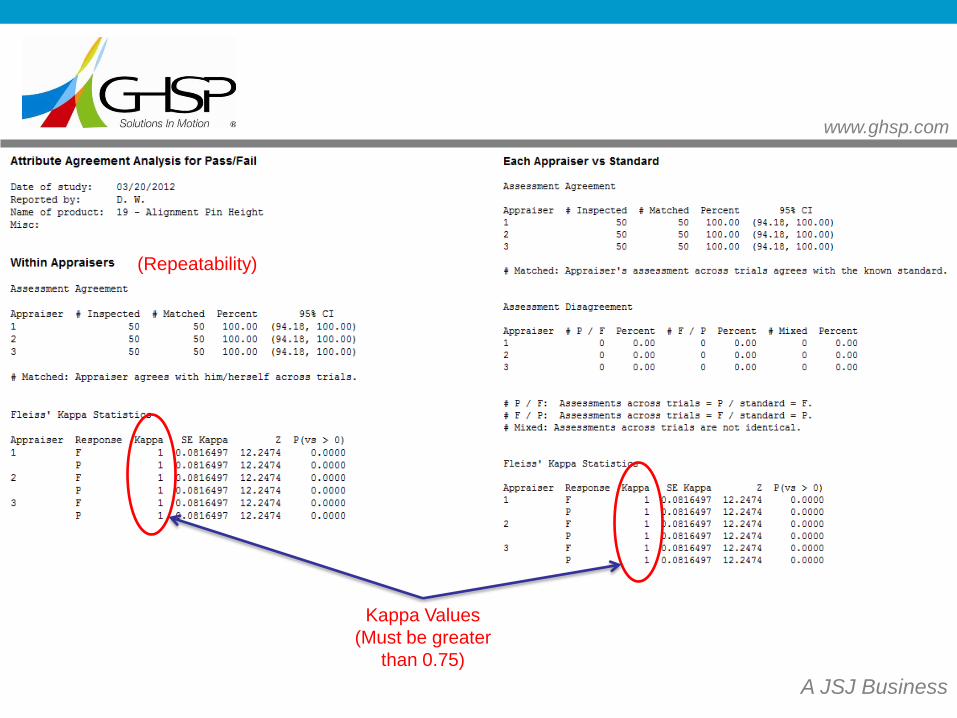
(Repeatability)
Kappa Values
(Must be greater
than 0.75)
www.ghsp.com
A JSJ Business
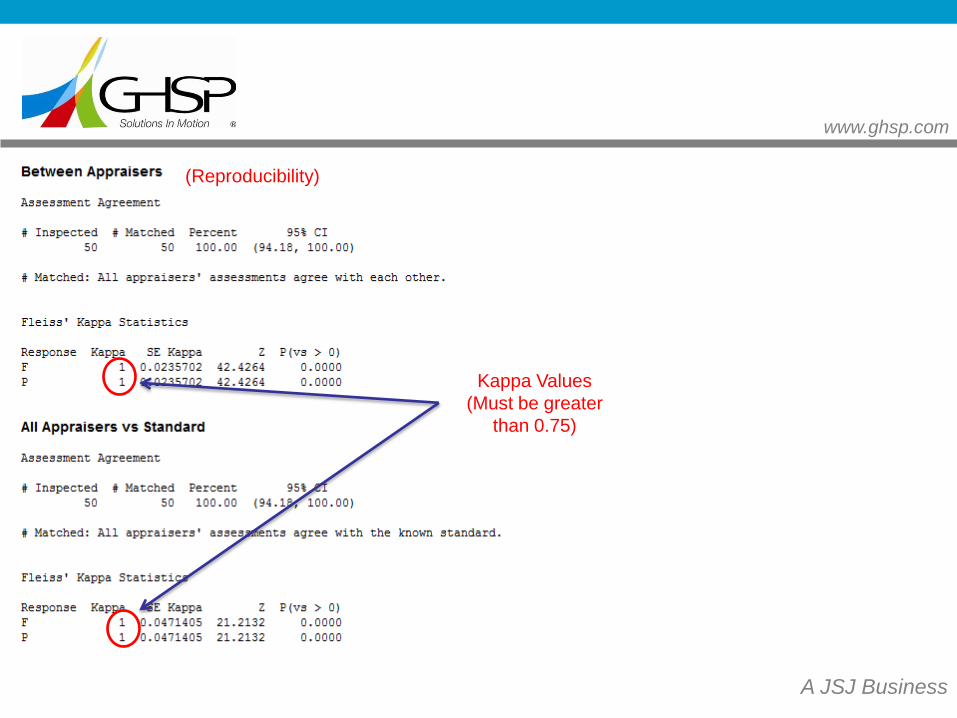
(Reproducibility)
Kappa Values
(Must be greater
than 0.75)
www.ghsp.com
A JSJ Business
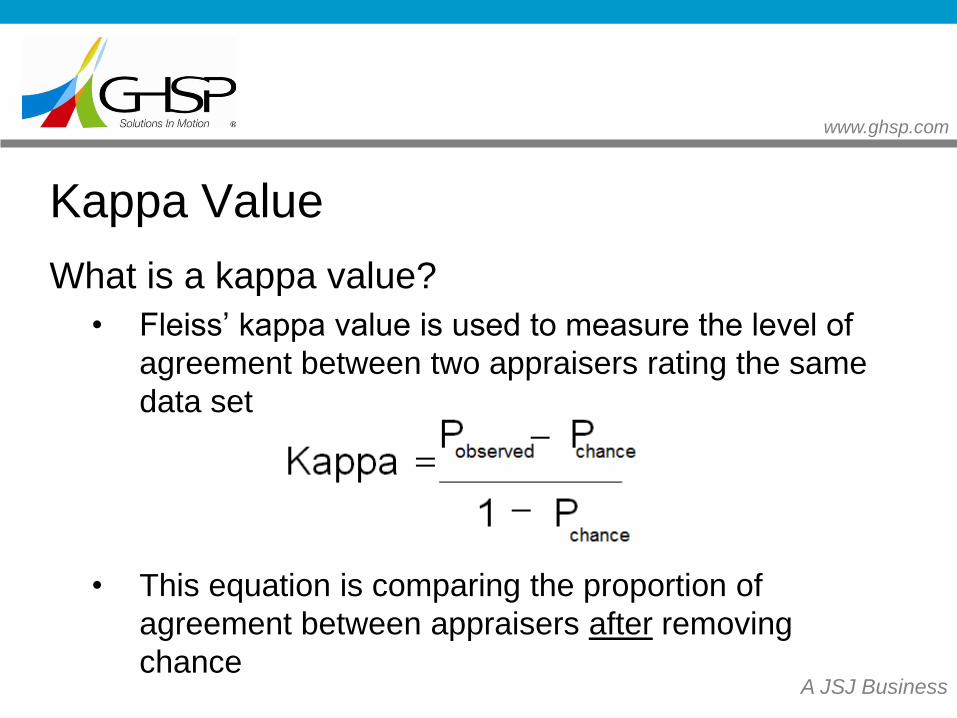
Kappa Value
What is a kappa value?
• Fleiss’ kappa value is used to measure the level of
agreement between two appraisers rating the same
data set
• This equation is comparing the proportion of
agreement between appraisers after removing
chance
www.ghsp.com
A JSJ Business
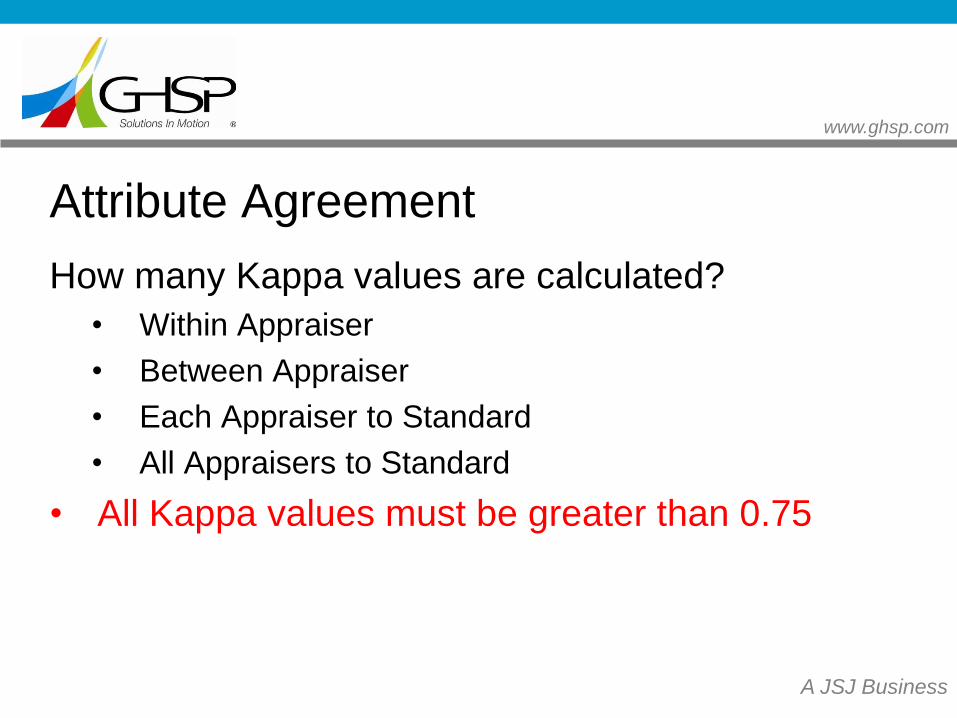
Attribute Agreement
How many Kappa values are calculated?
• Within Appraiser
• Between Appraiser
• Each Appraiser to Standard
• All Appraisers to Standard
• All Kappa values must be greater than 0.75
www.ghsp.com
A JSJ Business
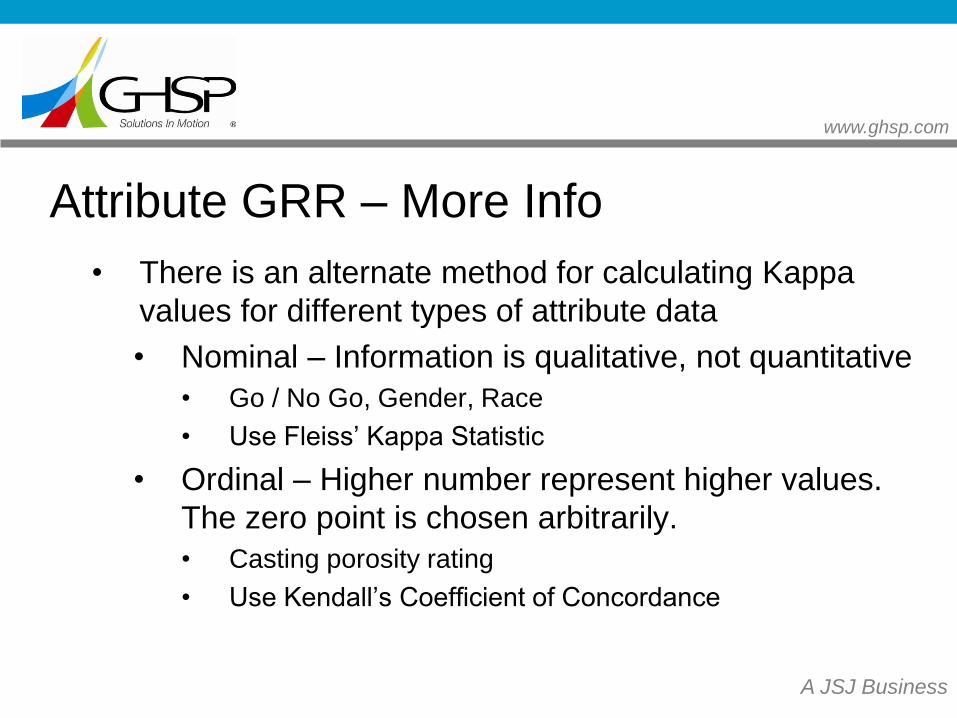
Attribute GRR – More Info
• There is an alternate method for calculating Kappa
values for different types of attribute data
• Nominal – Information is qualitative, not quantitative
• Go / No Go, Gender, Race
• Use Fleiss’ Kappa Statistic
• Ordinal – Higher number represent higher values.
The zero point is chosen arbitrarily.
• Casting porosity rating
• Use Kendall’s Coefficient of Concordance

www.ghsp.com
A JSJ Business
Guard Banding
www.ghsp.com
A JSJ Business
Guard Banding – General Rules
• Guard banding is shrinking the product
acceptance limits from the product tolerance
• This can only be done if a gage has
repeatability issues. It will do nothing to correct
a reproducibility concern
• Typically used when a product is not capable
and the part is measured 100%
www.ghsp.com
A JSJ Business
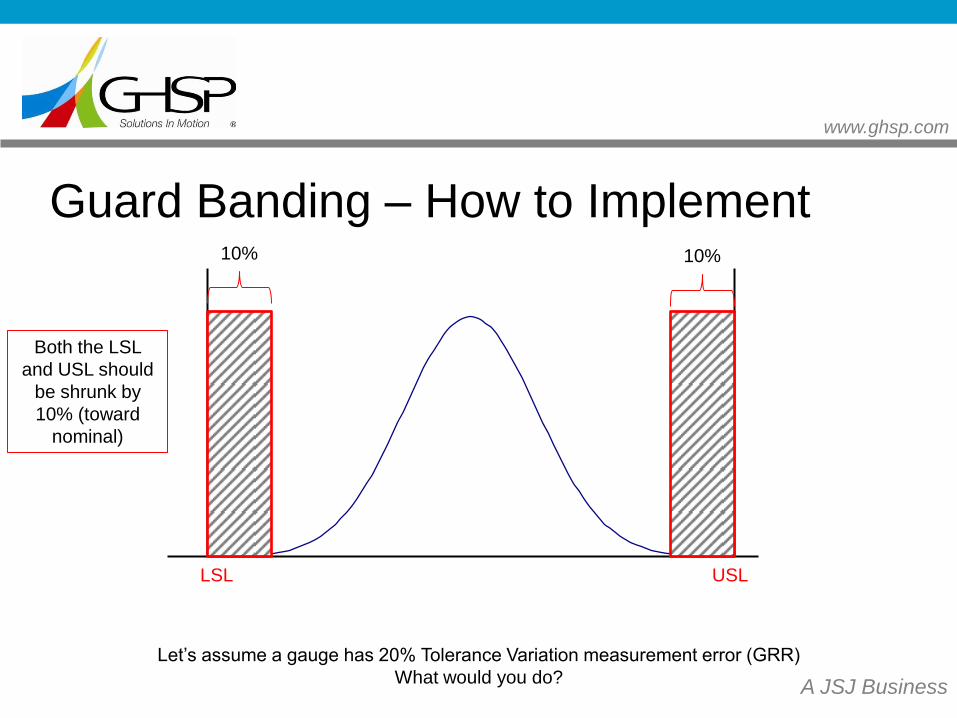
Guard Banding – How to Implement
LSL USL
Let’s assume a gauge has 20% Tolerance Variation measurement error (GRR)
What would you do?
10% 10%
Both the LSL
and USL should
be shrunk by
10% (toward
nominal)
www.ghsp.com
A JSJ Business
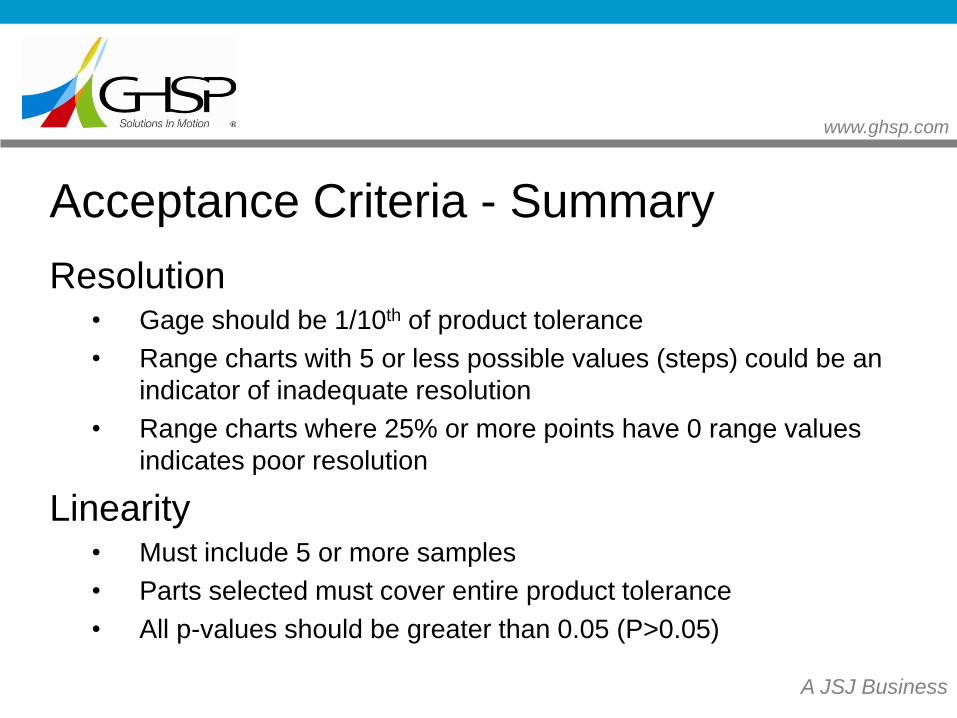
Resolution • Gage should be 1/10th of product tolerance
• Range charts with 5 or less possible values (steps) could be an
indicator of inadequate resolution
• Range charts where 25% or more points have 0 range values
indicates poor resolution
Linearity • Must include 5 or more samples
• Parts selected must cover entire product tolerance
• All p-values should be greater than 0.05 (P>0.05)
Acceptance Criteria - Summary
www.ghsp.com
A JSJ Business
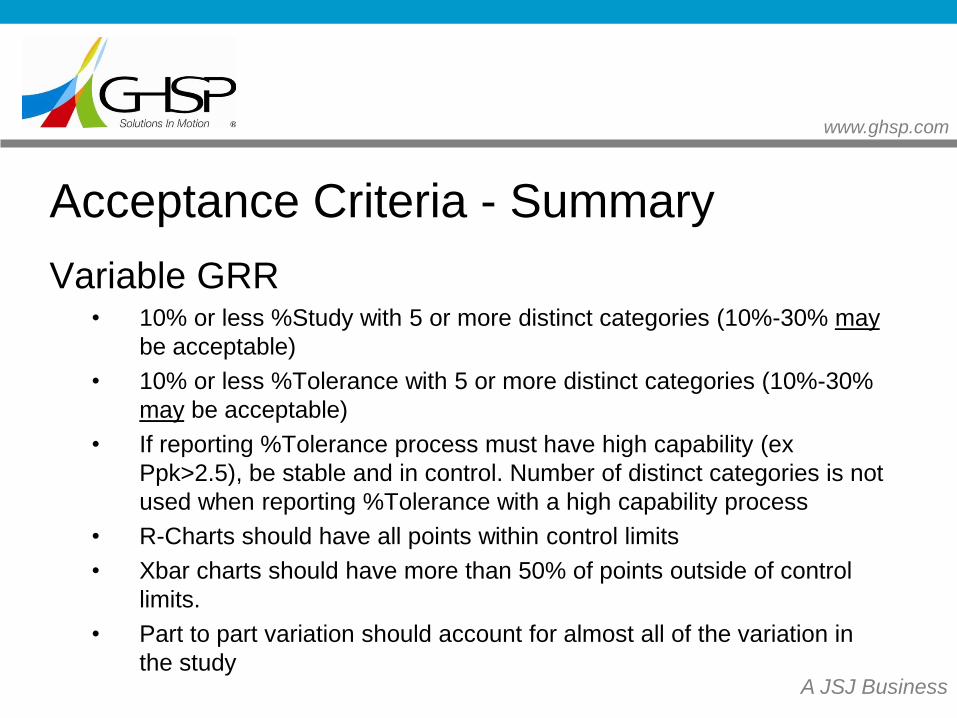
Acceptance Criteria - Summary
Variable GRR • 10% or less %Study with 5 or more distinct categories (10%-30% may
be acceptable)
• 10% or less %Tolerance with 5 or more distinct categories (10%-30%
may be acceptable)
• If reporting %Tolerance process must have high capability (ex
Ppk>2.5), be stable and in control. Number of distinct categories is not
used when reporting %Tolerance with a high capability process
• R-Charts should have all points within control limits
• Xbar charts should have more than 50% of points outside of control
limits.
• Part to part variation should account for almost all of the variation in
the study
www.ghsp.com
A JSJ Business
Attribute GRR
• All Kappa values must be greater than 0.75
• Within Appraiser
• Between Appraiser
• Each Appraiser to Standard
• All Appraisers to Standard
Acceptance Criteria - Summary