Embed Size (px)
Citation preview

EDMS 457017
ORGANI SATION EUROPEENNE P OUR L A RECHERCHE NUCLEAI RE EUROPEAN ORGANIZATI ON FOR NUCL EAR RES EARCH
L a b o r a t o i r e E u r o p é e n p o u r l a P h y s i q u e d e s P a r t i c u l e s E u r ope a n L a b o r a t o r y f o r P ar t i c l e P hy s i c s
Safety Commission Safety Commission
Technical Note Technical Note
CERN-SC-2004-025-RP-TN
Measurements and Simulations of the PMI Chamber Response to the Radiation Field inside the CERF Target Area
Helmut Vincke, Norbert Aguilar, Doris Forkel-Wirth, Michel Pangallo, Daniel Perrin,
Michel Renou and Chris Theis
Abstract The PMI detector, manufactured by PTW, type 34031, is an air ionization chamber which is operated under atmospheric pressure. Its main use at CERN is to monitor photon radiation in beam areas during beam-off conditions. The aim of this work is to extend the use of this detector to measure the energy deposition in air produced by all radiation components occurring in a mixed high-energy radiation field. To realize this goal, measurements in the CERF target area at CERN were performed. Within this framework six chambers were exposed to different mixed particles fields varying strongly in their mean energy. These results were backed up by FLUKA simulations in order to study the influences of the various radiation components on the final detector response. Moreover, the influence of the detector hull to the detector response was evaluated.
1
EDMS 457017
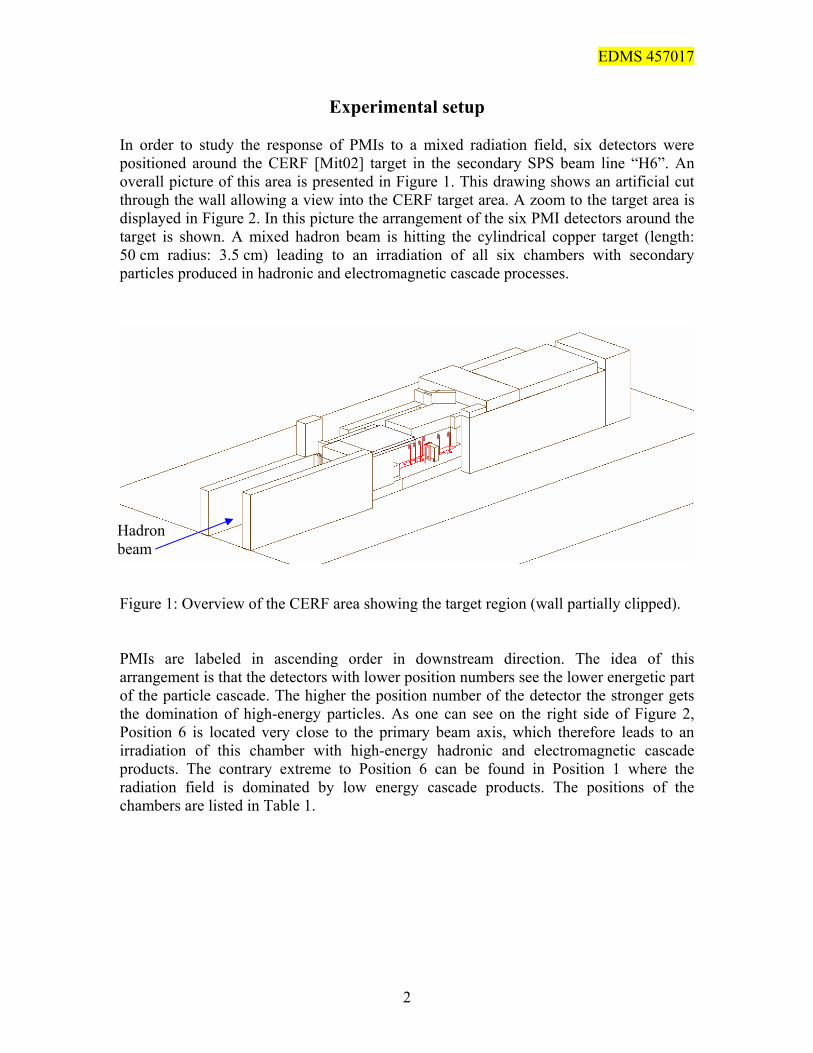
Experimental setup In order to study the response of PMIs to a mixed radiation field, six detectors were positioned around the CERF [Mit02] target in the secondary SPS beam line “H6”. An overall picture of this area is presented in Figure 1. This drawing shows an artificial cut through the wall allowing a view into the CERF target area. A zoom to the target area is displayed in Figure 2. In this picture the arrangement of the six PMI detectors around the target is shown. A mixed hadron beam is hitting the cylindrical copper target (length: 50 cm radius: 3.5 cm) leading to an irradiation of all six chambers with secondary particles produced in hadronic and electromagnetic cascade processes.
Hadron beam
Figure 1: Overview of the CERF area showing the target region (wall partially clipped). PMIs are labeled in ascending order in downstream direction. The idea of this arrangement is that the detectors with lower position numbers see the lower energetic part of the particle cascade. The higher the position number of the detector the stronger gets the domination of high-energy particles. As one can see on the right side of Figure 2, Position 6 is located very close to the primary beam axis, which therefore leads to an irradiation of this chamber with high-energy hadronic and electromagnetic cascade products. The contrary extreme to Position 6 can be found in Position 1 where the radiation field is dominated by low energy cascade products. The positions of the chambers are listed in Table 1.
2
EDMS 457017
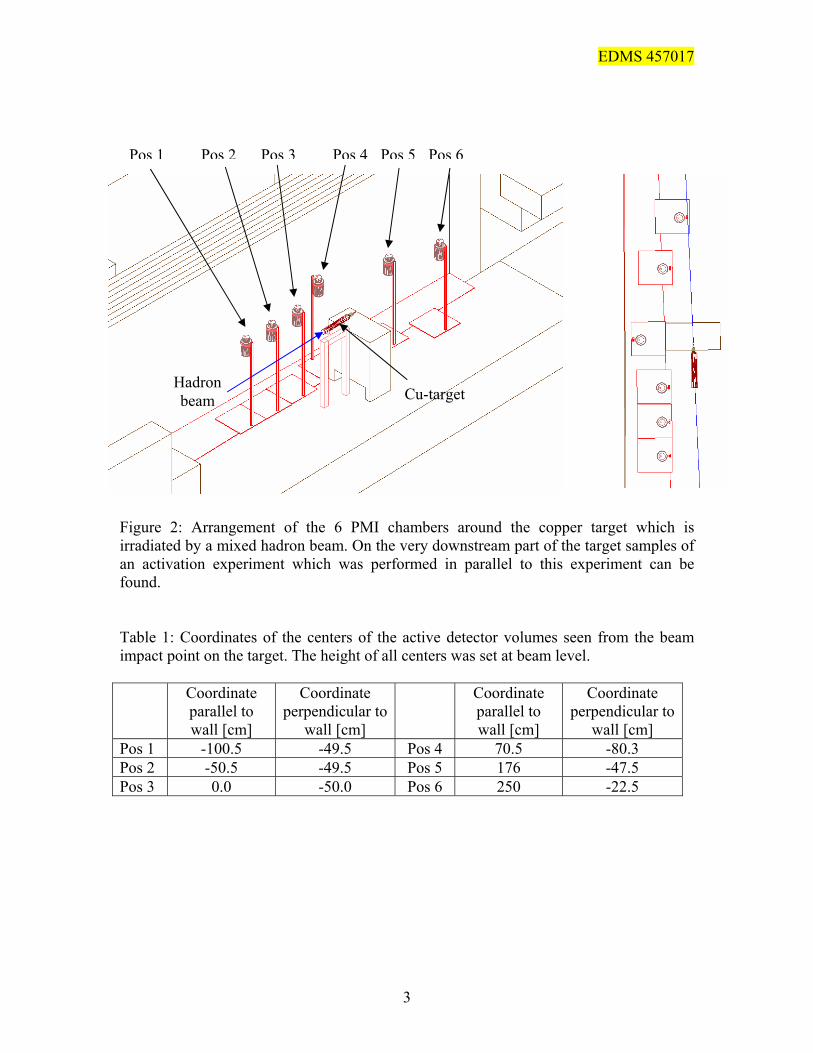
Pos 1 Pos 2 Pos 3 Pos 4 Pos 5 Pos 6
Cu-target Hadron beam
Figure 2: Arrangement of the 6 PMI chambers around the copper target which is irradiated by a mixed hadron beam. On the very downstream part of the target samples of an activation experiment which was performed in parallel to this experiment can be found. Table 1: Coordinates of the centers of the active detector volumes seen from the beam impact point on the target. The height of all centers was set at beam level. Coordinate
parallel to wall [cm]
Coordinate perpendicular to
wall [cm]
Coordinate parallel to wall [cm]
Coordinate perpendicular to
wall [cm] Pos 1 -100.5 -49.5 Pos 4 70.5 -80.3 Pos 2 -50.5 -49.5 Pos 5 176 -47.5 Pos 3 0.0 -50.0 Pos 6 250 -22.5
3
EDMS 457017
Beam parameters: The mixed hadron beam hitting the CERF target is produced about 400 m further upstream by the impact of 400 GeV/c SPS protons on a beryllium target (T4) which is located in the TCC2 area. For our experiment secondary, positively charged interaction products with a momentum of 120 GeV/c are deviated to the North Hall in order to function as incident beam particles hitting the CERF target. Further parameters concerning the beam used for the experiment are listed in Table 2. Table 2: Beam parameters of the H6 hadron beam as it appears 8.5 m upstream the cylindrical target’s front face.
π+ protons K+ Particle composition in % 60.7 34.8 4.5
Momentum 120 GeV/c Intensity used up to 9.5×10⁷ hadrons (4000 PIC) per 16.8 s
σhorizontal 1.3 cm Gaussian beam shape approximation (4000 PIC) σvertical 1.0 cm
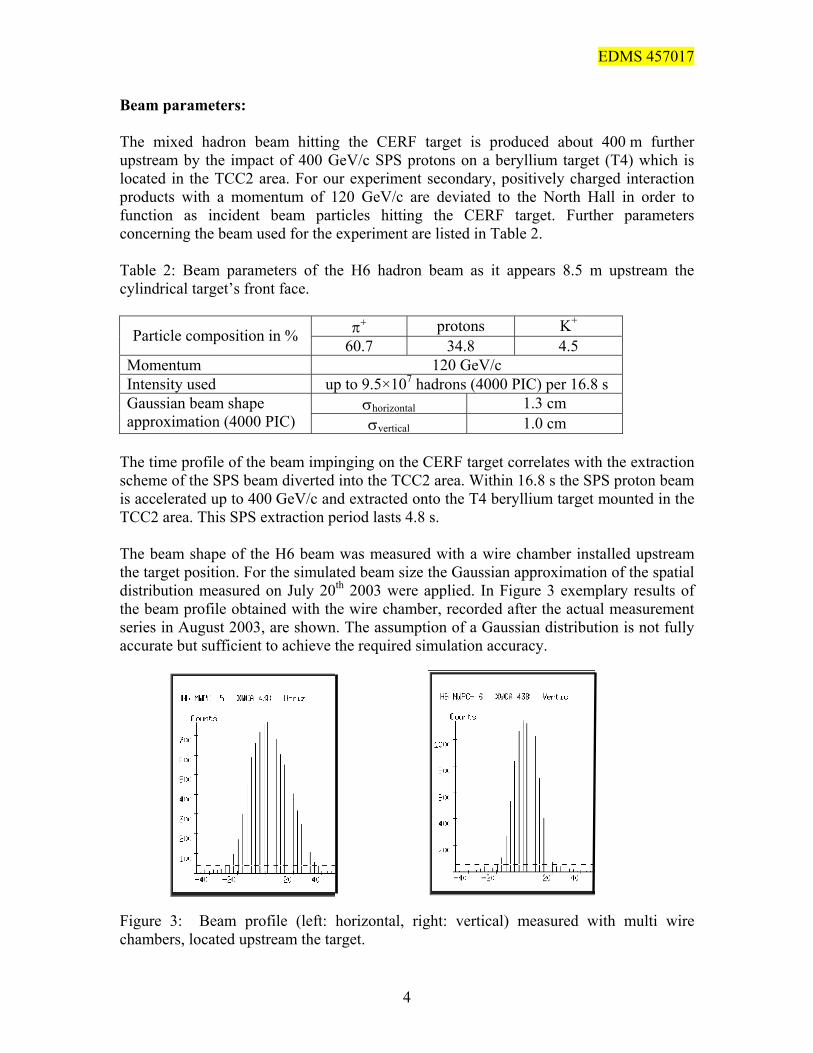
The time profile of the beam impinging on the CERF target correlates with the extraction scheme of the SPS beam diverted into the TCC2 area. Within 16.8 s the SPS proton beam is accelerated up to 400 GeV/c and extracted onto the T4 beryllium target mounted in the TCC2 area. This SPS extraction period lasts 4.8 s. The beam shape of the H6 beam was measured with a wire chamber installed upstream the target position. For the simulated beam size the Gaussian approximation of the spatial distribution measured on July 20th 2003 were applied. In Figure 3 exemplary results of the beam profile obtained with the wire chamber, recorded after the actual measurement series in August 2003, are shown. The assumption of a Gaussian distribution is not fully accurate but sufficient to achieve the required simulation accuracy. Figure 3: Beam profile (left: horizontal, right: vertical) measured with multi wire chambers, located upstream the target.
4
EDMS 457017
The beam intensity was monitored with the so-called PIC counter [Mit02, Eft02] which is an air ionization chamber placed in the beam line 8.5 m upstream the target position. The reference numbers given as an output by this device are “PIC counts”, where one PIC count correlates with a beam intensity of 23000 particles. The uncertainty of this chamber is given with ±10 %.
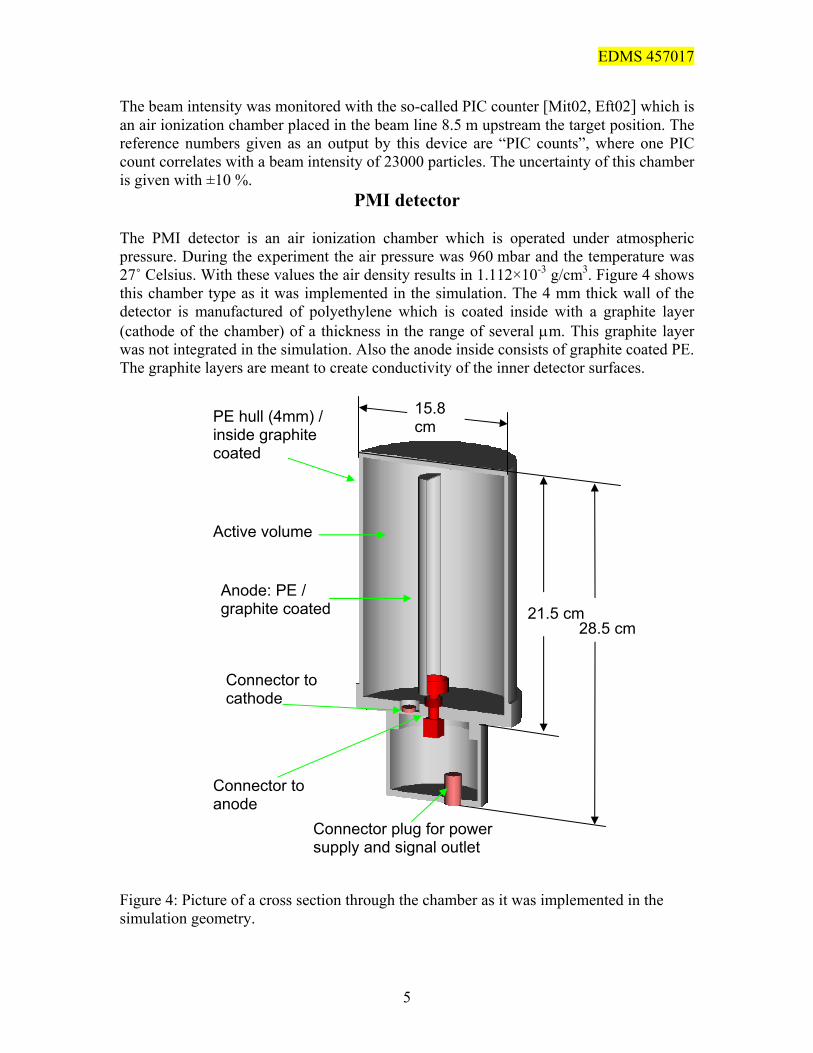
PMI detector The PMI detector is an air ionization chamber which is operated under atmospheric pressure. During the experiment the air pressure was 960 mbar and the temperature was 27˚ Celsius. With these values the air density results in 1.112×10⁻³ g/cm3. Figure 4 shows this chamber type as it was implemented in the simulation. The 4 mm thick wall of the detector is manufactured of polyethylene which is coated inside with a graphite layer (cathode of the chamber) of a thickness in the range of several µm. This graphite layer was not integrated in the simulation. Also the anode inside consists of graphite coated PE. The graphite layers are meant to create conductivity of the inner detector surfaces. 15.8
cm PE hull (4mm) / inside graphite coated
Active volume Anode: PE /
graphite coated
Connector to cathode
Connector to anode
Connector plug for power supply and signal outlet
28.5 cm 21.5 cm
Figure 4: Picture of a cross section through the chamber as it was implemented in the simulation geometry.
5
EDMS 457017
The outer dimensions of the cylindrical shaped detector are 15.8 cm (diameter) times 28.5 cm (height) and the active volume enclosed between the anode and the cathode is 3079 cm3. During the experiment the chamber was operated with a voltage of 463 V. The current produced by incident particles is lead from the anode over a connection plug to the PMI electronics which is not attached to the chamber. The electronics parameters are set as such that a collected charge of 1 pC results in one detection count.
Simulation details All simulations were performed with the Monte Carlo code FLUKA2002 [Fas01a, Fas01b]. The version used was released in May 2003.
Simulation procedure In order to allow better analysis of the simulation and to improve the statistical significance of the results, the simulation procedure was split in two parts. The first part calculates the secondary particle production triggered by the beam impact in the CERF target and the tracking of the cascade products in the area. Parameters of particles hitting one of the six detector positions are stored in a file and their transport is artificially stopped at this place. In the second part of the calculation these particles are reloaded ten times into the simulation in order to investigate accurately the response of the detectors to the radiation field present at the various chamber positions. The calculation of the detector response was realized in the following way. The energy deposition of all particles reaching the active volume in the detector is calculated in the second part of the simulation and then properly normalized to the number of beam particles started in the first run. With the resulting value (average energy deposition in the active chamber volume per beam particle hitting the target) and the number of beam particles hitting the target per SPS cycle, one can calculate the total energy deposited in the active PMI volume during this time. By using the so called W-factor (33.9 eV per e-/Ion+ pair) [ICR79], this result is then translated into the number of e-/Ion+ pairs which is produced during one SPS cycle. Taking into account that 1 pC is required to trigger one detector count (this value is given by the properties of electronics components), the result can be directly compared with its measured counterpart. Beside the counting rate triggered by the total particle field, the second run was also performed in a way that just single sorts of particles were started in order to investigate the contribution of various particle kinds to the final detector counting result.
6
EDMS 457017
Particles transported in the simulation RUN1: The lower threshold for particle transport was set to 0.1 MeV for all muons and hadrons except antineutrons (50 MeV) and neutrons, which were followed down to thermal energies. In order to save CPU time, the lower energy threshold for electrons and positrons were defined to be 900 keV. Since an electron or positron of 900 keV is not capable to traverse a PE layer of 4 mm, this high threshold is fully justified. In case a positron reaches this energy, it is stopped and the annihilation process with an electron is forced. As a result of that two photons with an energy of 511 keV are created and transported through the geometry. The threshold of photons was set to a lower limit of 5 keV, which is already close to the photon transport limit of FLUKA. RUN 2: The cut-offs for hadrons and photons were the same as used in RUN1. In order to get reliable results for the final energy deposition inside the PMI chamber, the transport threshold for electrons and positrons were lowered to 40 keV. This value correlates with a CSDA (Continuous-Slowing-Down Approximation) range of 3.3×10⁻³ g/cm2 in air.
7
EDMS 457017
Results
Measurement results During these measurement series the following detector properties were investigated:
• PMI signal behavior as a function of time. • Signal stability as a function of operation voltage. • Influence of the chamber position inaccuracy on the measurement result. • Counting rates at the various detector positions as a function of the beam
intensity.
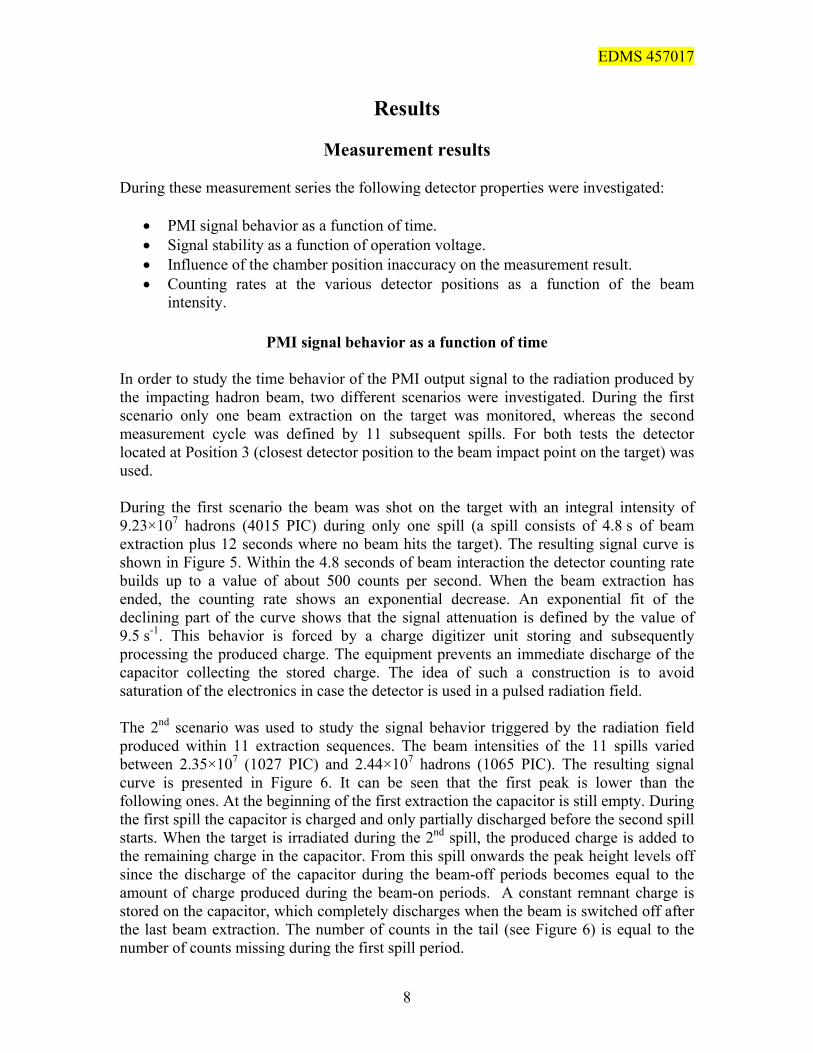
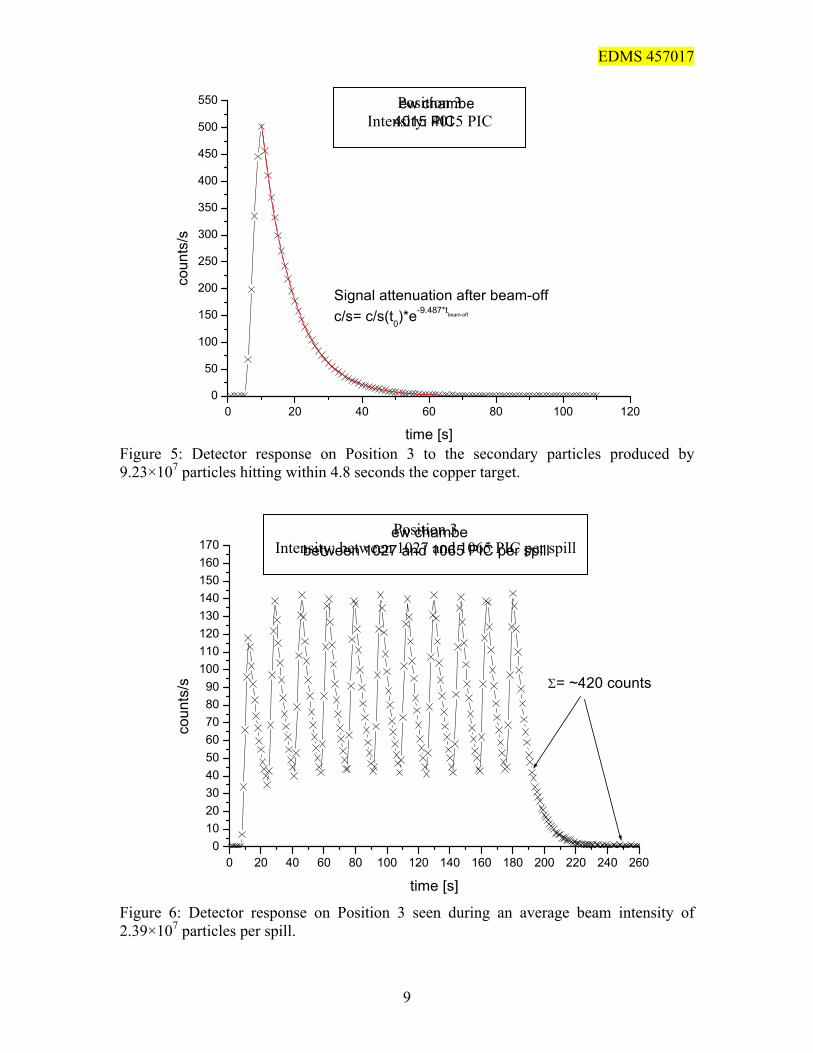
PMI signal behavior as a function of time In order to study the time behavior of the PMI output signal to the radiation produced by the impacting hadron beam, two different scenarios were investigated. During the first scenario only one beam extraction on the target was monitored, whereas the second measurement cycle was defined by 11 subsequent spills. For both tests the detector located at Position 3 (closest detector position to the beam impact point on the target) was used. During the first scenario the beam was shot on the target with an integral intensity of 9.23×10⁷ hadrons (4015 PIC) during only one spill (a spill consists of 4.8 s of beam extraction plus 12 seconds where no beam hits the target). The resulting signal curve is shown in Figure 5. Within the 4.8 seconds of beam interaction the detector counting rate builds up to a value of about 500 counts per second. When the beam extraction has ended, the counting rate shows an exponential decrease. An exponential fit of the declining part of the curve shows that the signal attenuation is defined by the value of 9.5 s-1. This behavior is forced by a charge digitizer unit storing and subsequently processing the produced charge. The equipment prevents an immediate discharge of the capacitor collecting the stored charge. The idea of such a construction is to avoid saturation of the electronics in case the detector is used in a pulsed radiation field. The 2nd scenario was used to study the signal behavior triggered by the radiation field produced within 11 extraction sequences. The beam intensities of the 11 spills varied between 2.35×10⁷ (1027 PIC) and 2.44×10⁷ hadrons (1065 PIC). The resulting signal curve is presented in Figure 6. It can be seen that the first peak is lower than the following ones. At the beginning of the first extraction the capacitor is still empty. During the first spill the capacitor is charged and only partially discharged before the second spill starts. When the target is irradiated during the 2nd spill, the produced charge is added to the remaining charge in the capacitor. From this spill onwards the peak height levels off since the discharge of the capacitor during the beam-off periods becomes equal to the amount of charge produced during the beam-on periods. A constant remnant charge is stored on the capacitor, which completely discharges when the beam is switched off after the last beam extraction. The number of counts in the tail (see Figure 6) is equal to the number of counts missing during the first spill period.
8
EDMS 457017
0 20 40 60 80 100 1200
50
100
150
200
250
300
350
400
450
500
550
Signal attenuation after beam-offc/s= c/s(t0)*e
-9.487*tbeam-off
coun
ts/s
time [s]
Pos 3 n r type
ew chambe 4015 PIC
Position 3 Intensity: 4015 PIC
Figure 5: Detector response on Position 3 to the secondary particles produced by 9.23×10⁷ particles hitting within 4.8 seconds the copper target.
0 20 40 60 80 100 120 140 160 180 200 220 240 2600
102030405060708090
100110120130140150160170
Σ= ~420 counts
coun
ts/s
time [s]
Pos 3 n r typeew chambebetween 1027 and 1065 PIC per spill
Position 3 Intensity: between 1027 and 1065 PIC per spill
Figure 6: Detector response on Position 3 seen during an average beam intensity of 2.39×10⁷ particles per spill.
9
EDMS 457017
10
Signal stability as a function of operation voltage.
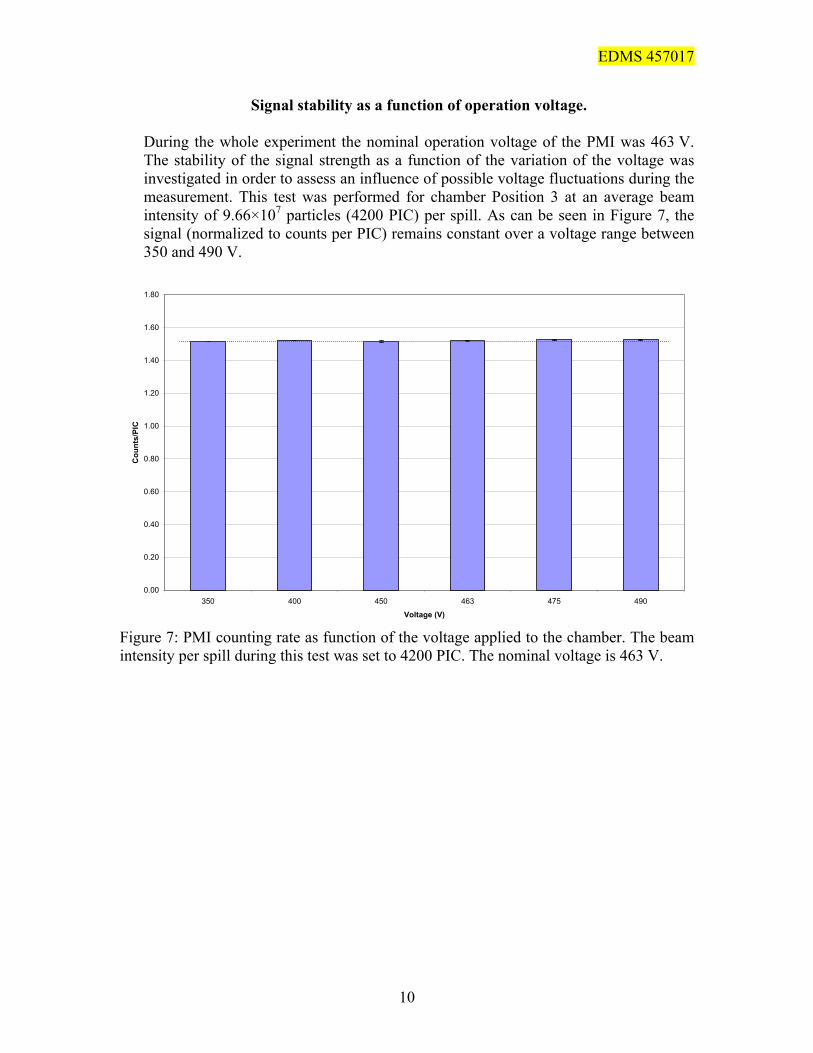
During the whole experiment the nominal operation voltage of the PMI was 463 V. The stability of the signal strength as a function of the variation of the voltage was investigated in order to assess an influence of possible voltage fluctuations during the measurement. This test was performed for chamber Position 3 at an average beam intensity of 9.66×10⁷ particles (4200 PIC) per spill. As can be seen in Figure 7, the signal (normalized to counts per PIC) remains constant over a voltage range between 350 and 490 V.
0.00
0.20
0.40
0.60
0.80
1.00
1.20
1.40
1.60
1.80
350 400 450 463 475 490
Voltage (V)
Cou
nts/
PIC
Figure 7: PMI counting rate as function of the voltage applied to the chamber. The beam intensity per spill during this test was set to 4200 PIC. The nominal voltage is 463 V.
EDMS 457017
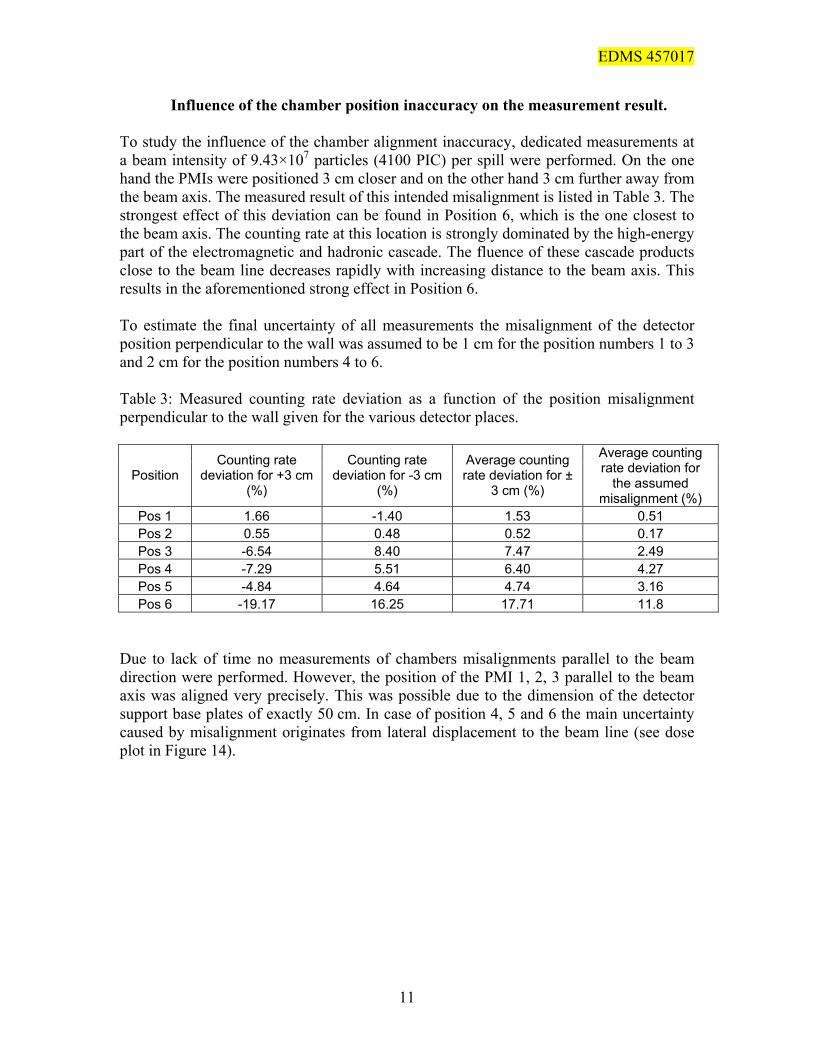
Influence of the chamber position inaccuracy on the measurement result. To study the influence of the chamber alignment inaccuracy, dedicated measurements at a beam intensity of 9.43×10⁷ particles (4100 PIC) per spill were performed. On the one hand the PMIs were positioned 3 cm closer and on the other hand 3 cm further away from the beam axis. The measured result of this intended misalignment is listed in Table 3. The strongest effect of this deviation can be found in Position 6, which is the one closest to the beam axis. The counting rate at this location is strongly dominated by the high-energy part of the electromagnetic and hadronic cascade. The fluence of these cascade products close to the beam line decreases rapidly with increasing distance to the beam axis. This results in the aforementioned strong effect in Position 6. To estimate the final uncertainty of all measurements the misalignment of the detector position perpendicular to the wall was assumed to be 1 cm for the position numbers 1 to 3 and 2 cm for the position numbers 4 to 6. Table 3: Measured counting rate deviation as a function of the position misalignment perpendicular to the wall given for the various detector places.
Position Counting rate
deviation for +3 cm (%)
Counting rate deviation for -3 cm
(%)
Average counting rate deviation for ±
3 cm (%)
Average counting rate deviation for
the assumed misalignment (%)
Pos 1 1.66 -1.40 1.53 0.51 Pos 2 0.55 0.48 0.52 0.17 Pos 3 -6.54 8.40 7.47 2.49 Pos 4 -7.29 5.51 6.40 4.27 Pos 5 -4.84 4.64 4.74 3.16 Pos 6 -19.17 16.25 17.71 11.8
Due to lack of time no measurements of chambers misalignments parallel to the beam direction were performed. However, the position of the PMI 1, 2, 3 parallel to the beam axis was aligned very precisely. This was possible due to the dimension of the detector support base plates of exactly 50 cm. In case of position 4, 5 and 6 the main uncertainty caused by misalignment originates from lateral displacement to the beam line (see dose plot in Figure 14).
11
EDMS 457017
Measurements at various beam intensities
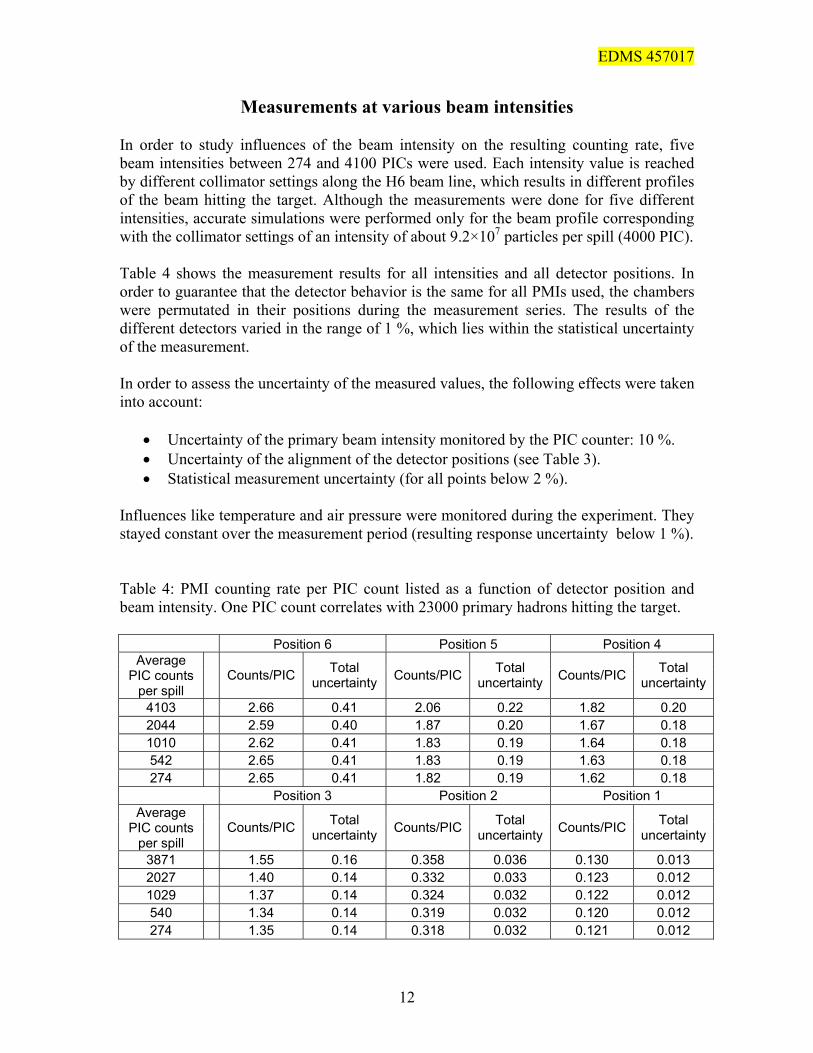
In order to study influences of the beam intensity on the resulting counting rate, five beam intensities between 274 and 4100 PICs were used. Each intensity value is reached by different collimator settings along the H6 beam line, which results in different profiles of the beam hitting the target. Although the measurements were done for five different intensities, accurate simulations were performed only for the beam profile corresponding with the collimator settings of an intensity of about 9.2×10⁷ particles per spill (4000 PIC). Table 4 shows the measurement results for all intensities and all detector positions. In order to guarantee that the detector behavior is the same for all PMIs used, the chambers were permutated in their positions during the measurement series. The results of the different detectors varied in the range of 1 %, which lies within the statistical uncertainty of the measurement. In order to assess the uncertainty of the measured values, the following effects were taken into account:
• Uncertainty of the primary beam intensity monitored by the PIC counter: 10 %. • Uncertainty of the alignment of the detector positions (see Table 3). • Statistical measurement uncertainty (for all points below 2 %).
Influences like temperature and air pressure were monitored during the experiment. They stayed constant over the measurement period (resulting response uncertainty below 1 %). Table 4: PMI counting rate per PIC count listed as a function of detector position and beam intensity. One PIC count correlates with 23000 primary hadrons hitting the target. Position 6 Position 5 Position 4
Average PIC counts
per spill Counts/PIC Total
uncertainty Counts/PIC Total uncertainty Counts/PIC Total
uncertainty
4103 2.66 0.41 2.06 0.22 1.82 0.20 2044 2.59 0.40 1.87 0.20 1.67 0.18 1010 2.62 0.41 1.83 0.19 1.64 0.18 542 2.65 0.41 1.83 0.19 1.63 0.18 274 2.65 0.41 1.82 0.19 1.62 0.18
Position 3 Position 2 Position 1 Average
PIC counts per spill
Counts/PIC Total uncertainty Counts/PIC Total
uncertainty Counts/PIC Total uncertainty
3871 1.55 0.16 0.358 0.036 0.130 0.013 2027 1.40 0.14 0.332 0.033 0.123 0.012 1029 1.37 0.14 0.324 0.032 0.122 0.012 540 1.34 0.14 0.319 0.032 0.120 0.012 274 1.35 0.14 0.318 0.032 0.121 0.012
12
EDMS 457017
Except Position 6, all detector positions show the behavior that the PMI counting rate per PIC is always between 5 and 10 % higher for a beam intensity of 4000 PIC than for all other beam intensities. This diversion is not fully understood yet but one of the reasons might be found in the different beam shapes which are correlated with the various beam intensity values. The beam profile at an intensity of 4000 PIC is exceptional large, which implies that many incoming hadrons hit the target close to its lateral surface. The correlation between that and the increased counting rate at the lateral positions can be explained by the different attenuations of the electromagnetic cascades inside the target. An important characterization value of the development of the electromagnetic cascade and its energy attenuation is the Radiation Length. This value is 1.43 cm in case of copper. The lateral attenuation of the EM cascade is varying for the different beam profiles since the primary particles travel different distances to the outer surface of the cylinder. For the highest beam intensity more particles are close to the lateral target surface which causes a lower EM cascade attenuation especially towards the detector Positions 3 to 5. In case of Position 6 the electromagnetic part of the cascade hitting the detector traverses mainly through the end face of the cylinder. Therefore, the lateral distribution of the incoming particles does not influence the cascade attenuation towards this detector position. In case of Position 1 (showing diversion of only 5 %) the main part of the EM particles reaching the detector traverses through the front face of the target. Therefore, this influence can be found slightly reduced compared to position 2 to 5. Although the final measurement uncertainty is higher than the deviation found between the various intensities, this effect should be further investigated.
13
EDMS 457017
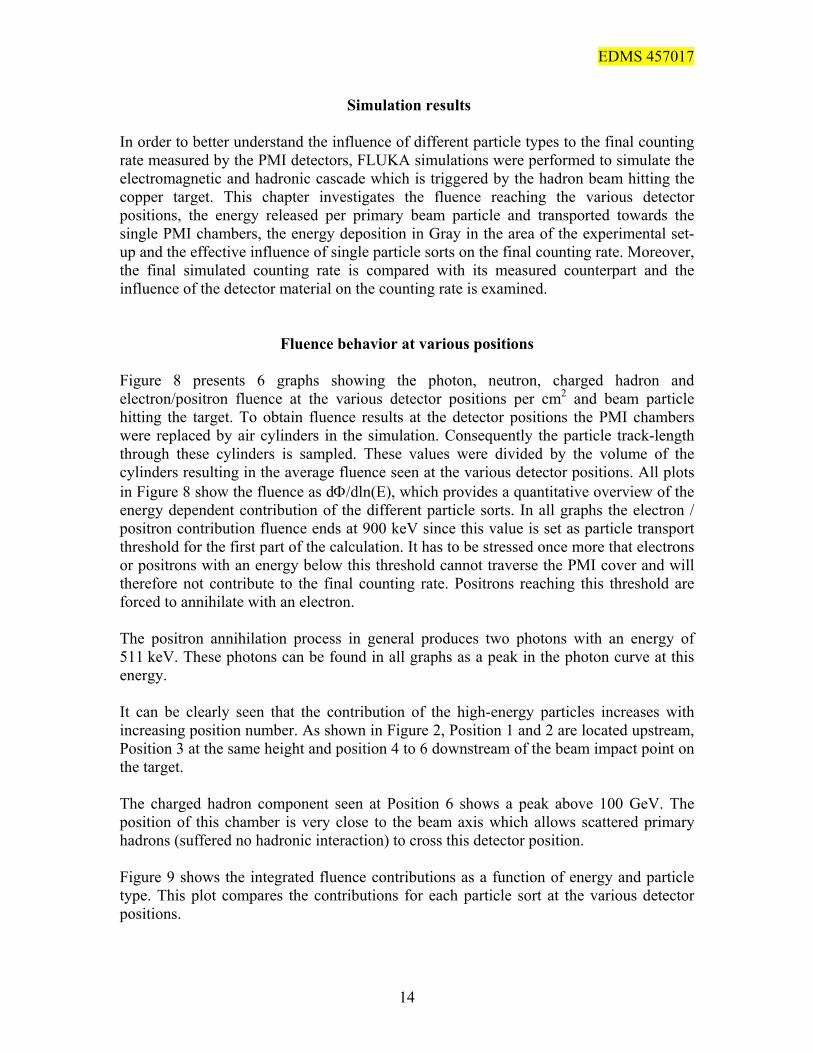
Simulation results
In order to better understand the influence of different particle types to the final counting rate measured by the PMI detectors, FLUKA simulations were performed to simulate the electromagnetic and hadronic cascade which is triggered by the hadron beam hitting the copper target. This chapter investigates the fluence reaching the various detector positions, the energy released per primary beam particle and transported towards the single PMI chambers, the energy deposition in Gray in the area of the experimental set-up and the effective influence of single particle sorts on the final counting rate. Moreover, the final simulated counting rate is compared with its measured counterpart and the influence of the detector material on the counting rate is examined.
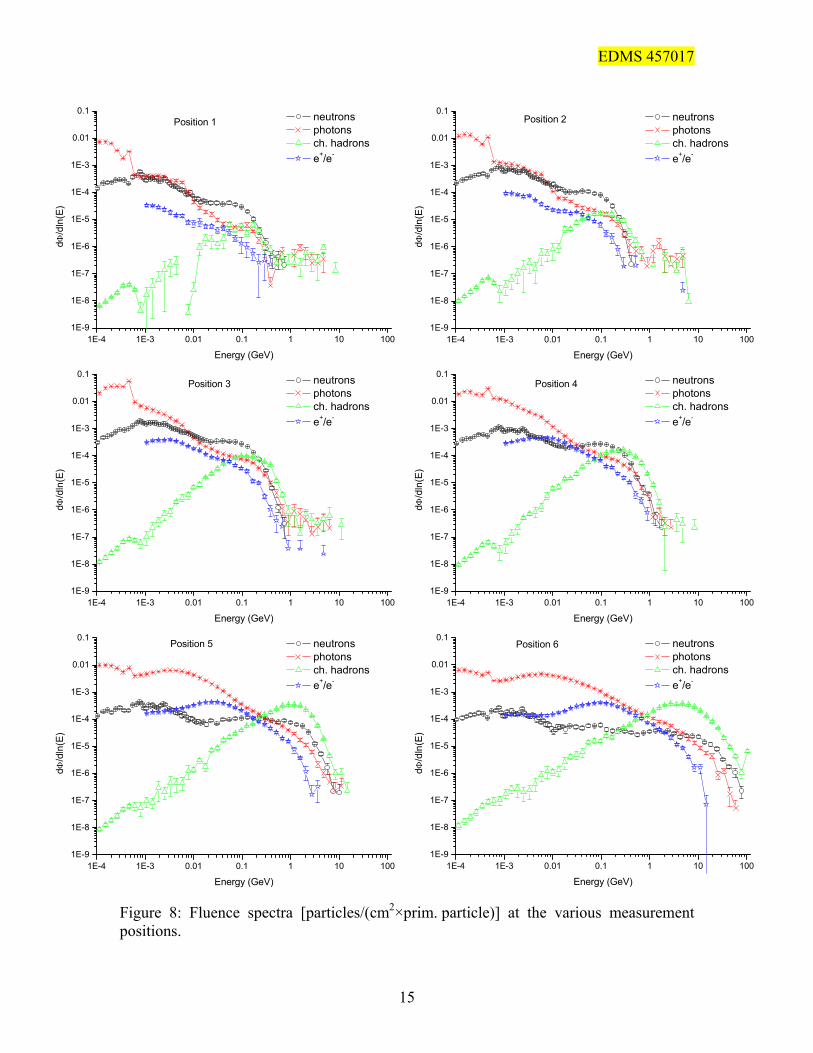
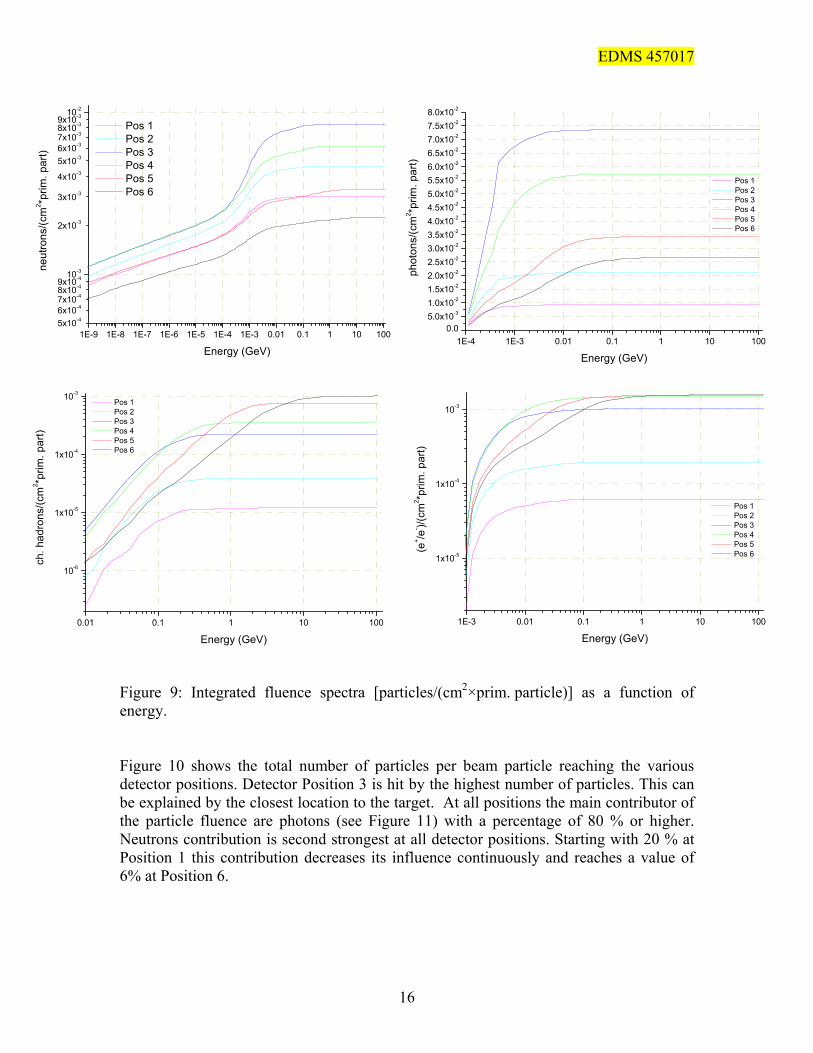
Fluence behavior at various positions Figure 8 presents 6 graphs showing the photon, neutron, charged hadron and electron/positron fluence at the various detector positions per cm2 and beam particle hitting the target. To obtain fluence results at the detector positions the PMI chambers were replaced by air cylinders in the simulation. Consequently the particle track-length through these cylinders is sampled. These values were divided by the volume of the cylinders resulting in the average fluence seen at the various detector positions. All plots in Figure 8 show the fluence as dΦ/dln(E), which provides a quantitative overview of the energy dependent contribution of the different particle sorts. In all graphs the electron / positron contribution fluence ends at 900 keV since this value is set as particle transport threshold for the first part of the calculation. It has to be stressed once more that electrons or positrons with an energy below this threshold cannot traverse the PMI cover and will therefore not contribute to the final counting rate. Positrons reaching this threshold are forced to annihilate with an electron. The positron annihilation process in general produces two photons with an energy of 511 keV. These photons can be found in all graphs as a peak in the photon curve at this energy. It can be clearly seen that the contribution of the high-energy particles increases with increasing position number. As shown in Figure 2, Position 1 and 2 are located upstream, Position 3 at the same height and position 4 to 6 downstream of the beam impact point on the target. The charged hadron component seen at Position 6 shows a peak above 100 GeV. The position of this chamber is very close to the beam axis which allows scattered primary hadrons (suffered no hadronic interaction) to cross this detector position. Figure 9 shows the integrated fluence contributions as a function of energy and particle type. This plot compares the contributions for each particle sort at the various detector positions.
14
EDMS 457017
15
1E-4 1E-3 0.01 0.1 1 10 1001E-9
1E-8
1E-7
1E-6
1E-5
1E-4
1E-3
0.01
0.1Position 1 neutrons
photons ch. hadrons e+/e-
dΦ/d
ln(E
)
Energy (GeV)
0.1
1E-4 1E-3 0.01 0.1 1 10 1001E-9
1E-8
1E-7
1E-6
1E-5
1E-4
1E-3
0.01
Position 3 neutrons photons ch. hadrons e+/e-
dΦ/d
ln(E
)
Energy (GeV)
0.1
1E-4 1E-3 0.01 0.1 1 10 1001E-9
1E-8
1E-7
1E-6
1E-5
1E-4
1E-3
0.01
Position 5 neutrons photons ch. hadrons e+/e-
dΦ/d
ln(E
)
Energy (GeV)
1E-4 1E-3 0.01 0.1 1 10 1001E-9
1E-8
1E-7
1E-6
1E-5
1E-4
1E-3
0.01
0.1Position 2 neutrons
photons ch. hadrons e+/e-
dΦ/d
ln(E
)
Energy (GeV)
0.1
1E-4 1E-3 0.01 0.1 1 10 1001E-9
1E-8
1E-7
1E-6
1E-5
1E-4
1E-3
0.01
Position 4 neutrons photons ch. hadrons e+/e-
dΦ/d
ln(E
)
Energy (GeV)
0.1
1E-4 1E-3 0.01 0.1 1 10 1001E-9
1E-8
1E-7
1E-6
1E-5
1E-4
1E-3
0.01
Position 6 neutrons photons ch. hadrons e+/e-
dΦ/d
ln(E
)
Energy (GeV)
Figure 8: Fluence spectra [particles/(cm2×prim. particle)] at the various measurement positions.
EDMS 457017
Pos Pos
Pos Pos Pos
Pos
1E-9 1E-8 1E-7 1E-6 1E-5 1E-4 1E-3 0.01 0.1 1 10 1005x10-46x10-47x10-48x10-49x10-410-3
2x10⁻³
3x10⁻³
4x10⁻³
5x10-36x10-37x10-38x10-39x10-310-2
123456
neut
rons
/(cm
2 *prim
. par
t)
Energy (GeV)1E-4 1E-3 0.01 0.1 1 10 100
0.05.0x10-31.0x10-21.5x10-22.0x10-22.5x10-23.0x10-23.5x10-24.0x10-24.5x10-25.0x10-25.5x10-26.0x10-26.5x10-27.0x10-27.5x10-28.0x10⁻²
Pos 1 Pos 2 Pos 3 Pos 4 Pos 5 Pos 6
phot
ons/
(cm
2 *prim
. par
t)
Energy (GeV)
Figure 9: Integrated fluence spectra [particles/(cm2×prim. particle)] as a function of energy.
0.01 0.1 1 10 100
10-6
1x10⁻⁵
1x10⁻⁴
10-3
Pos 1 Pos 2 Pos 3 Pos 4 Pos 5 Pos 6
ch. h
adro
ns/(c
m2 *p
rim. p
art)
Energy (GeV)
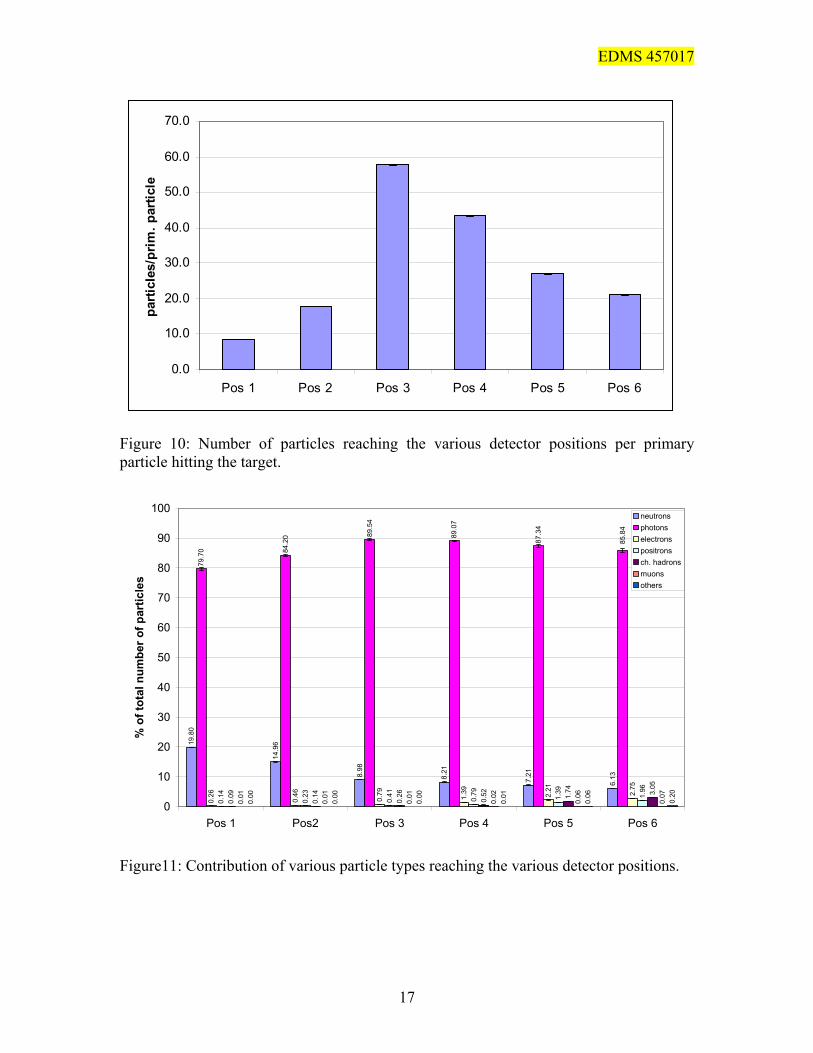
Figure 10 shows the total number of particles per beam particle reaching the various detector positions. Detector Position 3 is hit by the highest number of particles. This can be explained by the closest location to the target. At all positions the main contributor of the particle fluence are photons (see Figure 11) with a percentage of 80 % or higher. Neutrons contribution is second strongest at all detector positions. Starting with 20 % at Position 1 this contribution decreases its influence continuously and reaches a value of 6% at Position 6.
1E-3 0.01 0.1 1 10 100
1x10⁻⁵
1x10⁻⁴
10-3
Pos 1 Pos 2 Pos 3 Pos 4 Pos 5 Pos 6(e
+ /e- )/(
cm2 *p
rim. p
art)
Energy (GeV)
16
EDMS 457017
0.0
10.0
20.0
30.0
40.0
50.0
60.0
70.0
Pos 1 Pos 2 Pos 3 Pos 4 Pos 5 Pos 6
parti
cles
/prim
. par
ticle
Figure 10: Number of particles reaching the various detector positions per primary particle hitting the target.
19.8
0
14.9
6
8.98
8.21
7.21
6.13
79.7
0 84.2
0 89.5
4
89.0
7
87.3
4
0.26
0.46
0.79 1.39 2.21 2.75
0.14
0.23
0.41 0.79 1.39 1.96
0.09
0.14
0.26
0.52 1.74 3.05
0.01
0.01
0.01
0.02
0.06
0.07
0.00
0.00
0.00
0.01
0.06
0.20
85.8
4
0
10
20
30
40
50
60
70
80
90
100
Pos 1 Pos2 Pos 3 Pos 4 Pos 5 Pos 6
% o
f tot
al n
umbe
r of p
artic
les
neutronsphotonselectronspositronsch. hadronsmuonsothers
Figure11: Contribution of various particle types reaching the various detector positions.
17
EDMS 457017
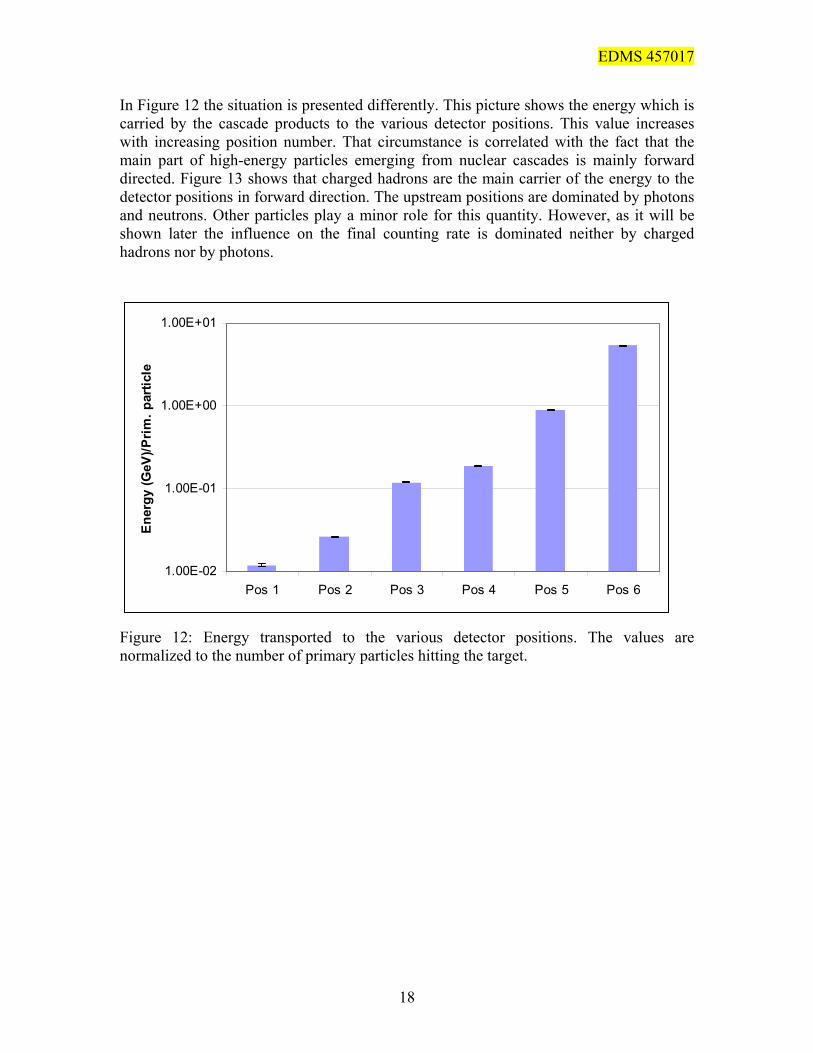
In Figure 12 the situation is presented differently. This picture shows the energy which is carried by the cascade products to the various detector positions. This value increases with increasing position number. That circumstance is correlated with the fact that the main part of high-energy particles emerging from nuclear cascades is mainly forward directed. Figure 13 shows that charged hadrons are the main carrier of the energy to the detector positions in forward direction. The upstream positions are dominated by photons and neutrons. Other particles play a minor role for this quantity. However, as it will be shown later the influence on the final counting rate is dominated neither by charged hadrons nor by photons.
1.00E-02
1.00E-01
1.00E+00
1.00E+01
Pos 1 Pos 2 Pos 3 Pos 4 Pos 5 Pos 6
Ener
gy (G
eV)/P
rim. p
artic
le
Figure 12: Energy transported to the various detector positions. The values are normalized to the number of primary particles hitting the target.
18
EDMS 457017
37.5
5
28.2
9
14.4
0
7.21
36.6
9
35.1
4
31.9
1
19.0
0
10.2
3
1.56 2.
73 3.59 4.63
2.88
1.83
1.48 2.18 3.10 4.12
2.59
1.69
30.0
1
1.15
0.60
0.59
0.61 1.03
0.40
0.02
0.05
0.30
0.42 2.
87 5.57
37.6
0
45.6
1
36.9
5
12.1
3
21.2
3
19.7
2
73.0
8
57.2
2
0
10
20
30
40
50
60
70
80
Pos 1 Pos2 Pos 3 Pos 4 Pos 5 Pos 6
% o
f tot
al p
artic
le e
nerg
yneutronsphotonselectronspositronsch. hadronsmuonsothers
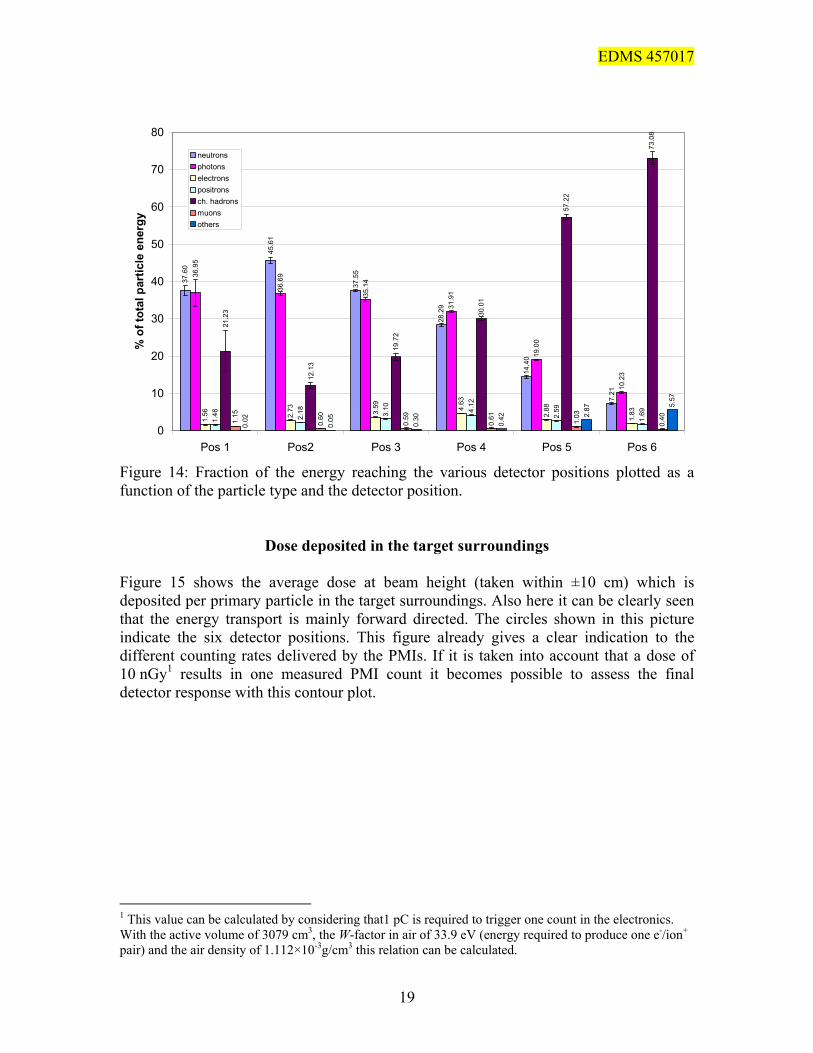
Figure 14: Fraction of the energy reaching the various detector positions plotted as a function of the particle type and the detector position.
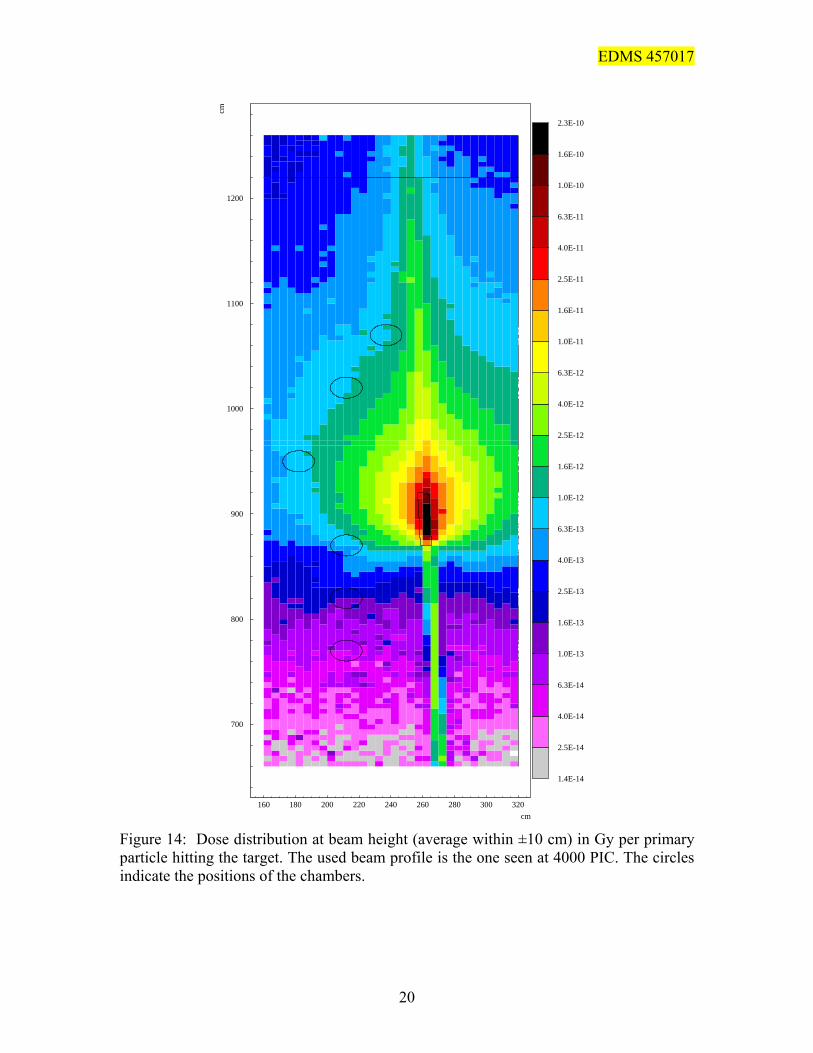
Dose deposited in the target surroundings Figure 15 shows the average dose at beam height (taken within ±10 cm) which is deposited per primary particle in the target surroundings. Also here it can be clearly seen that the energy transport is mainly forward directed. The circles shown in this picture indicate the six detector positions. This figure already gives a clear indication to the different counting rates delivered by the PMIs. If it is taken into account that a dose of 10 nGy1 results in one measured PMI count it becomes possible to assess the final detector response with this contour plot.
1
3 - +
-3 3
This value can be calculated by considering that1 pC is required to trigger one count in the electronics. With the active volume of 3079 cm , the W-factor in air of 33.9 eV (energy required to produce one e /ion pair) and the air density of 1.112×10 g/cm this relation can be calculated.
19
700
800
900
1000
1100
1200
160 180 200 220 240 260 280 300 320
cm
cm
1.4E-14
2.5E-14
4.0E-14
6.3E-14
1.0E-13
1.6E-13
2.5E-13
4.0E-13
6.3E-13
1.0E-12
1.6E-12
2.5E-12
4.0E-12
6.3E-12
1.0E-11
1.6E-11
2.5E-11
4.0E-11
6.3E-11
1.0E-10
1.6E-10
2.3E-10
EDMS 457017
20
Figure 14: Dose distribution at beam height (average within ±10 cm) in Gy per primary particle hitting the target. The used beam profile is the one seen at 4000 PIC. The circles indicate the positions of the chambers.

EDMS 457017
Comparison between the simulated and the measured counting rate at a beam intensity of 4000 PIC
In order to evaluate the capability of the Monte Carlo code FLUKA to predict the PMI detector response in a mixed particle field, the measured scenario at a beam intensity of 4000 PIC was simulated. The results of these simulations and the comparison with their measured counterparts are listed in Table 5. The simulation uncertainty is of statistical nature and given as standard deviation (1 σ) of the mean of results of the same simulation started with different random seed numbers. As it can be seen, the simulation and the measurement agree for all six detector positions within the uncertainty. Table 5: Comparison between simulated and measured detector response. One PIC count correlates with 23000 primary hadrons hitting the target.
Position Simulation Counts/PIC
Simulation uncertainty
Measurement Counts/PIC
Measure-ment
uncertainty
Simulation/ Measurement
Uncert-ainty
Pos 1 0.130 ± 0.003 0.130 ± 0.013 0.998 ± 0.102 Pos 2 0.369 ± 0.010 0.358 ± 0.036 1.031 ± 0.107 Pos 3 1.552 ± 0.017 1.547 ± 0.159 1.003 ± 0.104 Pos 4 1.963 ± 0.015 1.817 ± 0.199 1.080 ± 0.119 Pos 5 2.213 ± 0.029 2.056 ± 0.218 1.076 ± 0.115 Pos 6 2.491 ± 0.019 2.662 ± 0.414 0.936 ± 0.146
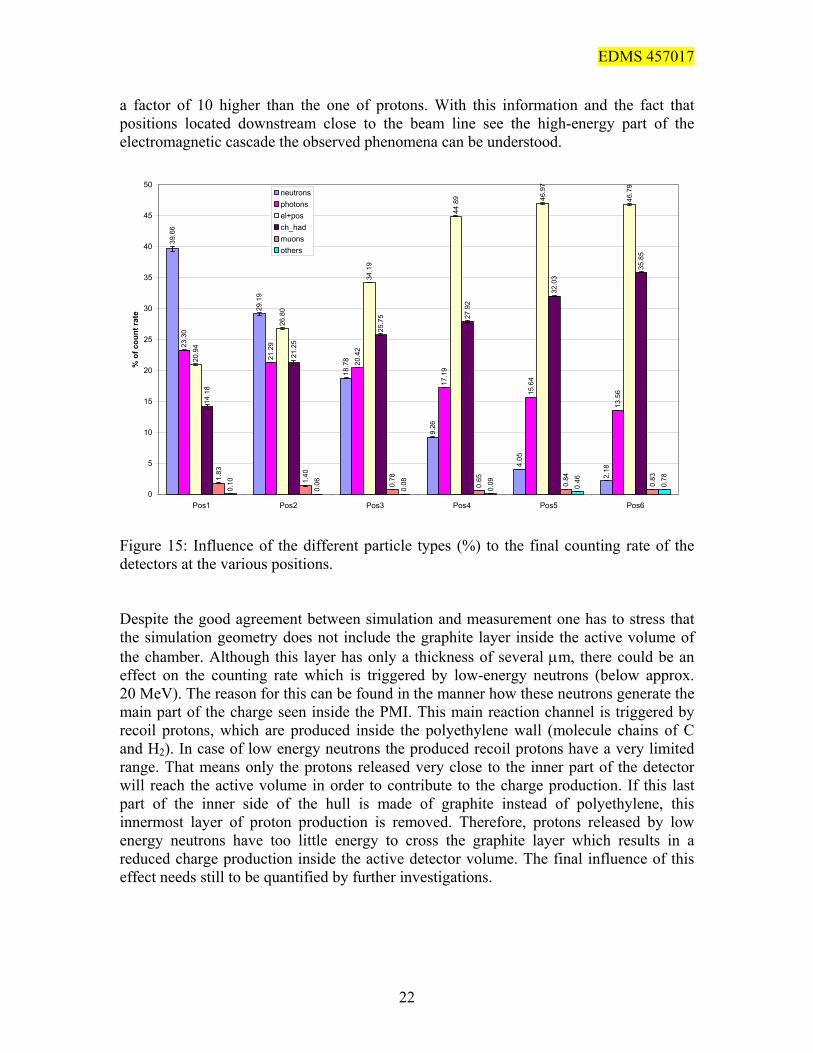
Figure 15 shows an analysis of the PMI response to the various particle components of the radiation field at the six detector positions. Before analyzing this picture one should keep in mind that detector locations with higher position numbers are located further downstream than locations with lower position numbers (see Figure 2). At Position 1 neutrons dominate the counting rate triggered in the detector. The neutron contribution to the total charge released in the active volume decreases continuously with increasing position number from about 40 % to 2 %. Also the relative influence of photons lowers with increasing position number. On contrary to this behavior charged hadrons and electrons/positrons increase their contribution to the final counting rate with increasing position number. The electron/positron component is the main contributor at Position 3, 4, 5 and 6. Except for the electron/positron component the contribution of the single particle types to the final counting rate correlates with the rate of the energy transported by the various particles types (compare Figure 13 with Figure 15). The reason for the fact that the electron/positron component becomes so important at locations downstream the target position can be explained by the energy loss behavior of high-energy electrons and positrons. Above an energy of 100 MeV the energy loss per g/cm2 of electrons in air becomes higher than the one of protons. At 1 GeV the energy loss of electrons is already
21
EDMS 457017
a factor of 10 higher than the one of protons. With this information and the fact that positions located downstream close to the beam line see the high-energy part of the electromagnetic cascade the observed phenomena can be understood.
29.1
9
18.7
8
9.26
4.05
2.18
23.3
0
21.2
9
20.4
2
17.1
9
15.6
4
13.5
6
20.9
4
26.8
0
34.1
9
44.8
9 46.9
7
46.7
9
14.1
8
25.7
5 27.9
2
32.0
3
35.8
5
1.83
1.40
0.78
0.65 0.84
0.83
0.10
0.06
0.08
0.09 0.46 0.78
39.6
6
21.2
5
0
5
10
15
20
25
30
35
40
45
50
Pos1 Pos2 Pos3 Pos4 Pos5 Pos6
% o
f cou
nt ra
te
neutronsphotonsel+posch_hadmuonsothers
Figure 15: Influence of the different particle types (%) to the final counting rate of the detectors at the various positions. Despite the good agreement between simulation and measurement one has to stress that the simulation geometry does not include the graphite layer inside the active volume of the chamber. Although this layer has only a thickness of several µm, there could be an effect on the counting rate which is triggered by low-energy neutrons (below approx. 20 MeV). The reason for this can be found in the manner how these neutrons generate the main part of the charge seen inside the PMI. This main reaction channel is triggered by recoil protons, which are produced inside the polyethylene wall (molecule chains of C and H2). In case of low energy neutrons the produced recoil protons have a very limited range. That means only the protons released very close to the inner part of the detector will reach the active volume in order to contribute to the charge production. If this last part of the inner side of the hull is made of graphite instead of polyethylene, this innermost layer of proton production is removed. Therefore, protons released by low energy neutrons have too little energy to cross the graphite layer which results in a reduced charge production inside the active detector volume. The final influence of this effect needs still to be quantified by further investigations.
22
EDMS 457017
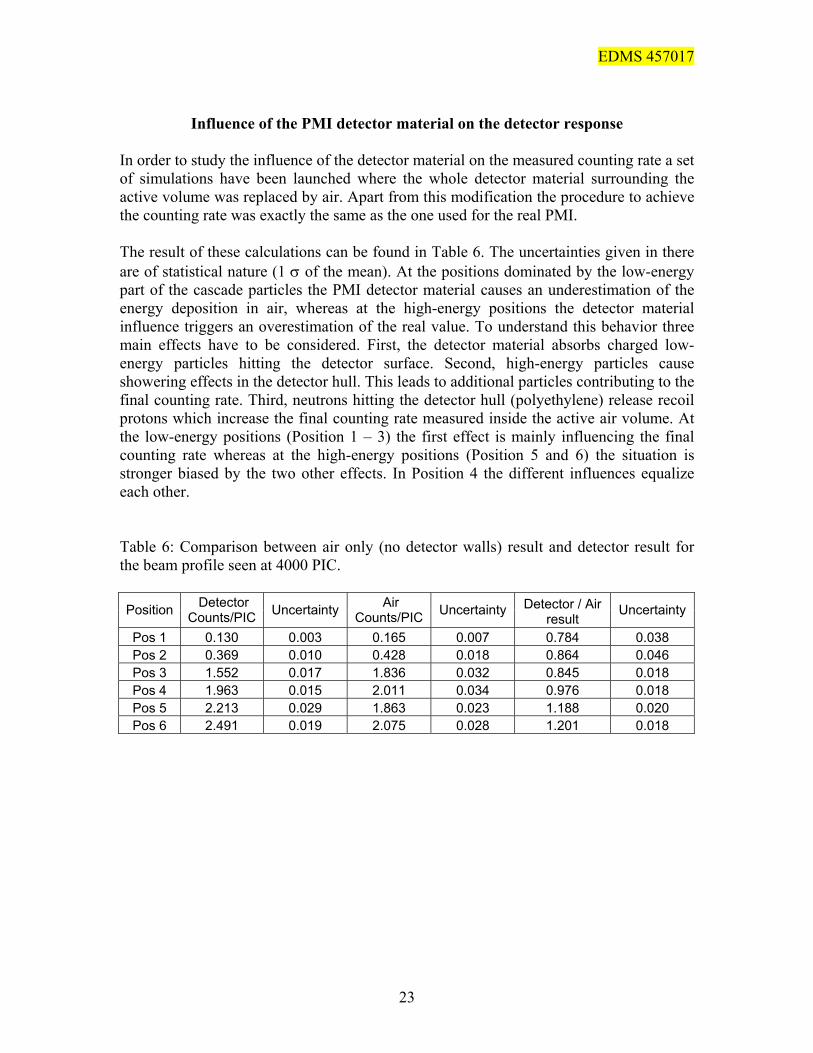
Influence of the PMI detector material on the detector response
In order to study the influence of the detector material on the measured counting rate a set of simulations have been launched where the whole detector material surrounding the active volume was replaced by air. Apart from this modification the procedure to achieve the counting rate was exactly the same as the one used for the real PMI. The result of these calculations can be found in Table 6. The uncertainties given in there are of statistical nature (1 σ of the mean). At the positions dominated by the low-energy part of the cascade particles the PMI detector material causes an underestimation of the energy deposition in air, whereas at the high-energy positions the detector material influence triggers an overestimation of the real value. To understand this behavior three main effects have to be considered. First, the detector material absorbs charged low-energy particles hitting the detector surface. Second, high-energy particles cause showering effects in the detector hull. This leads to additional particles contributing to the final counting rate. Third, neutrons hitting the detector hull (polyethylene) release recoil protons which increase the final counting rate measured inside the active air volume. At the low-energy positions (Position 1 – 3) the first effect is mainly influencing the final counting rate whereas at the high-energy positions (Position 5 and 6) the situation is stronger biased by the two other effects. In Position 4 the different influences equalize each other. Table 6: Comparison between air only (no detector walls) result and detector result for the beam profile seen at 4000 PIC. Position Detector
Counts/PIC Uncertainty Air Counts/PIC Uncertainty Detector / Air
result Uncertainty
Pos 1 0.130 0.003 0.165 0.007 0.784 0.038 Pos 2 0.369 0.010 0.428 0.018 0.864 0.046 Pos 3 1.552 0.017 1.836 0.032 0.845 0.018 Pos 4 1.963 0.015 2.011 0.034 0.976 0.018 Pos 5 2.213 0.029 1.863 0.023 1.188 0.020 Pos 6 2.491 0.019 2.075 0.028 1.201 0.018
23
EDMS 457017
Conclusion and outlook In order to understand the PMI chambers response to a mixed high-energy radiation field, measurements at six positions in the CERF target area at CERN were performed. These measurements were accomplished by FLUKA simulations used to analyze the different fluence contributions to the radiation field and to the detector response behavior. The measurements showed that the PMI detector response is very slow. This effect is caused by the electronics consisting mainly of a charge digitizer working in a way which allows buffering of sudden high charge productions without saturating electronics components. The detector response showed equivalent results within an operation voltage range between 350 and 490 V. The simulation analysis showed that the total number of particles reaching the detectors increases from Position 1 to 3 followed by a continuous decrease up to Position 6. At all detector locations the particle fluence is clearly dominated by photons. The energy transported towards the various detector positions increases with increasing position number (detectors with higher position numbers are located further downstream). This value is dominated by neutrons at positions located upstream the target and by charged hadrons at positions downstream the target. Between Position 3 and 6 electrons and positrons clearly dominate the detector response. At the two upstream positions neutrons are the main contributor to the final counting rate. Comparisons between the simulation and the measurement show at all six positions very good agreement. The influence of the detector hull on the energy deposition could be found in the range of ±20 %. Despite the good agreement between simulation and measurement the reliability of FLUKA to predict the PMI detector response to low energy neutrons should be investigated by the use of neutron sources below 20 MeV. In the pertinent calculations also the thin graphite layer enclosing the active volume has to be implemented in order to take into account possible recoil proton absorptions.
24
EDMS 457017
25
References
[Eft02] I. Efthymiopoulos, A. Mitaroff, M. Silari, Efficiency measurements of the
trigger 4 beam monitor in H6, CERN Technical Note TIS-RP-2002-027-RP-TN (2002).
[Fas01a] A. Fassò, A. Ferrari, P. R. Sala, Electron-photon transport in FLUKA: status,
invited talk in the Proceedings of the Monte Carlo 2000 Conference, Lisbon, October 23--26 2000, A. Kling, F. Barao, M. Nakagawa, L. Tavora, P. Vaz eds., Springer-Verlag Berlin, p. 159-164 (2001).
[Fas01b] A. Fassò, A. Ferrari, J. Ranft and P. R. Sala, FLUKA: Status and Prospective for
Hadronic Applications, invited talk in the Proceedings of the Monte Carlo 2000 Conference, Lisbon, October 23--26 2000, A. Kling, F. Barao, M. Nakagawa, L. Tavora, P. Vaz eds., Springer-Verlag Berlin, p. 955-960 (2001).
[ICR79] International Commission on Radiation Units and Measurements, Average
Energy Required To Produce An Ion Pair, ICRU Report 31, Washington D.C. (1979).
[Mit02] A. Mitaroff, M. Silari, The CERN-EU high-energy Reference Field (CERF) facility for dosimetry at commercial flight altitudes and in space, Radiation Protection Dosimetry 102, p. 7-22 (2002).