Embed Size (px)
Citation preview
Measurements of the thermal, dielectric, piezoelectric, pyroelectric and elastic properties of
porous PZT samples
Sidney B. Lang1* and Erling Ringgaard2
1Dept. of Chemical Engineering, Ben-Gurion University of the Negev, 84105 Beer Sheva,
Israel 2Meggitt Sensing Systems, Hejreskovvej 18A, DK-3490 Kvistgård, Denmark
The introduction of porosity into ferroelectric ceramics has been of great interest in recent years.
In particular, studies of porous lead-zirconate-titanate ceramic (PZT) have been made. In the
research reported, samples of Ferroperm Pz27 with porosities of 20, 25 and 30% were studied.
Very complete measurements were made of all of the physical properties relevant for
ferroelectric applications including thermal conductivity and diffusivity, heat capacity, dielectric,
pyroelectric, piezoelectric and elastic properties. Scanning electron micrographs indicated a
change from 3-0 to 3-3 connectivity with increasing porosity. Although most of the physical
properties are degraded by the presence of porosity, both piezoelectric and pyroelectric figures-
of-merit are improved because of the markedly reduced relative permittivity. Porous
ferroelectric ceramics are very promising materials for a number of applications.
*E-mail: [email protected], Fax: +972-8-6472916
1. Introduction
The effect of porosity on the physical properties of ferroelectric ceramics has been of
significant interest in recent years. Because of its technological importance, porous
lead-zirconate-titanate ceramic (PZT) has been studied extensively [1-15]. The porosity
is created by the introduction of organic particles such as polymethyl methacrylate,
methyl ethyl cellulose, camphene, starch, graphite and others. Porous piezoceramics
are relevant for a number of applications due to interesting thermal, dielectric,
pyroelectric, piezoelectric and elastic physical properties. In the case of ultrasonic
transducers (e.g., transducers for medical diagnostics and air transducers), the main
requirements for the piezoelectric material are as follows:[16]
• high electromechanical thickness coupling factor kt and low transverse coupling
factor
• permittivity in a suitable range, depending on the frequency and driving
electronics
• mechanical quality factor Qm as low as possible in order to obtain a large
bandwidth
• acoustic impedance as low as possible for close acoustic matching to the
propagation medium (e.g., Za(water) = 1.5 MRayl, Za(air) = 0.4 kRayl)
Another relevant example is hydrophones, where the most important parameters are
acoustic impedance and hydrostatic figure-of-merit (to be discussed below). The
presence of porosity in piezoceramics is known to reduce the transverse coupling factor
without affecting the thickness coupling severely, and at the same it increases
mechanical damping and thereby reduces Qm. As would be expected, also the acoustic
impedance and permittivity are significantly reduced by the introduction of pores in the
ceramic matrix.
Similarly, for pyroelectric applications, the main requirements are:[10, 11, 13, 17]
• high pyroelectric coefficient
• low dielectric permittivity, especially at low frequencies
• low dielectric loss tangent, especially at low frequencies

We studied samples of Ferroperm® Pz27 with porosities of 20, 25 and 30%. Pz27 is a
soft piezoelectric ceramic made by Meggitt Sensing Systems, Denmark [18]. Thermal,
dielectric, piezoelectric, pyroelectric and elastic properties were measured. The
samples were examined with a scanning electron microscope. Pyroelectric and
piezoelectric figures-of-merit were calculated for the various materials.
2. Materials
The PZT materials studied were Ferroperm® Pz27, a piezoelectric ceramic with a composition
close to that of the morphotropic phase boundary (MPB) with a Zr/Ti ratio of about 52/48.
They were prepared using conventional ceramic processing techniques but with the addition of
organic particles which were burned out before sintering to yield samples with porosities of 20,
25 and 30%. Fired-on silver electrodes were applied and the samples were poled while
immersed in a non-conducting poling fluid. In addition, a commercial sample of Pz27 was
studied. It had a porosity of about 4% and is referred to in this paper as “dense” material. The
properties were measured on samples that were 16 mm in diameter and 1 mm thick. Scanning
electron micrographs of all of the materials are shown in Fig. 1. Newnham and co-workers
introduced the concept of connectivity in 1978 for classifying two-phase composites [19].
They found that there were ten types of diphasic composites, each identified by a two-digit
notation. The first digit represents the active phase and the second, the inactive phase. The
connectivities of the porous materials shown in Fig. 1 appeared to be a mixture of 3-0 and 3-3
where the active phase was the PZT and the inactive phase was a mixture of poling fluid and
air.
3. Property Measurements
3.1. Thermal Diffusivity and Conductivity
The thermal diffusivities of the samples were measured by a technique [20] that is a
modification of ones originally developed by Lang [21] and Muensit and Lang [22]. The test
sample is affixed by a very thin layer of silver paint to a pyroelectric thermal detector. The top
surface of the test sample is exposed to a laser beam whose intensity is modulated at various
frequencies. The energy of the beam is absorbed in a black absorption layer and the heat
diffuses into the sample in the form of a fluctuating temperature wave superimposed on a
steady-state gradient. The temperature fluctuations or thermal waves are attenuated as they
travel through the sample and they are also retarded in phase. The phase of the thermal waves
as they exit from the test sample is determined relative to the phase of the laser beam by means
of the pyroelectric detector. Because only the phase is determined, both the detector
pyroelectric coefficient and the laser beam intensity cancel out in the analysis and are not
required. The pyroelectric detector was either a disk of dense Pz27 or a disk of porous material
with the same porosity as the test sample. The sample structures were placed in an HFS91
Heating and Freezing Stage (Linkam Scientific Instruments, Ltd., UK) whose temperature was
varied from 213 to 423 K. A Lisa HL25/M1diode laser (Lisa Laser Products, Germany) with a
power of 25 mW and a wavelength of 685 nm was used to heat the samples. A Stanford
Research SR850 Lock-in Amplifier (Stanford Research Systems, USA) produced a sine wave
output voltage to drive the laser modulator and also measured the real and imaginary
components of the pyroelectric current from which the phase lag was calculated. Thermal
conductivity, k, is a more fundamental property than thermal diffusivity, ". The two quantities
are related by / ( )k cα ρ= where ρ is density and c is the heat capacity per unit mass (SI units are
used throughout). Heat capacity data in the range from 1.8 to 400 K were measured using
thermal relaxation calorimetry [23] and from 400 to 423 K using differential scanning
calorimetry (DSC) [20]. Density data were obtained from [24]. The thermal conductivities for
the three porous samples and the dense sample are shown in Fig. 2. The temperature
dependence of the thermal conductivities is weak but the conductivities decrease markedly
with increasing porosity.
3.2. Pyroelectric coefficients
The pyroelectric coefficients were determined at specific temperatures by a combination
of the Lang-Steckel [25] and the Byer-Roundy methods [26] using the following
procedure. The samples were placed in the Heating and Freezing Stage and the stage
temperature was cycled up and down over the range from 293 to 343 K six times at the
rate of 1 K min-1. The pyroelectric current was measured with a picoammeter
(Keithley Model 487, USA). The pyroelectric coefficients were calculated at the
temperatures 300, 310, 320 and 330 K using the following equation
dTI pAdt
= (1)
where I = pyroelectric current, p = pyroelectric coefficient, A = electrode area of the
sample and dT/dt = rate of temperature change. Then the temperature range was
extended from -60 to 150oC by use of the Chynoweth method [27]. In this procedure,
the samples were held at each of the four temperatures and were exposed to radiation
from a 30 mW diode laser beam that was modulated sinusoidally at a frequency of 10
Hz. The pyroelectric current was measured with the lock-in amplifier. The dT/dt was
calculated from the previously determined pyroelectric coefficients using Eqn. (1) and
the four values were averaged. Then the current produced by the laser heating was
measured as the temperature was varied over the entire temperature range. Using the
average dT/dt, the pyroelectric coefficient was determined from -60 to 150oC as shown
in Fig. 3. The pyroelectric coefficients increase with increasing temperature and
decrease strongly with increasing porosity.
3.3. Permittivity and Loss Tangent
The ε33 relative permittivity or dielectric constant and the dielectric loss tan δ were
determined at room temperature on all of the samples using an impedance analyzer
(Agilent 4194A). The frequency range was from 10 Hz to 10 kHz. The relative
permittivity and the loss tangent are shown in Figs. 4 and 5, respectively. The
permittivity varied only slightly over the frequency range with a small increase at very
low frequencies. The permittivity values decreased markedly with increasing sample
porosity. The loss tangents were between 0.01 and 0.02 for all frequencies. They
increased slightly with frequency and decreased slightly with porosity.
3.4 Piezoelectric and Elastic Properties
Complex piezoelectric and elastic properties were determined according to the
procedures of Alguero et al. [28] using thin disk-shaped samples. As described by
Holland [29], the losses occurring in piezoelectric materials may be dielectric, elastic or
piezoelectric and all of these may be represented by extending the various coefficients
into complex ones. This is well known for the dielectric (cf. tan δe above) and elastic
losses, and similarly the phenomenological piezoelectric loss should be understood as
imperfect piezoelectric energy conversion. Thus a piezoelectric loss tangent may be
defined as (with the d coefficient as example) the ratio between the imaginary (loss)
component and the real one: tan δp = d”/d’. Resonances were measured using an
impedance analyzer (Agilent 4194A). The thickness resonances of a disk that was poled
and excited along its thickness were used to determine the c33D elastic stiffness
coefficient, the kt and k31 coupling coefficients. The radial resonances of the same disk
were used to determine the c11D elastic stiffness coefficient, the d31 piezoelectric charge
and g31 voltage coefficients and the kp coupling coefficient. Since only thin disks were
available, the d’33 piezoelectric charge coefficient was measured at 110 Hz using a d33
meter (Sinocera YE2730). The g’33 piezoelectric voltage coefficient was calculated
from 33 33 33Td g ε= . The piezoelectric charge coefficients are shown in Fig. 6. The d31
coefficient decreases with increasing porosity whereas the d33 coefficient is relatively
constant. Rybyanets [15] explained that the decrease in the d31 coefficient was caused
by the disturbance of the quasi-rod skeleton continuity in the lateral direction. On the
other hand, the near constancy of the d33 coefficient resulted because the relative
decrease in the relative surface area of the ceramic phase was compensated by an
increase in the relative pressure applied to the ceramic skeleton. The planar Poisson's
ratio (σ) varies only slightly with porosity (Fig. 7). The kp and k31 coupling coefficients
shown in Fig. 7 decrease with porosity but the kt coefficient remains constant. The kp
and k31 coupling coefficients are related to the Poisson's ratio by the equation [30]:
1/2
312where
1pk a k aσ
⎛ ⎞= =⎜ ⎟−⎝ ⎠
(2)
The experimental data were in excellent agreement with this equation. The Poisson's
ratio has a negligibly small imaginary part and therefore can be considered as a real
number. We now expand tan δ(kp) and insert Eqn. (2) obtaining the third term in Eqn.
(3). Because a is a real quantity, it can be taken outside of the real and imaginary
operators (fourth term in Eqn. (3)) where it is cancelled out, finally yielding tan δ(k31).
31 3131
31 31
Im ( ) Im ( ) Im ( )tan ( ) tan ( )Re( ) Re( ) Re( )
pp
p
k a k a kk kk a k a k
δ δ= = = = (3)
Thus the loss tangents of kp and k31 are equal as shown in Fig. 7. Both the c33D and c33
E
elastic stiffness decrease with porosity, as illustrated in Fig. 8.
4. Figures of merit
As shown in the graphs, almost all of the properties decrease with increasing porosity.
At first glance, this would appear to be disadvantageous for applications. However, the
equations that describe the functioning of various devices contain combinations of
physical properties called figures-of-merit. These may be enhanced in porous materials
despite the fact that the individual physical properties are reduced. Table I gives the
equations for four figures-of-merit [31] for pyroelectric devices. The parameter ε0 is the
permittivity of free space (8.8542 x 10⁻¹² F m-1). The dielectric constant and loss
tangent at 1 kHz were used in the pyroelectric figure-of-merit calculations. The voltage
and current figures-of-merit for the different porosities are shown in Fig. 9 and the
detectivity and imaging figures-of-merit are illustrated in Fig. 10. The voltage figure-
of-merit is important in pyroelectric infrared detectors in which a high-impedance
amplifier is used. The current figure-of-merit is relevant for low-impedance amplifiers.
The detectivity figure-of-merit is useful in applications with high-impedance amplifiers
where the pyroelectric element is the principal noise source. The imaging figure-of-
merit is relevant for pyroelectric imaging devices. The presence of porosity increases
the voltage, imaging and detectivity figures-of-merit significantly but has little effect on
the current figure-of-merit. The reason for the increases in the pyroelectric figures-of-
merit is the presence of the rapidly-decreasing relative permittivity value in the
denominators
Among the major applications of piezoelectric materials are hydrophones. These are
characterized by the hydrostatic or hydrophone figure-of-merit [32] and the acoustic
impedance [33]. The equations for these parameters are presented in Table II and the
hydrostatic figure-of-merit and the acoustic impedance are shown in Figs. 10 and 11,
resp. The hydrostatic figure-of-merit is used to characterize the sensitivity of the
hydrophone. Because d31 and d33 have opposite signs, dh is relatively small for the
dense material. However, d31 rapidly decreases with porosity and d33 remains constant,
thus causing dh to increase with porosity. As mentioned previously, it is desirable for
the acoustic impedance of a hydrophone to match as closely as possible to that of its
environment, usually air or water. Thus the acoustic impedance of the hydrophone
should be as small as possible. As shown in Fig. 11, the acoustic impedance decreases
strongly with increasing porosity because of the decrease in both density and elastic
stiffness.
5. Conclusions
Measurements were made of a number of physical properties of a ferroelectric ceramic,
Ferroperm® Pz27 with porosities of 20, 25 and 30%. Scanning electron micrographs
showed that the materials had a mixture of 3-0 and 3-3 connectivities. The physical
properties that were measured included thermal diffusivity and conductivity, heat
capacity, pyroelectric coefficient, relative permittivity and loss factor, and several
piezoelectric and elastic constants. Although the pyroelectric and piezoelectric
coefficients diminished with increasing porosity, the pyroelectric voltage, imaging and
detectivity figures-of-merit and the hydrostatic figure-of-merit increased significantly
with increasing porosity and the acoustic impedance diminished. The figures-of-merit
are very important for applications, suggesting that the introduction of porosity in
ferroelectric ceramics opens new technological possibilities.

6. Acknowledgements
The authors thank J.C. Lashley (Los Alamos Scientific Laboratory) and Y.W. Wong
(Hong Kong Polytechnic University) for making the heat capacity measurements.
Figure Captions
Note: The dotted lines serve as a guide to the points and are not intended to be used for
interpolation.
1. SEM photos of poled Pz27 samples: (a) dense material with 4% porosity: (b) 20%
porosity; (c) 25% porosity; (d) 30% porosity. Note presence of poling fluid in (d).
2. Thermal conductivities of poled porous Pz27 samples compared to that of dense
Pz27.
3. Pyroelectric coefficients of dense and porous Pz27.
4. Dielectric constants of dense and porous Pz27, as functions of frequency.
5. Dielectric loss tangents of dense and porous Pz27, as functions of frequency.
6. Piezoelectric charge coefficients of dense and porous Pz27. (a) Real components of
d31 and d33. (b) Tan δ of d31.
7. Coupling coefficients and planar Poisson's ratio of dense and porous Pz27. (a)
Coupling coefficients k31, kP and kt and Poisson's ratio. (b) Tan δ of the coupling
coefficients.
8. Elastic stiffnesses and compliances of dense and porous Pz27. (a) Real components
of elastic constants. (b) Tan δ of elastic constants.
9. Pyroelectric voltage and current figures-of-merit.
10. Pyroelectric detectivity and imaging figures-of-merit.
11. Piezoelectric hydrostatic figures-of-merit.
12. Acoustic impedances.
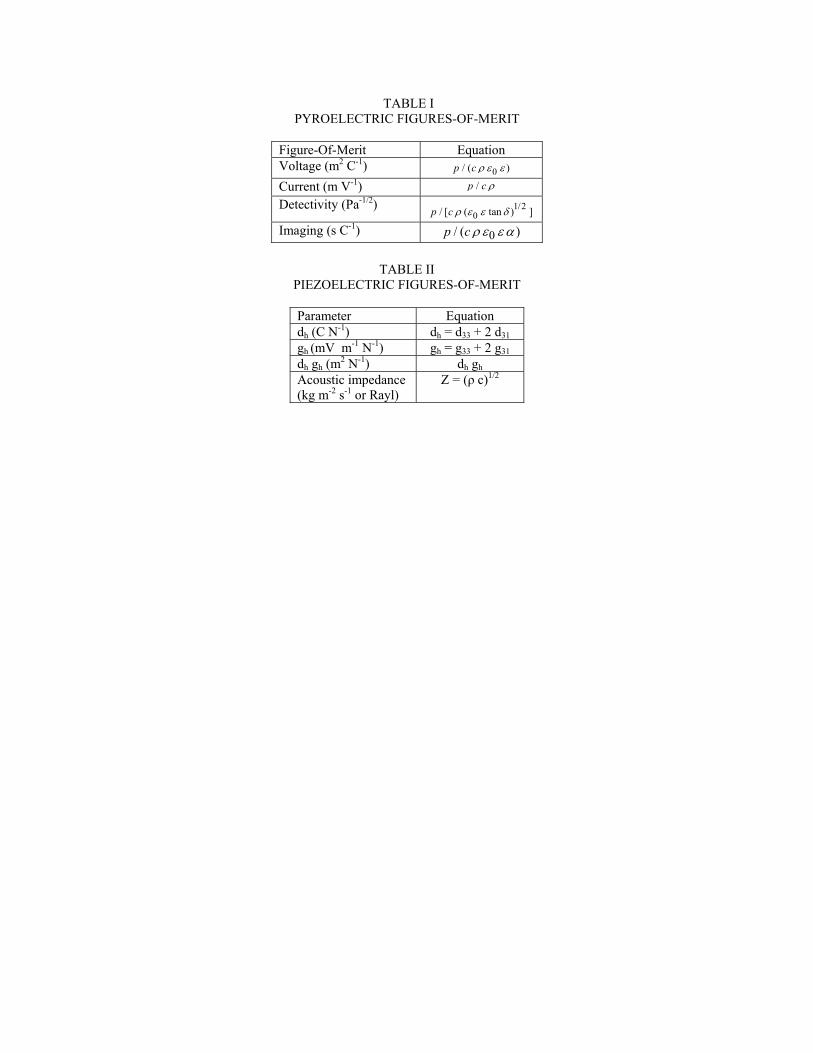
TABLE I PYROELECTRIC FIGURES-OF-MERIT
Figure-Of-Merit Equation Voltage (m2 C-1) 0/ ( )p c ρ ε ε Current (m V-1) /p c ρ Detectivity (Pa-1/2) 1/2
0/ [ ( tan ) ]p c ρ ε ε δ Imaging (s C-1) 0/ ( )p c ρ ε ε α
TABLE II
PIEZOELECTRIC FIGURES-OF-MERIT
Parameter Equation dh (C N-1) dh = d33 + 2 d31 gh (mV m-1 N-1) gh = g33 + 2 g31 dh gh (m2 N-1) dh gh Acoustic impedance (kg m-2 s-1 or Rayl)
Z = (ρ c)1/2
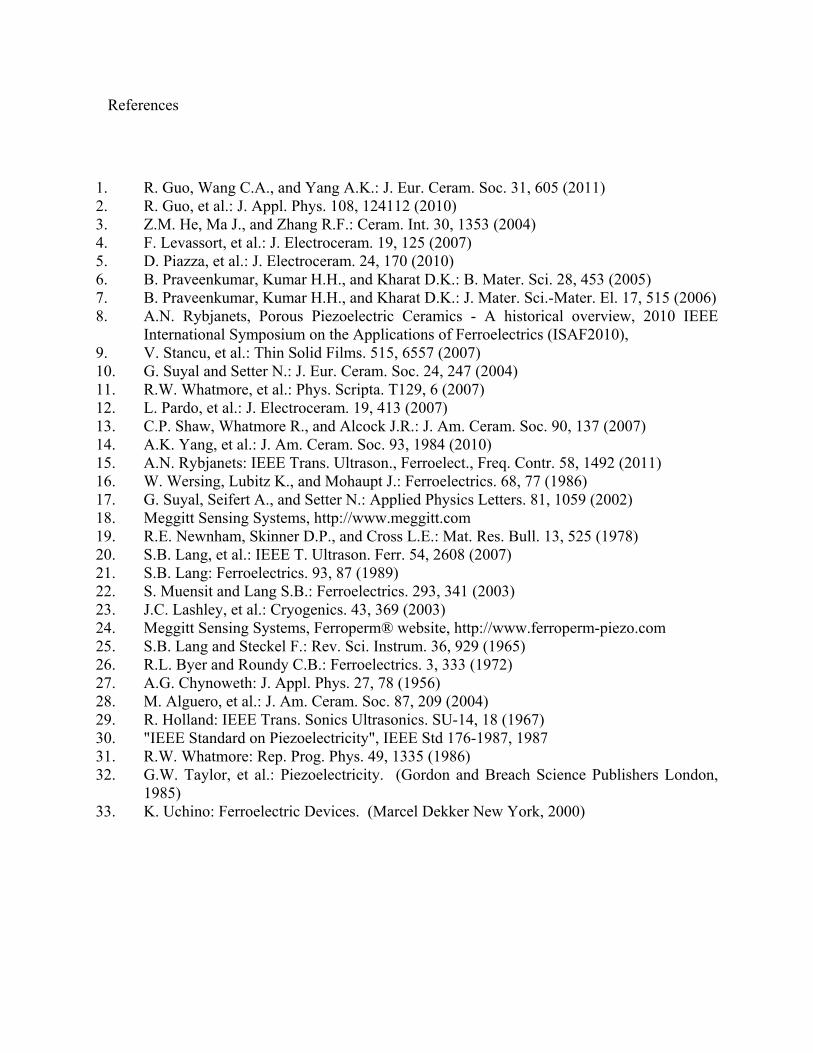
References
1. R. Guo, Wang C.A., and Yang A.K.: J. Eur. Ceram. Soc. 31, 605 (2011) 2. R. Guo, et al.: J. Appl. Phys. 108, 124112 (2010) 3. Z.M. He, Ma J., and Zhang R.F.: Ceram. Int. 30, 1353 (2004) 4. F. Levassort, et al.: J. Electroceram. 19, 125 (2007) 5. D. Piazza, et al.: J. Electroceram. 24, 170 (2010) 6. B. Praveenkumar, Kumar H.H., and Kharat D.K.: B. Mater. Sci. 28, 453 (2005) 7. B. Praveenkumar, Kumar H.H., and Kharat D.K.: J. Mater. Sci.-Mater. El. 17, 515 (2006) 8. A.N. Rybjanets, Porous Piezoelectric Ceramics - A historical overview, 2010 IEEE
International Symposium on the Applications of Ferroelectrics (ISAF2010), 9. V. Stancu, et al.: Thin Solid Films. 515, 6557 (2007) 10. G. Suyal and Setter N.: J. Eur. Ceram. Soc. 24, 247 (2004) 11. R.W. Whatmore, et al.: Phys. Scripta. T129, 6 (2007) 12. L. Pardo, et al.: J. Electroceram. 19, 413 (2007) 13. C.P. Shaw, Whatmore R., and Alcock J.R.: J. Am. Ceram. Soc. 90, 137 (2007) 14. A.K. Yang, et al.: J. Am. Ceram. Soc. 93, 1984 (2010) 15. A.N. Rybjanets: IEEE Trans. Ultrason., Ferroelect., Freq. Contr. 58, 1492 (2011) 16. W. Wersing, Lubitz K., and Mohaupt J.: Ferroelectrics. 68, 77 (1986) 17. G. Suyal, Seifert A., and Setter N.: Applied Physics Letters. 81, 1059 (2002) 18. Meggitt Sensing Systems, http://www.meggitt.com 19. R.E. Newnham, Skinner D.P., and Cross L.E.: Mat. Res. Bull. 13, 525 (1978) 20. S.B. Lang, et al.: IEEE T. Ultrason. Ferr. 54, 2608 (2007) 21. S.B. Lang: Ferroelectrics. 93, 87 (1989) 22. S. Muensit and Lang S.B.: Ferroelectrics. 293, 341 (2003) 23. J.C. Lashley, et al.: Cryogenics. 43, 369 (2003) 24. Meggitt Sensing Systems, Ferroperm® website, http://www.ferroperm-piezo.com 25. S.B. Lang and Steckel F.: Rev. Sci. Instrum. 36, 929 (1965) 26. R.L. Byer and Roundy C.B.: Ferroelectrics. 3, 333 (1972) 27. A.G. Chynoweth: J. Appl. Phys. 27, 78 (1956) 28. M. Alguero, et al.: J. Am. Ceram. Soc. 87, 209 (2004) 29. R. Holland: IEEE Trans. Sonics Ultrasonics. SU-14, 18 (1967) 30. "IEEE Standard on Piezoelectricity", IEEE Std 176-1987, 1987 31. R.W. Whatmore: Rep. Prog. Phys. 49, 1335 (1986) 32. G.W. Taylor, et al.: Piezoelectricity. (Gordon and Breach Science Publishers London,
1985) 33. K. Uchino: Ferroelectric Devices. (Marcel Dekker New York, 2000)
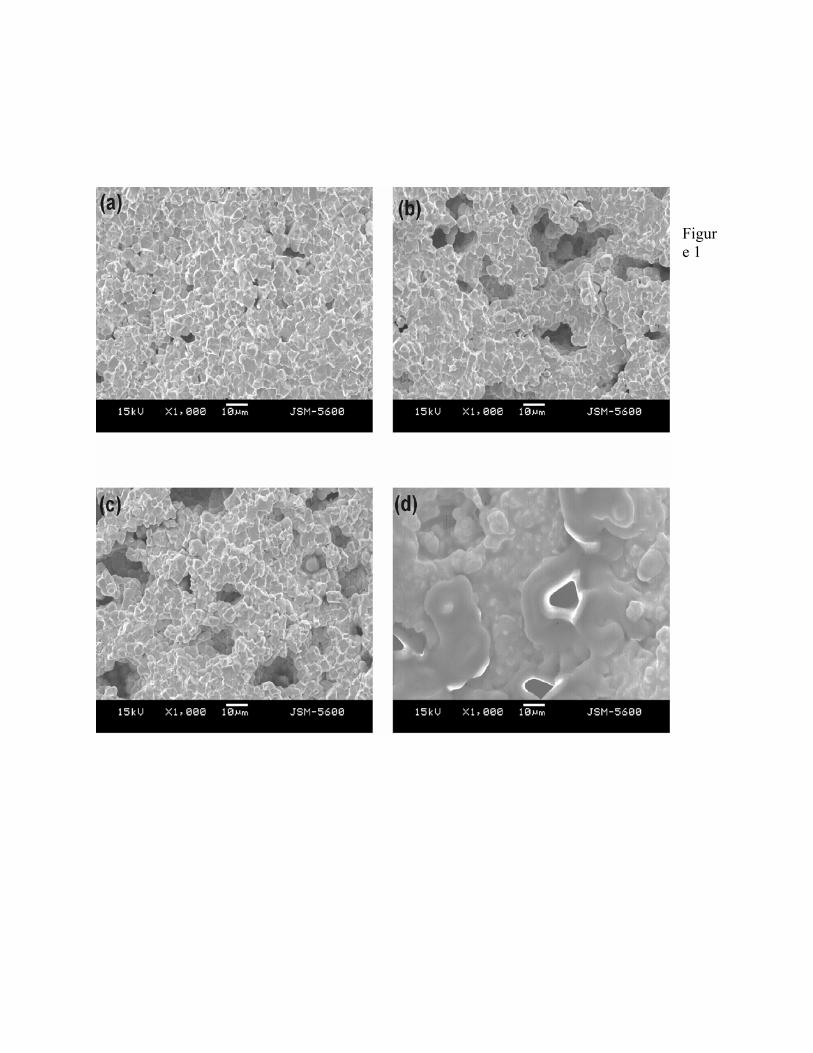
Figure 1
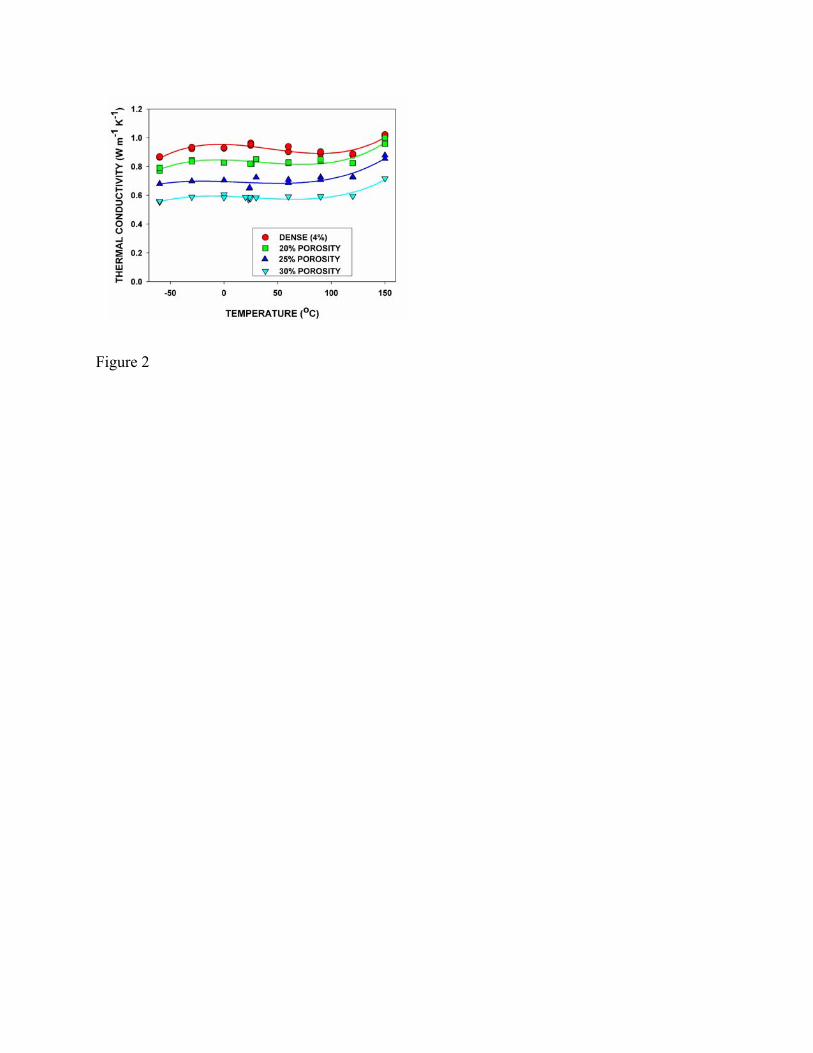
Figure 2
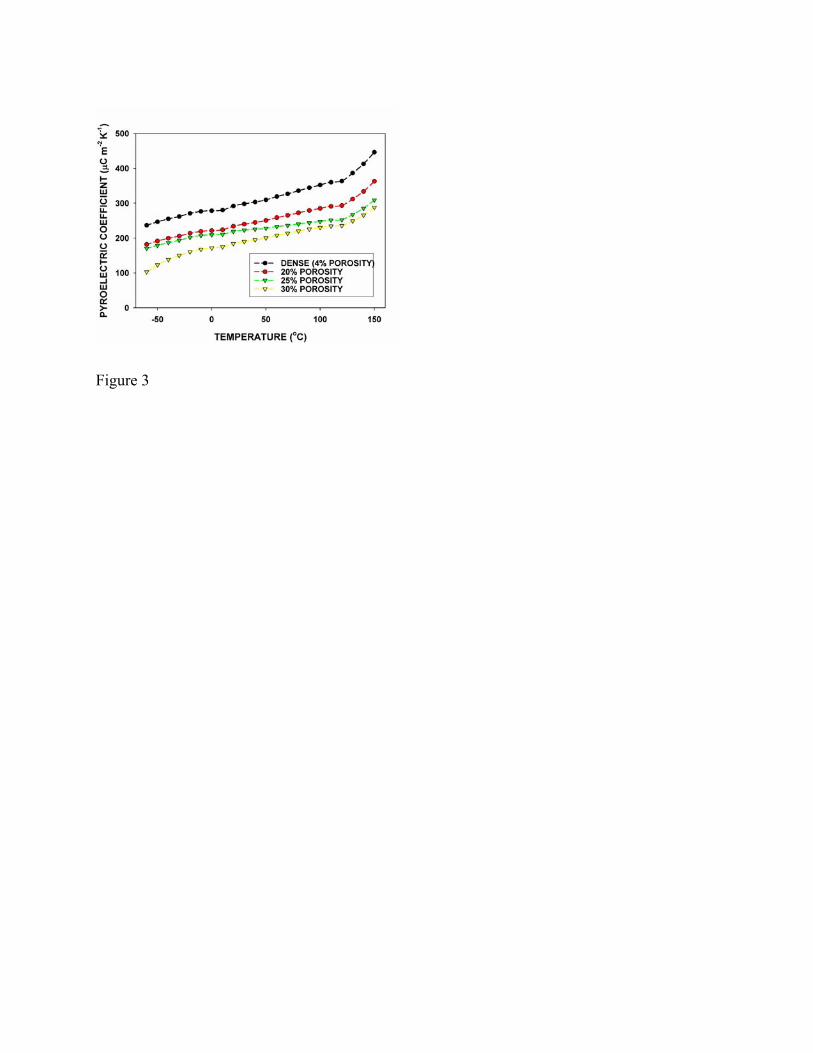
Figure 3
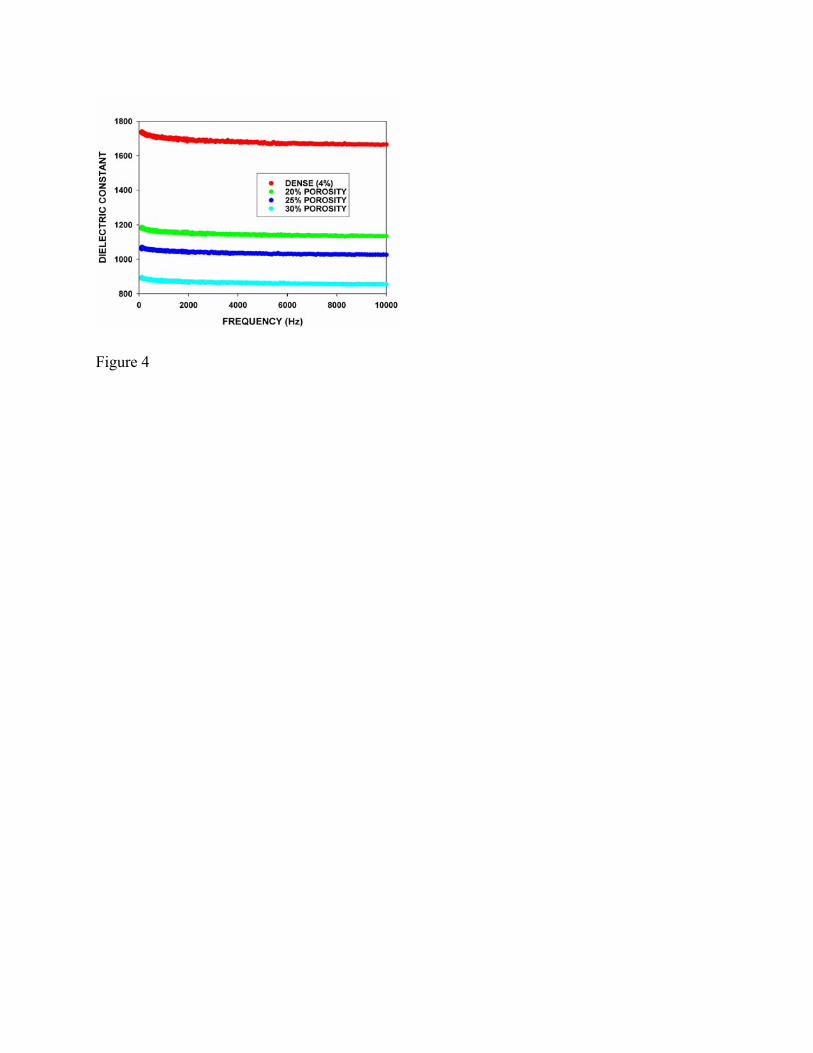
Figure 4
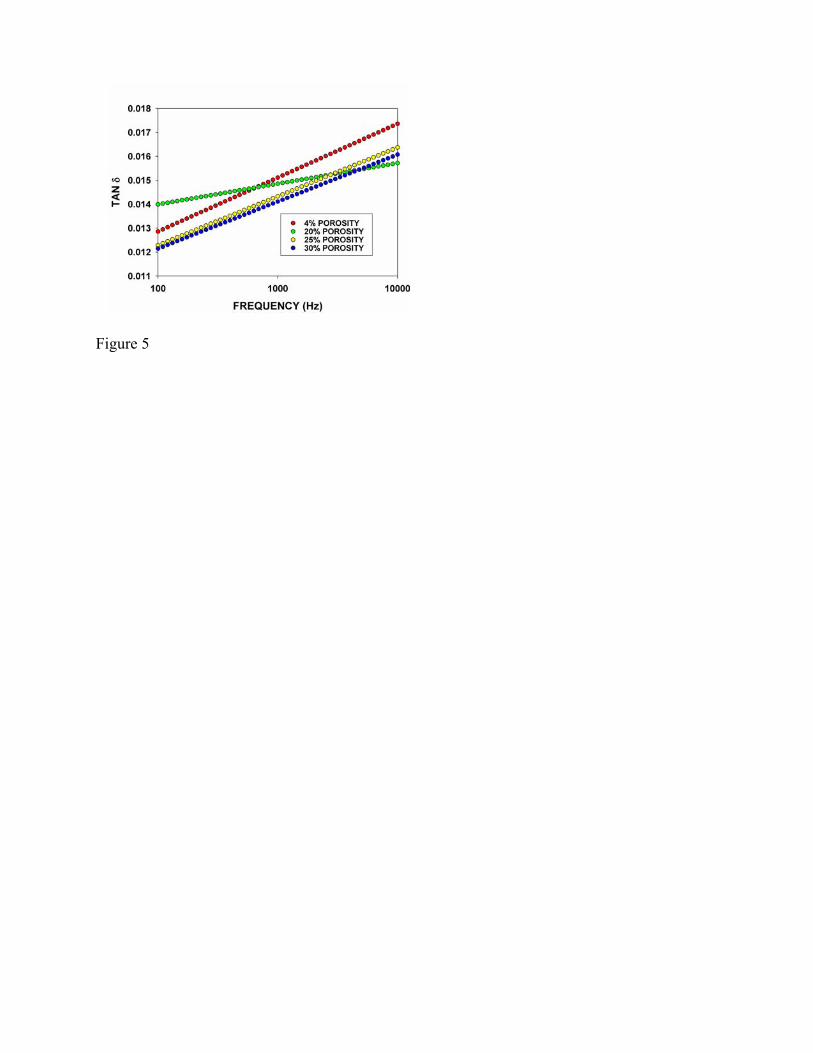
Figure 5
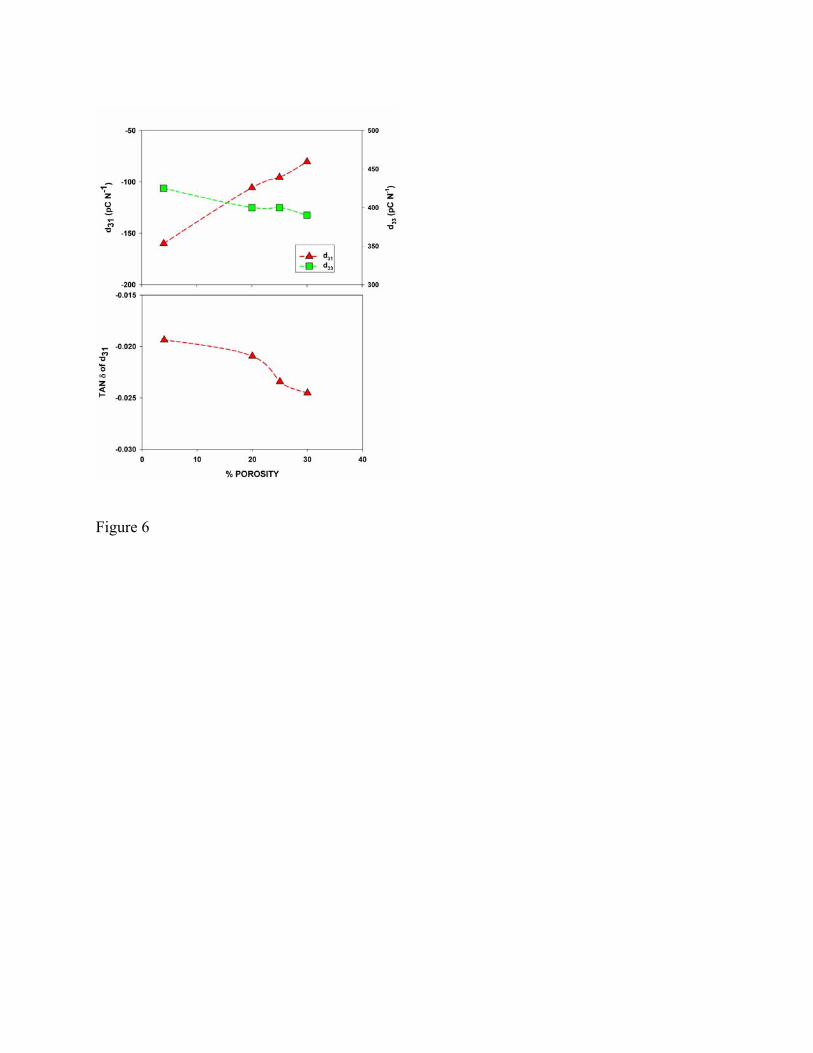
Figure 6
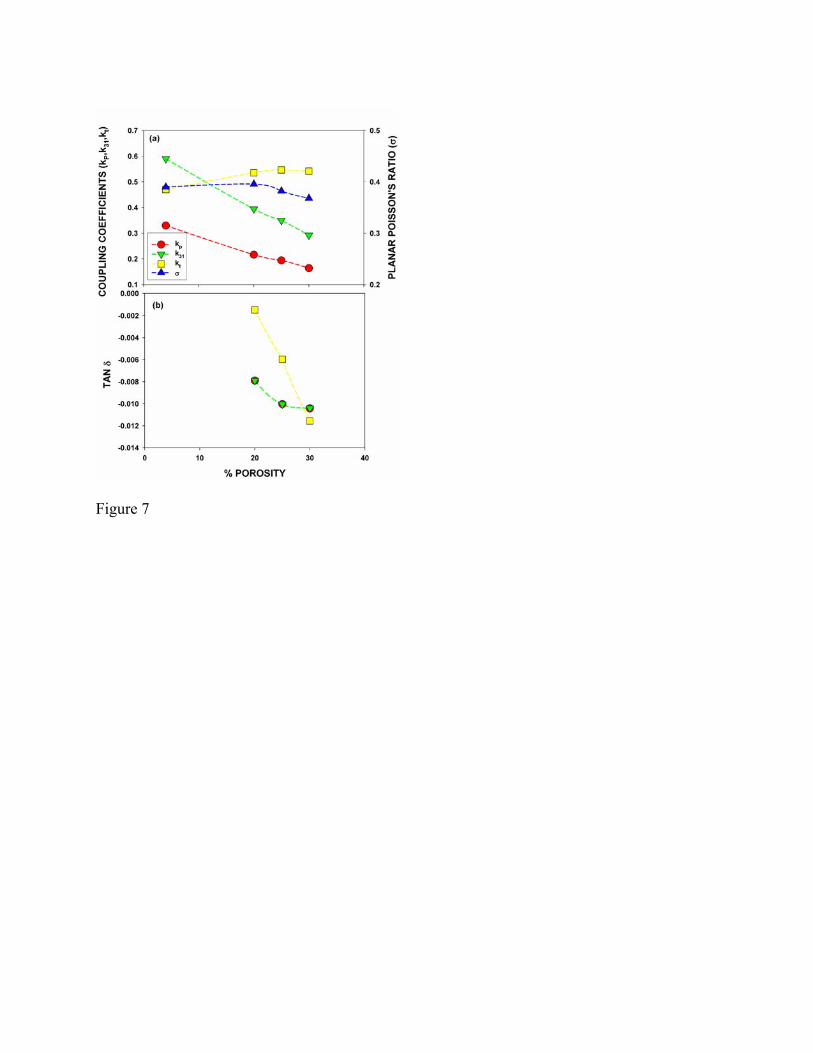
Figure 7
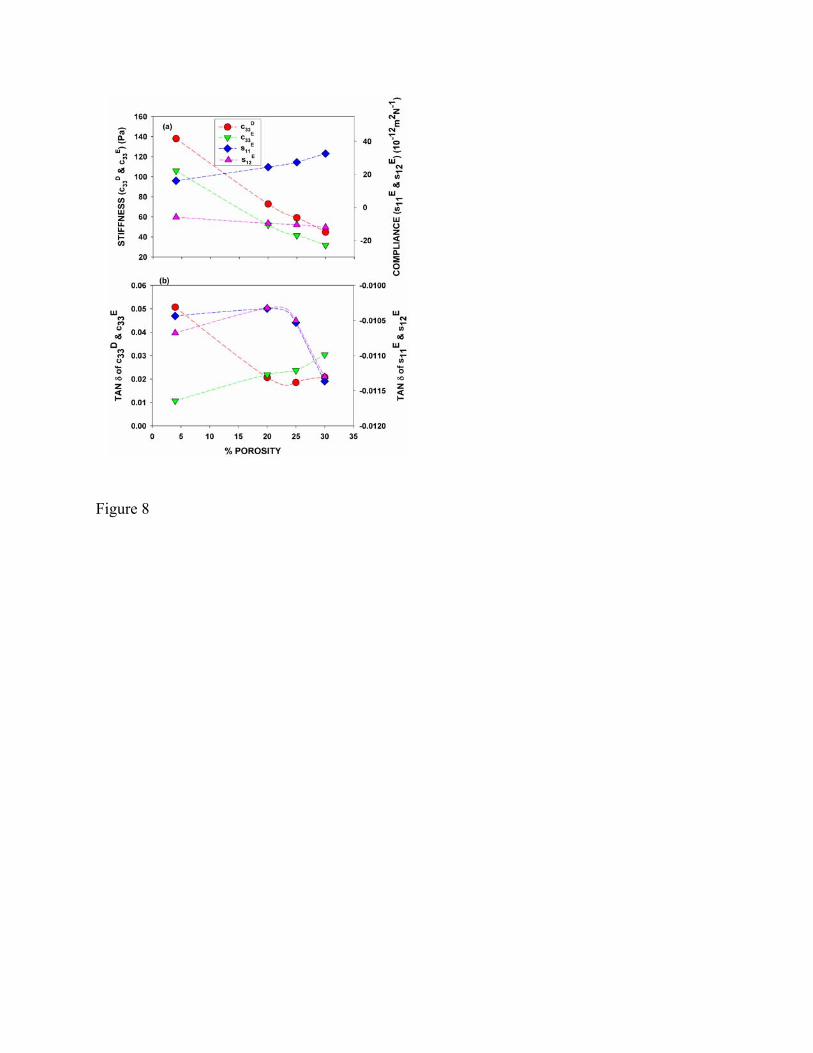
Figure 8
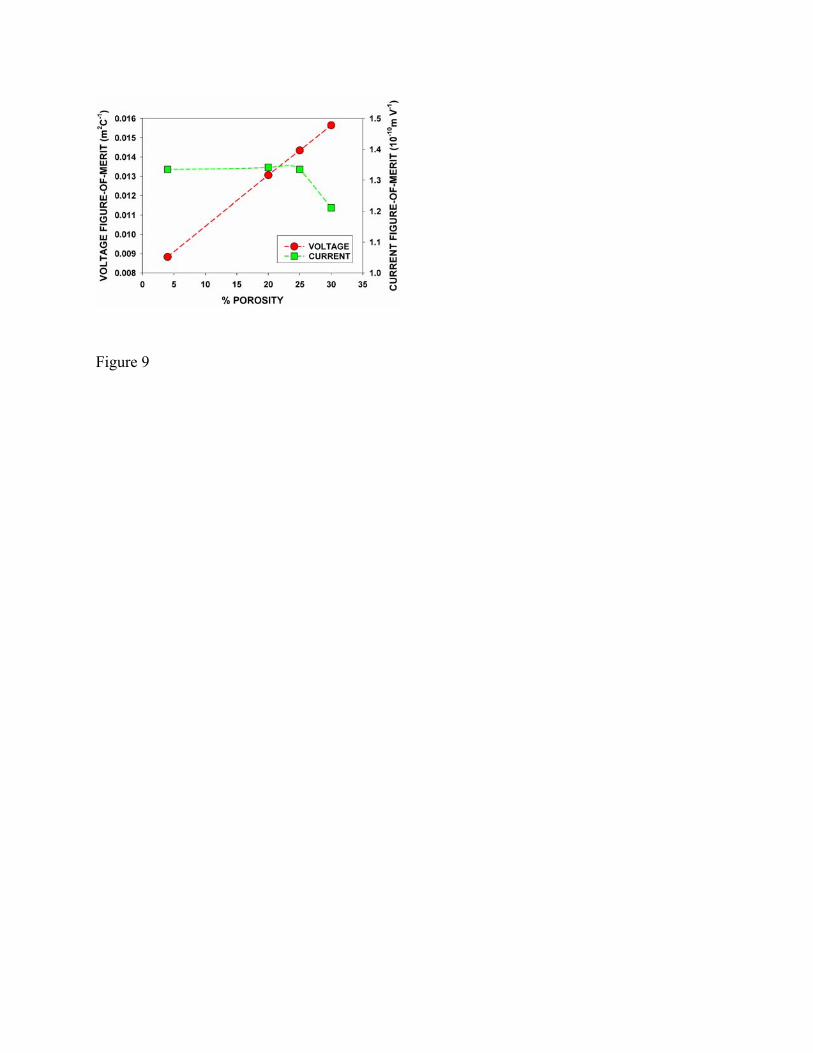
Figure 9
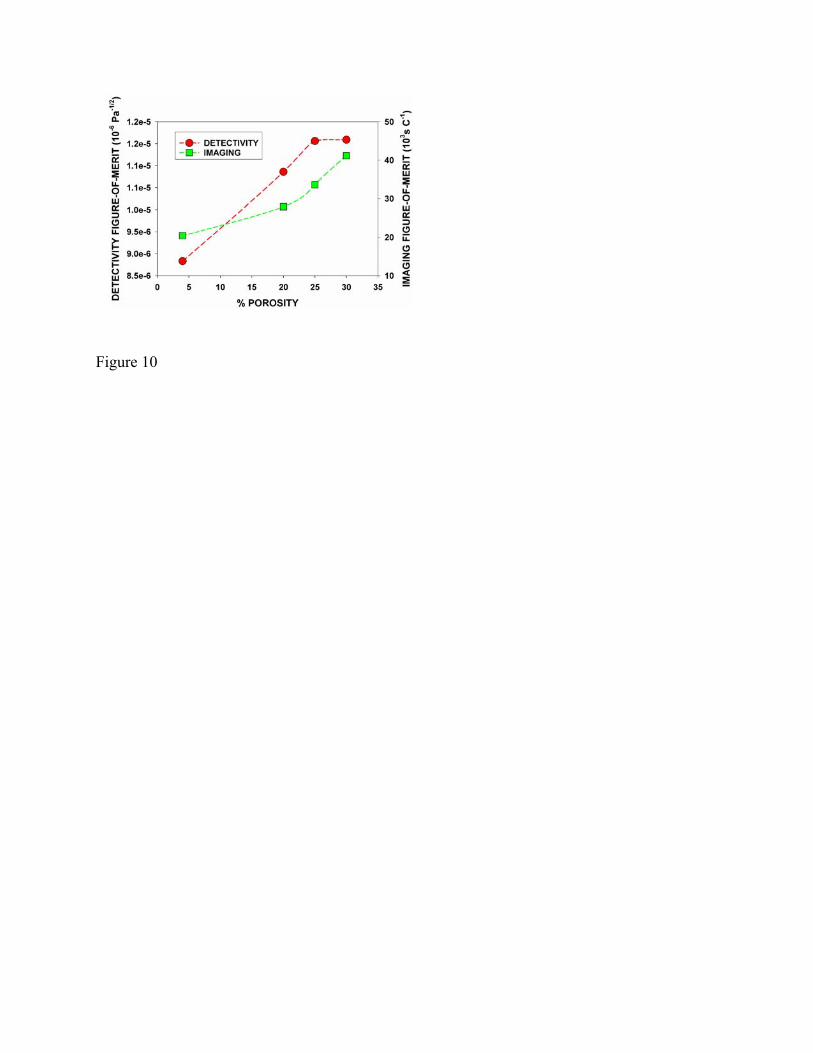
Figure 10
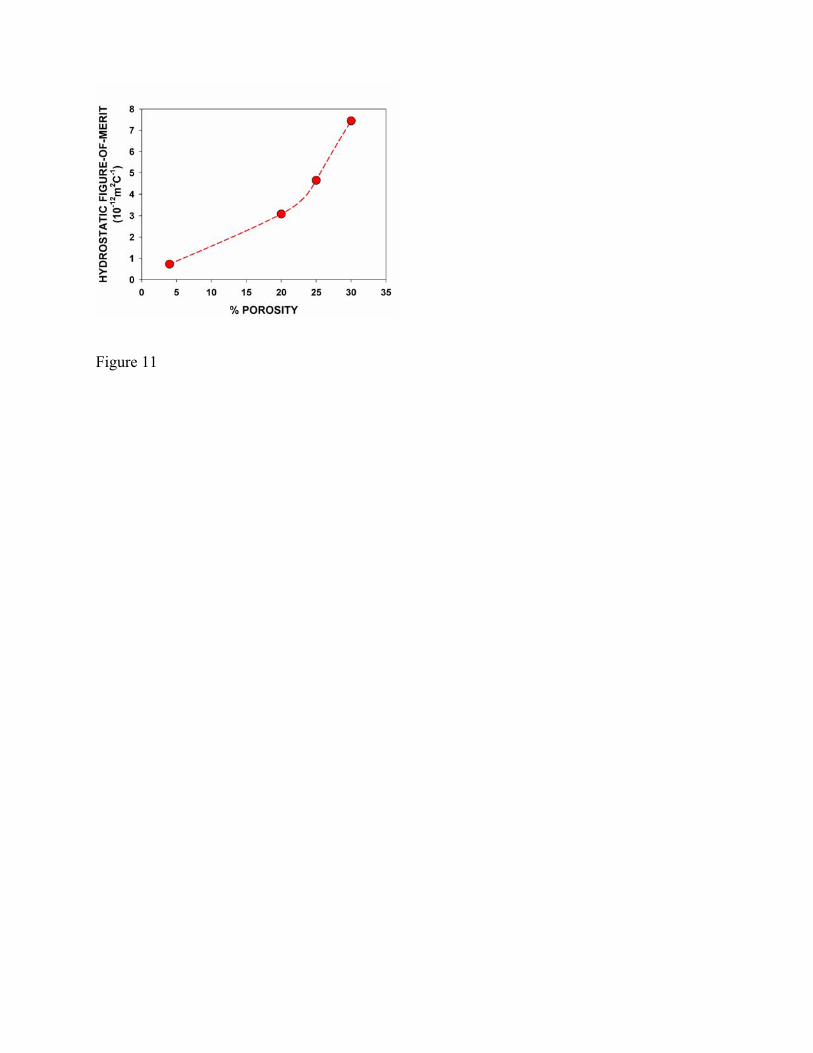
Figure 11
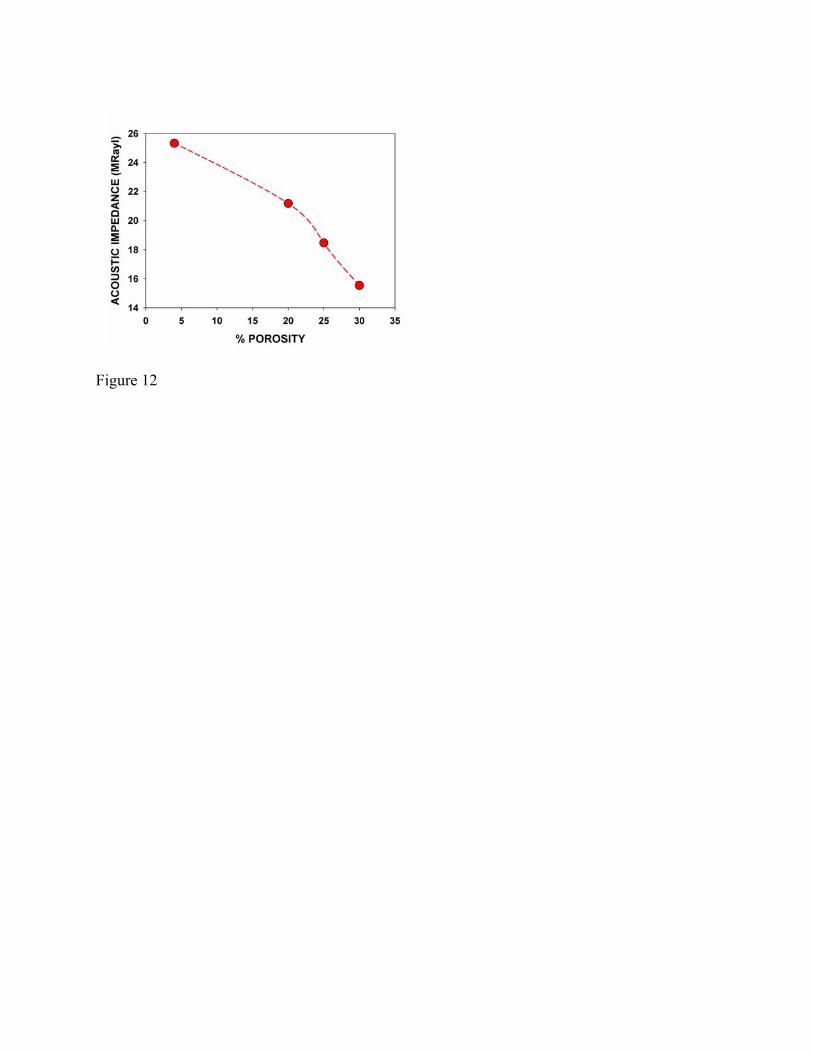
Figure 12