Embed Size (px)
Citation preview
P O S I V A O Y
O l k i l u o t o
F I -27160 EURAJOKI , F INLAND
Te l +358-2-8372 31
Fax +358-2-8372 3709
Arto Muur inen
January 2011
Work ing Repor t 2011 -10
Measurements on Cation Exchange Capacityof Bentonite in the Long-Term Test
of Buffer Material (LOT)
January 2011
Working Reports contain information on work in progress
or pending completion.
The conclusions and viewpoints presented in the report
are those of author(s) and do not necessarily
coincide with those of Posiva.
Arto Muur inen
V T T
Work ing Report 2011 -10
Measurements on Cation Exchange Capacityof Bentonite in the Long-Term Test
of Buffer Material (LOT)
Measurements on Cation Exchange Capacity of Bentonite in the Long-Term Test of Buffer Material (LOT) ABSTRACT Determination of cation exchange capacity (CEC) of bentonite in the LOT experiment was the topic of this study. The measurements were performed using the complex of copper(II) ion with trietylenetetramine [Cu(trien)]2+ as the index cation. Testing of the determination method suggested that (i) drying and wetting of the bentonite, and (ii) exchange time affect the obtained result. The real CEC measurements were carried out with the bentonite samples taken from the A2 parcel of the LOT experiment. The CEC values of the LOT samples were compared with those of the reference samples taken from the same bentonite batch before the compaction of the blocks for the experiment. The conclusions drawn have been made on the basis of the results determined with the wet bentonite samples using the direct exchange of two weeks with 0.01 M [Cu(trien)]2+ solution because this method gave the most complete cation exchange in the CEC measurements. The differences between the samples taken from different places of the A2 parcel were quite small and close to the accuracy of the method. However, it seems that the CEC values of the field experiment are somewhat higher than the CEC of the reference samples and the values of the hot area are higher than those obtained from the low temperature area. It is also obvious that the variation of CEC increases with increasing temperature. Keywords: Bentonite, CEC, cation exchange capacity, LOT, Äspö, long-term test, MX-80.
Bentoniitin kationinvaihtokapasiteettimittaukset: LOT -koe TIIVISTELMÄ Tämän tutkimuksen aiheena oli LOT-kokeen bentoniitin kationinvaihtokapasiteetin (CEC) määrittämien. Mittaukset tehtiin käyttämällä kupari(II):n trietyleenitetramiini kompleksia indeksikationina. Määritysmenetelmän testaus viittasi siihen, että bento-niitin kuivaaminen ja kastelu sekä ioninvaihtoaika vaikuttavat saatuun tulokseen. Varsinaiset CEC:n mittaukset tehtiin bentoniittinäytteillä, jotka oli otettu LOT kokeen näytteestä A2. LOT-kokeen CEC arvoja verrattiin referenssiväytteisiin, jotka oli otettu samasta bentoniittierästä ennen bentoniittikappaleiden puristamista koetta varten. Johtopäätökset on tehty tulosten perusteella, jotka määritettiin märillä bentoniittinäyt-teillä käyttämällä suoraan kahden viikon ioninvaihtoa 0.01 M [Cu(trien)]2+ -liuoksella, koska tämä menetelmä antoi täydellisimmän kationinvaihdon CEC-mittauksessa. Erot A2-näytteen eri paikoista otettujen näytteiden välillä olivat melko pienet ja lähellä menetelmän tarkkuutta. Joka tapauksessa näyttää siltä, että kenttäkokeen CEC-arvot ovat suurempia kuin referenssinäytteiden arvot ja kuuman alueen arvot ovat kylmän alueen arvoja suurempia. On myös ilmeistä, että CEC:n vaihtelu kasvaa lämpötilan kasvaessa. Avainsanat: Bentoniitti, CEC, kationinvaihtokapasiteetti, LOT, Äspö, pitkäaikaisokeet, MX-80.
1
TABLE OF CONTENTS ABSTRACT TIIVISTELMÄ 1 INTRODUCTION .................................................................................................. 2 2 EVALUATION OF CEC MEASUREMENT METHODS ........................................ 3 2.1 General ....................................................................................................... 3 2.2 CEC measurements ..................................................................................... 4 3 EXPERIMENTAL .................................................................................................. 5 3.1 Testing of CEC determination using [Cu(trien)]2+ ....................................... 5 3.1.1 Formation of [Cu(trien)]2+ complex ................................................. 5 3.1.2 Dependence of absorbance on pH ................................................. 6 3.1.3 Dependence of CEC on the exchange time and drying and wetting of the sample ...................................................................... 7 3.2 CEC studies onA2 samples of the LOT experiment .................................. 10 3.2.1 Performed measurements ........................................................... 10 3.2.2 Results of the CEC measurements of A2 samples ...................... 11 4 DISCUSSION AND ............................................................................................ 18 REFERENCES ............................................................................................................. 20 APPENDIX A .............................................................................................................. 21 Measured CEC in different blocks of compacted samples of LOT A2 at different distances from the heater. CEC measurement with wet bentonite samples by direct exchange of two weeks with 0.01 M [Cu(trien)]2+ APPENDIX B .............................................................................................................. 22 Measured CEC in different blocks of compacted samples of LOT A2 at different distances from the heater. CEC measurement with dried bentonite samples by direct exchange of two weeks with 0.01 M [Cu(trien)]2+ APPENDIX C ............................................................................................................... 23 Measured CEC in different blocks of compacted samples of LOT A2 at different distances from the heater. CEC measurement with wet bentonite samples by dispersion in water for a week followed by exchange of a week with 0.01 M [Cu(trien)]2+ APPENDIC D ............................................................................................................. 24 Measured CEC in different blocks of compacted samples of LOT A2 at different distances from the heater. CEC measurement with dried bentonite samples by dispersion in water for a week followed by exchange of a week with 0.01 M [Cu(trien)]2+ APPENDIX E ............................................................................................................. 25 CEC in different blocks of LOT A2 at different distances from the heater. Measurement with powders received from Clay Technology. Measurement by direct exchange with 0.01 M [Cu(trien)]2+ APPENDIX F ............................................................................................................... 26 CEC of the reference samples determined by different methods
2
1 INTRODUCTION The “Long-Term Test of Buffer Material” (LOT) which is underway in the Äspö HRL aims to test the behaviour of bentonite buffer under conditions similar to those in a KBS3 repository. The test parcels were planned to be exposed to repository conditions for 1, 5 and 20 years. The present experimental period with five samples started in 1999. In the studies performed by Clay Technology AB, a systematic change of the cation exchange capacity (CEC) was noticed in the bentonite samples of the test parcel A2, where the experimental time was about six years. The measurement methods of CEC are not very exact, however, and the absolute values determined by different methods can vary considerably. Changes in the CEC may, however, indicate alteration of the montmorillonite mineral and consequently the reasons for the observed change and the differences of the results have to be solved. There has been a need to improve both the knowledge of the reliability of the measurement methods on CEC and to repeat measurements of LOT samples in order to confirm the earlier observations.
3
2 EVALUATION OF CEC MEASUREMENT METHODS 2.1 General The ability to change cations is one of the basic properties of bentonite. Hydration of the exchangeable cations is also the cause of the bentonite swelling, which is one of the bases for using it as a buffer in nuclear waste disposal. The cation exchange capacity of bentonite has two origins. The first type is the permanent negative charge caused by isomorphous substitution in the tetrahedral and octahedral sheets of montmorillonite, which is charge-balanced by exchangeable cations. The other type of charge is pH- dependent and is caused by the protonation and deprotonation of the edge sites. The pH-dependent surface site capacity proposed by Baeyens and Bradbury (1997) is about 10 % of the total charge, but it varies as a function of pH and becomes zero when the pH approaches the point of zero charge. It has not been possible to determine this point exactly, however. Bergaya et al. (2006) give a brief survey of cation and anion exchange, with particular reference to the definition and determining of the cation exchange capacity (CEC) of clay minerals. The main questions are concerned with (i) the best method to measure CEC and (II) the real meaning of the measured CEC under the specified conditions. In this chapter, some conclusions of the review are presented. More details can be found in Bergaya et al. (2006) and in the references therein. The basic idea of most of the methods to determine CEC is to displace the cation in bentonite with another cation called the index cation. The selectivity of the index cation has to be high to be able to replace the exchangeable cations effectively. Clay minerals show a preference for larger over smaller inorganic cations. For smectites this preference for larger cations follows the order
Cs+ > Rb+ >K+ >Na+ > Li+ and Ba2+ >Sr2+ >Ca2+ >Mg2+.
In heterovalent exchange reactions, the highly charged cations are preferred over monovalent ions, as indicated by the exchange reaction in Eq (1) and its thermodynamic exchange constant in Eq. (2).
2XA + B2+ � X2B + 2A+ (1)
��
��
�
��
2
2
2
2
BA
AB
aaaa
K (2)
where X means the negative surface, A+ is a monovalent cation, B2+ is a divalent cation, a is the activity of the cation bound to the surface and a is the activity of the cation in the solution. Exchange reactions on clay minerals typically show hysteresis effects. Several mechanisms can cause hysteresis but a satisfactory explanation is still lacking.
4
The quantity of multivalent heavy metal cations adsorbed often exceeds the CEC of the clay mineral. It is therefore important to separate the exchange reaction from accompanying processes such as adsorption, surface precipitation and dissolution (Bergaya et al. 2006). The CEC of clay minerals may be defined as the quantity of cations available for exchange at a given pH. It is traditionally expressed in milliequivalents (meq)/100 g of calcined clay (Bergaya and Vayer, 1997). The unit of CEC recommended by the IUPAC is cmol/kg, which is numerically equivalent to meq/100 g. 2.2 CEC measurements The CEC of clay minerals can be determined by a variety of methods. The most widely used methods involve the displacement of the interlayer cations with the index cations in a known volume of solution and the analytical determination of the cations in the solution by standard techniques. For measuring CEC, it is important to use cations that are preferred to the cations being replaced. Ammonium NH4
+, Cs+ and Ba2+ have often been used as index cations. The methods are, however, time-consuming because several cycles are needed to reach complete exchange. Clay minerals show a strong preference for organo-metal complexes and many organo-metal cations have been used as index cations. The determination of CEC of clays using [Cu(en)2]2+ (where en = ethylenediamine) was developed by Bergaya and Vayer (1997), while Meier and Kahr (1999) proposed the use of [Cu(trien)]2+ complexes (trien = triethylenetetramine). The determination of CEC of clay minerals using [Cu(en)2]2+ and [Cu(trien)]2+ complexes are presently the most versatile methods (Bergaya et al. 2006). The exchange reaction is fast and complete and only a spectrophotometer is needed for the analysis.
5
3 EXPERIMENTAL 3.1 Testing of CEC determination using [Cu(trien)]2+ 3.1.1 Formation of [Cu(trien)]2+ complex
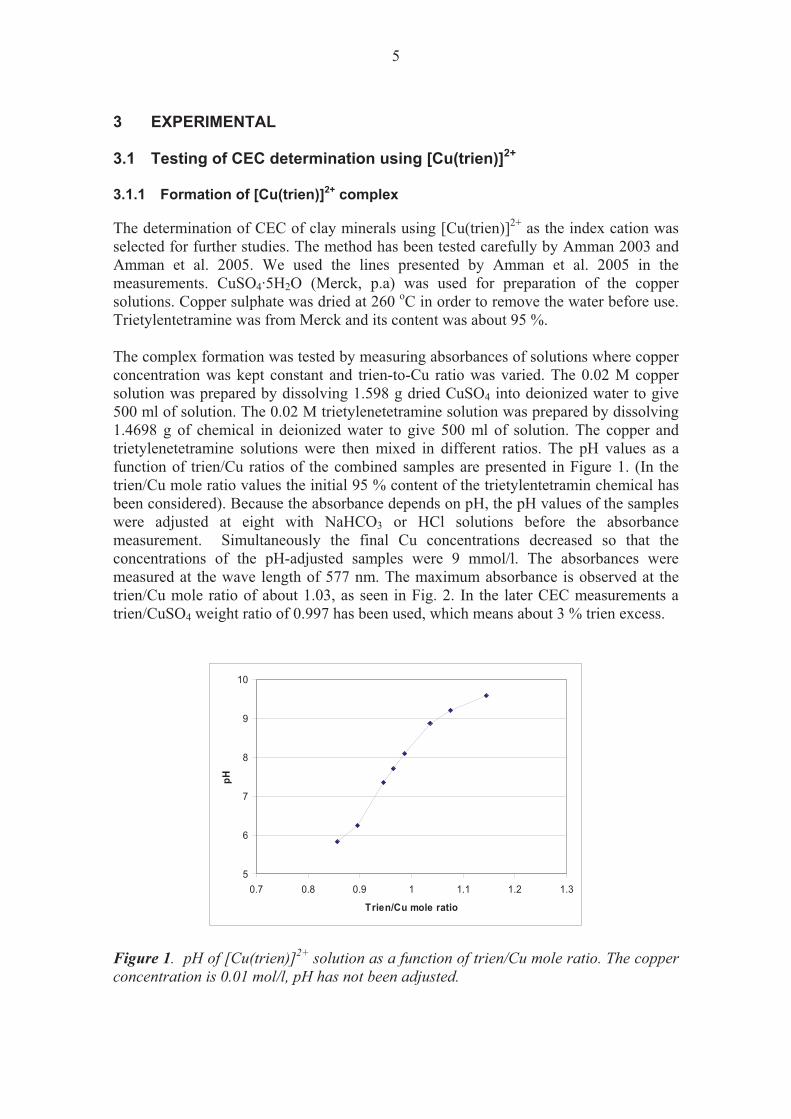
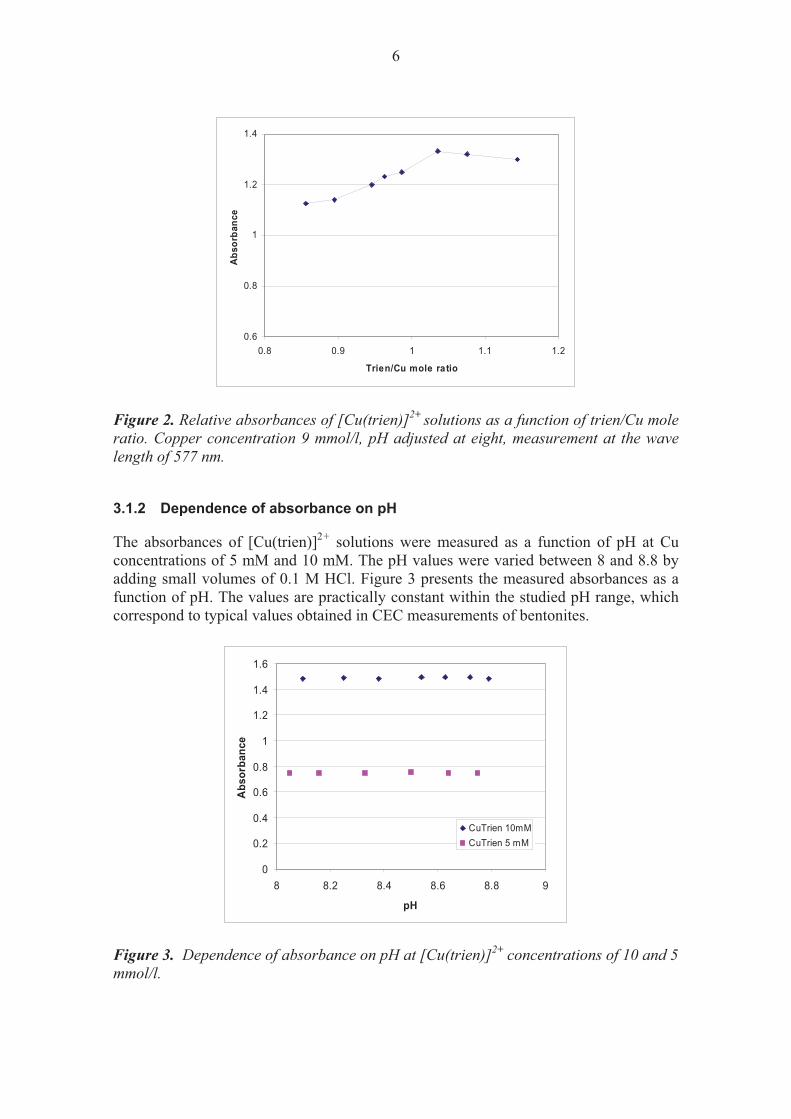
The determination of CEC of clay minerals using [Cu(trien)]2+ as the index cation was selected for further studies. The method has been tested carefully by Amman 2003 and Amman et al. 2005. We used the lines presented by Amman et al. 2005 in the measurements. CuSO4·5H2O (Merck, p.a) was used for preparation of the copper solutions. Copper sulphate was dried at 260 oC in order to remove the water before use. Trietylentetramine was from Merck and its content was about 95 %. The complex formation was tested by measuring absorbances of solutions where copper concentration was kept constant and trien-to-Cu ratio was varied. The 0.02 M copper solution was prepared by dissolving 1.598 g dried CuSO4 into deionized water to give 500 ml of solution. The 0.02 M trietylenetetramine solution was prepared by dissolving 1.4698 g of chemical in deionized water to give 500 ml of solution. The copper and trietylenetetramine solutions were then mixed in different ratios. The pH values as a function of trien/Cu ratios of the combined samples are presented in Figure 1. (In the trien/Cu mole ratio values the initial 95 % content of the trietylentetramin chemical has been considered). Because the absorbance depends on pH, the pH values of the samples were adjusted at eight with NaHCO3 or HCl solutions before the absorbance measurement. Simultaneously the final Cu concentrations decreased so that the concentrations of the pH-adjusted samples were 9 mmol/l. The absorbances were measured at the wave length of 577 nm. The maximum absorbance is observed at the trien/Cu mole ratio of about 1.03, as seen in Fig. 2. In the later CEC measurements a trien/CuSO4 weight ratio of 0.997 has been used, which means about 3 % trien excess.
5
6
7
8
9
10
0.7 0.8 0.9 1 1.1 1.2 1.3
Trien/Cu mole ratio
pH
Figure 1. pH of [Cu(trien)]2+ solution as a function of trien/Cu mole ratio. The copper concentration is 0.01 mol/l, pH has not been adjusted.
6
0.6
0.8
1
1.2
1.4
0.8 0.9 1 1.1 1.2
Trien/Cu mole ratio
Abs
orba
nce
Figure 2. Relative absorbances of [Cu(trien)]2+ solutions as a function of trien/Cu mole ratio. Copper concentration 9 mmol/l, pH adjusted at eight, measurement at the wave length of 577 nm.
3.1.2 Dependence of absorbance on pH
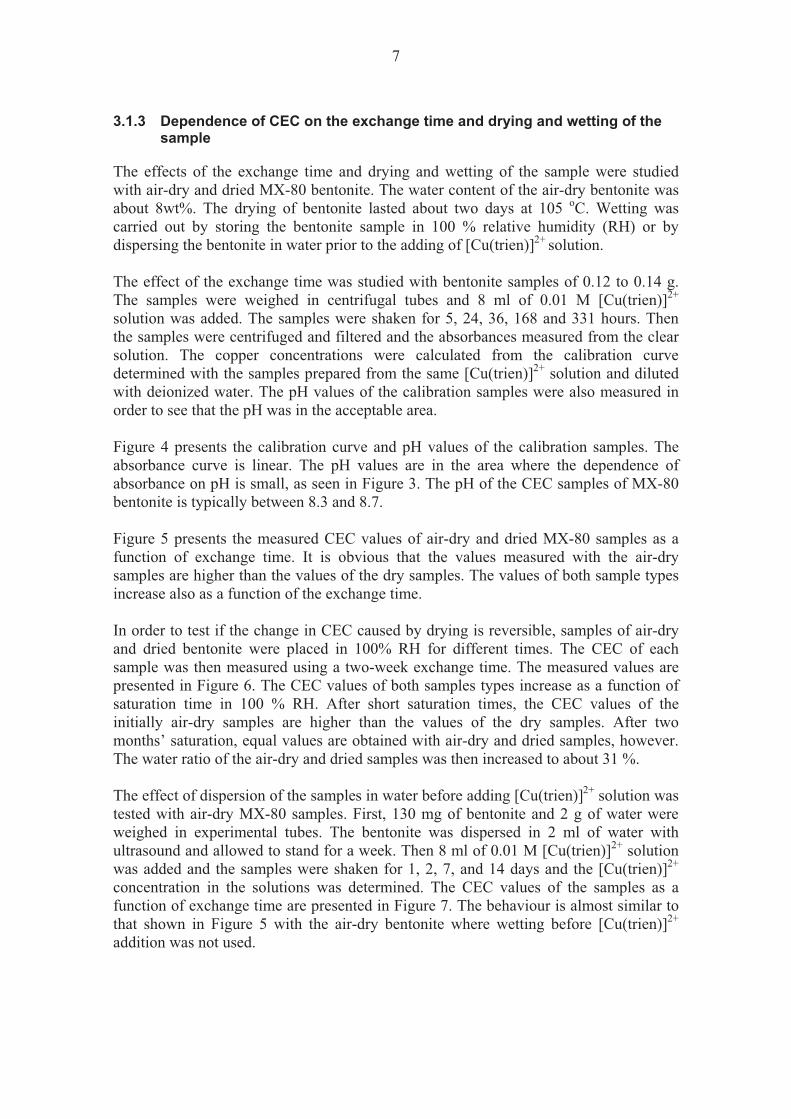
The absorbances of [Cu(trien)]2+ solutions were measured as a function of pH at Cu concentrations of 5 mM and 10 mM. The pH values were varied between 8 and 8.8 by adding small volumes of 0.1 M HCl. Figure 3 presents the measured absorbances as a function of pH. The values are practically constant within the studied pH range, which correspond to typical values obtained in CEC measurements of bentonites.
0
0.2
0.4
0.6
0.8
1
1.2
1.4
1.6
8 8.2 8.4 8.6 8.8 9
pH
Abs
orba
nce
CuTrien 10mMCuTrien 5 mM
Figure 3. Dependence of absorbance on pH at [Cu(trien)]2+ concentrations of 10 and 5 mmol/l.
7
3.1.3 Dependence of CEC on the exchange time and drying and wetting of the sample
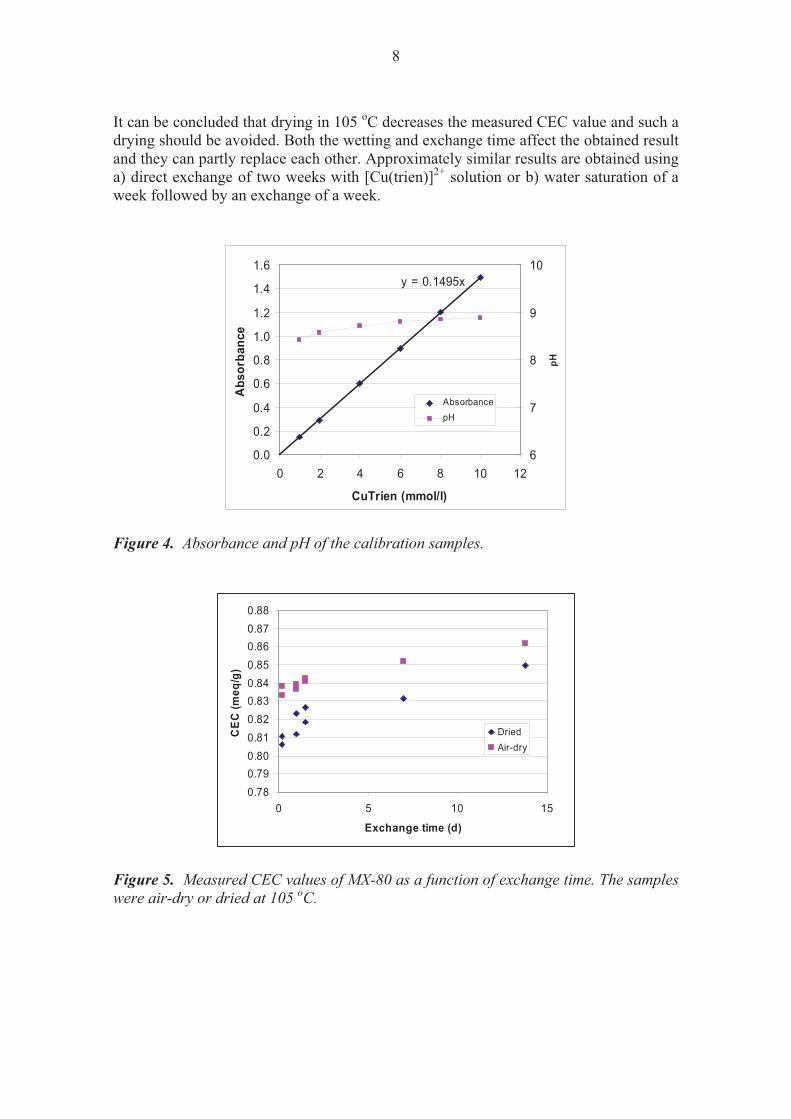
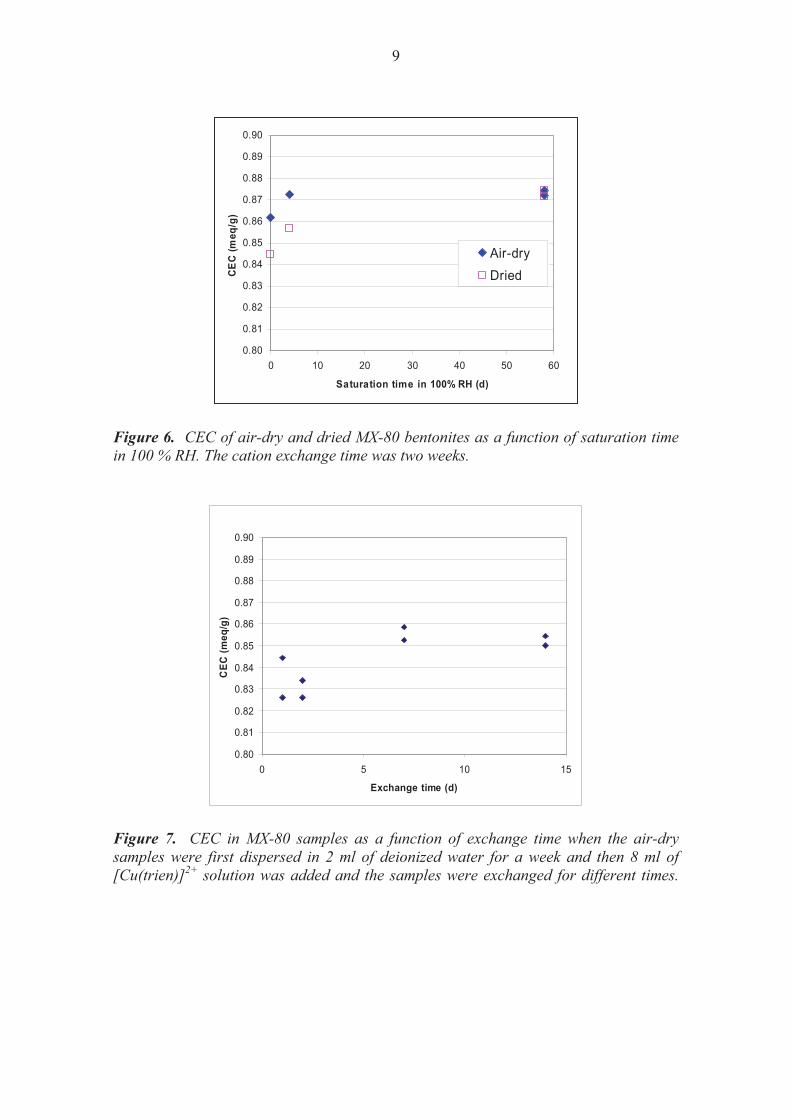
The effects of the exchange time and drying and wetting of the sample were studied with air-dry and dried MX-80 bentonite. The water content of the air-dry bentonite was about 8wt%. The drying of bentonite lasted about two days at 105 oC. Wetting was carried out by storing the bentonite sample in 100 % relative humidity (RH) or by dispersing the bentonite in water prior to the adding of [Cu(trien)]2+ solution. The effect of the exchange time was studied with bentonite samples of 0.12 to 0.14 g. The samples were weighed in centrifugal tubes and 8 ml of 0.01 M [Cu(trien)]2+ solution was added. The samples were shaken for 5, 24, 36, 168 and 331 hours. Then the samples were centrifuged and filtered and the absorbances measured from the clear solution. The copper concentrations were calculated from the calibration curve determined with the samples prepared from the same [Cu(trien)]2+ solution and diluted with deionized water. The pH values of the calibration samples were also measured in order to see that the pH was in the acceptable area. Figure 4 presents the calibration curve and pH values of the calibration samples. The absorbance curve is linear. The pH values are in the area where the dependence of absorbance on pH is small, as seen in Figure 3. The pH of the CEC samples of MX-80 bentonite is typically between 8.3 and 8.7. Figure 5 presents the measured CEC values of air-dry and dried MX-80 samples as a function of exchange time. It is obvious that the values measured with the air-dry samples are higher than the values of the dry samples. The values of both sample types increase also as a function of the exchange time. In order to test if the change in CEC caused by drying is reversible, samples of air-dry and dried bentonite were placed in 100% RH for different times. The CEC of each sample was then measured using a two-week exchange time. The measured values are presented in Figure 6. The CEC values of both samples types increase as a function of saturation time in 100 % RH. After short saturation times, the CEC values of the initially air-dry samples are higher than the values of the dry samples. After two months’ saturation, equal values are obtained with air-dry and dried samples, however. The water ratio of the air-dry and dried samples was then increased to about 31 %. The effect of dispersion of the samples in water before adding [Cu(trien)]2+ solution was tested with air-dry MX-80 samples. First, 130 mg of bentonite and 2 g of water were weighed in experimental tubes. The bentonite was dispersed in 2 ml of water with ultrasound and allowed to stand for a week. Then 8 ml of 0.01 M [Cu(trien)]2+ solution was added and the samples were shaken for 1, 2, 7, and 14 days and the [Cu(trien)]2+ concentration in the solutions was determined. The CEC values of the samples as a function of exchange time are presented in Figure 7. The behaviour is almost similar to that shown in Figure 5 with the air-dry bentonite where wetting before [Cu(trien)]2+ addition was not used.
8
It can be concluded that drying in 105 oC decreases the measured CEC value and such a drying should be avoided. Both the wetting and exchange time affect the obtained result and they can partly replace each other. Approximately similar results are obtained using a) direct exchange of two weeks with [Cu(trien)]2+ solution or b) water saturation of a week followed by an exchange of a week.
y = 0.1495x
0.0
0.2
0.4
0.6
0.8
1.0
1.2
1.4
1.6
0 2 4 6 8 10 12
CuTrien (mmol/l)
Abs
orba
nce
6
7
8
9
10
pH
AbsorbancepH
Figure 4. Absorbance and pH of the calibration samples.
0.780.790.800.810.820.830.840.850.860.870.88
0 5 10 15
Exchange time (d)
CE
C (m
eq/g
)
DriedAir-dry
Figure 5. Measured CEC values of MX-80 as a function of exchange time. The samples were air-dry or dried at 105 oC.
9
0.80
0.81
0.82
0.83
0.84
0.85
0.86
0.87
0.88
0.89
0.90
0 10 20 30 40 50 60
Saturation time in 100% RH (d)
CEC
(meq
/g)
Air-dryDried
Figure 6. CEC of air-dry and dried MX-80 bentonites as a function of saturation time in 100 % RH. The cation exchange time was two weeks.
0.80
0.81
0.82
0.83
0.84
0.85
0.86
0.87
0.88
0.89
0.90
0 5 10 15
Exchange time (d)
CEC
(meq
/g)
Figure 7. CEC in MX-80 samples as a function of exchange time when the air-dry samples were first dispersed in 2 ml of deionized water for a week and then 8 ml of [Cu(trien)]2+ solution was added and the samples were exchanged for different times.
10
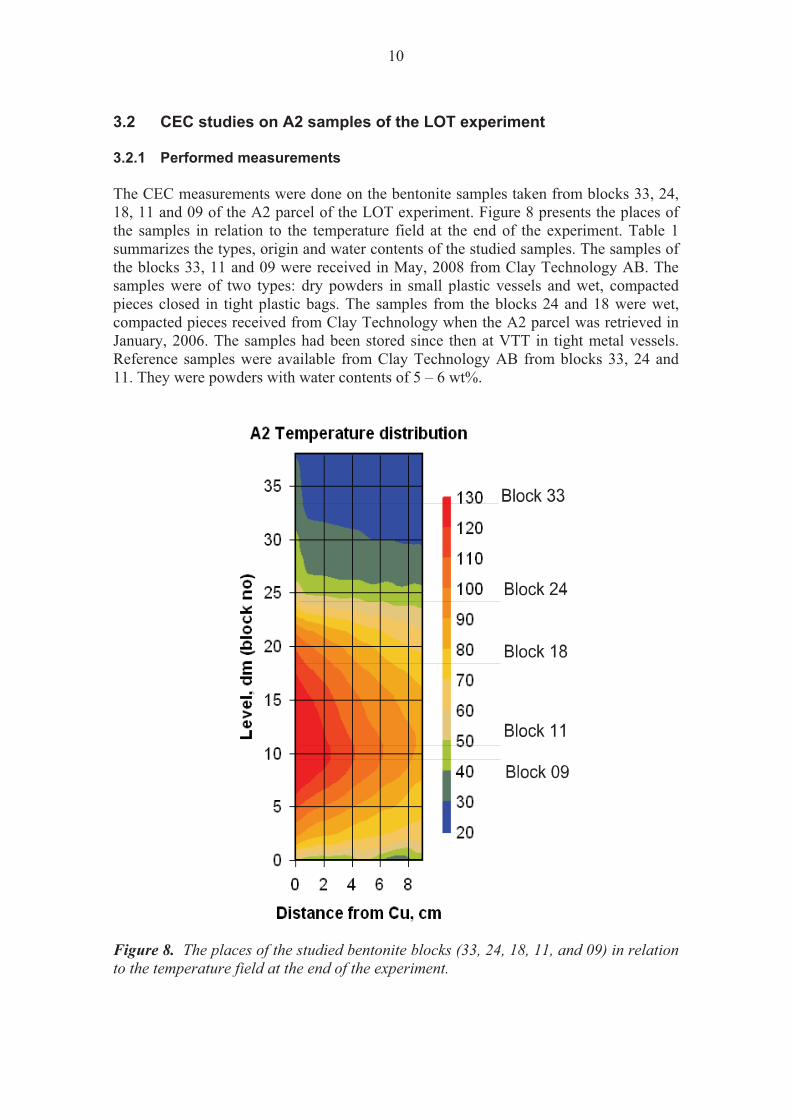
3.2 CEC studies on A2 samples of the LOT experiment 3.2.1 Performed measurements The CEC measurements were done on the bentonite samples taken from blocks 33, 24, 18, 11 and 09 of the A2 parcel of the LOT experiment. Figure 8 presents the places of the samples in relation to the temperature field at the end of the experiment. Table 1 summarizes the types, origin and water contents of the studied samples. The samples of the blocks 33, 11 and 09 were received in May, 2008 from Clay Technology AB. The samples were of two types: dry powders in small plastic vessels and wet, compacted pieces closed in tight plastic bags. The samples from the blocks 24 and 18 were wet, compacted pieces received from Clay Technology when the A2 parcel was retrieved in January, 2006. The samples had been stored since then at VTT in tight metal vessels. Reference samples were available from Clay Technology AB from blocks 33, 24 and 11. They were powders with water contents of 5 – 6 wt%.
Figure 8. The places of the studied bentonite blocks (33, 24, 18, 11, and 09) in relation to the temperature field at the end of the experiment.
11
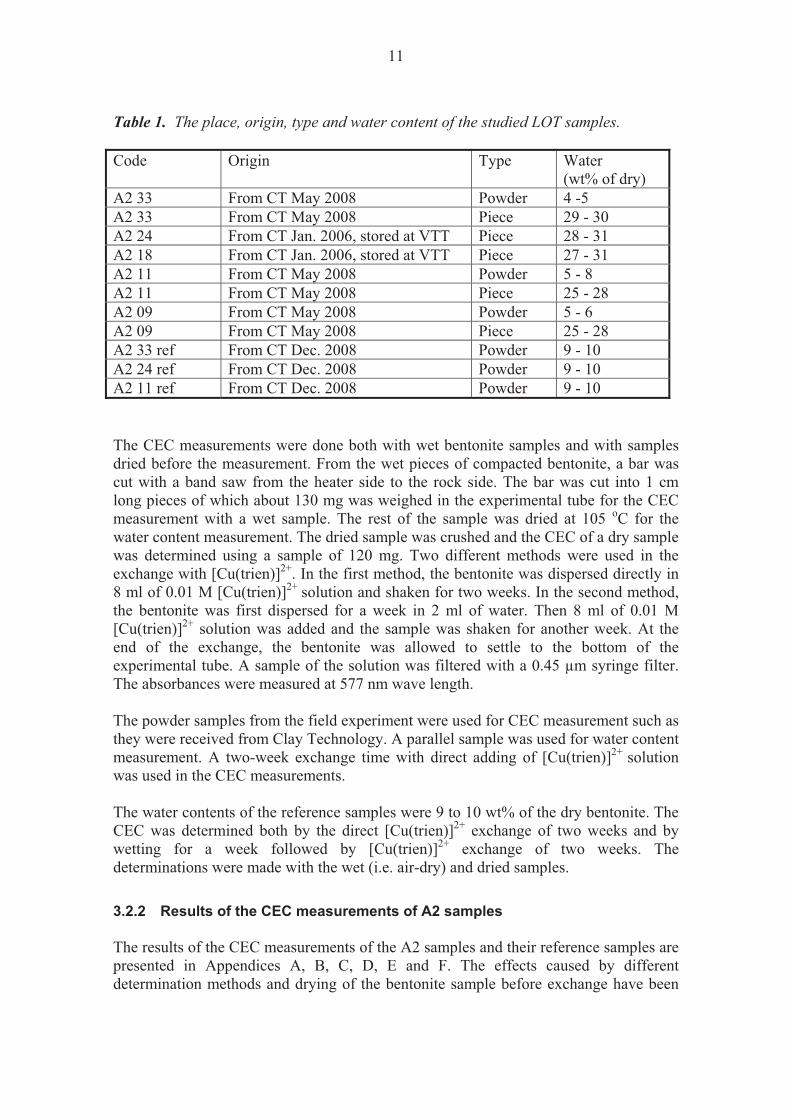
Table 1. The place, origin, type and water content of the studied LOT samples. Code Origin Type Water
(wt% of dry) A2 33 From CT May 2008 Powder 4 -5 A2 33 From CT May 2008 Piece 29 - 30 A2 24 From CT Jan. 2006, stored at VTT Piece 28 - 31 A2 18 From CT Jan. 2006, stored at VTT Piece 27 - 31 A2 11 From CT May 2008 Powder 5 - 8 A2 11 From CT May 2008 Piece 25 - 28 A2 09 From CT May 2008 Powder 5 - 6 A2 09 From CT May 2008 Piece 25 - 28 A2 33 ref From CT Dec. 2008 Powder 9 - 10 A2 24 ref From CT Dec. 2008 Powder 9 - 10 A2 11 ref From CT Dec. 2008 Powder 9 - 10 The CEC measurements were done both with wet bentonite samples and with samples dried before the measurement. From the wet pieces of compacted bentonite, a bar was cut with a band saw from the heater side to the rock side. The bar was cut into 1 cm long pieces of which about 130 mg was weighed in the experimental tube for the CEC measurement with a wet sample. The rest of the sample was dried at 105 oC for the water content measurement. The dried sample was crushed and the CEC of a dry sample was determined using a sample of 120 mg. Two different methods were used in the exchange with [Cu(trien)]2+. In the first method, the bentonite was dispersed directly in 8 ml of 0.01 M [Cu(trien)]2+ solution and shaken for two weeks. In the second method, the bentonite was first dispersed for a week in 2 ml of water. Then 8 ml of 0.01 M [Cu(trien)]2+ solution was added and the sample was shaken for another week. At the end of the exchange, the bentonite was allowed to settle to the bottom of the experimental tube. A sample of the solution was filtered with a 0.45 μm syringe filter. The absorbances were measured at 577 nm wave length. The powder samples from the field experiment were used for CEC measurement such as they were received from Clay Technology. A parallel sample was used for water content measurement. A two-week exchange time with direct adding of [Cu(trien)]2+ solution was used in the CEC measurements. The water contents of the reference samples were 9 to 10 wt% of the dry bentonite. The CEC was determined both by the direct [Cu(trien)]2+ exchange of two weeks and by wetting for a week followed by [Cu(trien)]2+ exchange of two weeks. The determinations were made with the wet (i.e. air-dry) and dried samples. 3.2.2 Results of the CEC measurements of A2 samples The results of the CEC measurements of the A2 samples and their reference samples are presented in Appendices A, B, C, D, E and F. The effects caused by different determination methods and drying of the bentonite sample before exchange have been
12
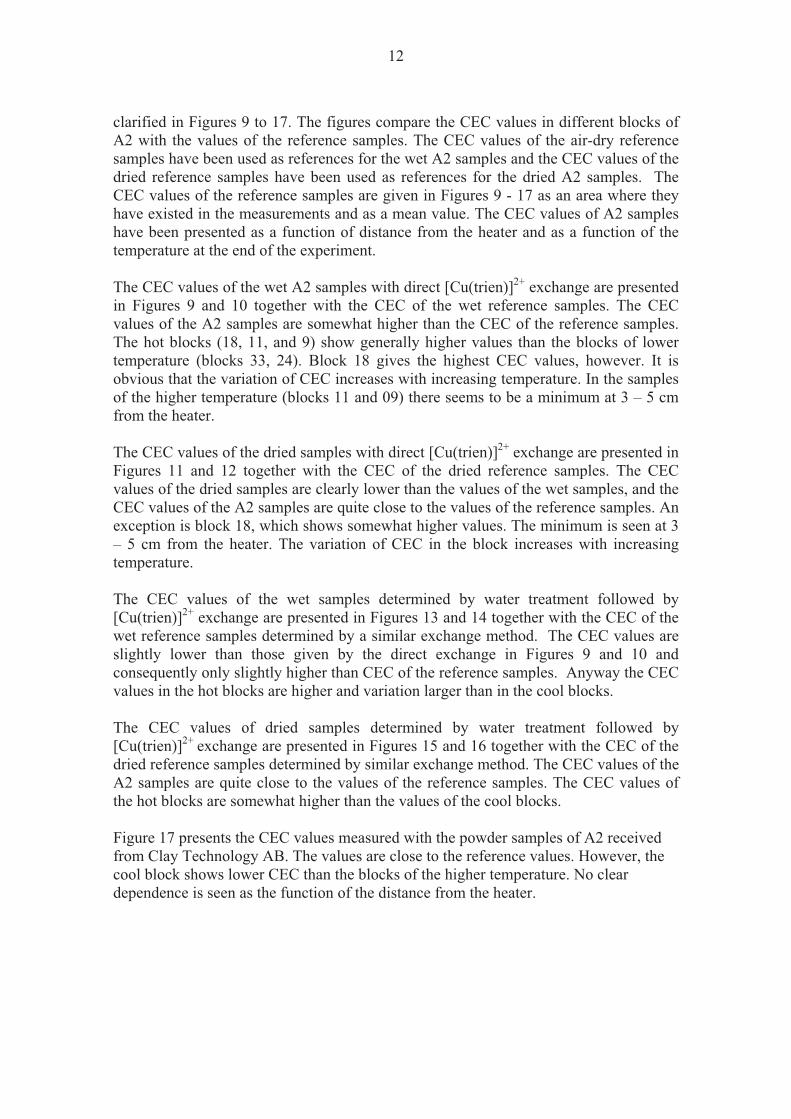
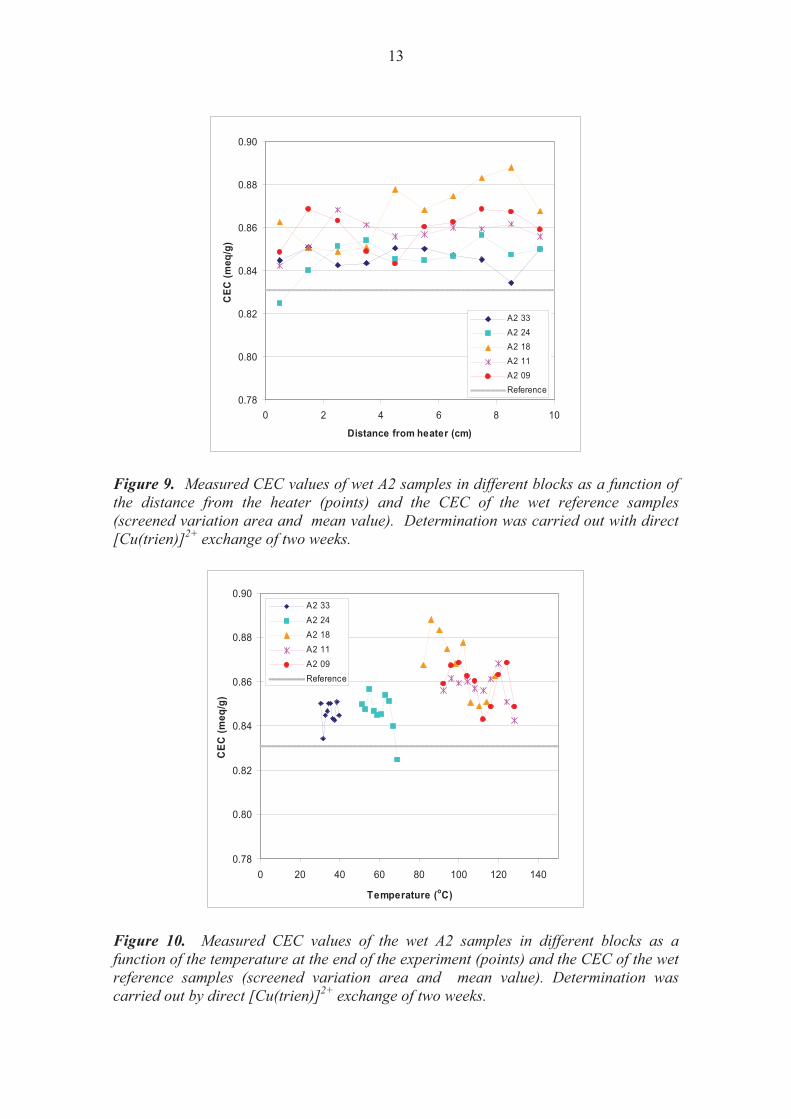
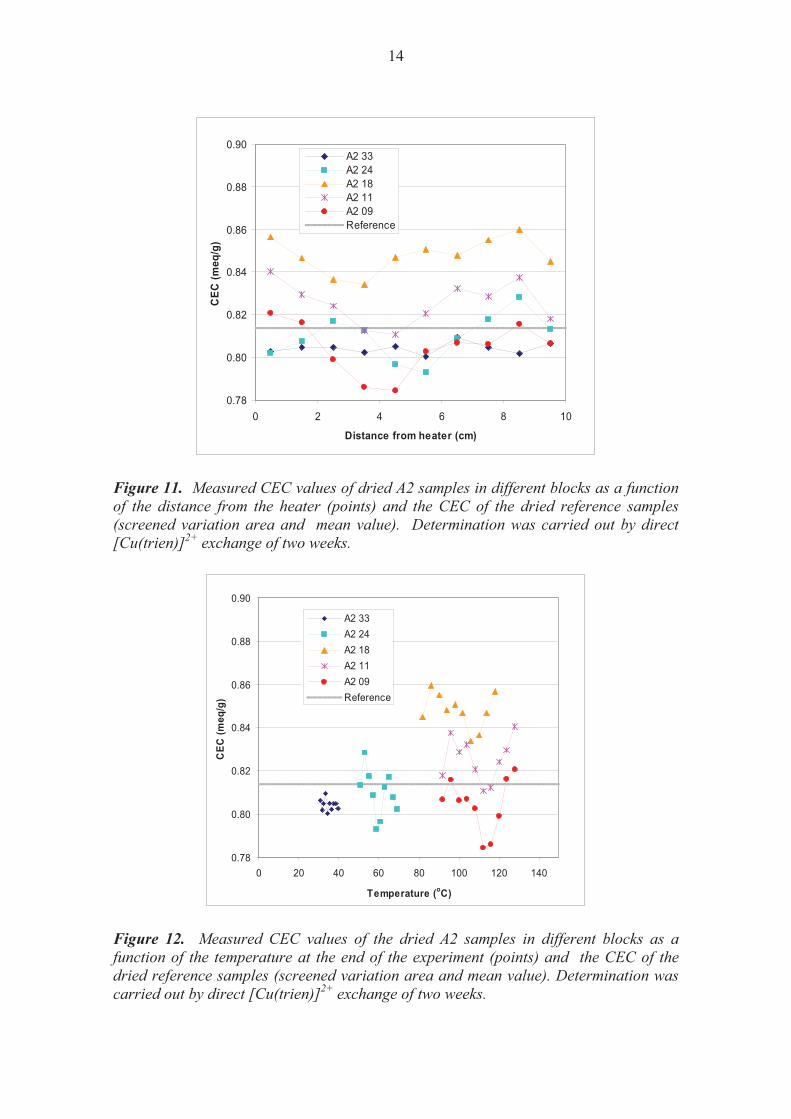
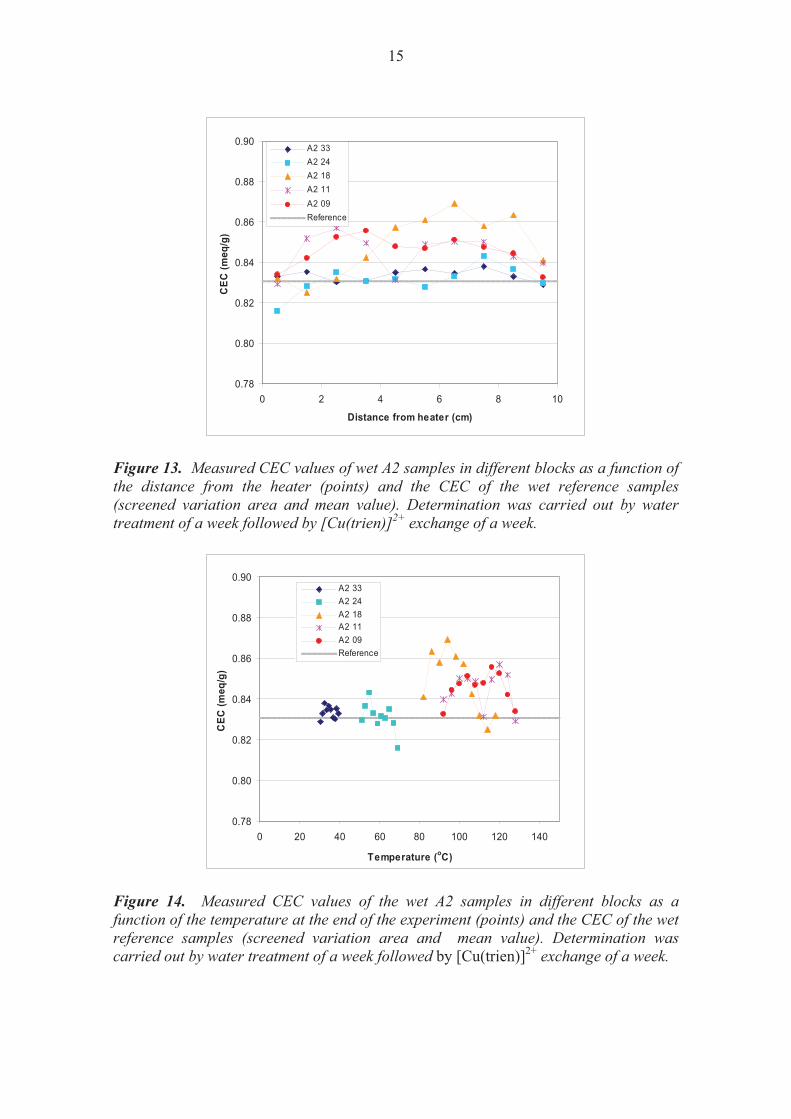
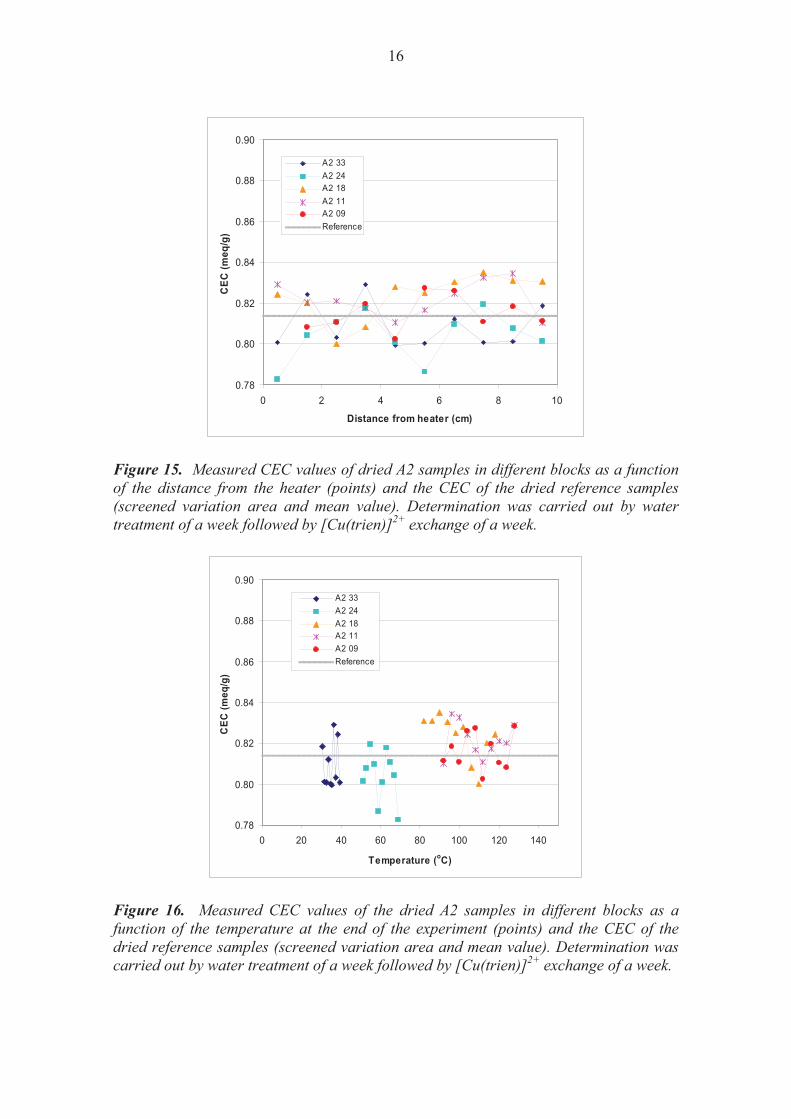
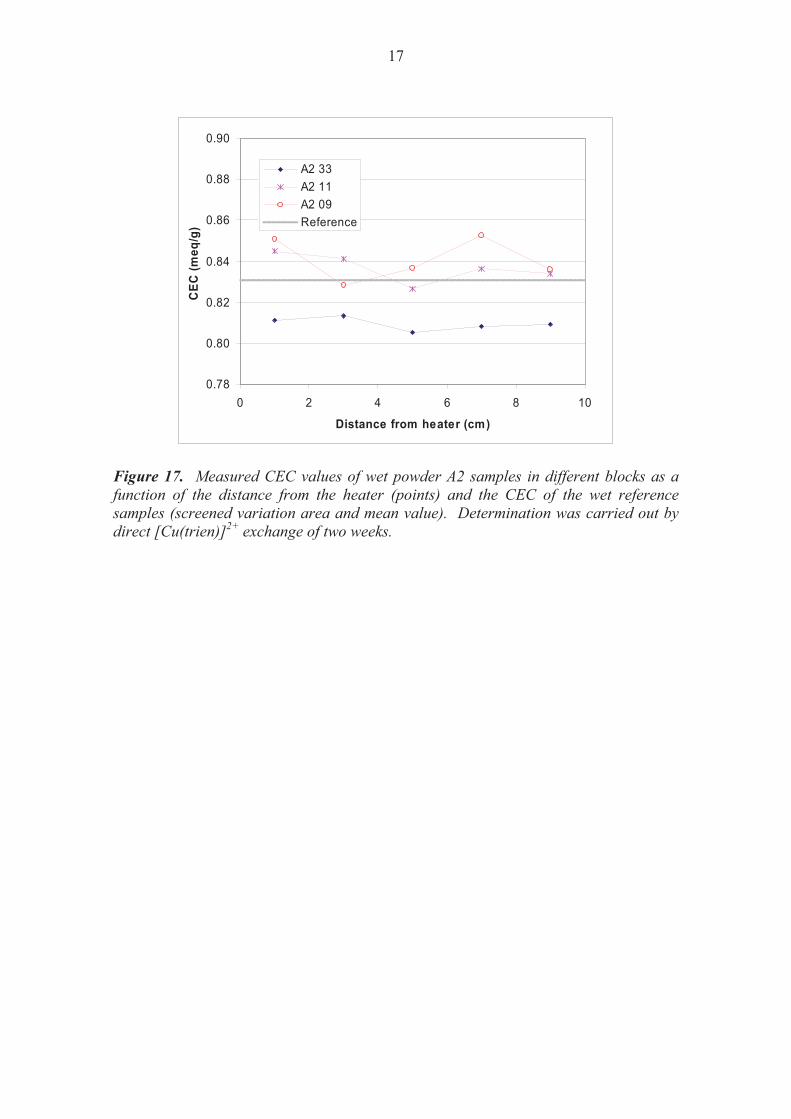
clarified in Figures 9 to 17. The figures compare the CEC values in different blocks of A2 with the values of the reference samples. The CEC values of the air-dry reference samples have been used as references for the wet A2 samples and the CEC values of the dried reference samples have been used as references for the dried A2 samples. The CEC values of the reference samples are given in Figures 9 - 17 as an area where they have existed in the measurements and as a mean value. The CEC values of A2 samples have been presented as a function of distance from the heater and as a function of the temperature at the end of the experiment. The CEC values of the wet A2 samples with direct [Cu(trien)]2+ exchange are presented in Figures 9 and 10 together with the CEC of the wet reference samples. The CEC values of the A2 samples are somewhat higher than the CEC of the reference samples. The hot blocks (18, 11, and 9) show generally higher values than the blocks of lower temperature (blocks 33, 24). Block 18 gives the highest CEC values, however. It is obvious that the variation of CEC increases with increasing temperature. In the samples of the higher temperature (blocks 11 and 09) there seems to be a minimum at 3 – 5 cm from the heater. The CEC values of the dried samples with direct [Cu(trien)]2+ exchange are presented in Figures 11 and 12 together with the CEC of the dried reference samples. The CEC values of the dried samples are clearly lower than the values of the wet samples, and the CEC values of the A2 samples are quite close to the values of the reference samples. An exception is block 18, which shows somewhat higher values. The minimum is seen at 3 – 5 cm from the heater. The variation of CEC in the block increases with increasing temperature. The CEC values of the wet samples determined by water treatment followed by [Cu(trien)]2+ exchange are presented in Figures 13 and 14 together with the CEC of the wet reference samples determined by a similar exchange method. The CEC values are slightly lower than those given by the direct exchange in Figures 9 and 10 and consequently only slightly higher than CEC of the reference samples. Anyway the CEC values in the hot blocks are higher and variation larger than in the cool blocks. The CEC values of dried samples determined by water treatment followed by [Cu(trien)]2+ exchange are presented in Figures 15 and 16 together with the CEC of the dried reference samples determined by similar exchange method. The CEC values of the A2 samples are quite close to the values of the reference samples. The CEC values of the hot blocks are somewhat higher than the values of the cool blocks. Figure 17 presents the CEC values measured with the powder samples of A2 received from Clay Technology AB. The values are close to the reference values. However, the cool block shows lower CEC than the blocks of the higher temperature. No clear dependence is seen as the function of the distance from the heater.
13
0.78
0.80
0.82
0.84
0.86
0.88
0.90
0 2 4 6 8 10
Distance from heater (cm)
CEC
(meq
/g)
A2 33A2 24A2 18A2 11A2 09Reference
Figure 9. Measured CEC values of wet A2 samples in different blocks as a function of the distance from the heater (points) and the CEC of the wet reference samples (screened variation area and mean value). Determination was carried out with direct [Cu(trien)]2+ exchange of two weeks.
0.78
0.80
0.82
0.84
0.86
0.88
0.90
0 20 40 60 80 100 120 140
Temperature (oC)
CEC
(meq
/g)
A2 33A2 24A2 18A2 11A2 09Reference
Figure 10. Measured CEC values of the wet A2 samples in different blocks as a function of the temperature at the end of the experiment (points) and the CEC of the wet reference samples (screened variation area and mean value). Determination was carried out by direct [Cu(trien)]2+ exchange of two weeks.
14
0.78
0.80
0.82
0.84
0.86
0.88
0.90
0 2 4 6 8 10
Distance from heater (cm)
CEC
(meq
/g)
A2 33A2 24A2 18A2 11A2 09Reference
Figure 11. Measured CEC values of dried A2 samples in different blocks as a function of the distance from the heater (points) and the CEC of the dried reference samples (screened variation area and mean value). Determination was carried out by direct [Cu(trien)]2+ exchange of two weeks.
0.78
0.80
0.82
0.84
0.86
0.88
0.90
0 20 40 60 80 100 120 140
Temperature (oC)
CEC
(meq
/g)
A2 33A2 24A2 18A2 11A2 09Reference
Figure 12. Measured CEC values of the dried A2 samples in different blocks as a function of the temperature at the end of the experiment (points) and the CEC of the dried reference samples (screened variation area and mean value). Determination was carried out by direct [Cu(trien)]2+ exchange of two weeks.
15
0.78
0.80
0.82
0.84
0.86
0.88
0.90
0 2 4 6 8 10
Distance from heater (cm)
CEC
(meq
/g)
A2 33A2 24A2 18A2 11A2 09Reference
Figure 13. Measured CEC values of wet A2 samples in different blocks as a function of the distance from the heater (points) and the CEC of the wet reference samples (screened variation area and mean value). Determination was carried out by water treatment of a week followed by [Cu(trien)]2+ exchange of a week.
0.78
0.80
0.82
0.84
0.86
0.88
0.90
0 20 40 60 80 100 120 140
Temperature (oC)
CEC
(meq
/g)
A2 33A2 24A2 18A2 11A2 09Reference
Figure 14. Measured CEC values of the wet A2 samples in different blocks as a function of the temperature at the end of the experiment (points) and the CEC of the wet reference samples (screened variation area and mean value). Determination was carried out by water treatment of a week followed by [Cu(trien)]2+ exchange of a week.
16
0.78
0.80
0.82
0.84
0.86
0.88
0.90
0 2 4 6 8 10
Distance from heater (cm)
CEC
(meq
/g)
A2 33A2 24A2 18A2 11A2 09Reference
Figure 15. Measured CEC values of dried A2 samples in different blocks as a function of the distance from the heater (points) and the CEC of the dried reference samples (screened variation area and mean value). Determination was carried out by water treatment of a week followed by [Cu(trien)]2+ exchange of a week.
0.78
0.80
0.82
0.84
0.86
0.88
0.90
0 20 40 60 80 100 120 140
Temperature (oC)
CEC
(meq
/g)
A2 33A2 24A2 18A2 11A2 09Reference
Figure 16. Measured CEC values of the dried A2 samples in different blocks as a function of the temperature at the end of the experiment (points) and the CEC of the dried reference samples (screened variation area and mean value). Determination was carried out by water treatment of a week followed by [Cu(trien)]2+ exchange of a week.
17
0.78
0.80
0.82
0.84
0.86
0.88
0.90
0 2 4 6 8 10
Distance from heater (cm)
CEC
(meq
/g)
A2 33A2 11A2 09Reference
Figure 17. Measured CEC values of wet powder A2 samples in different blocks as a function of the distance from the heater (points) and the CEC of the wet reference samples (screened variation area and mean value). Determination was carried out by direct [Cu(trien)]2+ exchange of two weeks.
18
4 DISCUSSION AND CONCLUSIONS Determination of cation exchange capacity (CEC) of bentonite was the topic of this study. The measurements were performed using [Cu(trien)]2+ as the index cation (Meier and Kahr 1999). The work started by testing the complex formation. Trietylenetetramine excess of 3 % appeared to give the maximum absorbance and was selected to be used in the measurements. The absorbances of [Cu(trien)]2+ solutions as a function of pH between 8 and 8.8 were practically constant. This is also the area where pH settled down in the CEC measurements with bentonite. The effects of the exchange time and drying and wetting of the sample were studied with air-dry and dried MX-80 bentonite. It can be concluded that drying of the bentonite at 105 oC decreases the measured CEC value. Both wetting and increasing of the exchange time increased the obtained CEC. Two different ways were used for the [Cu(trien)]2+ exchange of the samples of the LOT experiment. In the first method, about 0.12 g of bentonite was dispersed directly in 8 ml of 0.01 M [Cu(trien)]2+ and shaken for two weeks. In the second method, the bentonite was first dispersed for a week in 2 ml of water. Then 8 ml of 0.01 M [Cu(trien)]2+ was added and the sample was shaken for another week. At the end of the exchange, the bentonite was allowed to settle to the bottom of the experimental tube and a sample of the solution was filtered with a 0.45 μm syringe filter. The absorbances were measured at 577 nm wave length. The CEC measurements were carried out on the bentonite samples taken from the blocks 33, 24, 18, 11 and 09 of the parcel A2 of the LOT experiment. The measurements were performed both with wet bentonite samples and with samples dried and crushed before the measurement. The CEC values of the LOT samples were compared with those of the reference samples taken from the same batch before the compaction of the blocks used in the LOT experiment. Reference samples were available from the blocks 33, 24 and 11. They were air-dry powders with a water ratio of 9 to 10 wt%. The air-dry reference samples were used as references for the wet LOT samples and the dried reference samples for the dried LOT samples. The CEC measurements with wet samples using direct [Cu(trien)]2+ exchange gave the highest values, i.e. the most complete exchange. The exchange using wetting for a week followed by CuTrien exchange of a week gave slightly lower values. The CEC values determined with dried samples were clearly lower than the values with the wet samples. During drying, the montmorillonite in the bentonite collapses and its opening needs a long water saturation to be complete. It is also possible that cementation occurs during drying, which closes the interlamellar spaces thus slowing down the exchange process. Even the exchange time of two weeks seems not to be able to complete the exchange of the dried samples. The CEC values determined by different methods are thus not comparable with each other. Because the direct [Cu(trien)]2+ exchange with wet samples gave the most complete cation exchange in the CEC measurement, the conclusions about the A2 samples have been drawn on the basis of those results. The CEC values of the A2 samples were
19
somewhat higher than the CEC values of the reference samples. This concerned also the samples of the low-temperature blocks. The CEC values of the hot blocks (18, 11, and 9) were higher than the values of the blocks of lower temperature (blocks 33, 24). It was also obvious that the variation of CEC increased with increasing temperature. There seems to be a CEC minimum at 3 – 5 cm from the heater. Changes have occurred in the bentonite during the experiment and these appear as small changes in the CEC measurement.
20
REFERENCES Amman, L. 2003. Cation exchange and adsorption on clays and clay minerals. Thesis, University of Kiel, Germany. Amman, L., Bergaya, F., Lagaly, G. 2005. Determination of the cation exchange capacity of clays with copper complexes revisited. Clay Minerals 40, 441 – 453. Baeyens, B., Bradbury, M. 1997. A mechanistic description of Ni and Zn sorption on Na-montmorillonite. Part I: Titration and sorption measurements. Journal of Contaminant Hydrology 27, 199-222. Bergaya, F., Lagaly, G., Vayer, M. 2006. Cation and anion exchange. In: Bergaya, F., Theng, B.K.G., Lagaly, G. (eds) 2006. Handbook of clay science. Elsevier Ltd., Netherlands, p. 979 – 995. Bergaya, F., Vayer, M. 1997. CEC of clays: measurement by adsorption of a copper ethylenediamine complex. Applied clay science 12, 275 – 280. Meier, L., Kahr, G. 1999. Determination of cation exchange capacity (CEC) of clay minerals using the complexes of copper (II) ion with triethylenetetramine and tetraethylenepentamine. Clays and Clay Minerals 47, 386 – 388.
21
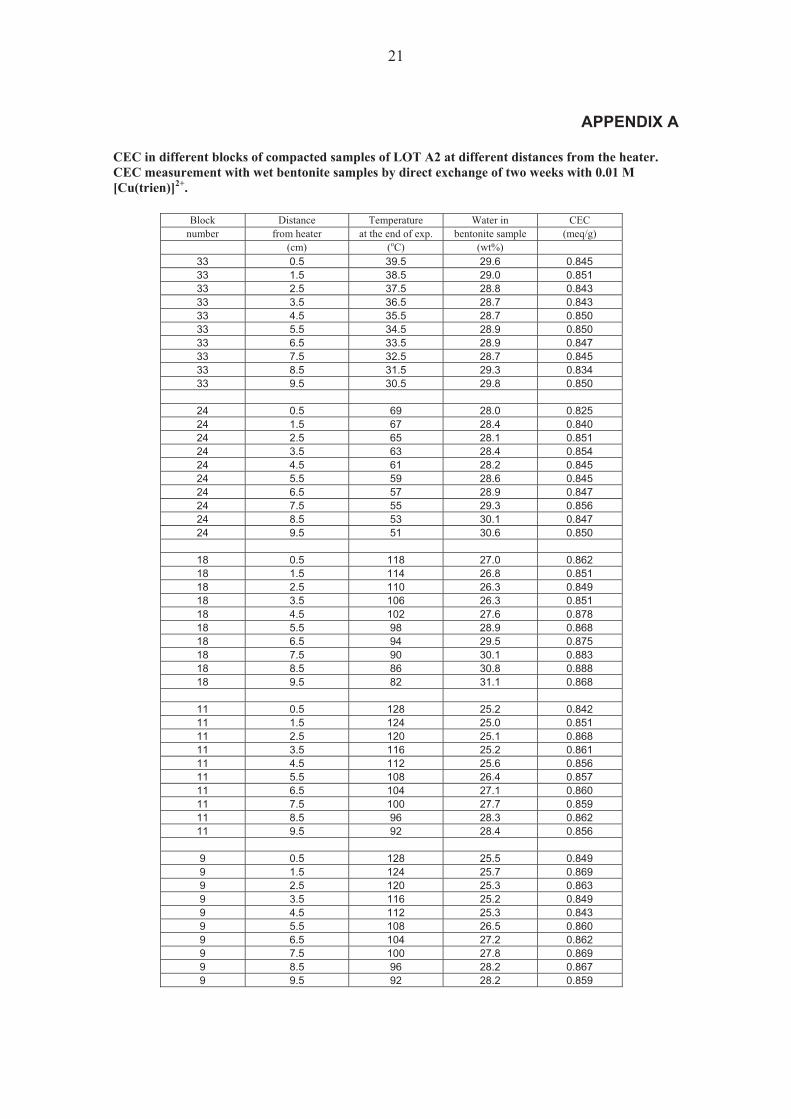
APPENDIX A
CEC in different blocks of compacted samples of LOT A2 at different distances from the heater. CEC measurement with wet bentonite samples by direct exchange of two weeks with 0.01 M [Cu(trien)]2+.
Block Distance Temperature Water in CEC number from heater at the end of exp. bentonite sample (meq/g)
(cm) (oC) (wt%) 33 0.5 39.5 29.6 0.845 33 1.5 38.5 29.0 0.851 33 2.5 37.5 28.8 0.843 33 3.5 36.5 28.7 0.843 33 4.5 35.5 28.7 0.850 33 5.5 34.5 28.9 0.850 33 6.5 33.5 28.9 0.847 33 7.5 32.5 28.7 0.845 33 8.5 31.5 29.3 0.834 33 9.5 30.5 29.8 0.850
24 0.5 69 28.0 0.825 24 1.5 67 28.4 0.840 24 2.5 65 28.1 0.851 24 3.5 63 28.4 0.854 24 4.5 61 28.2 0.845 24 5.5 59 28.6 0.845 24 6.5 57 28.9 0.847 24 7.5 55 29.3 0.856 24 8.5 53 30.1 0.847 24 9.5 51 30.6 0.850
18 0.5 118 27.0 0.862 18 1.5 114 26.8 0.851 18 2.5 110 26.3 0.849 18 3.5 106 26.3 0.851 18 4.5 102 27.6 0.878 18 5.5 98 28.9 0.868 18 6.5 94 29.5 0.875 18 7.5 90 30.1 0.883 18 8.5 86 30.8 0.888 18 9.5 82 31.1 0.868
11 0.5 128 25.2 0.842 11 1.5 124 25.0 0.851 11 2.5 120 25.1 0.868 11 3.5 116 25.2 0.861 11 4.5 112 25.6 0.856 11 5.5 108 26.4 0.857 11 6.5 104 27.1 0.860 11 7.5 100 27.7 0.859 11 8.5 96 28.3 0.862 11 9.5 92 28.4 0.856
9 0.5 128 25.5 0.849 9 1.5 124 25.7 0.869 9 2.5 120 25.3 0.863 9 3.5 116 25.2 0.849 9 4.5 112 25.3 0.843 9 5.5 108 26.5 0.860 9 6.5 104 27.2 0.862 9 7.5 100 27.8 0.869 9 8.5 96 28.2 0.867 9 9.5 92 28.2 0.859
22
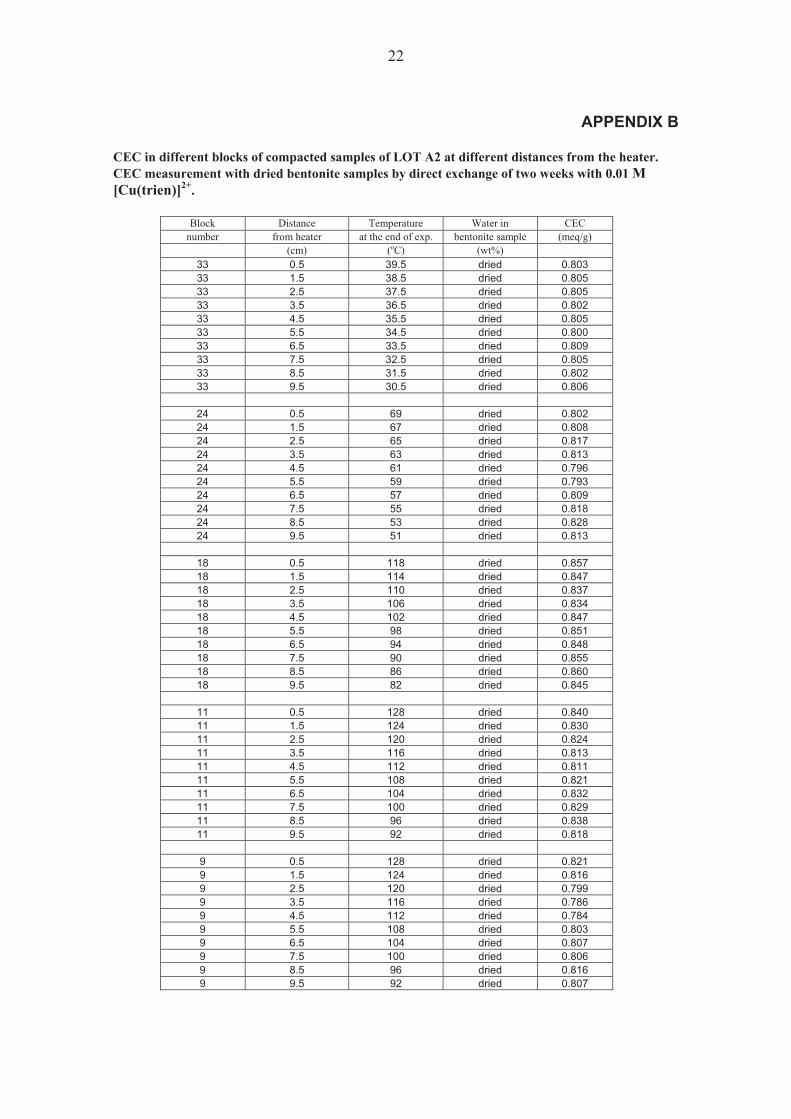
APPENDIX B CEC in different blocks of compacted samples of LOT A2 at different distances from the heater. CEC measurement with dried bentonite samples by direct exchange of two weeks with 0.01 M [Cu(trien)]2+.
Block Distance Temperature Water in CEC number from heater at the end of exp. bentonite sample (meq/g)
(cm) (oC) (wt%) 33 0.5 39.5 dried 0.803 33 1.5 38.5 dried 0.805 33 2.5 37.5 dried 0.805 33 3.5 36.5 dried 0.802 33 4.5 35.5 dried 0.805 33 5.5 34.5 dried 0.800 33 6.5 33.5 dried 0.809 33 7.5 32.5 dried 0.805 33 8.5 31.5 dried 0.802 33 9.5 30.5 dried 0.806
24 0.5 69 dried 0.802 24 1.5 67 dried 0.808 24 2.5 65 dried 0.817 24 3.5 63 dried 0.813 24 4.5 61 dried 0.796 24 5.5 59 dried 0.793 24 6.5 57 dried 0.809 24 7.5 55 dried 0.818 24 8.5 53 dried 0.828 24 9.5 51 dried 0.813
18 0.5 118 dried 0.857 18 1.5 114 dried 0.847 18 2.5 110 dried 0.837 18 3.5 106 dried 0.834 18 4.5 102 dried 0.847 18 5.5 98 dried 0.851 18 6.5 94 dried 0.848 18 7.5 90 dried 0.855 18 8.5 86 dried 0.860 18 9.5 82 dried 0.845
11 0.5 128 dried 0.840 11 1.5 124 dried 0.830 11 2.5 120 dried 0.824 11 3.5 116 dried 0.813 11 4.5 112 dried 0.811 11 5.5 108 dried 0.821 11 6.5 104 dried 0.832 11 7.5 100 dried 0.829 11 8.5 96 dried 0.838 11 9.5 92 dried 0.818
9 0.5 128 dried 0.821 9 1.5 124 dried 0.816 9 2.5 120 dried 0.799 9 3.5 116 dried 0.786 9 4.5 112 dried 0.784 9 5.5 108 dried 0.803 9 6.5 104 dried 0.807 9 7.5 100 dried 0.806 9 8.5 96 dried 0.816 9 9.5 92 dried 0.807
23
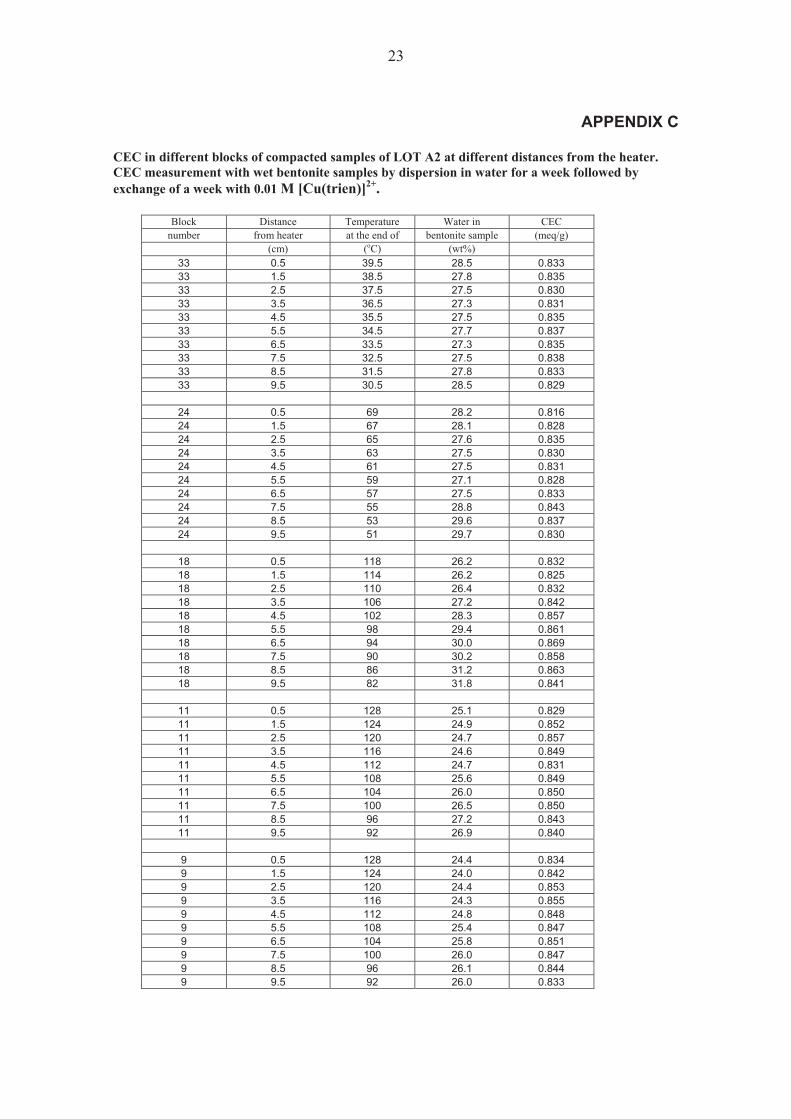
APPENDIX C
CEC in different blocks of compacted samples of LOT A2 at different distances from the heater. CEC measurement with wet bentonite samples by dispersion in water for a week followed by exchange of a week with 0.01 M [Cu(trien)]2+.
Block Distance Temperature Water in CEC number from heater at the end of bentonite sample (meq/g)
(cm) (oC) (wt%) 33 0.5 39.5 28.5 0.833 33 1.5 38.5 27.8 0.835 33 2.5 37.5 27.5 0.830 33 3.5 36.5 27.3 0.831 33 4.5 35.5 27.5 0.835 33 5.5 34.5 27.7 0.837 33 6.5 33.5 27.3 0.835 33 7.5 32.5 27.5 0.838 33 8.5 31.5 27.8 0.833 33 9.5 30.5 28.5 0.829
24 0.5 69 28.2 0.816 24 1.5 67 28.1 0.828 24 2.5 65 27.6 0.835 24 3.5 63 27.5 0.830 24 4.5 61 27.5 0.831 24 5.5 59 27.1 0.828 24 6.5 57 27.5 0.833 24 7.5 55 28.8 0.843 24 8.5 53 29.6 0.837 24 9.5 51 29.7 0.830
18 0.5 118 26.2 0.832 18 1.5 114 26.2 0.825 18 2.5 110 26.4 0.832 18 3.5 106 27.2 0.842 18 4.5 102 28.3 0.857 18 5.5 98 29.4 0.861 18 6.5 94 30.0 0.869 18 7.5 90 30.2 0.858 18 8.5 86 31.2 0.863 18 9.5 82 31.8 0.841
11 0.5 128 25.1 0.829 11 1.5 124 24.9 0.852 11 2.5 120 24.7 0.857 11 3.5 116 24.6 0.849 11 4.5 112 24.7 0.831 11 5.5 108 25.6 0.849 11 6.5 104 26.0 0.850 11 7.5 100 26.5 0.850 11 8.5 96 27.2 0.843 11 9.5 92 26.9 0.840
9 0.5 128 24.4 0.834 9 1.5 124 24.0 0.842 9 2.5 120 24.4 0.853 9 3.5 116 24.3 0.855 9 4.5 112 24.8 0.848 9 5.5 108 25.4 0.847 9 6.5 104 25.8 0.851 9 7.5 100 26.0 0.847 9 8.5 96 26.1 0.844 9 9.5 92 26.0 0.833
24
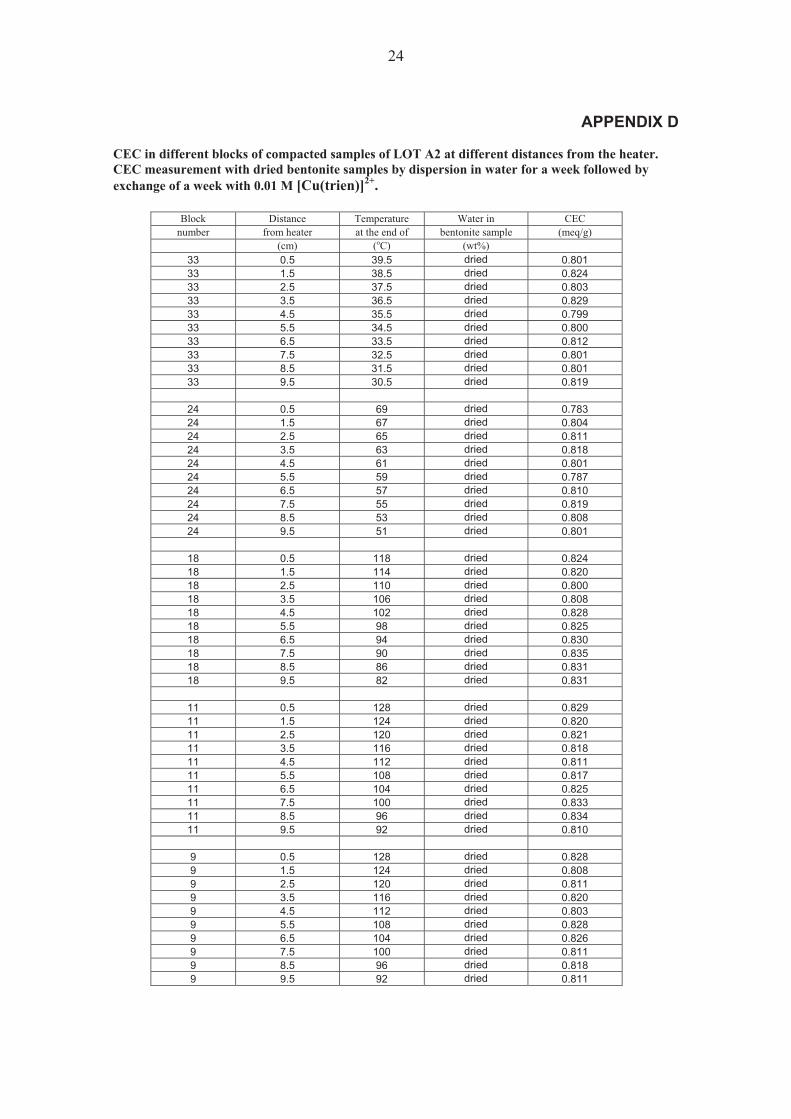
APPENDIX D CEC in different blocks of compacted samples of LOT A2 at different distances from the heater. CEC measurement with dried bentonite samples by dispersion in water for a week followed by exchange of a week with 0.01 M [Cu(trien)]2+.
Block Distance Temperature Water in CEC number from heater at the end of bentonite sample (meq/g)
(cm) (oC) (wt%) 33 0.5 39.5 dried 0.801 33 1.5 38.5 dried 0.824 33 2.5 37.5 dried 0.803 33 3.5 36.5 dried 0.829 33 4.5 35.5 dried 0.799 33 5.5 34.5 dried 0.800 33 6.5 33.5 dried 0.812 33 7.5 32.5 dried 0.801 33 8.5 31.5 dried 0.801 33 9.5 30.5 dried 0.819
24 0.5 69 dried 0.783 24 1.5 67 dried 0.804 24 2.5 65 dried 0.811 24 3.5 63 dried 0.818 24 4.5 61 dried 0.801 24 5.5 59 dried 0.787 24 6.5 57 dried 0.810 24 7.5 55 dried 0.819 24 8.5 53 dried 0.808 24 9.5 51 dried 0.801
18 0.5 118 dried 0.824 18 1.5 114 dried 0.820 18 2.5 110 dried 0.800 18 3.5 106 dried 0.808 18 4.5 102 dried 0.828 18 5.5 98 dried 0.825 18 6.5 94 dried 0.830 18 7.5 90 dried 0.835 18 8.5 86 dried 0.831 18 9.5 82 dried 0.831
11 0.5 128 dried 0.829 11 1.5 124 dried 0.820 11 2.5 120 dried 0.821 11 3.5 116 dried 0.818 11 4.5 112 dried 0.811 11 5.5 108 dried 0.817 11 6.5 104 dried 0.825 11 7.5 100 dried 0.833 11 8.5 96 dried 0.834 11 9.5 92 dried 0.810
9 0.5 128 dried 0.828 9 1.5 124 dried 0.808 9 2.5 120 dried 0.811 9 3.5 116 dried 0.820 9 4.5 112 dried 0.803 9 5.5 108 dried 0.828 9 6.5 104 dried 0.826 9 7.5 100 dried 0.811 9 8.5 96 dried 0.818 9 9.5 92 dried 0.811
25
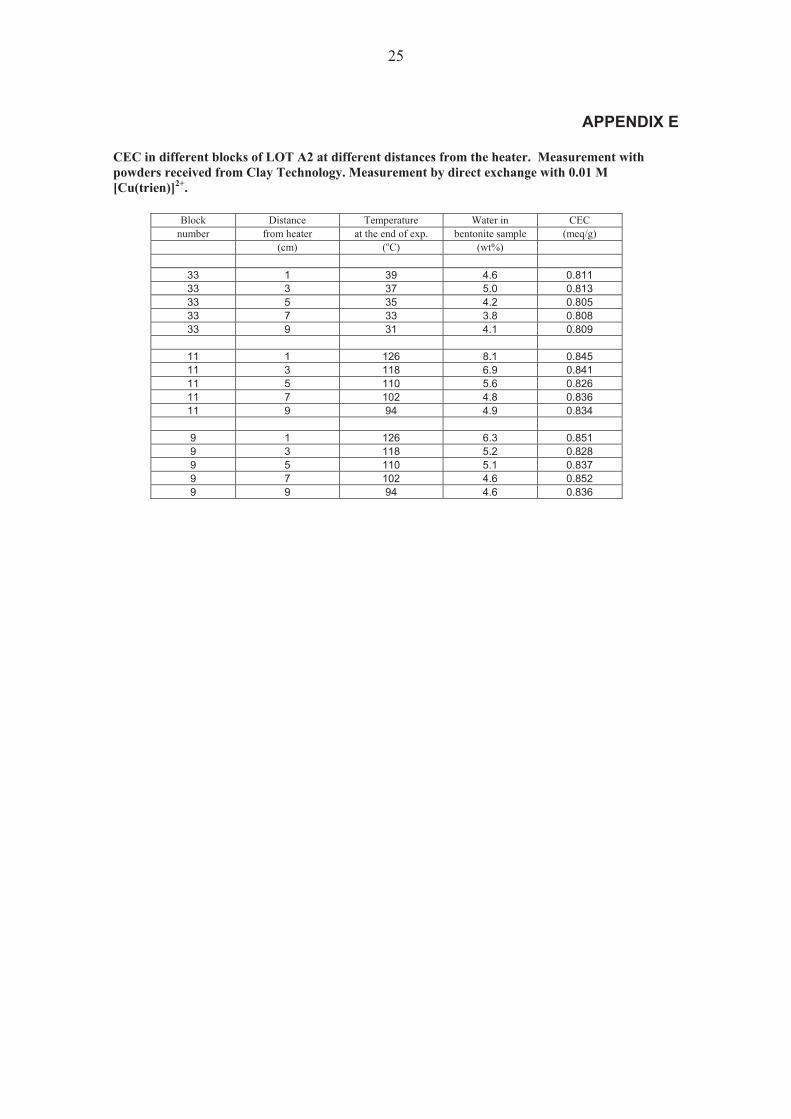
APPENDIX E
CEC in different blocks of LOT A2 at different distances from the heater. Measurement with powders received from Clay Technology. Measurement by direct exchange with 0.01 M [Cu(trien)]2+.
Block Distance Temperature Water in CEC number from heater at the end of exp. bentonite sample (meq/g)
(cm) (oC) (wt%)
33 1 39 4.6 0.811 33 3 37 5.0 0.813 33 5 35 4.2 0.805 33 7 33 3.8 0.808 33 9 31 4.1 0.809
11 1 126 8.1 0.845 11 3 118 6.9 0.841 11 5 110 5.6 0.826 11 7 102 4.8 0.836 11 9 94 4.9 0.834
9 1 126 6.3 0.851 9 3 118 5.2 0.828 9 5 110 5.1 0.837 9 7 102 4.6 0.852 9 9 94 4.6 0.836
26
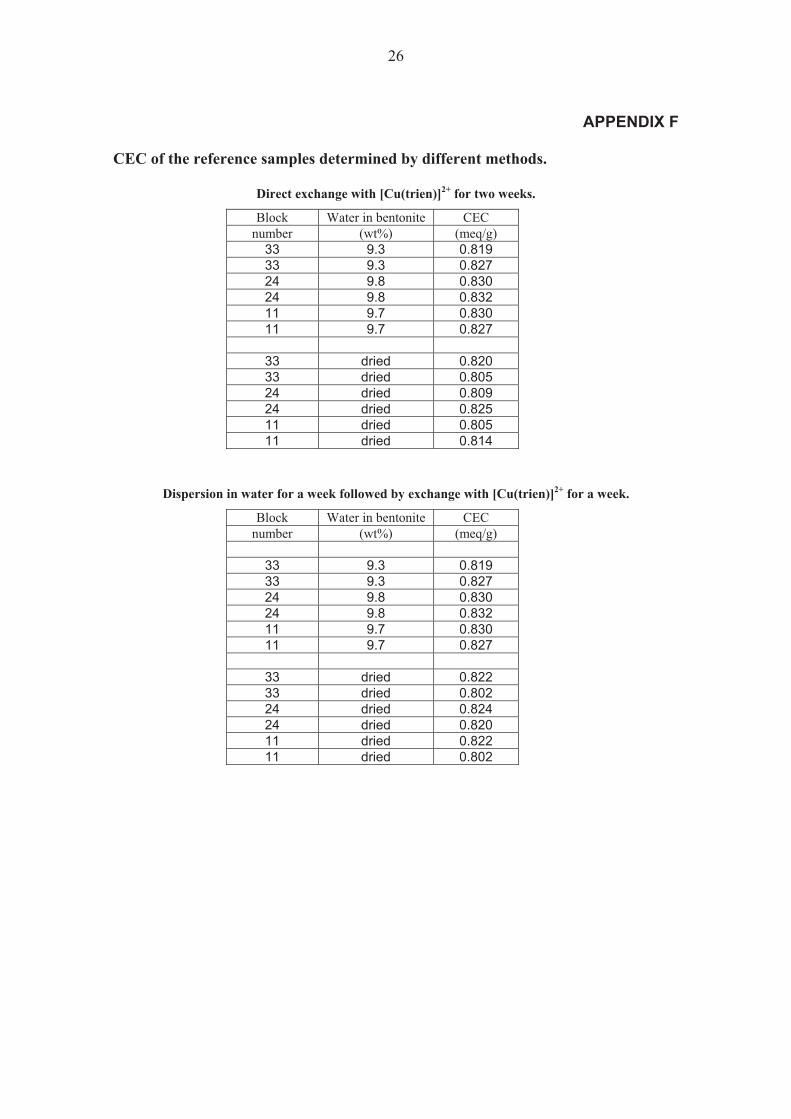
APPENDIX F CEC of the reference samples determined by different methods.
Direct exchange with [Cu(trien)]2+ for two weeks.
Block Water in bentonite CEC number (wt%) (meq/g)
33 9.3 0.819 33 9.3 0.827 24 9.8 0.830 24 9.8 0.832 11 9.7 0.830 11 9.7 0.827
33 dried 0.820 33 dried 0.805 24 dried 0.809 24 dried 0.825 11 dried 0.805 11 dried 0.814
Dispersion in water for a week followed by exchange with [Cu(trien)]2+ for a week. Block Water in bentonite CEC
number (wt%) (meq/g)
33 9.3 0.819 33 9.3 0.827 24 9.8 0.830 24 9.8 0.832 11 9.7 0.830 11 9.7 0.827
33 dried 0.822 33 dried 0.802 24 dried 0.824 24 dried 0.820 11 dried 0.822 11 dried 0.802