Embed Size (px)
Citation preview

1
1
Michael Kleinberg, Nicole Segal, Karen Miu
On Measurements’ Role in Supporting Capacitor Control
Center for Electric Power EngineeringDepartment of Electrical and Computer Engineering
Drexel University Philadelphia, PA 19104, USA
Supported by:DOE SGIG: PPL Keystone Smart Distribution
DOD ONR: Remote, Non-Destructive Testing of Large-Scale Power Systems
EAPAMarch 25, 2014
2
Outline
• Background
• Emerging System Conditions
• Proposed Role of Measurements– Generator and Reactive Power Domains
• Focus Application: Capacitor Control for VSR– Centralized vs. Distributed Control
• Simulation Results
• Discussion & Summary

2
3
Background (1/4)
• Background Experience
– Work with NSF, DOD – ONR, DOE
– Work with PPL Electric Utilities
• Background (of this Talk!): EAPA Sept 25, 2012
– “Practically Driven, Analytically Based Capacitor Control
Methods” : generating feasible sequences between load levels
– Secondary topic: centralized vs. distributed control
today’s focus applications
4
Background (2/4)
• Measurements will directly support distribution system analysis
– Increased data (loads, in-line/feeder measurements)
– Enables power system state estimation/analysis
– Updated system level information allows for improved system
optimization
• Computational Control Tools
– Adapt to new operating conditions *
– Repeatable, fast, offer playback

3
5
Background (3/4)
• Open Questions
– What types of information do we need? (units: V, A, VA, etc.)
– How much data/information is necessary for a control decision?
(units: MB, bandwidth)
– How often should we make control decisions? Leading to how
often should we acquire data (units: min/hrs)
– What other conditions trigger us to make control decisions?
Leading to when should we be aware of the info. (units: switch
statuses, V, A, VA, etc.)
6
Background (4/4)
• Common Capacitor Control Objectives:
– Support voltage regulation
– Achieve network loss reduction
– Perform power factor correction
• Energy efficiency measures and legislation
– Reduce network level energy consumption
• Renewed interest in conservation voltage reduction (CVR) via
Voltage Spread Reduction (VSR)

4
7
LegendSectionalizing SwitchTie Switch
Substation/DG
Load
Transformer
Capacitor Bank
Measurement
Emerging System Conditions (1/2)
• System components are being embedded with intelligent controllers and remote actuation capabilities
• These components include:
• An embedded information layer allows devices to communicate over new and existing telecommunication infrastructure
• This enables a shift from:
local and/or pre-set operation schemes
online optimization and control
Figure 1: Single line diagram of an example 22 bus distribution system
– feeder capacitor banks – sectionalizing switches
– distribution generation– controllable loads
7
8
• Power injections increasingly varied
– Distributed generation
– Direct load control and demand side management participation
levels still evolving
• Online optimization/quasi-steady state applications
– Capacitor operating goals and “real-time” do not nec. align
– Although objectives/time-frame distinct from switching/service
restoration goals, capacitor actions may need to be tied to them
Emerging System Operation (2/2)

5
9
Proposed Role of Measurements (1/3)
• Enable adaptive control
• Develop updated distribution power injection/load patterns and
forecasting
• Define areas of influence (domains) for:
– Capacitors (voltage regulation) Feb 2014 IEEE Trans on Power Systems
– Distributed generators (economic impacts)
May 2005 IEEE Trans on Power Systems
10
Proposed Role of Measurements (2/3)
• How many measurements?
– Bad data filtering – historically
performed via “expected” vs.
sensed values
– Organize distribution system into
control areas
• Automatically triggered alerts
– Power/electrical thresholds to vet
data vs. only time intervals
– Area (goal-oriented) alerts vs.
local measurement alerts
Figure 2: Single line diagram example 20 bus system

6
11
• Defined and adjust areas to reflect changing operating conditions
• Areas can then be used to ID which subset of measurements are critical to re-evaluating control options
Proposed Role of Measurements (3/3)
Figure 3: Reactive power domains and commons
12
• Generators: real power domains can be identified
• Capacitors: reactive power domains depend on:
– capacitor location
– capacitor size
– network component parameters
– load distribution
– distributed generator inputs
Partitioning Methodology (1/10)

7
13
Positive Power Flow Direction (2/10)
• Used to “trace” reactive power flows back to a generator, capacitor, or substation
Figure 4: Arrows indicate positive reactive power flow direction on phase a
14
1 2 4 5
3 15 16 17 18
19 20
12 13 14
6 7 8 9 10 11
Common 1
C2
C1
Reactive Power Domains (3/10)
• Common: contiguous set of branches and nodes supplied by same source
Figure 5: Common 1 sub-system supplied by capacitor C1

8
15
1 2 4 5
3 15 16 17 18
19 20
12 13 14
6 7 8 9 10 11
Common 2
C2
C1
• Loss on a branch or load at a node may be supplied by multiple sources
Reactive Power Domains (4/10)
Figure 6: Common 2 sub-system supplied by C1 and the substation
16
1 2 4 5
3 15 16 17 18
19 20
12 13 14
6 7 8 9 10 11
Common 1
Common 2
C2
C1
C1 Domain
• Domain: set of all commons attributed to a specific source
Reactive Power Domains (5/10)
Figure 7: Domain of capacitor C1: Common 1 and Common 2

9
17
1 2 4 5
3 15 16 17 18
19 20
12 13 14
6 7 8 9 10 11
Common 3
C2
C1
• Similar treatment for other sources:
Reactive Power Domains (6/10)
Figure 8: Common 3 sub-system supplied by capacitor C2
18
1 2 4 5
3 15 16 17 18
19 20
12 13 14
6 7 8 9 10 11
Common 4
C2
C1
18
Common 4 supplied by capacitor C2 and the substation
Reactive Power Domains (7/10)
Figure 9: Common 4 sub-system supplied by C2 and the substation

10
19
1 2 4 5
3 15 16 17 18
19 20
12 13 14
6 7 8 9 10 11
Common 3
Common 4
C2
C1
C1 Domain
C2 Domain
19
Domain of Capacitor C2: Common 3 and Common 4
Reactive Power Domains (8/10)
Figure 10: Domain of capacitor C2: Common 3 and Common 4
20
Figure 11: Substation Domain: Common 2, 4 & 5
Domain of Substation: Common 2, Common 4, and Common 5
Reactive Power Domains (9/10)

11
21
Partitioned Test System (10/10)
• Distributed analysis employed to estimate state within each control area• 2007 - M. Kleinberg, K. Miu, C. Nwankpa, “Distributed multi-phase distribution power
flow” Trans. of the Society for Modeling and Simulation International
Figure 12: Test system partitioned based on capacitor reactive power domains
Equivalent load buses
Equivalent source buses
22
Focus Application: Capacitor Control for VSR

12
Problem Formulation
• Capacitor control employed to support voltage regulation
• Centralized control formulated as mixed integer, non-linear constrained optimization problem
• Assumption: maximum voltage deviations occur with respect to substation voltage
• Simplified objective function considered for performing initial studies
2

13
Centralized Control Formulation
• Centralized control problem formulation stated as:
0, ,
, ,
min max p
ref
p
j measu U j M
p a b c
V V
( , , ) 0f V u max , , ,p
k kI I k N p a b c
2 2 max 2( ) l l l
P Q S l F
min max , , ,p
k k kV V V k N p a b c
subject to:(2) three-phase power flow
(3) feeder current limits
(4) feeder loading limits
(5) voltage magnitudes limits
(1) minimize voltage spread
set of feeders, buses, and voltage measurements, , :F N M
0,:p
refV
capacitor control scheme
specified substation voltage magnitude, phase p
:u
,:p
j refV voltage magnitude measurement, bus j, phase p
where:
2
Centralized vs. Distributed Control
• Centralized Control
– Optimization solver accesses all available network information
– Attempts to coordinate control actions of all network capacitors
• Distributed Control
– Network is divided into control areas
– Each controller measures & analyzes respective network area
– Control decisions based on conditions within a control area
– Requires coordination and data sharing between control areas

14
Preliminary Distributed Controller Design
Preliminary Distributed Controller Design
• Distributed controller required to determine switching operations
• Similar formulation to centralized problem
– voltage reference obtained from within control area
• Reference voltage is a computed value local to each control area
– obtained through distributed analysis of the network
– e.g. the equivalent source bus voltage
• Control is knowingly conservative: only measured voltage spread within each control area considered
28

15
Preliminary Distributed Controller
• For each control area:
, ,
, ,
min max p
i refi i i
p
j measu U j M
p a b c
V V
( , , ) 0i if V u max , , ,p
k k iI I k N p a b c
2 2 max 2( ) l l l iP Q S l F
min max , , ,p
k k k iV V V k N p a b c
set of feeders, buses, voltage measurements, control area i
subject to:(2) three-phase power flow
(3) feeder current limits
(4) feeder loading limits
(5) voltage magnitudes limits
(1) minimize voltage spread
within control area
, , :i i iF N M
,:p
i refV
capacitor control scheme, control area i
computed reference bus voltage magnitude, control area i
:iu
where:
29
Simulation Results

16
Case Study 1 – Test System
• Local, distributed and two centralized control cases are compared
• Capacitor C1 and capacitor C2 each have four available bank settings:– Bank Setting 0: 0 kVAR
– Bank Setting 1: 300 kVAR
– Bank Setting 2: 600 kVAR
– Bank Setting 3: 900 kVAR
• Four load levels are investigated:– LL1: 45% of peak load
– LL2: 55% of peak load
– LL3: 70% of peak load
– LL4: 100% of peak load
Capacitor Placement and Control
• Classification of capacitor allocation techniques
H.N. Ng, M.M.A. Salama, A.Y. Chikhani, IEEE Trans. on Power Delivery, 200031
Computation of Capacitor Settings
• Local control switching setpoint at 0.985 p.u.
• Centralized and distributed control: exhaustive search over all settings
• 20 Bus Test Settings
– peak load: 2,881 kW and 1,863 kVAR
– two three-phase capacitor banks, three 300 kVAR banks each
Figure 13: Centralized control voltage reference at substation
Legend
Substation
Load
Capacitor Bank
Bus voltage measurement:
1 2 4 5'
3'
Partition 0
Partition 1
5''
12 13 14
6 7 8 9 10 11
C1
3'' 15 16 17 18
19 20
C2
Partition 2
Ieq,2
Ieq,1
Computed partition reference voltage:
,
p
j measV
,
p
i refV
0,refV
1,refV
2,refV
32

17
Simulation Results – Test System
Table 2: Maximum voltage spread in p.u. at each load level for each control scheme
Load Level
Control Scheme
Local(C1–C2)
Distributed(C1–C2)
Centralized(C1–C2)
LL1 (45%) 0-0 2-0 3-1
LL2 (55%) 1-0 2-1 3-2
LL3 (70%) 1-0 3-1 3-3
LL4 (100%) 2-1 3-1 3-3
Table 1: Capacitor bank setting (C1-C2) at each load level for each control scheme
33
Load Level
Control Scheme
Local Distributed Centralized
LL1 (45%) 0.007904 0.003320 0.001340
LL2 (55%) 0.007129 0.004935 0.002963
LL3 (70%) 0.009763 0.005404 0.005395
LL4 (100%) 0.012512 0.010264 0.010255
Observations
• Distributed control:
– significant improvements over local settings as expected
– suboptimal settings compared to centralized control
– approach centralized solutions at higher load levels
• At low loading levels, distributed control produced significantly larger voltage spread than centralized control
– regulation concerns not as critical during these periods
34
18
Case Study 2 – Utility Feeder
• Results presented next on utility feeder:
– 8361 kW, 2746 kVar
– 12.9 kV
– 948 bus, 1224 node
– 4 capacitor banks
• Capacitor banks have three available bank settings:– Bank Setting 0: 0 kVAR
– Bank Setting 1: 300 kVAR
– Bank Setting 2: 600 kVAR
• Three load levels investigated, based on utility AMI data:– LL1: Light loading
– LL2: Average loading
– LL3: Peak load
35
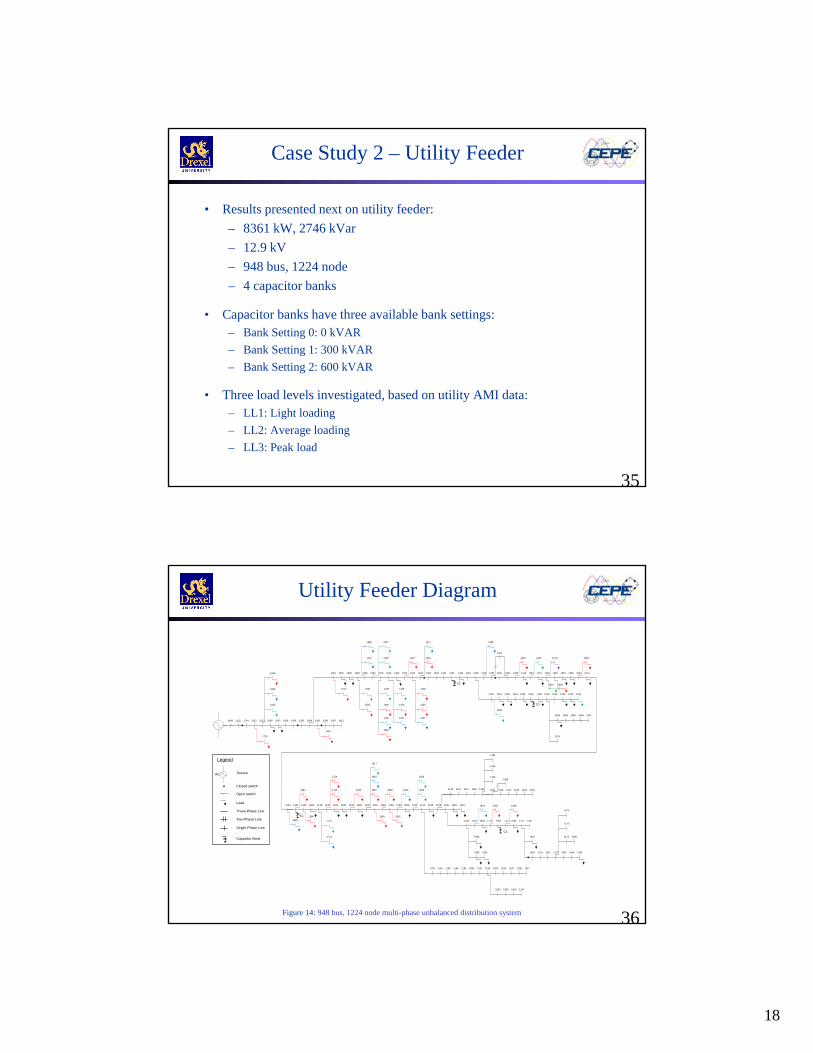
Utility Feeder Diagram
Figure 14: 948 bus, 1224 node multi-phase unbalanced distribution system 36
AC Source
Closed switch
Open switch
Load
Three-Phase Line
Legend
1949 1125 1744 1121 1113 1658 1643 1098 1096 1593 1094 1095 1598 1097 1611
1149 1151 1157 1926 1160
1161
1091 1581 1583 1090 1089 1084 1076 1064 1360 1026 1022 1024 1305 1020 1291 1292 1294 1033 1035 1049 1052 1400 1053 1055 1416 1061 1472 1081 1082 1575 1582 1093 1613
1100 1104 1105 1669 1118 1122 1762 1785 1126 1805 1132 1134 1136 1138 1139 1909 1143 1144 1918 1148 1150 1929 1931
1037 1352 1359 1344 1334 1333 1332 1029 1025 1295 1249 1015
1145 1146 1156 1166 1154 1925 1152 1153 1924 1155 1167 1158 1927
1168 1169 1933 1170 1937 1171 1939 1177 1947
1930
1935 1936
1944
1943 1176 1941 1173 1942 1946 1945
1174
1175
1172 1940
1163
1162
1159 1928 1164 1165 1922 1921
1923 1920 1919 1147
1028 1328 1030 1036 1051
1324
1401
1928
1689
1690
1688
1594
1612 1580
1592
1570
1569
1558
1557
1458
1456
1457
1497
1495
1496
1492
1027 1312
1306
1320
1307
1311
1346
1389
1420 1453 1079
1728
1535
1584
1641
1629
1106
1712
1711
1510
1723
1724
1788 1815
1816
1817
1858
18921836
1902 1815
1816
1934 1932 1938
Two-Phase Line
Single-Phase Line
Capacitor Bank
C1
C4
C2
C3

19
Partitioned Utility Feeder
37Figure 15: Test system partitioned based on reactive power domains
Simulation Results – Utility Feeder
Table 2: Computed capacitor settings and resulting system losses each load level
Load Level
Centralized Controller Distributed Controller
Capacitor bank settings
Voltage spread (p.u.)
Capacitor bank settings
Voltage spread (p.u.)
LL1 (Light) 2‐1‐2‐0 0.001820 0‐1‐2‐1 0.0022433
LL2 (Average) 2‐2‐2‐2 0.017955 2‐2‐2‐2 0.017955
LL3 (Peak) 2‐2‐2‐2 0.023220 2‐2‐2‐2 0.023220
Table 1: Computed capacitor settings and resulting voltage spread at each load level
38
Load Level
Centralized Controller Distributed Controller
Capacitor bank settings
Ploss (kW)Capacitor bank
settingsPloss (kW)
LL1 (Light) 0‐1‐1‐0 8.38079 1‐1‐0‐0 8.40419
LL2 (Average) 2‐2‐2‐2 55.17571 2‐1‐2‐1 57.02187
LL3 (High) 2‐2‐2‐2 126.96227 2‐2‐2‐1 127.52827

20
Observations
• Peak load:
– typical that all capacitors switched to maximum tap setting
– observed for both centralized and distributed control
• Average load: distributed controller matches centralized solution for all references
• Peak and average load:
– distributed controller finds globally optimal solution across varying levels of coordination
• Light load: distributed control resulted in feasible, sub-optimal solutions
– typically represents non-critical operating periods,
Discussion & Summary

21
Summary
• As push towards advanced distribution automation continues, distributed online control viable
• A study of distributed capacitor control has been presented:
– reactive power domains employed to partition into control areas
– distributed analysis used to analyze system
• Controller designed to regulate voltage within control areas
• Suboptimal settings as compared to a centralized solver
– advantage: reduced communication requirements and stand-alone capability
• Significant improvements over strictly local control possible:
– support adoption of advanced distribution automation41
Discussion
• Additional measurement capabilities really enhance capacitor control possibilities
• To improve design of distribution system measurement systems:
Power engineering analysis and values should still be utilized
42

22
43
Related Publications & Presentations
[1] M. Kleinberg, N. Segal, K. Miu, H. Lehmann, T. Figura, “A Partitioning Method for Distributed Capacitor Control of Electric Power Distribution Systems,” IEEE Transactions on Power Systems, Feb. 2014.
[2] M. Kleinberg and K. Miu, “A Study of Distributed Capacitor Control for Electric Power Distribution Systems,” Proc. of the North American Power Symposium, Boston, MA, Aug. 2011. (Third Place - Best Student Paper Competition)
[3] N. Segal, M. Kleinberg, A. Madonna, K. Miu, H. Lehmann, T. Figura, "Analytically Driven Capacitor Control for Voltage Spread Reduction," Proc. of the 2012 IEEE Power and Energy Society Transmission and Distribution Conference and Exposition, Orlando, FL, May 8, 2012.
[3] N. Segal and K. Miu, "An Investigation of Capacitor Control Actions for Voltage Spread Reduction in Distribution Systems," 2012 IEEE Power and Energy Society Transmission and Distribution Conference and Exposition, Student Poster Contest, May 9, 2012 (2nd Place, Graduate Student Poster Competition)
[4] K. Miu, N. Segal, M. Kleinberg, A. Madonna, H. Lehmann, T. Figura, "Analytically Driven Power Distribution Applications," 2011 IEEE Power and Energy Society General Meeting, Supersession - Smart Grid Analytics, Detroit, MI, July 2011
[5] S. Tong and K. N. Miu, “Slack Bus Modeling and Cost Analysis of Distributed Generator Installations,” ASCE Journal of Energy Engineering, Vol. 133, Iss. 3, Sept. 2007, pp. 111-120.
[6] S. Tong and K. N. Miu, “A Network-Based Distributed Slack Bus Model for DGs in Unbalanced Power Flow Studies”, IEEE Transactions on Power Systems, Vol. 20, No. 2, May 2005, pp. 835-842.
[7] V. Cecchi; X. Yang; K. Miu; C. Nwankpa; “Instrumentation and Measurement of a Power Distribution System Laboratory for Meter Placement and Network Reconfiguration Studies”, IEEE Transactions on Instrumentation and Measurement, Vol. 56, Iss. 4, Aug. 2007, pp. 1224 – 1230