Embed Size (px)
Citation preview

DELSA/ELSA/WD/SEM(2006)6
OECD SOCIAL, EMPLOYMENT AND MIGRATION WORKING PAPERS
Measures of Material Deprivation in OECD Countries
Romina Boarini and Marco Mira d’Ercole
37

Unclassified DELSA/ELSA/WD/SEM(2006)6 Organisation de Coopération et de Développement Economiques Organisation for Economic Co-operation and Development 01-Aug-2006 ___________________________________________________________________________________________
English text only DIRECTORATE FOR EMPLOYMENT, LABOUR AND SOCIAL AFFAIRS EMPLOYMENT, LABOUR AND SOCIAL AFFAIRS COMMITTEE
OECD SOCIAL, EMPLOYMENT AND MIGRATION WORKING PAPERS NO. 37 MEASURES OF MATERIAL DEPRIVATION IN OECD COUNTRIES
By Romina Boarini and Marco Mira d'Ercole
JEL Classification: I31, I2
All Social, Employment and Migration Working Papers are now available through OECD's Internet website at http://www.oecd.org/els
JT03212443
Document complet disponible sur OLIS dans son format d'origine Complete document available on OLIS in its original format
DE
LSA
/EL
SA/W
D/SE
M(2006)6
Unclassified
English text only

DELSA/ELSA/WD/SEM(2006)6
2
DIRECTORATE FOR EMPLOYMENT, LABOUR AND SOCIAL AFFAIRS
http://www.oecd.org/els
OECD SOCIAL, EMPLOYMENT AND MIGRATION WORKING PAPERS
http://www.oecd.org/els/workingpapers
This series is designed to make available to a wider readership selected labour market, social policy and migration studies prepared for use within the OECD. Authorship is usually collective, but principal writers are named. The papers are generally available only in their original language � English or French � with a summary in the other. Comment on the series is welcome, and should be sent to the Directorate for Employment, Labour and Social Affairs, 2, rue André-Pascal, 75775 PARIS CEDEX 16, France.
The opinions expressed and arguments employed here are the responsibility of the author(s) and do not necessarily reflect those of the OECD
Applications for permission to reproduce or translate all or part of this material should be made to:
Head of Publications Service
OECD 2, rue André-Pascal
75775 Paris, CEDEX 16 France
Copyright OECD 2006

DELSA/ELSA/WD/SEM(2006)6
3
ACKNOWLEDGEMENTS
Romina Boarini is currently an Administrator in the OECD Economics Department. At the time of writing, she was a Young Professional in the Directorate for Employment, Labour and Social Affairs. Marco Mira d'Ercole is a Principal Administrator in the OECD Directorate for Employment, Labour and Social Affairs. The authors wish to thank Leon Pietsch and Anne O�Connor (Australian Bureau of Statistics); Donald Dubreil, Catherine Van Rompaey and Joan Coulter (Statistics Canada); Aya Abe (National Institute of Population and Social Security Research, Tokyo); Kurt Bauman (US Census Bureau); and Henrik Litske (European Foundation for the Improvement of Living and Working Conditions) for having provided access to data from different surveys. They also wish to thank, for their comments on previous versions of this paper, M. Durand, J. P. Martin and M. Pearson and, for their statistical support, A. d�Addio Devaux, P. Marianna and M. Ladaique from the OECD Directorate for Employment, Labour and Social Affairs; as well as researchers at Economic and Social Research Institute in Dublin, Lane Kenworthy, University of Arizona, and participants at the workshop on "Low Income, Poverty and Deprivation" help in Ottawa on 5-6 June 2006. Errors are the responsibilities of the authors alone. The views expressed in this paper are those of the authors, and do not necessarily reflect those of the OECD or of its member countries.

DELSA/ELSA/WD/SEM(2006)6
4
TABLE OF CONTENTS
ACKNOWLEDGEMENTS............................................................................................................................ 3 SUMMARY.................................................................................................................................................... 6 RÉSUMÉ ........................................................................................................................................................ 8 1. INTRODUCTION ............................................................................................................................. 10 2. CONCEPTUAL ISSUES: ALTERNATIVE MEASURES OF POVERTY AND MATERIAL DEPRIVATION................................................................................................................................. 11
Introduction ............................................................................................................................................... 11 The measurement of poverty: basic approaches........................................................................................ 11 Toward a multi-dimensional view of poverty ........................................................................................... 12 Definitions of material deprivation ........................................................................................................... 13 Dimensions and components of material deprivation ............................................................................... 14
3. EVIDENCE ON THE PREVALENCE OF DIFFERENT TYPES OF MATERIAL DEPRIVATION................................................................................................................................. 17
How deprivation should be measured in a cross-country context�......................................................... 17 �.and how it is currently measured in national surveys........................................................................... 18 Components of material deprivation: a review of evidence from national data........................................ 19
Basic needs ............................................................................................................................................ 20 Basic leisure and social activities .......................................................................................................... 20 Availability of consumer durables......................................................................................................... 24 Housing conditions ................................................................................................................................ 25 Financial stress ...................................................................................................................................... 25 Help from relatives and friends ............................................................................................................. 28 Cross-country patterns in the overall prevalence of material deprivation ............................................. 28
Shortcoming of available measures........................................................................................................... 31 4. MULTI-DIMENSIONAL MEASURES OF MATERIAL DEPRIVATION .................................... 32
Introduction ............................................................................................................................................... 32 Composite indices of material deprivation................................................................................................ 32 Socio-economic characteristics of persons affected by material deprivation............................................ 36 Dynamic patterns: evidence for European countries................................................................................. 40 The overlap between material deprivation and income-based measures of poverty................................. 40
Cross-sectional assessments .................................................................................................................. 40 Longitudinal assessment........................................................................................................................ 42 Characteristics of the �consistent poor� ................................................................................................ 43 Possible explanations of the mismatch between income poverty and material deprivation.................. 44
CONCLUSIONS .......................................................................................................................................... 45 REFERENCES ............................................................................................................................................. 46 ANNEX 1. MEASUREMENT AND ANALYSIS IN INDIVIDUAL COUNTRIES ................................. 50 ANNEX 2. HOUSEHOLDS SURVEYS COVERING MATERIAL DEPRIVATION............................... 53
DELSA/ELSA/WD/SEM(2006)6
5
Tables
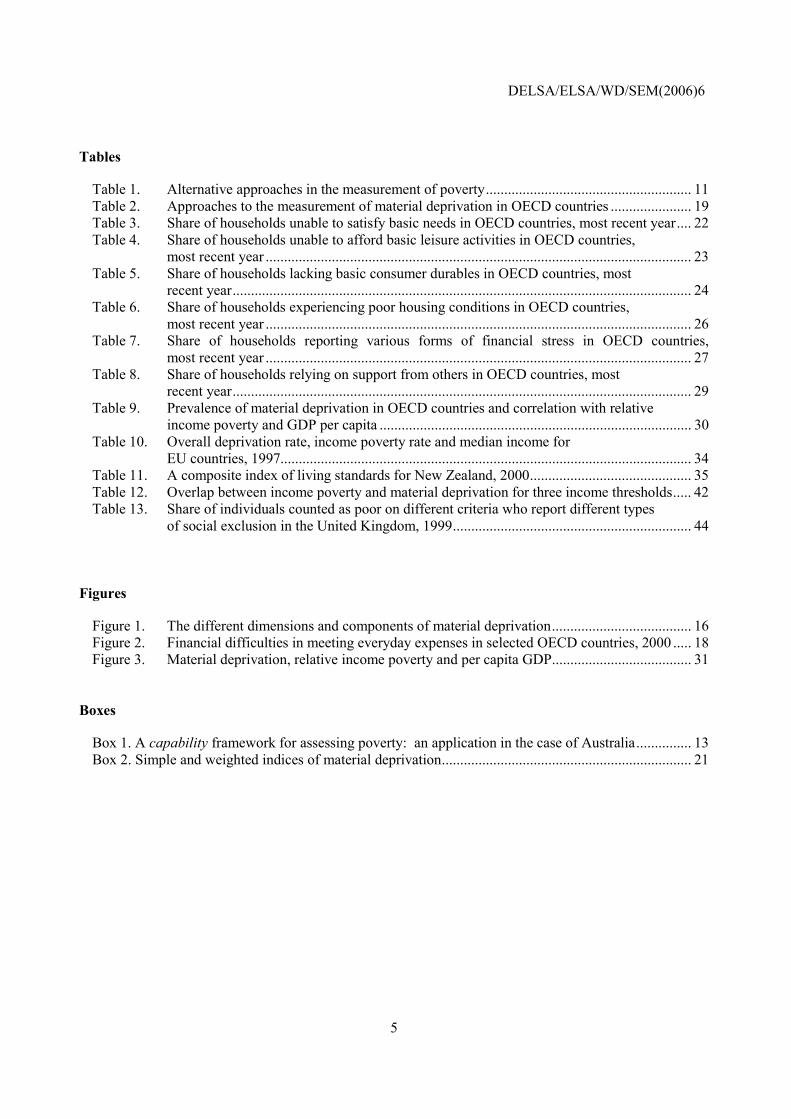
Table 1. Alternative approaches in the measurement of poverty........................................................ 11 Table 2. Approaches to the measurement of material deprivation in OECD countries ...................... 19 Table 3. Share of households unable to satisfy basic needs in OECD countries, most recent year.... 22 Table 4. Share of households unable to afford basic leisure activities in OECD countries, most recent year .................................................................................................................... 23 Table 5. Share of households lacking basic consumer durables in OECD countries, most recent year............................................................................................................................. 24 Table 6. Share of households experiencing poor housing conditions in OECD countries, most recent year .................................................................................................................... 26 Table 7. Share of households reporting various forms of financial stress in OECD countries, most recent year .................................................................................................................... 27 Table 8. Share of households relying on support from others in OECD countries, most recent year............................................................................................................................. 29 Table 9. Prevalence of material deprivation in OECD countries and correlation with relative income poverty and GDP per capita ..................................................................................... 30 Table 10. Overall deprivation rate, income poverty rate and median income for EU countries, 1997................................................................................................................ 34 Table 11. A composite index of living standards for New Zealand, 2000............................................ 35 Table 12. Overlap between income poverty and material deprivation for three income thresholds..... 42 Table 13. Share of individuals counted as poor on different criteria who report different types of social exclusion in the United Kingdom, 1999................................................................. 44
Figures
Figure 1. The different dimensions and components of material deprivation...................................... 16 Figure 2. Financial difficulties in meeting everyday expenses in selected OECD countries, 2000 ..... 18 Figure 3. Material deprivation, relative income poverty and per capita GDP...................................... 31
Boxes
Box 1. A capability framework for assessing poverty: an application in the case of Australia............... 13 Box 2. Simple and weighted indices of material deprivation.................................................................... 21

DELSA/ELSA/WD/SEM(2006)6
6
SUMMARY
1. Poverty is a complex issue, and a variety of approaches are required for its measurement and analysis. While monetary measures of income poverty are widespread, a long-standing tradition relies on non-monetary measures, based on either the respondent's self-assessment of their own conditions or on measures of ownership of consumer goods and living standards. Measures of material deprivation fall into this latter category. These measures rest on shared judgments about which items are more important to provide a "decent" living standard, irrespective of people's preferences and of their capacity to afford these items. Material deprivation is typically the outcome of income poverty when this persists over time, or when individuals experience repeated spells of it. Because of this, measures of material deprivation add important information to that provided by conventional income measures, permitting an assessment of poverty from a longer-run perspective and furthering understanding of the causal mechanisms at work.
2. This paper discusses the use of material deprivation measures for an analysis of poverty in OECD countries. Its main goal is to identify suitable survey questions that might be used in comparative analysis, as a first step towards the construction of more satisfactory poverty measures. The paper proposes a simple taxonomy of the broad notion of material deprivation into its objective and subjective dimensions and into its main components, and present data on the share of households reporting different types of material deprivation. It also proposes a simple summary measure of material deprivation, defined as the average of indicators across different items. Some of the main findings from these measures are as follows:
• On average, 10% of OECD households report having faced different types of financial stress, 11% fail to satisfy basic needs or lack basic consumer durables, 12% have poor housing conditions, 14% regularly depend on financial help from others and 24% cannot afford basic leisure activities.
• Across all OECD countries, an aggregate measure of the prevalence of material deprivation is only weakly related to measures of relative income poverty, while it is more strongly correlated to GDP per capita. The opposite pattern holds, however, when limiting the analysis to OECD countries with a GDP per capita above USD 25 000.
3. Measures of material deprivation based on aggregate data, such as those presented in this paper, do not distinguish between situations where the same household experiences different types of deprivation and those where these experiences are widely shared among the population at large. Research based on micro records highlights several patterns:
• First, the same individuals tend to report several forms of deprivation at the same time: this allows constructing composite indices of deprivation, even if different approaches to their construction may lead to different results.
• Second, multivariate studies relying on different controls suggest that the probability of being deprived is higher for persons with income below the relative poverty line, young, unemployed or with weak ties to the labour market, poorly-educated, living alone or as lone parents, disabled, immigrants and welfare recipients.

DELSA/ELSA/WD/SEM(2006)6
7
• Third, data tracking households over time show that most of those reporting different forms of material deprivation are in these conditions over prolonged periods of time, Data on material deprivation hence provide a useful complement to poverty measures based on current income where longitudinal data are not available.
• Fourth, material deprivation is both more concentrated among a minority of the population and tends to last longer in countries where its prevalence is also higher.
• Finally, the overlap between income poverty and material deprivation is not full but increases when a higher income threshold is used and when assessing deprivation in the long-term.
While these findings underscore the potential of data on material deprivation at the level of individuals for constructing measures of multiple deprivations, future work will need to investigate how best to apply this information to comparative analysis of poverty in OECD countries.

DELSA/ELSA/WD/SEM(2006)6
8
RÉSUMÉ
4. La pauvreté est un problème complexe et différentes méthodes sont nécessaires pour la mesurer et l�analyser. Si les indicateurs de la pauvreté monétaire sont répandus, on utilise également depuis longtemps des indicateurs non monétaires, qui sont fondés sur la perception qu�ont les personnes interrogées de leur propre situation ou sur l�évaluation des biens de consommation possédés et des niveaux de vie. Les indicateurs de la privation matérielle relèvent de cette dernière catégorie. Ils s�appuient sur ce que l�on considère communément comme des éléments essentiels pour permettre aux individus d�atteindre un niveau de vie « décent », indépendamment de leurs préférences et des moyens dont ils disposent pour acheter ces éléments. La privation matérielle découle généralement de la pauvreté monétaire lorsque celle-ci se prolonge dans le temps ou revient de manière répétée. Les indicateurs de la privation matérielle complètent donc les indicateurs classiques de la pauvreté monétaire, permettant ainsi d�évaluer la pauvreté dans une optique de long terme et de mieux en comprendre les mécanismes de cause à effet.
5. Le présent document décrit l�utilisation d�indicateurs de privation matérielle à des fins d�analyse de la pauvreté dans les pays de l�OCDE. Son objectif principal est d'identifier des questions dans les enquêtes disponibles pour plusieurs pays de l'OCDE qui pourraient fournir une base pour la construction d'indicateurs de pauvreté plus adéquats. La vaste notion de privation matérielle est réduite dans ce document à une taxinomie simple des dimensions objectives et subjectives ainsi qu'à ses principaux éléments. Il présente des données sur la part des ménages indiquant différents types de privation matérielle. De plus, il propose une simple indication de la privation matérielle, définie comme étant la moyenne des indicateurs parmi plusieurs points. Quelques-uns des principaux résultats de ces indications sont comme suit:
• En moyenne, 10 % des ménages des pays de l�OCDE déclarent avoir été confrontés à divers types de difficultés financières, 11 % ne peuvent subvenir à des besoins essentiels et manquent de biens de consommation durables élémentaires , 12 % sont confrontés à de mauvaises conditions de logement , 14 % ont régulièrement recours à des aides financières de tiers et 24 % ne peuvent s�offrir de loisirs de base.
• Dans tous les pays étudiés, les taux de privation matérielle des ménages sont faiblement corrélées avec ceux de la pauvreté monétaire relative, alors qu�ils sont plus fortement corrélés avec le PIB par habitant. Toutefois, quand l'analyse est limitée aux pays de l�OCDE avec un PIB par habitant supérieur à 25 000 dollars, les conclusions sont opposées.
6. Les indicateurs de privation matérielle basés sur des données agrégées, tels que ceux présentés dans ce rapport, ne font pas la différence entre les situations où le même ménage est confronté à différentes formes de privations et celles où ces privations sont distribuées sur une grande partie de la population. Les études basées sur des micro données mettent en lumière plusieurs tendances :
• Premièrement, les mêmes personnes signalent généralement plusieurs formes de privation en même temps, ce qui permet d�élaborer des indicateurs composites de la privation matérielle, même si les différentes méthodes d�élaboration peuvent conduire à des résultats différents.
• Deuxièmement, des études multivariées se basant sur plusieurs contrôles indiquent que le risque de basculer dans la privation matérielle est plus élevé pour les personnes vivant au dessous du seuil de pauvreté, les chômeurs ou les personnes faiblement insérées sur le marché du travail, les

DELSA/ELSA/WD/SEM(2006)6
9
personnes peu instruites, les personnes vivant seules ou en familles monoparentales, les handicapés, les immigrants et les allocataires de l�aide sociale.
• Troisièmement, les données longitudinales montrent que la plupart des ménages signalant différentes formes de privation matérielle sont dans ces situations pendant des périodes prolongées. Les données sur la privation matérielle fournissent donc un complément utile aux indicateurs de pauvreté s�appuyant sur le revenu actuel lorsque les données longitudinales ne sont pas disponibles.
• Quatrièmement, la privation matérielle semble être plus concentrée dans une minorité de la population et se prolonger sur des périodes plus longues dans les pays où elle est plus présente.
• Enfin, les indicateurs de la pauvreté monétaire et de la privation matérielle sont loin de se recouper totalement, mais se rapprochent lorsqu�on utilise un seuil de revenu plus élevé et que l�on évalue la privation matérielle sur le long terme.
Alors que ces résultats mettent en évidence le potentiel des données en matière de privation matérielle au niveau individuel pour construire des indicateurs de multiples privations, d'autres études devront rechercher comment appliquer au mieux ces informations pour obtenir une analyse comparative de la pauvreté dans les pays de l'OCDE.

DELSA/ELSA/WD/SEM(2006)6
10
1. INTRODUCTION
7. Poverty is a complex phenomenon, and different measures give different perspectives as to its size and evolution. On one side, comparative research relying on an income threshold set at half of the median suggests that poverty affects over 10% of the OECD population, and that it has increased slightly over the past two decades (Förster and Mira d'Ercole, 2005). On the other, evidence from national studies based on alternative measures (access to resources, capabilities) suggests that a much smaller minority of households does not satisfy their basic needs, and that their incidence has declined even when income poverty was rising (Callan et al., 1996).
8. These differences in appreciation conveyed by different measures partly reflect the different thresholds used in the analysis but also differences in the underlying constructs. Income measures of poverty are generally based on cross-section data that offer a snap-shot of the individual�s situation combining transitory and persistent features. Further, income measures do not provide a full picture of �command over resources�: they neglect individuals' ability to borrow, to draw from accumulated savings and to benefit from help provided by the family or friends, as well as consumption of public services such as education, health and housing. For these reasons, income provides only a partial description of the individual�s ability to enjoy an �acceptable� life.
9. A variety of alternative measures have been developed to correct for these limits: these include measures based on the subjective appreciation by individuals of their own ability to satisfy basic needs, and those measuring objective conditions like ownership of consumer goods and access to various goods and services. A common feature of these non-monetary measures is their ambition to capture the individual�s capacity to afford a decent standard of living with respect to dimensions that are likely to last over time (for example, in terms of housing conditions). An additional feature of these approaches is that they are based on a hierarchy of needs that individuals or communities consider as necessary to live a decent life.
10. This report describes measures of material deprivation that are available for different OECD countries, with a focus on some of its most obvious forms. Its limited ambition is to review existing measures, rather than offering a comprehensive assessment of material deprivation and its determinants, as one step in the direction of developing a more satisfactory measure of poverty in OECD countries. Section 2 discusses some conceptual issues underpinning the definition of material deprivation, and identifies its main dimensions and components. Section 3 presents some information, based on aggregate data, on the prevalence of material deprivation in selected OECD countries. Section 4 highlights some of the main results from the literature on multiple deprivations, with a focus on the relation between deprivation and income poverty, on the characteristics of persons at risk of deprivation, and on ways of aggregating the information on different aspects of deprivation into synthetic measures. The last section concludes.

DELSA/ELSA/WD/SEM(2006)6
11
2. CONCEPTUAL ISSUES: ALTERNATIVE MEASURES OF POVERTY AND MATERIAL DEPRIVATION
Introduction
11. This section describes the main concepts and methodological issues underpinning the study of material deprivation. First, it discusses material deprivation as one way of measuring poverty. Second, it argues that a comprehensive assessment of poverty requires multidimensional measures. Third, it identifies different dimensions of material deprivation, building on the seminal work of Townsend (1979), Mack and Lansley (1985) and Ringen (1988).
The measurement of poverty: basic approaches1
12. Much theoretical and empirical work has been devoted in the past few decades to the task of measuring poverty. Although taking a variety of perspectives, all approaches to the measurement of poverty rely on the specification of:
• a threshold separating the poor and the non-poor; and
• an index that expresses how far from the threshold the poor are.
13. With respect to the first criterion, approaches to the measurement of poverty can be distinguished along two dimensions. First, the metric used can be either �monetary� or �non-monetary�. Second, it can refer to either �inputs�, i.e. indirect measures, or to �outcomes�, i.e. direct measures. Based on these two dimensions, Table 1 distinguishes among four approaches to the measurement of poverty, and provides examples of indicators falling under each.
Table 1. Alternative approaches in the measurement of poverty
Input-based methods (indirect measures)
Outcome-based methods (direct measures)
Monetary measures - Income measures, budget-standard approach
- Basic needs measures
Non-monetary measures - Access to employment, public services
- Material deprivation measures, capability indicators (e.g. life-expectancy, literacy)
Source: OECD.
1. The conceptual underpinnings of these different approaches are discussed by Fleurbaey et al., 1997.

DELSA/ELSA/WD/SEM(2006)6
12
14. Most poverty measures are �monetary� and �input� based, where inputs are the resources required to achieve well-being. Income measures fall in this category. These income measures can be based on either �absolute� or �relative� thresholds. Absolute thresholds define poverty on the basis of a normative judgment of, for example, what qualifies as basic needs or what is the proportion of food expenses in the household�s budget.2 While most of these measures are not purely �absolute� � they define poverty through a standard that is both time- and space-specific � their common characteristic is that they build on a priori assumptions of what basic needs should be satisfied. Conversely, relative-income measures fix an arbitrary threshold relative to a �typical� standard in society; recent OECD work, for example, has mainly relied on a threshold set at half of median equivalised household disposable income (Förster and Mira d'Ercole, 2005).
15. Measures focusing on �outcomes� represent a complementary approach to input-based measures. They concentrate on the final conditions of individuals, rather than on the means required to achieve those conditions. Outcomes are generally conceived in terms of �well-being� or �living standards�, and measured based on either a money-metric � as in the case of the �basic needs� method, which considers whether actual household expenditures fall short of some minimum level � or on a non-monetary metric. The indicators falling in this latter category � i.e. �non-monetary� and �outcome� based measures of poverty � measure material deprivation. Material deprivation broadly refers to the lack of material goods, financial difficulties and to the individual�s inability to live a decent life.
Toward a multi-dimensional view of poverty
16. While each of these approaches to poverty measurement has advantages and shortfalls, they all complement each other (Ringen 1987, 1988; Nolan and Whelan, 1996; Short, 2005). The main rationale for the joint use of monetary and non-monetary indicators is that poverty is multidimensional (Kolm, 1977; Atkinson and Bourguignon, 1982; Maasoumi, 1986; and Tsui, 1995). For example, various sub-groups of the population may experience different forms of poverty (food, clothing, shelter, income, etc.), leading to low correlation between monetary and non-monetary indicators of poverty (Muffels, 1993; Nolan and Whelan 1996). Sen (2000) argues that an integrated approach to measuring poverty should account for its multiples causes and consequences, with a focus on individuals' command over resources � capabilities � and the resulting outcomes � functionings. This approach provides a framework for investigating the links between the different aspects of poverty. Efforts to make this approach operational are currently pursued in some OECD countries (Box 1).
2. Examples of absolute poverty measures are the �budget-standard approach�, the �food ratio method�, and
the �Social Security poverty line�. The budget-standard approach relies on selecting a number of items that are deemed to be necessary for a nutritionally adequate diet and aggregating them through market prices. Within this approach, non-food items can be taken into account by either multiplying the necessary food expenditure by a proportional factor or by selecting them in an ad hoc way. This approach leads to an estimate of the amount of money needed to ensure a minimum standard of living. The food ratio approach is based on the observation that the share of income spent on necessities falls when income rises. In this approach, the poverty line can then be defined as the (average) income level at which a specified proportion of spending goes to necessities. The Social Security poverty line method sets the poverty threshold at the income support offered to welfare clients in a given country, based on the assumption that this represents a consensus on the minimum level of income acceptable in a given society, or an official view on that minimum. Nolan and Whelan (1996) provide a description of the conceptual underpinnings of these methods as well as on their advantages and drawbacks.

DELSA/ELSA/WD/SEM(2006)6
13
Box 1. A capability framework for assessing poverty: an application in the case of Australia
A framework for measuring poverty that builds on Sen's approach is proposed by Headey (2005) for Australia. His framework distinguishes between: i) low capabilities, defined in terms of access to different stocks of financial, human, health and social capital; ii) low functioning, defined through flow measures of financial, employment, health and family functionings; and iii) low well-being, defined through a range of indicators of psychological outcomes. Indicators in the first category include measures of asset-poverty (i.e. people with holdings of financial assets insufficient to keep them above the income-poverty line for three consecutive months), low education, work-experience and literacy skills, health disability and poor social networks. Indicators in the second group include measures of income-poverty and welfare reliance, unemployment and (household) joblessness, poor physical and mental health, and social isolation (i.e. low frequency of contacts with friends and relatives). Indicators in the last group include measures of low satisfaction with financial conditions, work, health, family and life outcomes.
Heady presents indicators for each of these domains based on the first three waves of the Household Income and Labour Dynamics in Australia (HILDA) survey, which allow distinguishing between �permanent" and "transitory" conditions in each of these domains. Indicators refer to both the total population and to selected subgroups at high risk of poverty. These various indicators are used to highlight linkages and "points of entry" for policy interventions. Evidence presented by Headey suggests that a strong linear relationship links low capabilities today and low functioning and well-being in later years; and that different well-being outcomes depends on various combinations of capabilities and functionings.
17. This report takes a narrower perspective to the measurement of poverty than the one outlined above. It moves beyond the one-dimensional focus on income but limits its scope to measures of material living standards. Also, while recognising the limits of income-poverty measures, this report does not argue that measures of material deprivation, by themselves, provide a better approach: rather it stresses the need to integrate information from both, as both income-based and deprivation measures of poverty suffer from imperfections. Methods based on current income are affected by transitory occurrences that potentially affect a large number of individuals. Conversely, measures of material deprivation may fail to distinguish between poor outcomes that result from financial constraints and those due to personal choices and life-styles; even when survey questions do distinguish between these two conditions, data on material deprivation may be affected by habits, past-dependent preferences and low aspirations. Further, because of embarrassment or unwillingness to reveal their distress, some of the most disadvantaged in society may under-report the extent of their deprivations or fall outside of the scope of the survey (e.g. the homeless).
Definitions of material deprivation
18. Much of the interest in measuring material deprivation (or �hardship�) stems from the work of Townsend (1979). Townsend related the concept of deprivation to the broader notion of �inability of living a decent life�. Following Townsend, other scholars have emphasised the notions of �shame� and �inability to live a decent life with dignity� to illustrate the concept of material deprivation (Sen, 1983). Today, most authors define material deprivation as �exclusion from the minimum acceptable way of life in one�s own society because of inadequate resources� (Callan et al., 1993; Nolan and Whelan, 1996; Kangas and Ritakallio, 1998; Layte et al. 2001; Whelan et al. 2002; Perry, 2002). Another common definition refers to �the lack of socially perceived necessities� (Bradshaw and Finch, 2003; Nolan and Whelan, 1996). While all these definitions are consistent with both �absolute� and �relative� interpretations of poverty, they retain the notion that the household is the fundamental unit within which resources are shared and needs satisfied.
19. These definitions of material deprivation are consistent with a range of measurement approaches. For example, Townsend (1979) identified 11 forms of deprivation and a set of 60 indicators describing them, from households data collected in 1969 for the United Kingdom. The survey used by Townsend covered the most important aspects of living standards (diet, clothing, shelter, education, health, environment, family activities and social relations). Based on binary deprivation scores (i.e. having or not having a specific good) for these items � which included having a refrigerator or an indoor toilet, having

DELSA/ELSA/WD/SEM(2006)6
14
spent an evening out during the last fortnight, having enjoyed a week�s holiday away from home in the last year, having consumed fresh meat every second day, or having a cooked breakfast most days � Townsend built a scale for each of them (individuals with a score equal to or greater than 5 were characterised as living in deprivation) and derived an income-threshold corresponding to the level below which �deprivation scores escalated disproportionately�.
20. Subsequent contributions have both criticised and extended the measurement approach followed by Townsend. Piachaud (1981) questioned the failure to distinguish between the lack of a good (or an activity) due to a voluntary choice of individuals from that resulting from financial constraints. Ringen (1988) criticised Townsend's approach for trying to assess material deprivation (a direct measure of poverty) through an income�s threshold (an indirect measure of poverty). Other authors have raised questions on the arbitrary list of items used and on the failure to take into account the seriousness of different forms of deprivation (Gordon, 2000).
21. Later contributions have addressed these criticisms. Mack and Lansley (1985) have tried to reduce the arbitrariness implicit in the choice of deprivation items by defining specific questions, within a survey for the United Kingdom, aimed at eliciting respondents to evaluate whether a certain number of items were perceived as �social necessities�. Further, to account for the possible influence of preferences in shaping households� life-styles, they phrased questions so as to distinguish between enforced lack (i.e. an affordability problem) and free choice.3 Desai and Shah (1988) adopted a different approach for the construction of a deprivation index: first, they replaced binary deprivation scores with a continuous score that reflected the distance between the respondent�s and the modal value in the distribution of each given item; second, they applied weights that reflected how common was access to a given item among the total population to aggregate across dimensions.4
22. More recent approaches to the definition and measurement of deprivation include Callan et al. (1993), who selected indicators of deprivation for Ireland starting from the basic idea that items have to be market-valuable, i.e. �acquired by the use of people�s disposable income�.5 Callan et al. further examined how different dimensions of deprivation correlate with each other, and whether clusters of correlated items could be employed to characterise the deprivation experience of particular groups of the population. Based on this analysis, they identified three groups of deprivation items: basic life-style, housing and availability of consumer durables. Later research has relied on similar classifications.
Dimensions and components of material deprivation
23. The literature on material deprivation has provided a variety of typologies and relied on different approaches (e.g. factor analysis) to identify the main components of material deprivation. Figure 1 proposes a simple decomposition of the broad notion of material deprivation into its different �dimensions� and, for each of them, �main components� and individual items. This typology is proposed as providing a convenient grid for reviewing the available evidence across OECD countries. The first layer of Figure 1
3. Mark and Lansley built a 22-items summary index of �socially-perceived enforced lacks� that are
negatively related to household income. Based on this index, they defined as �poor� those individuals who were lacking three or more items among those aggregated into the index.
4. By applying their summary index to the original Townsend�s dataset, Desai and Shah (1988) identified a significant relationship between income and deprivation scores, and between deprivation scores and socio-demographics characteristics of the respondent.
5. The authors used data from the Living in Ireland survey for 1987, which relied on the Mack and Lansley format and collected views about which items are considered as necessities.

DELSA/ELSA/WD/SEM(2006)6
15
distinguishes between �objective� and �subjective� dimensions of material deprivation,6 with each of them further disaggregated into specific components and items.
• Objective dimensions of material deprivation refer to the capacity of individuals and households to satisfy four types of needs:
1. �Satisfaction of basic needs� refers to those items (e.g. food, clothes, ability to keep the home warm during winter, etc.) whose availability is essential for physical survival.
2. �Capacity to afford basic leisure and social activities� (e.g. having a week of holiday away from home at least once per year, or occasionally inviting friends and relatives at home for drinks or meals) refers to items that, while not essential for physical survival, are critical for enjoying a �decent� quality of life.
3. �Availability of consumer durables� refers to items that are essential to perform every-day life activities (e.g. having a telephone) or that significantly ease housework and other domestic tasks (e.g. having a microwave oven).
4. �Housing conditions� relate to both the physical characteristics of the dwelling (e.g. availability of electricity, water supply, or indoor flushing toilet, or whether parts of the dwelling are deteriorated or damaged) and to the broader environmental characteristics of the areas where dwellings are located (e.g. exposure to noise, indoor pollution etc.).
• Subjective dimensions refer to people's appreciation of their conditions. These include:7
5. �Appreciation of own personal conditions�, in terms of their financial stress and ability to make ends meet,8 subjective perception of whether they consider themselves as poor and individual�s satisfaction with respect to life and its domains (e.g. work, housing and health).
6. �Characteristics of the social environment� where individuals live, in terms of features of their neighbourhood (e.g. exposure to specific hazards, fears of crime and of availability of public services such as schools and hospitals)9 and social networks of individuals (e.g. ability to rely on support from others in case of need).
24. The next section will review statistical measures pertaining to the six components of material deprivation highlighted in Figure 1. However, not all of the detailed items listed under each of these components are equally relevant for an assessment of material deprivation and few measures exist for some. As a result, measures of the appreciation of the individuals' own conditions reviewed below are limited to measures of financial stress (i.e. excluding indicators of the extent to which individuals �feel poor� and subjective measures of life satisfaction). Similarly, measures of the social environment are limited to those relating to social networks (i.e. excluding indicators of neighbourhood characteristics).
6. While useful as an organising tool, the distinction between objective and subjective dimensions of material
deprivation is sometimes arbitrary: most data on material deprivation comes from surveys responses which have a subjective character; also, some of the categories listed in Figure 1 as belonging to the subjective dimension of material deprivation refer to specific objective conditions (such as arrears in paying rents).
7. Van den Bosch (2001) provides a comprehensive discussion of the subjective dimensions of deprivation and a detailed description of methods used for the subjective assessment of poverty. Gallie and Paugam (2002) provide useful discussions of issues related to the social environment.
8. This item � usually labelled as �financial stress� or �economic strain� of families � is most often measured through questions on whether respondents feel that they can meet essential needs or have payment arrears with rents or utility bills.
9. While both of these items have an �objective� nature (e.g. fear of crime is related to the frequency of criminal offences in a given neighbourhood), these indicators are strongly affected by the individual's self-assessment of these conditions.

DELSA/ELSA/WD/SEM(2006)6
16
Figure 1. The different dimensions and components of material deprivation
Note: Boxes in white contain items of deprivation that are not considered in this report.
Source: OECD.

DELSA/ELSA/WD/SEM(2006)6
17
3. EVIDENCE ON THE PREVALENCE OF DIFFERENT TYPES OF MATERIAL DEPRIVATION
How deprivation should be measured in a cross-country context�.
25. According to Nolan and Whelan (1996), the key issues in the research on material deprivation are: i) the selection of items that are most suited to characterise material deprivation; ii) the assessment of the importance of �preferences� and �constraints� as determinants of living conditions; iii) the aggregation of different components of material deprivation into one (or more) summary index; iv) the selection of a cut-off point to distinguish those suffering from deprivation from those that do not; and v) understanding the causal process that leads to material deprivation.10
26. In general, the choice of indicators of deprivation should be inspired by some general criteria relating to their properties in terms of relevance, clarity, and comparability (Eurostat, 2002).
• With respect to relevance, indicators of material deprivation should unambiguously capture �a state of observable and demonstrable disadvantage� (Townsend, 1988) or the fact that individuals �have been denied the opportunity of having or doing something� (Nolan and Whelan, 1996). Some indicators of material deprivation may reflect the characteristics of individuals in a particular phase of their life (e.g. ownership of some consumer durables such as dishwashers) rather than permanent conditions (Hagennars, 1986) and be less relevant for an overall assessment of deprivation.
• Clarity brings to the fore questions pertaining to both the phrasing of survey questions and the distinction between constraints and preferences. For example, answers to survey questions about the shortage of home space may relate to both lack of space due to inability to afford a larger house or to the feeling of respondents in terms of adequacy of living space, as shaped by their preferences or expectations.
• Finally, comparability is a central criterion in the study of material deprivation across countries. While this criterion generally requires choosing items capturing the same aspect of deprivation in all countries, this may imply that some of the indicators selected have little �relevance� in some countries. This is because material deprivation has different meanings in different societies: for example, health care and education may not be an issue in countries where they are provided universally, but are an essential dimension in others. Also, to the extent that material deprivation relates to the absence of socially-perceived necessities, then views about what basic needs should be satisfied may also vary across countries (e.g. personal computers may be a necessity in countries where information technologies are essential to finding a job and a luxury good in other countries).
10. The first two items require selecting indicators that are comparable across countries, and are discussed in
this section. The other three points will be discussed when reviewing studies on deprivation based on individual records (Section 4).

DELSA/ELSA/WD/SEM(2006)6
18
�.and how it is currently measured in national surveys
27. Ideally, a comparative assessment of material deprivation would rely on measures that satisfy the criteria of relevance, clarity and comparability mentioned above, implemented through surveys asking questions that are similar and equally meaningful in all OECD countries. Unfortunately, few such instruments currently exist. One comparative survey providing information on a few forms of material deprivation is the Pew Global Attitudes Project, a series of worldwide public opinion surveys, originally covering 38 000 people in 44 countries and later expanded to 75 000 people in around 50 countries. Figure 2 shows the share of respondents in selected OECD countries who report having faced difficulties in meeting everyday expenses in three essential areas (food, health care and clothing). These data suggest that a significant share of survey respondents (especially in Turkey, Mexico and Poland) report having been unable to afford basic food items at some point during the year, with even higher proportions reporting having been unable to buy heath care and clothing the family needed. In general, OECD countries recording a high proportion of deprivation in one dimension also report high value in the others.
Figure 2. Financial difficulties in meeting everyday expenses in selected OECD countries, 2000
0
10
20
30
40
50
Japan
GermanyFrance
Czech Rep.
CanadaItaly
United Kingdom
United StatesPoland
MexicoTurke
y
Not able to buy food the family neededNot able to pay for medical and health care the family neededNot able to buy clothing the family needed
Note. Percentage of individuals reporting each of the three types of financial difficulty. Source: Pew Global Attitude Project.
28. The paucity of international data, and the growing interest in material deprivation in the past two decades, has translated into substantial efforts at the national and regional levels to establish comprehensive datasets allowing the construction of alternatives measures of poverty. At the regional level, initiatives have mainly been limited to EU countries.11 At the national level, efforts have included the creation of topical modules within existing surveys or specially conceived surveys (as the Living Standard Survey in New Zealand and the Poverty and Social Exclusion Survey in the United Kingdom). While data are increasingly available for several OECD countries, few studies exist that compare these data across OECD countries. This reflects the heterogeneity and sparseness of data. While some 20 different surveys on material deprivation have been identified in preparing this report, they differ in terms of the temporal profile of the data (most surveys on deprivation are cross-sectional, most often carried out on a one-off
11. In Europe, Eurostat has developed two comprehensive social statistics projects. The �European
Community Household Panel�, from 1994 to 2001, covered a very broad range of deprivation items. The EU �Survey of Income and Living Conditions� (EU-SILC), starting from 2003, covers a more narrow range of deprivation items. In addition, the European Foundation for the Improvement of Living and Working Conditions also carried out a survey (�Quality of Life in Europe�, ESQL) providing an extensive monitoring of living conditions. Finally, the EU-Reporting project implemented by the Centre for Survey Research and Methodology (ZUMA) aims at producing a European System of Social Indicators (EUSI).

DELSA/ELSA/WD/SEM(2006)6
19
basis),12 wording of the survey questions, presentation of results (whether these refer to individuals or households) and, most importantly, the underlying concepts being captured. Table 2 summarises major differences in countries� approaches to the measurement of material deprivation, in terms of nature of the underlying concept that they try to capture and of the components of material deprivation that they cover. Annex 1 provides more details on how the concept of material deprivation is defined and appraised in surveys available in different OECD countries.
Table 2. Approaches to the measurement of material deprivation in OECD countries
Underlying concept1 Components of material deprivation2 Australia Hardship
Housing affordability
Basic needs Basic Leisure and Social Activities Financial Stress
Canada Housing Core Need Food Insecurity Households �falling behind�
Basic Needs (food) Housing Conditions Financial Stress
European countries Material and Social Deprivation : Exclusion from society due to the lack of resources
Basic Needs Basic Leisure and Social Activities Consumer Durables Housing Conditions Financial Stress
Japan Material and Social Deprivation : Exclusion from society due to the lack of resources
Basic Needs Basic Leisure and Social Activities Consumer Durables Housing Conditions Financial Stress
New Zealand Economic Living Standard Basic needs Basic Leisure and Social Activities Consumer Durables Housing Conditions Financial Stress
United States Material and Financial Hardship Food Insecurity
Basic Needs (health and childcare), Consumer Durables Financial Stress
1. This refers to the latent concept that is most often referred to in research and policy analysis in each country considered. 2. This refers to the components of deprivation as identified in Figure 1. Source: OECD.
Components of material deprivation: a review of evidence from national data
29. This sub-section presents national data on the extent of material deprivation in selected OECD countries. The description is organised along the six main components of material deprivation identified in Figure 1. The data, referring to the most recent available year, refer to the share of (private) households in each country that report each specific form of deprivation (with the exception of New Zealand and the United States, where data refer to individuals rather than households) and generally cover European countries, as well as Australia, Canada, Japan, New Zealand and the United States. While the indicators selected aim to satisfy all the general criteria described above, emphasis is given to those that can be (more easily) compared across countries and that less depend on the institutional specificities or cultural traits of each country.13 Annex 2 provides details on the survey used and on the wording of survey questions.
12. While longitudinal surveys allow a dynamic analysis of deprivation, they are subject to attrition bias,
i.e. the possibility that households exit the sample before the end of the panel. Rendtel et al. (2004) report moderate impact of the attrition bias on the panel-based estimates of equivalised household income at the low end of the income scale in the European Community Household Panel.
13. As a result, this report does not consider indicators of availability of infrastructures and public services, of political activism or participation in social activities.

DELSA/ELSA/WD/SEM(2006)6
20
30. For each of the six components of material deprivation, Tables 3 to 8 also provide a summary index, defined as the average of the indicators across different items.14 These averages are based on two different weighting methodologies (simple and weighted averages), where the second approach allows weights to vary across countries and times (Box 2). In addition to averages for each of the six components of material deprivation, Table 9 also presents an overall summary measure of material deprivation, defined as the simple average across the six dimensions.15
Basic needs
31. Table 3 refers to the share of households reporting to have been unable to satisfy basic needs at some point in the past year. On average, around 15% of households in OECD countries report having been unable to clothe themselves properly, 13% to have been unable to heat the home adequately, around 10% to have experienced different forms of food insecurity, and 9% to have had limited access to health care. These shares are, in general, larger in most Southern and Eastern European countries (especially for heating and clothing), although this may partly reflect the cultural specificity of the indicators (Eurostat, 2002). Across OECD countries, there is in general a positive correlations between deprivation in each of these various items (the average of these correlation coefficients is 66%); in particular, �inability to clothe properly� is the item most highly correlated with others, and �inability to adequately heat home� the least. These two items record the highest and lowest cross-country variability, as shown by their respective coefficients of variation. The simple OECD-average of the incidence of deprivation in terms of basic needs is 11%, and 10% when the items that affect only a small share of the population are given a larger weight.
Basic leisure and social activities
32. Indicators referring to basic leisure activities only refer to two items (�inviting friends and relatives at home at least once per month� and �having one week of holiday away from home at least once per year�, Table 4). Across OECD countries, 14% of all households report not having invited friends and relatives over the past month (with this proportion exceeding 25% in Greece, Hungary, Poland, the Slovak Republic and Turkey) and 33% not being able to afford one week of holiday per year (with this share exceeding 50% in the same countries mentioned above plus Portugal). The correlation coefficient between these two types of basic leisure activities is high (84%) and cross-country variability associated to the two items is small. The average share of OECD households unable to afford basic leisure activities is 24% based on unweighted data, and 21% when the deprivation items that affect only a small share of the population are given a larger weight. While disparities exist across countries, basic leisure activities appear to be a concern for a larger share of population than in the case of satisfaction of basic needs.
14. The values of these summary indexes are affected by the approach used in selecting the main components
of material deprivation. The approach here used does not rely on statistical tools that aim to identify homogeneous clusters of indicators and to exclude redundant information.
15. In a similar spirit, the report by Atkinson et al. (2005) addressed to the Luxembourg EU presidency pleads for the addition of two �absolute� indicators of deprivation to the list of EU Indicators for Social Inclusion. The first is an aggregate index of 9 indicators elating to the inability to afford: i) keeping the home warm; ii) paying for a week of annual holiday; iii) a meal with meat, chicken or fish every second day; iv) facing unexpected financial expenses; v) regular payment schedules; vi) a car; vii) a colour TV; viii) a washing machine; and ix) a telephone. The second is an aggregate index of 4 items relating to housing, i.e. absence of: i) bath or shower; ii) indoor flushing toilet; iii) not enough light in the accommodation; and iv) the accommodation needs repairs.

DELSA/ELSA/WD/SEM(2006)6
21
Box 2. Simple and weighted indices of material deprivation
Measures of the prevalence of material deprivation for different components (basic needs, consumer durables, etc.) can be "averaged" across items to derive a single synthetic measure. Such averages can be either "simple" � where each item is given the same weight in each country � or based on "country-specific" weights. Both approaches are used in research on material deprivation. Under the second approach, the weights applied to each item are equal to the inverse of the (square root of the) prevalence of specific forms of deprivation in each country: this implies that a higher weight is applied to those items whose prevalence is lower; for example, in a country where it is very rare for people to skip meals, having to do so will get a higher weight (i.e. be more important for deprivation) than for items that are less common (e.g. having a car). Because of this feature, weighted averages of material deprivation reflect country-specific features.
An illustration of the different approaches to the construction of "average" deprivation indices is provided by the table below, which is based on data for three types of deprivation shown in Figure 2 (from the PEW "Global Attitude Survey"). For example, in Czech Republic, the average share of individuals exposed to material deprivation is 10.8% based on a "simple" average, and 9.6% based on a "weighted" average; while in the first case, each of the three deprivation item has an equal weight (0.33), in the second case the item "lack of health and medical insurance" has a higher weight (0.42) � and other two items a smaller one (0.34 for "lack of food", and 0.24 for "lack of clothing") � because most people in the Czech Republic have access to health care. This implies that families lacking health care � which are relatively few in the Czech Republic � are considered to live in more critical conditions than those who at times lacked money to buy clothing, which is a concern for a larger part of population. Even though the weighted indices of deprivation are less transparent that simple averages, they have some advantages:
• They provide a picture of poverty that better reflects the characteristics of each country.
• Differences in countries� weighted levels of deprivation are lower than in the case of simple averages.
• Changes in deprivation over time are easier to interpret as the weights reflect the improvement or worsening of each country in any given dimension of deprivation.
B u y fo o d th e fa m ily n e e d e d
P a y fo r m e d ic a l a n d h e a lth c a re th e fa m ily
n e e d e d
B u y c lo th in g th e fa m ily n e e d e d
S im p le A v e ra g e
W e ig h te d A v e ra g e
C a n a d a 9 .5 1 2 .5 1 6 .4 1 2 .8 1 2 .5C z e c h R e p . 8 .5 5 .8 1 8 .0 1 0 .8 9 .6F ra n c e 8 .1 5 .3 1 1 .6 8 .3 7 .9G e rm a n y 4 .8 7 .8 9 .9 7 .5 7 .2I ta ly 1 1 .2 1 2 .1 1 6 .4 1 3 .2 1 3 .1J a p a n 3 .9 4 .4 5 .0 4 .4 4 .4M e x ic o 4 4 .0 4 5 .1 4 2 .7 4 4 .0 4 3 .9P o la n d 3 5 .1 4 1 .6 4 2 .5 3 9 .7 3 9 .6T u rk e y 4 4 .7 4 7 .5 4 7 .5 4 6 .6 4 6 .6U n ite d K in g d o m 1 1 .3 1 0 .8 2 0 .1 1 4 .1 1 3 .5U n ite d S ta te s 1 5 .4 2 6 .5 1 8 .8 2 0 .2 1 9 .7
P e rc e n ta g e o f re s p o n d e n ts re p o r t in g th a t d u r in g th e la s t y e a r th e re h a v e b e e n t im e s w h e n th e y d id n o t h a v e e n o u g h m o n e y to :
Source: OECD calculations based on Pew Survey.

DELSA/ELSA/WD/SEM(2006)6
22
Table 3. Share of households unable to satisfy basic needs in OECD countries, most recent year Percentage
Simple W eighted6
Australia HES, 2003-4 2 12 3 11 -- 7 5Austria ECHP, 2001; EQLS, 2002 1 6 11 10 5 6 5Belgium ECHP, 2001; EQLS, 2002 4 3 7 7 8 6 6Canada NPHS, 1998-99 -- 8 8 -- -- 8 8Czech Rep. EQLS, 2002 8 19 8 25 3 13 10Denmark ECHP, 2001; EQLS, 2002 2 1 4 4 1 2 2Finland ECHP, 2001; EQLS, 2002 7 4 9 8 3 6 6France ECHP, 2001; EQLS, 2002 4 3 7 5 4 5 4Germany ECHP, 2001; EQLS, 2002 3 2 13 7 3 6 4Greece ECHP, 2001; EQLS, 2002 31 26 15 27 21 24 23Hungary EQLS, 2002 11 34 8 38 8 20 16Ireland ECHP, 2001; EQLS, 2002 4 1 7 4 10 5 4Italy ECHP, 2001; EQLS, 2002 17 5 9 12 26 14 12Japan SLC, 2003 1 -- -- 5 2 3 2Luxembourg ECHP, 2001 6 2 6 1 5 4 3Netherlands ECHP, 2001; EQLS, 2002 3 2 8 10 3 5 4New Zealand NZLCS, 2000 4 11 -- 10 8 8 8Poland EQLS, 2002 30 17 23 36 19 25 24Portugal ECHP, 2001; EQLS, 2002 56 3 11 38 17 25 17Slovak Rep. EQLS, 2002 17 33 11 38 21 24 22Spain ECHP, 2001; EQLS, 2002 42 3 3 7 4 12 6Sweden EQLS, 2002 1 2 8 4 3 4 3Turkey EQLS, 2002 45 53 39 43 33 43 42United Kingdom ECHP, 2001; EQLS, 2002 2 8 7 7 3 5 4United States SIPP, 2003 7 11 6 -- 8 8 8
Simple average 13 11 10 15 9 11 10Coefficient of variation 1.2 1.2 0.8 0.9 0.9 0.9 0.9
Survey and periodInability to
adequately heat home1
Inability to have a healthy
diet2
Experiencing food
insecurity3
Inability to clothe properly4
Restricted access to
health care5
Average of different dimensions
Notes. The symbol ��� indicates that no suitable survey question has been identified. Further information about national surveys used is provided in Annex 1. For European countries, data in italics are based on ESQL rather than ECHP. Data for New Zealand and United States refer to shares of individuals (rather than households) living in households reporting different types of deprivation. Data from ECHP and the US "Survey on Income and Program Participation" (SIPP) are weighted with normalized cross-sectional households� weights. Data for New Zealand are from Jensen et al. (2002); they are weighted to take into account the probability of selection, of non-response and sample stratification. Data for Japan from the "Survey on Living conditions" are not weighted. 1. Data refer to respondents that occasionally could not heat their home because of lack of money in Australia; that could not afford to heat their home in European countries; that are not satisfied with the warmth of their house in winter in the United States; to the average of the shares responding affirmatively to four questions ("household members often feel cold to save heating costs"; "household members often stayed in bed longer to save heating costs"; "household could not afford heating in all main rooms"; "household cannot afford warm bedding in the winter") in New Zealand; that could not afford heating and cooling devices in Japan. 2. Data refer to people declaring that they could not afford to eat meat or chicken every second day if they wished so in Europe; that they did not eat the quality or variety of food that they wanted because of a lack of money in Canada; that they were not able to have at least one special meal once a weak in Australia; to the average of the shares responding affirmatively to three questions ("the household could not afford a special meal at home at least once a week"; "the household bought cheaper cuts of meat or eat less meat than would like to keep costs down"; "the household went without fresh fruit and vegetables to help keep costs down") in New Zealand; and to the average of those who "had enough but not always the kind of the food they want to eat" and "who could not afford balanced meals" in the United States. 3. Data refer to individuals who "occasionally ran out of money to pay for food" in European countries; to the average of shares responding affirmatively to four questions ("sometimes or often the food did not last"; "household has cut the size of the meals or skip meals because of shortage of money"; "household has eaten less because of shortage of money"; "household has not eaten for a whole day because of a shortage of money") in the United States; to persons declaring that "they did not have enough food to eat because of a lack of money" in Canada; to persons who "went without meals because of a shortage of money" in Australia. 4. Data refer to respondents that "bought second-hand clothes because they could not afford to buy new ones" in European countries and Australia; to the average share of respondents declaring that "family bought second hand clothes instead of new to help keep costs down" and that they "continue to wear worn-out clothing because of lack of money" in New Zealand; and to the average of respondents indicating that that could not afford buying new underwear once per year and clothes for special occasions in Japan. 5. Data refer to respondents declaring that "on the last occasion they needed to see a doctor or a medical specialist, the cost of it made it difficult to do so" for European countries; to the average of shares of respondents declaring that "they occasionally could not see a doctor despite needing one because of lack of money" and that "they could not see a dentist despite needing one because of lack of money" in the United States; to the average share of respondents declaring that "they postponed/put off visits to doctor"; "they postponed/put off visits to the dentists"; "they did not pick up prescription"; "they went without glasses" in New Zealand; and to those who could not afford visiting a doctor when needed in Japan. 6. Weights vary inversely to the square root of the share of the population lacking a given item (i.e. forms of deprivation which affect only a small share of the population are given a larger weight than those that are more common). Weights are scaled to sum to 1 across items. Weights for new European countries, Luxembourg and Sweden use data from ESQL rather than ECHP. 7. Average of the countries listed above, weighted by the number of households in each country. Source: OECD.

DELSA/ELSA/WD/SEM(2006)6
23
Table 4. Share of households unable to afford basic leisure activities in OECD countries, most recent year
Percentage
Simple Weighted3
Australia HES, 2003-4 6 26 16 13Austria ECHP, 2001 10 21 16 15Belgium ECHP, 2001 8 20 14 12Czech Rep. EQLS, 2002 19 34 27 25Denmark ECHP, 2001 2 11 7 5Finland ECHP, 2001 9 26 17 15France ECHP, 2001 5 24 14 10Germany ECHP, 2001 14 21 17 17Greece ECHP, 2001 36 51 43 43Hungary EQLS, 2002 30 63 47 43Ireland ECHP, 2001 5 24 15 11Italy ECHP, 2001 16 36 26 24Japan SLC, 2003 -- 26 26 26Luxembourg ECHP, 2001 2 8 5 4Netherlands ECHP, 2001 5 13 9 8New Zealand NZLCS, 2000 5 21 13 10Poland EQLS, 2002 34 68 51 48Portugal ECHP, 2001 15 59 37 30Slovak Rep. EQLS, 2002 26 64 45 41Spain ECHP, 2001 7 37 22 16Sweden EQLS, 2002 4 15 10 8Turkey EQLS, 2002 29 66 48 44United Kingdom ECHP, 2001 24 24 24 24United States SIPP, 2003 -- -- -- --
Simple average 14 33 24 21Coeficient of variation 0.77 0.58 0.60 0.64
Average of different dimensionsSurvey and period
Inviting friends and relatives at least once
per month1
Having one week holiday away from
home at least once per year2
Notes. The symbol ��� indicates that no suitable survey question has been identified. Further information about national surveys is provided in Annex 1. For European countries, data in italics are based on ESQL rather than ECHP. Data for New Zealand and United States refer to shares of individuals (rather than households) living in households reporting different types of deprivation. Data from ECHP and SIPP are weighted with normalized cross-sectional households� weights. Data for New Zealand are from Jensen et al. (2002); they are weighted to take into account the probability of selection, of non-response and sample stratification. Data for Japan from the "Survey on Living conditions" are not weighted. 1. Data refer to respondents declaring that "they could not afford inviting friends/family at home for a drink/meal at least once a month" in European countries, Australia and New Zealand. 2. Data refer to respondents declaring that "they could not afford one-week holiday away from home at least once a year" in European countries, Australia and New Zealand; and that could not afford an overnight trip per year in Japan. 3. Weights vary inversely to the square root of the proportion of the population that does not have a given item (i.e. forms of deprivation which affect only a small share of the population are given a larger weight than those that are more common). Weights are scaled to sum to 1 across items. 4. Average of the countries listed above, weighted by the number of households in each country. Source: OECD.

DELSA/ELSA/WD/SEM(2006)6
24
Availability of consumer durables
33. There are large differences across OECD countries in the share of households possessing different consumer durables depending on the good considered (Table 5). While the share of households declaring that they do not possess a TV set or a telephone is, on average, 2% or less, 5 to 6% report not owing a video-recorder or a microwave, 13% do not own a car, and around 18 % or more do not own a personal computer. The shares of households lacking basic consumer durables are generally higher in Australia, Canada and the United States than in most European countries, but this may partly reflect differences in the wording of survey questions (in the former countries the survey question does not distinguish between financial constraints and voluntary choice). Cross-country differences in the possession of consumer durables are generally higher than in the case of basic needs and leisure activities, in particular when looking at possessions of cars and microwaves. Despite the high country variability, lack of one type of durables is very much correlated with that in another category. On average, 11% of OECD households report lacking some basic consumer durables, a share that declines to 9% when considering the weighted average.16
Table 5. Share of households lacking basic consumer durables in OECD countries, most recent year
Percentage
Simple Weighted2
Australia MPS, 2003, 2005; HES, 2003/04 1.00 16.00 9.00 4.00 11.00 32.00 12 7Austria ECHP, 2001 0.31 4.20 3.53 0.52 3.62 8.81 3 2Belgium ECHP, 2001 0.19 1.68 1.70 1.02 4.41 4.90 2 1Canada SHE, 2003 -- -- 7.00 3.70 -- -- 5 5Czech Rep. EQLS, 2002 -- -- -- -- 19.00 18.00 19 18Denmark ECHP, 2001 0.23 1.80 4.08 0.06 8.38 4.95 3 1Finland ECHP, 2001 0.79 3.85 1.60 0.16 5.29 8.14 3 2France ECHP, 2001; EQLS, 2002 0.44 5.23 4.17 0.98 4.50 11.00 4 3Germany ECHP, 2001; EQLS, 2002 0.46 .. .. 1.12 9.21 18.00 7 3Greece ECHP, 2001 1.51 14.37 16.51 1.98 14.17 16.30 11 7Hungary EQLS, 2002 -- -- -- -- 27.00 23.00 25 25Ireland ECHP, 2001 0.90 3.29 3.46 1.88 9.07 15.43 6 4Italy ECHP, 2001 0.79 5.51 8.92 1.38 3.05 15.13 6 4Japan SLC, 2003 -- 3.50 1.50 2.00 5.90 12.40 5 4Luxembourg ECHP, 2001; EQLS, 2002 0.00 0.00 0.00 0.03 2.00 2.00 1 0Netherlands ECHP, 2001 0.15 1.77 1.59 0.02 1.08 4.01 1 0New Zealand NZLCS, 2000 0.01 4.00 4.00 2.00 3.00 -- 3 1Poland EQLS, 2002 -- -- -- -- 30.00 40.00 35 35Portugal ECHP, 2001 1.87 16.83 24.82 5.13 16.12 26.10 15 11Slovak Republic EQLS, 2002 -- -- -- -- 29.00 28.00 29 28Spain ECHP, 2001 0.40 7.56 10.42 1.63 8.40 21.43 8 4Sweden ECHP, 2001; EQLS, 2002 0.00 0.00 0.00 .. 7.00 4.00 2 0Turkey EQLS, 2002 -- -- -- -- 62.00 61.00 62 61United Kingdom ECHP, 2001; EQLS, 2002 0.00 0.00 0.00 0.00 10.00 10.00 3 0United States SIPP, 2003 1.17 8.69 3.36 4.81 -- 33.27 10 6
Simple average 1 5 6 2 13 18 11 9Coeficient of variation 0.97 0.97 1.13 0.95 1.07 0.77 1.22 1.55
Survey and period Television1 Video-recorder1 Microwave oven1
Average of different dimensionsTelephone1 Car1 Personal
computer1
Notes: The symbol "�" indicates that no suitable survey question has been identified. The symbol ".." indicates that survey questions have been identified, but no data have been collected. Further information about national surveys is provided in Annex 1. For European countries, data in italics are based on ESQL rather than ECHP; data in bold require verification with country experts. Data for New Zealand and United States refer to shares of individuals (rather than households) reporting different types of deprivation. Data from ECHP and SIPP weighted with normalized cross-sectional households� weights. Data for New Zealand are from Jensen et al. (2002); they are weighted in the light of the probability of selection, non-response and sample stratification. Data for Japan from the "Survey on Living conditions" are not weighted. 1. Data refer to respondents declaring that "they do not have a given item as they could not afford to buy it" for European countries, Japan and New Zealand; and to respondents declaring that "they do not have a given item" in the United States, Canada and Australia. 2. Weights vary inversely to the square root of the proportion of the population that does not have a given item (i.e. form of deprivation which affect only a small share of the population are given a larger weight than those that are more common). Weights are scaled to sum to 1 across items. 3. Average of the countries listed above, weighted by the number of households in each country. Source: OECD.
16. When excluding countries for which only few indicators are available (Czech Republic, Hungary, Poland,
Slovak Republic and Turkey) the simple average falls to 8%.

DELSA/ELSA/WD/SEM(2006)6
25
Housing conditions
34. While housing conditions have two main dimensions � �quality�, such as basic amenities, state of repair and overcrowding, and �affordability�, most generally expressed as the ratio of rents or housing costs to household income � this section is limited to the first.17 Table 6 presents 8 indicators providing a comprehensive picture of the housing conditions of families. These conditions refer both to the dwelling and to the area where individuals live. In terms of basic features of dwellings, 4% or less of OECD households report lacking an indoor toilet, shower or hot running water, although with large differences across countries.18 A larger share of the population reports discomforts such as pollution, noise and crime (respectively 13%, 21% and 19%), with little variation across countries. The overcrowding indicator refers (in most cases) to dissatisfaction with respect to housing space: around 14% of all OECD households report this type of deprivation, with little variation across countries.19 Overall, the items describing housing conditions are not very correlated with each other, with the exceptions of overcrowding and pollution. The average share of OECD households experiencing critical housing conditions is 12%, based on unweighted data, and 8% based on weighted ones.
Financial stress
35. There are, in general, large cross-country differences in terms of the items considered within the component of �financial stress�, reflecting the diversity of items included. On average, 9% of households report having been unable to pay utility bills during the year preceding the survey, a share that is much higher in eastern European countries, Turkey and Australia (Table 7). Around 5% of households report not having been able to pay rents or mortgages, with small differences across countries. Only 3% of households report not having been able to repay other loans, but such data exist for only a few OECD countries and their interpretation raises specific problems.20 Finally, around 20% of households declare on average to have been unable to make their ends meet, with much higher values in several eastern European countries. Different forms of financial stress are generally highly correlated with each other, with the main exception of the indicator referring to the inability to repay loans. The simple OECD average of households suffering from financial strain is 10%, while the weighted average is 8%.21
17. Previous OECD research has gathered information on �housing affordability�, defined as house price-to-
income ratio or as house rent-to-income ratio [GOV/TDPC/URB (2004) 6].
18. The high dispersion reflects the existence of outliers, such as Greece, in terms of hot running water. The very high share of household reporting to lack indoor toilet in Luxembourg reflects the small number of observations for this question (and the use of �weighted� data) in Table 6.
19. An �objective� measure of overcrowding (households living in a flat with less than 1 room per person) suggests that only 2-3% of OECD households live in such conditions [GOV/TDPC/URB (2004)6]. This indicator, however, is only available for a few OECD countries and refers to the (average) share of the population living in these conditions.
20. This is because most household reporting material deprivation are also likely to face constraints in financial markets, hence limited indebtedness. Also, availability of consumer loans depends on the characteristics of credit markets, which differ among OECD countries.
21. The simple average is 16% when excluding Australia and Canada (where some indicators are missing).

DELSA/ELSA/WD/SEM(2006)6
26
Table 6. Share of households experiencing poor housing conditions in OECD countries, most recent year
Percentage
Simple Weighted9
Australia AHS, 1999 5 8 0 1 -- -- -- -- 3 2Austria ECHP, 2001 11 4 2 3 1 20 4 5 6 4Belgium ECHP, 2001 9 6 2 2 2 24 10 18 9 6Canada SHE, 2003 1 8 -- -- -- -- -- -- 5 3Czech Rep. EQLS, 2002 15 9 -- 5 -- 20 20 27 16 14Denmark ECHP, 2001 14 5 1 0 0 15 4 9 6 3Finland ECHP, 2001 14 2 1 1 2 22 14 23 10 5France ECHP, 2001 12 9 2 2 1 23 17 20 11 7Germany ECHP, 2001; EQLS, 2002 14 7 1 1 1 8 5 23 8 5Greece ECHP, 2001 19 9 4 6 79 23 15 6 20 13Hungary EQLS, 2002 18 19 -- 9 -- 21 22 36 21 19Ireland ECHP, 2001 7 5 1 1 2 11 7 10 5 4Italy ECHP, 2001 16 6 1 1 1 34 15 14 11 5Japan SLC, 2003 21 17 2 1 3 32 -- -- 13 7Luxembourg ECHP, 2001; EQLS, 2002 7 6 1 14 3 16 16 22 11 7Netherlands ECHP, 2001 11 8 0 0 0 35 11 19 11 3New Zealand NZLCS, 2000 -- 14 -- 0 0 21 7 -- 8 0Poland EQLS, 2002 30 25 -- 11 -- 20 22 29 23 22Portugal ECHP, 2001 22 23 8 7 8 18 19 22 16 14Slovak Rep. EQLS, 2002 14 26 -- 7 -- 17 18 34 19 17Spain ECHP, 2001 16 9 1 0 1 28 10 15 10 4Sweden ECHP, 2001; EQLS, 2002 5 4 1 1 -- 7 5 14 5 4Turkey EQLS, 2002 33 20 -- 12 -- 29 29 39 27 25United Kingdom ECHP, 2001 19 6 1 1 -- 22 7 19 11 5
United States SIPP, 2003 8 5 -- -- -- 17 3 5 8 7
Simple average 14 10 2 4 7 21 13 19 12 8Coefficient of variation 0.53 0.68 1.04 1.14 2.97 0.35 0.56 0.51 0.53 0.82
Survey and periodOver-
crowding1
Accomodation needs repairs2
Accomodation lacks indoor
shower/ bath3
Accomodation lacks indoor
toilet4
Accomodation lacks hot
running water5
Accomodation exposed to noise/ traffic nuisance6
Accomodation exposed to pollution7
Accomodation exposed to
crime8
Average of different dimensions
Notes. The symbol "�" indicates that no suitable survey question has been identified; the symbol ".." stands for not available. Further information about national surveys used is provided in Annex 1. For European countries, data in italics are based on ESQL rather than ECHP. Data for New Zealand and United States refer to shares of individuals (rather than households) living in households reporting different types of deprivation. Data from ECHP and SIPP are weighted with normalized cross-sectional households� weights. Data for New Zealand are from Jensen et al. (2002); they are weighted to account for probability of selection, non-response and sample stratification. Data for Japan from the "Survey on Living conditions" are not weighted. 1. Data refer to households declaring that "their dwelling does not have a sufficient number of rooms" in Australia; "that are not satisfied with the space of their dwelling" in European countries; "that they are somewhat or very dissatisfied with the space in their dwelling" in the United States; that they live in dwelling where "each member of the household does not have its own room" in Canada; that they have an "insufficient number of bedrooms" in New Zealand; and to the average of those declaring that they could not afford "more than one bedroom", "a bedroom different from the living room" and "enough storage space" in Japan. 2. Data refer to households declaring that "their dwelling is in essential need of repair" in Australia; to those reporting "dampness, leakiness and rot in the dwelling" in European countries; to those declaring that their dwelling is "in need of repair" in Canada; to the average share reporting "draughts" and "dampness� in New Zealand; to the average share reporting "cracks in the wall", "leaking roof", "broken windows" and "to be (very) dissatisfied with the state of repair of the dwelling" in the United States; and to the average of those declaring that they could not afford repairing "rainwater leaking or air sipping" and "dampness or lack of fresh air" in Japan. 3. Respondents declaring that "their accommodation does not have a bath or a shower" in European countries and Australia; and that could not afford a bathroom (not shared with other dwellings) for the family's own use in Japan. 4. Respondents declaring that their accommodation "does not have an indoor flushing toilet" in European countries and Australia; and that could not afford a toilet (not shared with other dwellings) for the family's own use in Japan. 5. Respondents declaring that "their accommodation does not have hot running water" in European countries and New Zealand; and that could not afford a hot-water heater in Japan. 6. Data refer to respondents declaring that "their accommodation suffers from noise from neighbours or outside" in European countries; that their "neighbourhood suffers from traffic noise problems" in the United States; that "their accommodation suffers from various problems like traffic noise, pollution and smell" in New Zealand; and that they can hear noises from neighbours in Japan. 7. Data refer to respondents declaring that "their accommodation suffers from pollution, grime or other environmental problem caused by traffic or industry" in European countries; to the average share of respondents declaring that "there are odours, smoke or gas fumes" and "there are problems caused by industry and business" in the United States; to respondents declaring that "their accommodation suffers from various environmental problems like traffic noise, pollution and smell" in New Zealand. 8. Data refer to people declaring that "there is crime or vandalism in the area where they live" in European countries; to the average share of those reporting that they do not consider "their home " and "their neighbourhood" safe in the United States. 9. Weights vary inversely to the square root of the proportion of the population lacking a given item (i.e. forms of deprivation which affect only a small share of the population have a larger weight than those that are more common). Weights sum to 1 across items. 10. Average of the countries listed above, weighted by the number of households in each country. Source: OECD.

DELSA/ELSA/WD/SEM(2006)6
27
Table 7. Share of households reporting various forms of financial stress in OECD countries, most recent year
Percentage
Simple Weighted5
Australia HES, 2003-4 15 -- -- -- 15 15Austria ECHP, 2001 1 1 1 14 4 2Belgium ECHP, 2001 5 4 2 11 5 5Canada SFS, 1999 14 -- -- -- 14 14Czech Rep. EQLS, 2002 7 5 -- 19 10 9Denamrk ECHP, 2001 2 1 1 11 4 2Finland ECHP, 2001 6 7 9 12 9 8France ECHP, 2001 5 3 2 12 5 4Germany ECHP, 2001; EQLS, 2002 4 6 .. 9 6 6Greece ECHP, 2001 21 4 3 49 19 11Hungary EQLS, 2002 18 7 -- 28 18 15Ireland ECHP, 2001 3 3 2 10 5 4Italy ECHP, 2001 3 2 1 22 7 4Japan SLC, 2003 5 6 5 25 10 8Luxembourg ECHP, 2001 3 1 0 7 3 1Netherlands ECHP, 2001 1 2 1 9 3 2New Zealand NZLCS, 2000 10 7 10 -- 9 9Poland EQLS, 2002 28 7 -- 53 29 22Portugal ECHP, 2001 1 3 1 34 10 4Slovak Rep. EQLS, 2002 15 11 -- 24 17 16Spain ECHP, 2001 3 2 1 21 7 4Sweden ECHP, 2001; EQLS, 2002 4 3 .. 5 4 4Turkey EQLS, 2002 26 11 -- 48 28 24United Kingdom ECHP, 2001; EQLS, 2002 11 3 .. 7 7 6United States SIPP, 2003 10 6 -- 15 10 10
Simple average 9 5 3 20 10 8Coefficient of variation 0.88 0.65 1.12 0.70 0.70 0.75
Survey and period Arrears in bills during the past
year1
Arrears in mortgages/ rents during the past
year2
Arrears in repayment of loans
during the past year3
Inability to make ends
meet 4
Average of different dimensions
Notes. The symbol ��� indicates that no suitable survey question has been identified; the symbol �..� indicates that data are not available. Further information about the national surveys used is provided in Annex 1. For European countries, data in italics are based on ESQL rather than ECHP. Data for New Zealand refer to shares of individuals (rather than households) living in households reporting different types of deprivation. Data from ECHP and SIPP are weighted with normalized cross-sectional households� weights. Data for New Zealand and United States are from Jensen et al. (2002); they are weighted to take into account the probability of selection, of non-response and sample stratification. Data for Japan from the "Survey on Living conditions" are not weighted. 1. Respondents declaring that "they were unable to pay unscheduled bills during the past 12 months" in European countries, Australia and New Zealand; that "they were behind two months or more in paying bills or loans" in Canada; that "did not meet all essential expenses" in the United States; and that experienced interruption of services (gas, water, telephone and others) because of failing to pay bills in Japan. 2. Respondents declaring that "they were unable to pay rents or mortgages during the past 12 months" in European countries, United States and New Zealand; that "they were behind two months or more in paying rents and mortgages" in Canada; and to those declaring that either "their family had experienced arrears in rents" or "arrears in repaying loans" over the past year in Japan. 3. Respondents declaring that "they were unable to pay hire-purchase instalments or loans during the past 12 months" in European Countries and New Zealand; and that "experienced arrears in repaying credit cards and consumer loans in the past year" in Japan. 4. Respondents declaring that "during the last year that they could make ends meet with (great) difficulty" in European countries; that "there has been a time during the last 12 months where the household has not met its essential expenses" in the United States; and that "they run into red every month" in Japan. 5. Weights vary inversely to the square root of the share of the population lacking a given item (i.e. forms of deprivation which affect only a small share of the population have a larger weight than those that are more common). Weights sum to 1 across items. 6. Average of the countries listed above, weighted by the number of households in each country. Source: OECD.
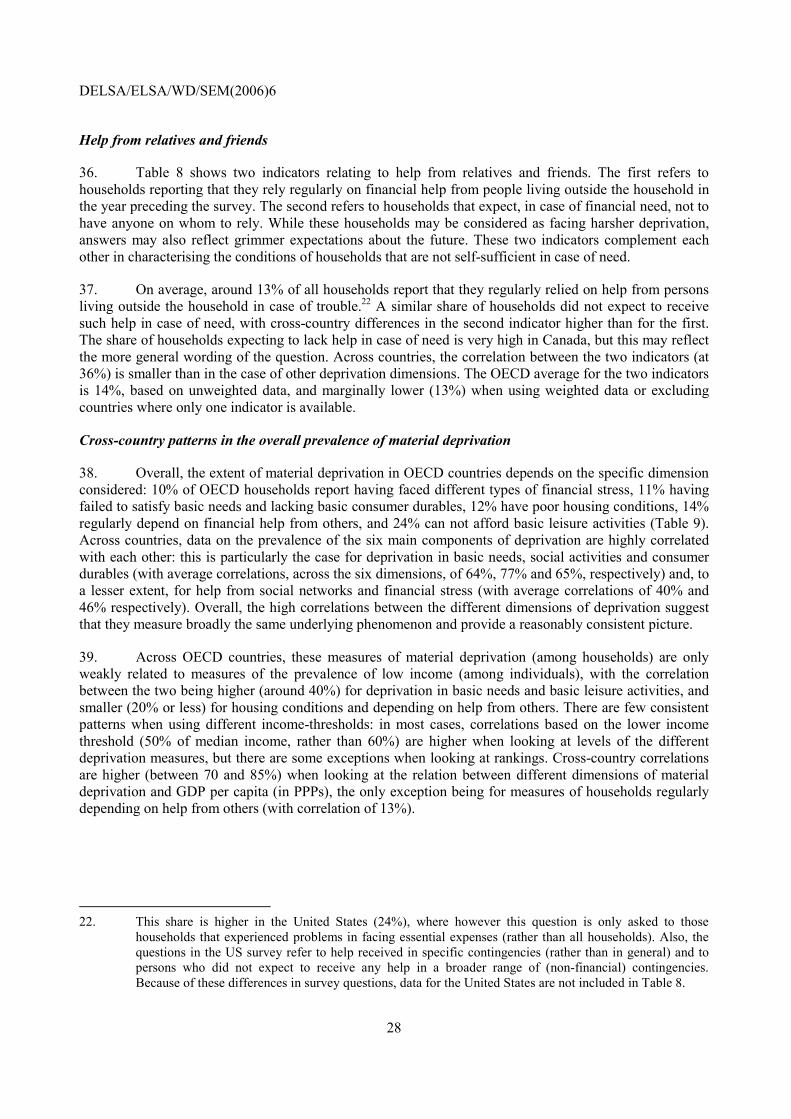
DELSA/ELSA/WD/SEM(2006)6
28
Help from relatives and friends
36. Table 8 shows two indicators relating to help from relatives and friends. The first refers to households reporting that they rely regularly on financial help from people living outside the household in the year preceding the survey. The second refers to households that expect, in case of financial need, not to have anyone on whom to rely. While these households may be considered as facing harsher deprivation, answers may also reflect grimmer expectations about the future. These two indicators complement each other in characterising the conditions of households that are not self-sufficient in case of need.
37. On average, around 13% of all households report that they regularly relied on help from persons living outside the household in case of trouble.22 A similar share of households did not expect to receive such help in case of need, with cross-country differences in the second indicator higher than for the first. The share of households expecting to lack help in case of need is very high in Canada, but this may reflect the more general wording of the question. Across countries, the correlation between the two indicators (at 36%) is smaller than in the case of other deprivation dimensions. The OECD average for the two indicators is 14%, based on unweighted data, and marginally lower (13%) when using weighted data or excluding countries where only one indicator is available.
Cross-country patterns in the overall prevalence of material deprivation
38. Overall, the extent of material deprivation in OECD countries depends on the specific dimension considered: 10% of OECD households report having faced different types of financial stress, 11% having failed to satisfy basic needs and lacking basic consumer durables, 12% have poor housing conditions, 14% regularly depend on financial help from others, and 24% can not afford basic leisure activities (Table 9). Across countries, data on the prevalence of the six main components of deprivation are highly correlated with each other: this is particularly the case for deprivation in basic needs, social activities and consumer durables (with average correlations, across the six dimensions, of 64%, 77% and 65%, respectively) and, to a lesser extent, for help from social networks and financial stress (with average correlations of 40% and 46% respectively). Overall, the high correlations between the different dimensions of deprivation suggest that they measure broadly the same underlying phenomenon and provide a reasonably consistent picture.
39. Across OECD countries, these measures of material deprivation (among households) are only weakly related to measures of the prevalence of low income (among individuals), with the correlation between the two being higher (around 40%) for deprivation in basic needs and basic leisure activities, and smaller (20% or less) for housing conditions and depending on help from others. There are few consistent patterns when using different income-thresholds: in most cases, correlations based on the lower income threshold (50% of median income, rather than 60%) are higher when looking at levels of the different deprivation measures, but there are some exceptions when looking at rankings. Cross-country correlations are higher (between 70 and 85%) when looking at the relation between different dimensions of material deprivation and GDP per capita (in PPPs), the only exception being for measures of households regularly depending on help from others (with correlation of 13%).
22. This share is higher in the United States (24%), where however this question is only asked to those
households that experienced problems in facing essential expenses (rather than all households). Also, the questions in the US survey refer to help received in specific contingencies (rather than in general) and to persons who did not expect to receive any help in a broader range of (non-financial) contingencies. Because of these differences in survey questions, data for the United States are not included in Table 8.

DELSA/ELSA/WD/SEM(2006)6
29
Table 8. Share of households relying on support from others in OECD countries, most recent year
Percentage
Simple Weighted3
Australia HES, 1998-99 10 14 12 12Austria EQLS, 2002 13 4 9 7Belgium EQLS, 2002 7 15 11 10Canada SFS, 1999 -- 47 47 47Czech Rep. EQSL, 2002 14 12 13 13Denmark EQLS, 2002 10 10 10 10Finland EQLS, 2002 13 5 9 8France EQLS, 2002 9 16 13 12Germany EQLS, 2002 8 13 11 10Greece EQLS, 2002 19 10 15 14Hungary EQLS, 2003 20 15 18 17Ireland EQLS, 2002 8 4 6 6Italy EQLS, 2002 6 7 7 6Japan SLC, 2003 10 -- 10 10Luxembourg EQLS, 2002 6 9 8 7Netherlands EQLS, 2002 10 12 11 11New Zealand NZLCS, 2000 14 -- 14 14Poland EQLS, 2002 17 19 18 18Portugal EQLS, 2002 12 14 13 13Slovak Rep. EQLS, 2002 17 10 14 13Spain EQLS, 2002 12 5 9 8Turkey EQLS, 2002 19 20 20 19United Kingdom EQLS, 2002 11 13 12 12United States SIPP, 2003 24 -- 24 24
Simple average 13 13 14 13Coefficient of variation 0.38 0.69 0.60 0.62
Survey and periodReceived regular help
from persons living outside the household1
Inability to raise support in case of
need2
Average of different dimensions
Notes. The symbol ��� indicates that no suitable survey question has been identified. Further information about the national surveys used is provided in Annex 1. Data for New Zealand and United States refer to shares of individuals (rather than households) living in households reporting different types of deprivation. Data from SIPP are weighted with normalized cross-sectional households� weights. Data for New Zealand are from Jensen et al. (2002); they are weighted to take into account the probability of selection, of non-response and sample stratification. Data for Japan from the "Survey on Living conditions" are not weighted. 1. Data refer to respondents declaring that "they received regular help in the form of either money or food from a person not living in the household" in European countries; that "they were helped by friends, extended family, public services and not-for-profit organizations when they could not pay utility bills or rents and mortgages" in United States; that "borrowed money from family and friends to meet everyday living costs" in New Zealand; that "they sought for financial help from friends and family� in Australia; and that "had to borrow from relatives and friends to meet daily living expenses over the past year" in Japan. 2. Data refer to respondents declaring that "they do not expect any support if they urgently needed to raise � 1000 to face an emergency" in European countries; that they "could not rely on someone for financial assistance in case of financial difficulties" in Canada; that "they could not obtain within a week a sum of A$ 2000 for something important thanks to loan from family and friends" in Australia; that "they could not obtain within a week a sum of NZ$ 1500 and NZ$ 5000 thanks to loan from family/friends" in New Zealand. 3. Weights vary inversely to the square root of the proportion of the population that does not have a given item (i.e. forms of deprivation which affect only a small share of the population are given a larger weight than those that are more common). Weights are scaled to sum to 1 across items. 4. Average of the countries listed above, weighted by the number of households in each country. Source: OECD.

DELSA/ELSA/WD/SEM(2006)6
30
Table 9. Prevalence of material deprivation in OECD countries and correlation with relative income poverty and GDP per capita
Basic needsBasic leisure
and social activities
Lack of consumer durables
Poor housing
conditions
Financial stress
Depending on help from
others
Average of six
components
50% of the median
60% of the median
Australia 7 16 12 3 15 12 11 11 20 26 569Austria 6 16 3 6 4 9 7 9 16 28 383Belgium 6 14 2 9 5 11 8 .. .. 26 250Canada 8 .. 5 5 14 47 16 10 17 28 029Czech Republic 13 27 19 16 10 13 16 4 10 14 573Denmark 2 7 3 6 4 10 5 4 12 28 489Finland 6 17 3 10 9 9 9 6 14 25 686France 5 14 4 11 5 13 9 7 13 26 353Germany 6 17 7 8 6 11 9 9 14 25 167Greece 24 43 11 20 19 15 22 14 21 16 258Hungary 20 47 25 21 18 18 25 8 14 12 018Ireland 5 15 6 5 5 6 7 15 23 28 548Italy 14 26 6 11 7 7 12 13 20 25 251Japan 3 26 5 13 10 10 11 15 21 26 067Luxembourg 4 5 1 11 3 8 5 5 13 49 117Netherlands 5 9 1 11 3 11 7 6 12 27 322New Zealand 8 13 3 8 9 14 9 10 20 20 584Poland 25 51 35 23 29 18 30 10 16 10 293Portugal 25 37 15 16 10 13 19 14 21 17 369Slovak Republic 24 45 29 19 17 14 24 .. .. 10 766Spain 12 22 8 10 7 9 11 12 20 20 480Sweden 4 10 2 5 4 .. 5 5 11 26 920Turkey 43 48 62 27 28 20 38 16 23 6 820United Kingdom 5 24 3 11 7 12 10 11 19 25 625United States 8 .. 10 8 10 24 12 17 24 34 611
Average 11 24 11 12 10 14 14 10 17 23 502
Correlation with poverty rate (50%)Levels 40% 49% 31% 19% 37% 15% 38% .. .. ..Ranks 44% 40% 47% 10% 47% 13% 48% .. .. ..
Correlation with poverty rate ( 60%)Levels 35% 38% 24% 11% 32% 11% 30% .. .. ..Ranks 48% 35% 46% 5% 49% 13% 47%
Correlation with GDP per capitaLevels 78% 84% 74% 74% 73% 13% 81% .. .. ..Ranks 75% 87% 70% 81% 70% 2% 78% .. .. ..
Relative income-poverty rate with thresholds at:Share of households (in %) reporting material deprivation in terms of:
GDP per capita (PPP)
Note. Values of correlation coefficients are shown with their absolute sign (e.g. in the case of GDP per capita, the correlation coefficient is negative, i.e. prevalence of material deprivation is higher in OECD countries with lower GDP per capita). Source: OECD.
40. An overall measure of material deprivation can be obtained by taking the simple average of the deprivation indicators across the six main components. This overall measure of material deprivation is only weakly correlated with the prevalence of income poverty (the correlation coefficient is around 40% when using a threshold set at half of the median) while it is stronger (over 80%) with respect to GDP per capita, which suggests that this simple measure of material deprivation provide information about �absolute� poverty, as shaped by the economic development of each country (Figure 3). However, when limiting the comparisons to a more homogenous group of countries in terms of income (i.e. those with a GDP per capita above USD 25 000) the opposite patterns appears to hold, i.e. a more significant correlation with relative income (at around 0.60) and no significant association with the level of economic development of each country. This suggests that the measures of material deprivation shown here also reflect the extent of income inequality in different countries.23
23. Relative income poverty is a function of both the average level of income in each country and its
distribution. When the analysis is limited to countries which are more similar in their per capita income, income inequality turns out as the most significant factor. While it is not possible to interpret this relation

DELSA/ELSA/WD/SEM(2006)6
31
Shortcoming of available measures
41. While the evidence reviewed above suggests some consistent patterns, it also highlights important limits in the available measures. First, there are differences in the information collected though surveys which limit cross-country comparability. Surveys differ in the wording of questions (in particular whether they distinguish between enforced and chosen lack of a particular item) and whether they rely on answers from a representative individual (usually the reference person) or from all household members.24 The experience of some OECD countries has also highlighted large changes in the number of people reporting material deprivation following the introduction of new surveys (Ireland), which may reflect changes in the order in which some questions were put or in the greater willingness of a new cohort of respondents in admitting deprivation.
42. Second, there are limits in the evidence presented above, which ignores differences among groups of individuals (e.g. a failure to take a week holiday may be more critical for children than for the elderly) and between countries (e.g. inviting friends at home is less common in some OECD countries than in others). The evidence presented above is also based on a variety of surveys in the case of Australia and Canada. And, finally, the summary indices shown are based on aggregate (rather that individual) data, which precludes the possibility of constructing scores of multiple deprivations. Some of the findings from the rich research on multiple deprivations are presented next.
Figure 3. Material deprivation, relative income poverty and per capita GDP
AUSAUT
CAN
CZEDEN
FINFRA
GER
GRE
HUN
IRLITA
JPN
LUXNLD
NZL POL
POR
SPA
SWE
TUR
UKG
USA
0
4
8
12
16
20
0 10 20 30 40Material deprivation
Rel
ativ
e in
com
e po
verty
USAUKG
TUR
SWESPA POR
POLNZL
NLD
LUX
JPN
ITAIRL
HUN
GREGER
FRA
FIN
DEN
CZE
CANAUT
AUS
0
10000
20000
30000
40000
50000
60000
0 10 20 30 40Material deprivation
GD
P pe
r cap
ita
Note. Relative income poverty around 2000, based on a threshold set at half of the median. OECD countries with per capita GDP below USD 25 000 are denoted with a diamond. The grey dashed line in each panel is the trend line between the two variables that obtains when limiting the analysis to countries with per capita GDP above USD 25 000.
Source: See Table 9.
in terms of causality, the figure suggests that monetary and non monetary measures of poverty convey a broadly consistent picture.
24. Data from the second wave of the Household Income and Labour Dynamics in Australia (HILDA) survey (which are not those reported in Tables 3-8) highlight significant differences in the reporting of material deprivation among partners of the same household, especially for household with intermediate levels of income (Breunig et al. 2005). This suggests that surveys that rely on replies from a single representative individual may understate the extent of material deprivation

DELSA/ELSA/WD/SEM(2006)6
32
4. MULTI-DIMENSIONAL MEASURES OF MATERIAL DEPRIVATION
Introduction
43. Measures of the prevalence of material deprivation based on aggregate data (as those presented above) shed only limited light on the severity of the underlying problem: in particular, they do not distinguish between situations where the same household experiences different types of deprivation and those where these experiences are widely shared. Addressing this problem requires the use of micro-data.25
44. This section reviews some of the key findings from research on material deprivation based on micro-data. It focuses on four issues: i) the aggregation of elementary indicators of material deprivation into a composite index; ii) the socio-demographic characteristics of persons reporting different forms of deprivation; iii) the evidence on the transitory or persistent character of material deprivation; and iv) the extent of overlap between non-monetary and monetary measures of poverty.
Composite indices of material deprivation
45. Building a multi-dimensional measure of deprivation based on individual records requires, first, a selection of a subset of items among those collected through surveys; second, their aggregation into a synthetic measure of the probability that a person experiences different forms of deprivation at the same time; and, third, a threshold above which a person is considered to be poor.
• The main approaches used to select elementary indicators rely on either the arbitrary choices of researchers or statistical tools (e.g. factor analysis). These tools reveal the underlying correlation between elementary indicators, permit to identify indicators with similar properties and to retain the sub-set that best summarises the available information. However, while multivariate tools satisfy a number of properties that guarantee the robustness of the composite index, they also have weaknesses and their application is often limited because of data availability.26
• After having identified a suitable set of elementary items, most composite indices of deprivation rely on the aggregation, for each respondent, of a list of binomial variables that measure the occurrence of different forms of deprivation. The aggregation can be based on either the sum of the binomial variables or by weighting them by their degree of importance, i.e. items that are more prevalent in a given society are given more weight than those that are more rare.27
25. Dutta et al. (2005) compare aggregation procedures based on either the distributions of each deprivation
item or on the joint distribution of all the relevant items. They show that these two procedures yield the same result only under stringent conditions, and that the second procedure is conceptually sounder.
26. For a description of the use of multivariate tools to construct composite indicators, see Hoffman et al. (2005).
27. The practical implications of weighting also depend on the homogeneity of the different items. In the case of items relating to the same form of deprivation, their correlation will in general be high and weighting will make little difference to the results. When dealing with different forms of deprivation, the item with the highest level will unduly influence the aggregate, even if other items are conceptually more important; in this case, simple and weighted average will differ more significantly.

DELSA/ELSA/WD/SEM(2006)6
33
• With respect to the choice of thresholds, most studies of material deprivation use an absolute standard, most often with a threshold defined by specifying a minimum number of items, and counting people as �poor� when they report deprivation in (at least) these items. Other approaches rely on �relative� thresholds, whereby the number of items whose lack is used to define poverty is set at a level where the number of people lacking them is the same as that of the income poor (Layte et al., 2001).
46. Multidimensional indices of deprivation based on absolute thresholds have been developed in several studies. Estimates of the extent of multiple deprivation are however difficult to compare across studies, as they depend crucially on the items across which multiple deprivation is assessed.28 Eurostat (2002) and Layte et al. (2001) provide a composite index based on 24 items (out of the 35 available in the ECHP questionnaire) for European countries; the absolute deprivation threshold is set as lacking 60% or more of these items, and is the same for all the countries.29 According to this overall index of deprivation, 15% of the population of 15 EU countries experienced multiple deprivations in 1997, ranging between 8% in Denmark and 34% in Portugal (Table 10). Countries with a higher overall deprivation index are those with higher income poverty rates (based on a 60% of median income threshold) and lower per capita GDP (at PPP rates), with a cross-country variation in the overall deprivation score that is higher than for income poverty. For Australia, Bray (2001) constructed a composite index of deprivation through factor analysis; based on this he concluded that about 44% of Australian households experienced a �lower� form of financial stress, and 26% a �higher� form.30 For Japan, Abe (2006) concluded � based on a summary index relying on 16 items, weighted by the share of the population possessing each item � that 14% of all households lacked two or more �basic necessities� and 9% lacked three or more.
28. By construction, multiple deprivation will be higher when considering items that reflect the same
underlying experience and lower when selecting items capturing different phenomena.
29. This threshold is such that the overall deprivation measure equals the income poverty rate for EU-15 countries. The overall index of deprivation is built through factor analysis to identify clusters of items and to establish how � within each of them � the different dimensions correlate with each other. This analysis produces five types of deprivation: i) basic life-style (or �primary�) deprivation, which includes deprivation in basic-needs, in some basic leisure activities (i.e. having at least one-week holiday per year, having family and friends at home for a meal) and in arrears in the payments of utility bills; ii) �secondary� life-style deprivation, which includes lack of six consumer durables; iii) �housing conditions�, based on three basic housing facilities; iv) �housing deterioration�, which groups items describing the state of the dwelling; and v) �environmental problems�, which encompass noise, pollution, crime, shortage of space and darkness of the dwelling. An overall index of deprivation is built as the weighted average of the person�s deprivation indices on the five dimensions.
30. Bray identifies three types of financial stress: i) �missing out� (which includes inability to receive friends/family for a meal; to afford a special meal once a week, one-week of holiday once a year and a night out at least once in the past two weeks, having to buy second-hand rather than new clothes, lack of hobbies and leisure activities); ii) �cash-flow problems� (i.e. inability to pay motor-vehicle registration and insurance bills on time, to pay utilities bills, and having had to seek financial assistance from families and friends) and iii) �hardship� (i.e. having skipped a meal due to shortage of money, having sought financial assistance from others and having pawned or sold personal items). These three types of deprivation are then combined into two indexes of �low� and �high� deprivation: the first records whether households are experiencing any of the three forms of deprivation, while the second indicates whether respondents experience two or more difficulties.
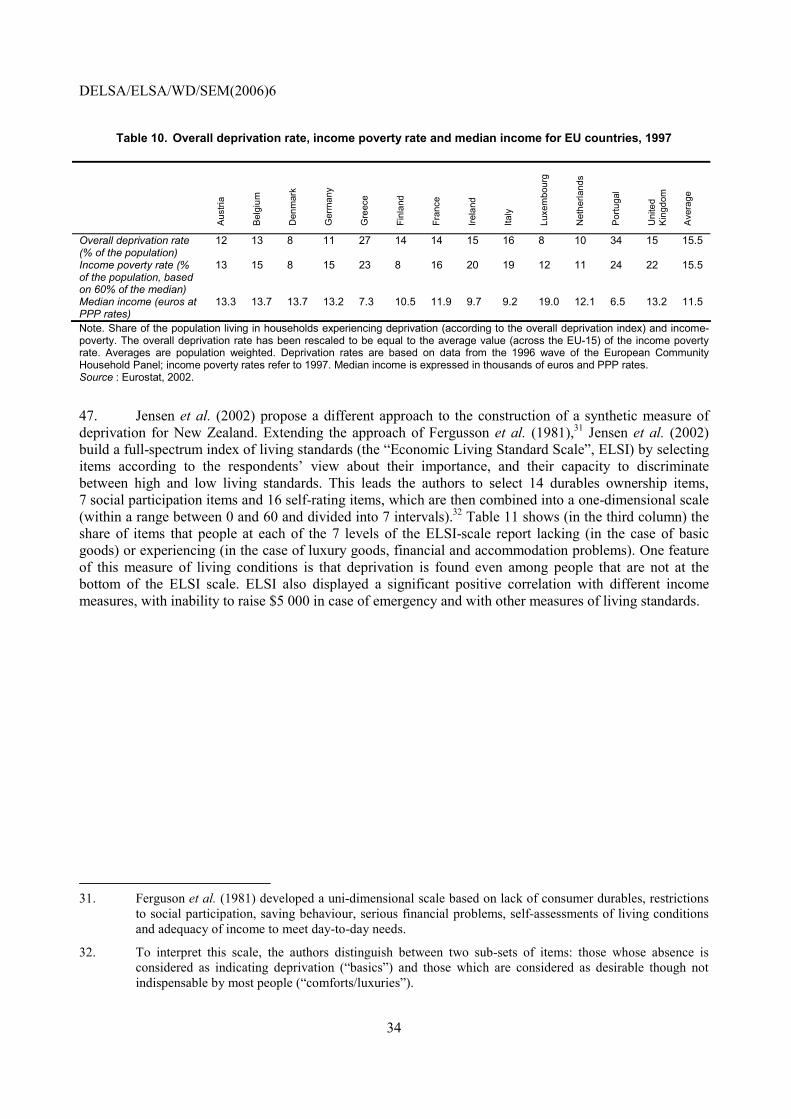
DELSA/ELSA/WD/SEM(2006)6
34
Table 10. Overall deprivation rate, income poverty rate and median income for EU countries, 1997
Aus
tria
Bel
gium
Den
mar
k
Ger
man
y
Gre
ece
Finl
and
Fran
ce
Irela
nd
Italy
Luxe
mbo
urg
Net
herla
nds
Por
tuga
l
Uni
ted
Kin
gdom
Ave
rage
Overall deprivation rate (% of the population)
12 13 8 11 27 14 14 15 16 8 10 34 15 15.5
Income poverty rate (% of the population, based on 60% of the median)
13 15 8 15 23 8 16 20 19 12 11 24 22 15.5
Median income (euros at PPP rates)
13.3 13.7 13.7 13.2 7.3 10.5 11.9 9.7 9.2 19.0 12.1 6.5 13.2 11.5
Note. Share of the population living in households experiencing deprivation (according to the overall deprivation index) and income-poverty. The overall deprivation rate has been rescaled to be equal to the average value (across the EU-15) of the income poverty rate. Averages are population weighted. Deprivation rates are based on data from the 1996 wave of the European Community Household Panel; income poverty rates refer to 1997. Median income is expressed in thousands of euros and PPP rates. Source : Eurostat, 2002.
47. Jensen et al. (2002) propose a different approach to the construction of a synthetic measure of deprivation for New Zealand. Extending the approach of Fergusson et al. (1981),31 Jensen et al. (2002) build a full-spectrum index of living standards (the �Economic Living Standard Scale�, ELSI) by selecting items according to the respondents� view about their importance, and their capacity to discriminate between high and low living standards. This leads the authors to select 14 durables ownership items, 7 social participation items and 16 self-rating items, which are then combined into a one-dimensional scale (within a range between 0 and 60 and divided into 7 intervals).32 Table 11 shows (in the third column) the share of items that people at each of the 7 levels of the ELSI-scale report lacking (in the case of basic goods) or experiencing (in the case of luxury goods, financial and accommodation problems). One feature of this measure of living conditions is that deprivation is found even among people that are not at the bottom of the ELSI scale. ELSI also displayed a significant positive correlation with different income measures, with inability to raise $5 000 in case of emergency and with other measures of living standards.
31. Ferguson et al. (1981) developed a uni-dimensional scale based on lack of consumer durables, restrictions
to social participation, saving behaviour, serious financial problems, self-assessments of living conditions and adequacy of income to meet day-to-day needs.
32. To interpret this scale, the authors distinguish between two sub-sets of items: those whose absence is considered as indicating deprivation (�basics�) and those which are considered as desirable though not indispensable by most people (�comforts/luxuries�).

DELSA/ELSA/WD/SEM(2006)6
35
Table 11. A composite index of living standards for New Zealand, 2000
ELSI Score Range
ELSI Level
Share of survey items experienced by people at different levels of the ELSI range Label
0-15 Level 1 Lack 35% of all basics items; Have 10% of comforts/luxuries; Have 47% of the financial problems; Have 35% of the accommodation problems; Lack 22% of the child basics
"Very restricted" living standard
16-23 Level 2 Lack 22% of basics; Have 16% of comforts/luxuries; Have 36% of the financial problems; Have 29% of the accommodation problems; Lack 13% of the child basics
"Restricted" living standard
24-31 Level 3 Lack 11% of basics; Have 24% of comforts/luxuries; Have 20% of the financial problems; Have 23% of the accommodation problems; Lack 5% of the child basics
"Somewhat restricted" living standard
32-39 Level 4 Lack 6% of basics; Have 31% of comforts/luxuries; Have 12% of the financial problems; Have 17% of the accommodation problems; Lack 3% of the child basics
"Fairly comfortable" living standard
40-47 Level 5 Lack 2% of basics; Have 45% of comforts/luxuries; Have 5% of the financial problems; Have 11% of the accommodation problems; Lack 1% of the child basics
"Comfortable" living standard
48-55 Level 6 Lack 0.4% of basics; Have 65% of comforts/luxuries; Have 2% of the financial problems; Have 7% of the accommodation problems; Lack 0% of the child basics
"Good" living standard
56-60 Level 7 Lack 0% of basics; Have 88% of comforts/luxuries; Have 1% of the financial problems; Have 4% of the accommodation problems; Lack 0% of child basics
"Very good" living standard
Source: Jensen et al. 2002.
48. Other studies define composite indices of material deprivation based on the severity of the circumstances experienced by individuals.33 This approach relies on the joint occurrence of different forms of deprivation. Assessments of the relevance of this composite measure are generally based on the existence of a high correlation between items included in the composite index, and between the combined index of deprivation and the income poverty rate. Studies that have relied on this approach suggest that, in general, households experiencing material hardship tend to cumulate more than two difficulties at the same time.34 Examples of this approach are mainly found in US studies, though there is some European research as well. Förster (2005) compares material deprivation of (14 �old�) EU countries with the situation in the Czech Republic, Hungary and Slovenia. A measure of multiple deprivations (defined as being deprived in at least two out of the four domains) suggests that material deprivation affected around 15% of the population in the �old� EU countries, as compared to values between 40% and 56% in the three new EU countries. The population share not experiencing any form of deprivation ranged between 13% in Hungary and 27% in the Czech Republic, as compared to close to 60% in the EU-average.
49. Boushey et al. (2001) rely on a similar approach to study the relationship between material deprivation and poverty (as measured through family budgets) in the United States. Their approach � which follows that of Beverly (2000), Bauman (1998) and Mayer and Jencks (1989) � is based on a selection of objective indicators, distinguishing between �critical hardships� (the extent to which families fail to meet their basic needs for survival) and �serious hardships� (the extent to which families lack the goods, services and financial stability required to maintain employment and a healthy home
33. Bauman (1999, 2003) studied multiple hardships in the United States based on SIPP data for 1995 and
1998. He reports that, in 1995, about one household in five could not satisfy its basic needs, and about half failed to satisfy more than one.
34. For instance, Bauman (1998) notes that, in the United States, �the odds of reporting multiple hardship were around half the odds of reporting a single hardship among those in the lowest categories of income. At the highest categories, the odds of reporting multiple hardships fell to around 35% of the odds of reporting a single hardship�. Edin and Lein (1996) showed that worst-off families implement survival strategies that play one type of need against another; this suggests that an index of hardship that refers to households experiencing two difficulties at the same time is a good proxy of the extent of overall deprivation.
DELSA/ELSA/WD/SEM(2006)6
36
environment).35 In 1997, around 16% of US households were identified as reporting one or more forms of critical hardships, and around 3% as reporting two or more; further, close to half of all households reported one or more forms of serious hardships, while around 20% declared to face two or more. In 1993 (based on a different survey), 9% of US households experienced one or more forms of critical hardships, and 2% experienced two or more.
50. The obvious question raised by these various methods of constructing composite indices is which of them captures best deprivation. There is, unfortunately, no simple way of answering this question. An alternative approach is to examine in more detail just who is �deprived� on the various dimensions, and to look at the relationship between deprivation-based measures and those based on income.
Socio-economic characteristics of persons affected by material deprivation
51. The probability of experiencing material deprivation depends on a range of characteristics of individuals and the household where they live. Several studies have relied on multivariate tools to identify characteristics that are strongly associated to the probability of experiencing material deprivation. While differing in the range of controls used, most of these studies provide a consistent picture of the socio-economic characteristics of persons affected by material deprivation.
• Income. There is, in general, a weak correlation between personal income and the probability of experiencing different forms of material deprivation, with most studies reporting correlation coefficients between 0.33 and 0.54 (Perry, 2002).36 Lower-income individuals are, on average, more likely to experience material deprivation than higher-income ones, and deprived individuals are most likely to be counted among the income-poor. Figure 3 provides evidence on the odds of experiencing material deprivation, by level of household income in European countries: on average, the probability of experiencing material deprivation is twice as large among people in the lower quartile of the income distribution as for those in the middle quartile, although these differences are significantly lower in some countries (e.g. Germany).
35. In the analysis of Boushley et al. (2001), a household is considered as experiencing a �critical� hardship if
one of its members goes without necessary medical care, did not have enough to eat sometimes or often, had been evicted and/or had utilities disconnected, or shared accommodation with friends or family because it could not afford its housing payments. �Serious� hardship is defined as the occurrence of any of the following difficulties: families� worry about food insecurity or inadequacies; inability to pay mortgages, rent or utility bills; telephone service interrupted due to missed payment; not having health insurance; use of the emergency room as the usual place of health care; child-to-adult care ratio less than that recommended by Institutional Standards; child cared during non-school hours without any external assistance; child not involved in any enrichment activities. Indicators for critical and serious hardships are based on different questions in the National Survey of America's Families and the Survey on Income and Program Participation..
36. According to Layte et al. (2001), the correlation is weaker in countries characterised by higher per-capita income and more generous welfare programmes.

DELSA/ELSA/WD/SEM(2006)6
37
Figure 3. Mean deprivation in European countries, by quartiles of equivalent household income
0
10
20
30
40
50
DENSWE
LUX
AUTNDL
FIN GER IRL
BEL ITAUKG
EU15 FRA
SPAEU25 CZE
GRCPRT
HUNSLK POL
TUR
Lower quart ileM iddle quart ilesHigher quart ile
Note: The figure shows the average share of individuals deprived in six dimensions (basic needs, basic leisure and activities, consumer durables, housing conditions, financial stress, help from network) in the three different income groups (lower quartile, middle quartiles, higher quartile). While these dimensions are the same used in Section 3 of this paper, they only include some of the items in Tables 3 to 8. Basic needs, as defined in this figure, include: i) ability to adequately heat the dwelling; ii) ability to have a healthy diet; iii) food security; iv) ability to clothe properly; v) restricted access to health care. Basic leisure activities include: i) ability to invite friends at home; ii) ability to take one-week holiday. Consumer durables include lack of: i) car; ii) washing machine; iii) personal computer. Housing conditions include: i) shortage of space; ii) rot in windows; iii) damp walls; iv) lack of indoor toilets. Financial stress include: i) arrears in rent/mortgage; ii) arrears in utility bills; iii) meet ends with great difficulty. Help from network include: i) financially helped by someone outside the family; ii) expect to be unable to raise money in case of emergency. Countries are ranked from left to right by increasing levels of deprivation among the entire population, based on data from ESQL (which may differ from those reported in Table 9).
Source : OECD calculations on ESQL database.
• Age. The relationship between age and deprivation varies across countries, with some countries displaying deprivation that declines monotonically with age but others featuring some forms of deprivation increasing among the elderly. In all OECD countries, young people are highly exposed to risks of deprivation, whether we refer to the age of the individual or to the age of the household head.37 Results are more varied when looking at the elderly. While in France the elderly have a lower probability to experience material deprivation than other age groups (Lollivier and Verger, 1997), in Austria, Germany, Greece, Portugal and the United Kingdom retired individuals are (together with children) over-represented among those experiencing poor housing conditions, as well as financial difficulties and problems in making ends meet (Tsakloglou and Papadopoulos, 2000). In the United States, while some forms of material deprivation appear to be more prevalent among the elderly than among other age groups,38 multivariate analysis based on an index of multiple deprivation show that the likelihood of
37. In Europe, based on an overall index of deprivation, people aged less than 24 are more likely to experience
material deprivation that persons of other ages (Eurostat, 2002). In the United States, Bauman (1999) � based on bivariate analysis (i.e. not controlling for other factors) � shows that children are more likely to live in households experiencing payment arrears, difficulties in getting food and lacking affordable health care (in 1995, about 30% of children lived in a household facing at least one of these problems). The same pattern holds for households with a head below the age of 30 in Japan (Abe, 2006).
38. Bauman (2003) � on the basis of five indicators of living conditions derived from SIPP data for 1998 � found that, based on bivariate analysis, older people fare better than other age groups in terms of housing conditions and ability to satisfy basic needs, but worse in terms of fears about the safety of the area where they live and possession of appliances.
DELSA/ELSA/WD/SEM(2006)6
38
experiencing hardship is lower among households with an elderly head (Bauman, 1998; and Short, 2003).
• Household structure. The relationship between material hardship and socio-economic characteristics of households is similar across countries. In all countries, people living alone are especially vulnerable to material deprivation. In France, widows, divorced and singles are on average more deprived than other households (Lollivier and Verger, 1997). Conversely, married couples have a lower likelihood of experiencing financial difficulties both in the United States (Short, 2001) and in Japan (Abe, 2006). In all countries, single parents consistently report a higher probability of material deprivation.39 More controversial is the relationship between the number of children in the household and the odds of material hardship.40
• Education. Less educated people have higher probabilities of experiencing material deprivation. In Europe (based on ECHP data for 1997), low education of the household head is associated to very high odds of deprivation. In the United States, material hardship is inversely correlated with the education of the household head (Bauman, 1998; Short, 2003). Research also suggests that US households facing multiple hardships have a higher probability that their children will drop out of school early, although this effect diminishes after controlling for income poverty, education of the household�s head and receipt of food stamps (Bauman, 1998).
• Labour market status. Persons out of work or working few hours consistently report a higher probability of deprivation. Households with members working few hours face high odds of deprivation in European countries (Eurostat, 2002) while in the United States households where one members works full-time have much lower risks of hardship, especially when household income is twice the poverty line (Bushey, 2001). In Australia, households where someone is unemployed have lower odds of experiencing cash-flow problems, but higher likelihood of being concerned by �hardship� and �missing out�.41 In Canada, those who have weak ties with the labour force (household heads not in the labour force, unemployed or working part-time) have also higher chances of being in core need of housing (Engeland and Lewis, 2004), though this result does not control for other covariates.
39. In Europe, lone parents have greater odds of lacking basic consumer durables and of having more
difficulties in making ends meet: when aggregating the various deprivation items into a synthetic index, lone parents face the highest risk of disadvantage in five European countries (Tsakloglou and Papadopoulos, 2000). In Australia, sole parents and couples with children have greater odds of material deprivation relative to older people living alone and in couples (Bray, 2001). In Canada, people living alone and lone parents are most represented among households experiencing core housing needs (Engeland and Lewis, 2004, based on bivariate analysis), while lone-parent families, especially when headed by women, report more often such difficulties (Pyper, 2002). The same patterns are reported for the United States (Bauman, 1999 and Bushey, 2001) and Japan (Abe, 2006).
40. In France, larger families do not consistently report higher levels of deprivation (Lollivier and Verger, 1997) while the opposite pattern is evident in United States (Bauman, 1999 �based on bivariate analysis; Bushey, 2001). Still in the United States, large families do better than moderately-sized ones, and there is a positive relationship between the number of children under 18 living at home and the occurrence of financial troubles (Short, 2001).
41. As defined by Bray (2001), see footnote 31. Bray also suggests that households where some members work part-time have higher odds of being deprived; that households with one member working full-time and one part-time have lower odds of experiencing financial stress; and that those with two full-time workers have a lower risk of hardship.
DELSA/ELSA/WD/SEM(2006)6
39
• Sickness and disability. In all countries material deprivation is far more prevalent among sick and disabled people than in the rest of the population. In Europe, persons affected by sickness and disability record much higher levels of deprivation in all dimensions, while sick persons figure among those with the biggest difficulties in making ends meet (Tsakloglou and Papadopoulos, 2000). In France, people in good health are less likely to report difficulties in making ends meet and in paying utility bills (Lollivier and Verger, 1997). In the United States, people with work disability are more likely to experience multiple hardship (Bauman, 1998), while in Australia the odds of financial stress increase when one household member is in poor health (Bray, 2001). In Japan, families with a disabled person have a deprivation rate twice as large as for the entire population and, after controlling for other factors such as income, their odd ratio of being deprived is 3 times that of other households (Abe, 2006). For the United States, there is also evidence that the greater likelihood of experiencing material deprivation reflects both poor health and lack of medical insurance (Bushey et al., 2001).
• Ethnicity and immigration. Research in the United States suggests that the odds of experiencing material hardships are higher among households headed by blacks (Bauman, 1998) and Hispanics (Bushey et al., 2001) and that white people have a lower probability of experiencing financial difficulties (with the exception of possession of consumer durables, Short, 2003). In France, subjective feelings of deprivation are higher among immigrants (Lollivier and Verger, 1997). In Australia, households headed by a person born in northern or western Europe have sharply lower odds of experiencing cash-flow problems, while those born in countries other than Australia and north-western Europe have greater odds of �missing out� (Bray, 2000). In Canada, immigrants and aboriginals are less likely to satisfy core needs (Engeland and Lewis, 2004, based on bivariate analysis) while recent immigrants report less hardship than Canadian-born and older generations of immigrants (Pyper, 2002).
• Home tenure and geographical location. Home tenure also helps to predict the likelihood of material deprivation. In all countries, home-owners are less likely to report material deprivation than renters (Bray, 2001; Engeland and Lewis, 2004). In Canada and several European countries, material hardship is also concentrated geographically, especially in areas characterised by high unemployment, violence and vandalism (Engeland and Lewis, 2004; Lee and Murie, 1997; Lollivier and Verger, 1997).42
• Assets and debts. The influence of wealth and indebtedness on the likelihood of experiencing deprivation is ambiguous, when controlling for other covariates. For Australia, Bray (2001) found that the level of interest payments on consumer debt has a strong impact on the odds that a household will face financial problems. In Canada, households who declared bankruptcy are, not surprisingly, twice as likely to report financial difficulties as those who did not (Pyper, 2002). A low stock of wealth also increases the likelihood of financial strains: however, when controlling for the other socio-demographic characteristics, net wealth does not seem to play a significance influence on the probability of falling behind.
• Welfare recipiency. In Canada, more than 50% of welfare recipients (households for which social assistance is the main source of income) report food insecurity, as compared to 10% among the working poor (Rainville and Brink, 2001). Relative to other groups, welfare recipients have lower
42. Engeland and Lewis (2004) report that the share of people reporting unmet �core needs� is twice as large in
Canadian neighbours characterised by core housing needs than in other areas. Most high-need areas exhibit high population densities, high numbers of multiple-rental housing, and unemployment rates twice the national average.

DELSA/ELSA/WD/SEM(2006)6
40
odds of experiencing multiple hardship, but higher odds with respect to two other measures of financial stress (Bray, 2001).
Dynamic patterns: evidence for European countries
52. Some limited evidence on the dynamic features of material deprivation is available for countries where data are based on longitudinal surveys. For European countries, where most data on material deprivation are based on the European Community Household Panel, Eurostat (2002) presents three measures that describe the dynamic patterns of material deprivation: i) the average number of people reporting material deprivation over the 4-year period covered by the panel; ii) the number of people who report material deprivation at least once over that period; and iii) the number of people who report material deprivation over the full period covered by the panel.
53. On average, around 17% of the population in 14 EU countries covered by ECHP reported having been affected by material deprivation over the 4 years to 1997. The number of people who have been deprived at least once in this period is, on average, 50% higher than the average number of people who report material deprivation over the period. Further, around 70% of those reporting material deprivation over the 4-year period were persistently in that state, a share that is well above the analogous share among the income-poor. This suggests that income poverty statistics are more affected by transitory episodes than are deprivation measures.43 Material deprivation also appears to be more concentrated in the population, and to last longer, in countries where the level of material deprivation is also higher (Eurostat, 2002).
The overlap between material deprivation and income-based measures of poverty
54. The relationship between money income and material deprivation can be analysed along two different perspectives. The first (described above) looks at the �causal� role of individual's income as one of the determinants of material deprivation. The second (described in this sub-section) looks at the overlap between material deprivation and income poverty, as two different measures of the same underlying phenomenon. The basic approach followed by this research consists in measuring the extent of material deprivation among income-poor individuals: individuals are classified as �consistently poor� when their income is below the poverty threshold and they also experience different forms of material deprivation. The extent of overlap (or �consistency�) between the two measures of poverty can be analysed in different ways (e.g. through cross-sectional or longitudinal data), with respect to different thresholds for income poverty, and in terms of either specific or synthetic measures of deprivation. This section presents results from studies that rely on different approaches. A common finding from this literature is that, irrespective of how consistency is analysed, the share of the income-poor who also suffer from material deprivation is less than full.
Cross-sectional assessments
55. Analysis based on cross-sectional data suggests that the prevalence of �consistent poverty� (the overlap of income poverty and material deprivation) is less than that of both income poverty and material deprivation. According to Perry (2002), on average (in European countries and New Zealand), consistent poverty is around 40% of that of both income poverty (based on a 60% threshold) and material deprivation. Layte et al. report that, for selected European countries, these percentages vary between 17% (Denmark) and 52% (Portugal), while Förster (2005) reports significantly higher percentages (at 66% and 75%) in the
43. �Those on low income for a number of years face a very high probability of experiencing genuine poverty,
and where longitudinal data are not available, direct measures of deprivation may provide a useful substitute� (Atkinson et al., 2005).

DELSA/ELSA/WD/SEM(2006)6
41
Czech Republic and Hungary when using a different threshold.44 Country-rankings of poverty rates also vary when moving from income to consistent poverty. Förster (2005) observes that, in terms of �consistent poverty�, the position of some Continental and Nordic countries (e.g. Finland) improves, while that of other European countries with comparatively high income poverty rates (Ireland, the United Kingdom and Spain) worsen; further, the gap between countries at the two extremes of the poverty scale becomes much larger when moving from income to consistent poverty.
56. In most OECD countries, the extent of overlap between material deprivation and income poverty rises when a higher income threshold is used: one average, among the countries included in Table 12, it is 30% when using a 50% income-threshold, 40% based on a 60% income-threshold and close to 50% based on a 70% threshold.45 Evidence is however mixed in the United States: on the one hand, Bushey et al. (2001) found that consistency increases when higher income thresholds are used while, on the other, Short observed that consistency is not higher when using a broader measure of income poverty.46 Among European countries, the extent of overlap declines as the number of items that are used to measure deprivation is increased from two (or more) to three (or more, Eurostat, 2002). By construction, consistency between monetary and non-monetary measures of poverty is higher when using a �relative� deprivation threshold, especially in countries where the income poverty rate is higher (Layte et al., 2001). Other approaches to the study of consistency show that the probability for an individual to be simultaneously income-poor and deprived (i.e. �manifest deprivation�) is less than the average probability of being either income-poor or deprived (Eurostat, 2002); and that the probability to be either income-poor or deprived (i.e. �latent deprivation�) is higher than the average of the two probabilities.47 The first pattern suggests that the number of people facing core needs is generally less than that of people being either income-poor or deprived; the second shows that a much higher number of individuals is touched by one of the two forms of poverty.48 Finally, in Japan, both the frequency and intensity of material deprivation
44. Eurostat (2002) also reports that the overlap is systematically higher in poorer European countries.
45. Similar results are reported by Whelan et al. (2002) for European countries (based on a later wave of the ECHP) and Bray (2001) for Australia. Research by Layte et al. (2001) for European countries also suggests that the probability of experiencing material deprivation is higher for persons with income between 50% and 60% of the median, than for those with income between 40% and 50%, and below 40% of the median.
46. Bushey et al. (2001) analyse consistency based on a threshold for income poverty of 200% of the official poverty line: according to their results, critical hardship is experienced by around 30% of families with income below this threshold, and by close to 25% of those with income between 100% and 200% of this threshold. Short (2003) relies on the experimental poverty threshold developed by the Census Bureau (after tax income, minus work- and health-related expenditures, plus near-cash government transfers). Her results, based on multivariate tools, suggest that the experimental measure of income poverty is not a better predictor of material hardship than the standard measure, and that the joint use of monetary and non-monetary poverty measures identifies different groups of persons at risks of poverty.
47. The number of people who are both income-poor and deprived varies between 30% in Denmark and 50% in Ireland and Portugal. The computations of �manifest� and �latent� poverty are based on an application of �fuzzy analysis�, a technique which counts as poor all the members of the population but each of them to a varying degree. See Cheli (1995) and Verma and Betti (2002) for a detailed presentation of the technique and an application to the analysis of deprivation and consistent poverty.
48. Cross-sectional evidence on the relation between material deprivation and income poverty also depends on the specific dimensions of deprivation. Eurostat (2002) shows that in EU-14 countries in 1997, the overlap with income poverty is slightly higher when assessed with respect to basic leisure activities and to some basic needs than to other dimensions. Consistent poverty is slightly lower with respect to inability of replacing worn-out furniture, and significantly less in terms of inability of having a balanced meal. Income-poor people have greater odds of experiencing shortage of space and noisy neighbours than non income-poor individuals, although with differences across countries. In the United States, around one in three households with income below the poverty line in 1995 reported deprivation in terms of food insecurity

DELSA/ELSA/WD/SEM(2006)6
42
declines monotonically as household income rises, with evidence of a threshold (between 4 and 5 million yen) below which the deprivation index escalates rapidly (Abe, 2006).
Table 12. Overlap between income poverty and material deprivation for three income thresholds
Percentage
Poverty thresholds as % of median equivalised household disposable income 50% 60% 70%
Denmark 13 20 32 Germany 27 37 45 Netherlands 25 38 50 Belgium 28 39 48 France 36 40 54 Italy 33 41 50 Spain 33 42 47 United Kingdom 32 44 54 Ireland 18 44 56 Greece 39 45 55 Portugal 40 47 54 New Zealand 35 40 47 Average 30 40 49 Note. Data refer to the share of the income-poor, based on three alternative thresholds, who also experience material deprivation. For European countries, deprivation is measured by the weighted "Current Life-Style Score" (corresponding to the score of primary and secondary dimensions of deprivation, as defined in Eurostat, 2002) based on data from the 1996 wave of the European Community Household Panel data. For New Zealand, deprivation is measured according to the ELSI scale developed by Jensen et al. 2002 and shown in Table 10, based on data from the 2000 New Zealand Living Standard Survey. For all countries, the deprivation threshold is a relative one, i.e. the percentage of deprived individuals is equal to the percentage of income-poor for each of the three different thresholds. Source: Perry, 2002; Whelan et al. (2002).
Longitudinal assessment
57. The extent of overlap between income poverty and material deprivation generally increases when relying on measures that track individuals over time (i.e. individuals with income below the poverty threshold for one, two, and three or more years). This holds true for both absolute and relative measures of material deprivation. Persons whose income is above the poverty threshold in each year have, in general, very low probabilities of being deprived. Conversely, the odds of experiencing material deprivation increase with the duration of the poverty spell, although this relationship is not the same across countries. When material deprivation is also assessed over several years, Whelan et al. (2002) found that the risk of persistent deprivation is positively related to that of persistent income poverty.
58. Eurostat (2002) relies on longitudinal data to compute rates of persistent �manifest� poverty (characterising those who are simultaneously income-poor and deprived for at least 3 out of 4 years) and persistent �latent� poverty (referring to those who are either income-poor or deprived for at least 3 out of the 4 years from 1994 to 1997). Persistent �manifest� poverty varies between 3% in Denmark and 15% in Portugal, as compared to a range between 12% and 38% for persistent �latent� poverty: on average, persistent �manifest� poverty affects 6% of the EU-14 population, while prevalence of persistent �latent� poverty is almost four times higher; similarly, the any-time �manifest� poverty is 14% in the EU average, as compared to 41% for the any-time �latent� poverty average.
59. As in the case of cross-sectional data, the overlap between persistent measures of income poverty and material deprivation also rises when the income threshold increases. Whelan et al. (2004) found that
and a slightly lower proportion reported inability to pay utility bills; the extent of overlap was, however, very low when looking at housing safety and durables possession (Ouellette et al., 2004).

DELSA/ELSA/WD/SEM(2006)6
43
consistency increases with the length of exposure to the risk of poverty (with the latter measured by number of people living below the 70% of median income).49
Characteristics of the �consistent poor�
60. Various approaches allow identifying the characteristics of the �consistently poor�. Bradshaw and Finch (2003) compare the characteristics of poor and non-poor individuals in the United Kingdom based on different definitions of poverty (income-poverty, subjective poverty and material deprivation). The socio-economic characteristics of poor people are roughly the same whatever definition of poverty (cumulative or one-dimensional) is used. Women and singles are the most at risk of poverty, while men and couples without children have the smallest probability of being poor. Households with workers represent over half of all poor based on material deprivation but a much lower share of those that are poor on all three definitions of poverty.
61. A similar analysis of the characteristics of households meeting alternative poverty criteria (including subjective measures of poverty) is provided for Ireland by Nolan and Whelan (1996). Estimates of consistent poverty based on different approaches lead to similar results, with unemployed persons, unskilled manual workers, people in home duties and with no education qualification overly represented among this group. In France, Lollivier and Verger (1997) analysed consistent poverty through a bivariate logit approach: consistently poor people are predominantly individuals with no educational qualification, who interrupted their studies for financial reasons, lone parents, those who experienced some unemployment, immigrants, people suffering from serious health problems and those with few or no wealth. The probability of cumulating different forms of poverty also declines substantially with age.
62. Bradshaw and Finch also studied the relationship between consistent poverty and the extent of social exclusion in a variety of dimensions for the United Kingdom. Table 13 reports some key findings from their analysis. The prevalence of different forms of social exclusion varies sharply between those who are experiencing poverty based on all three criteria (material deprivation, subjective assessment and low-income) and those who are not experiencing any of these conditions, especially in terms of labour market exclusion, lack of social relations as well as confinement at home because of fear. Persons who are counted as poor based on only one of the three criteria report a similar prevalence of social exclusion, with shares that are similar to those among the �cumulatively� poor for all conditions except labour market exclusion.
49. They conclude that �by taking a dynamic perspective on income poverty the ability to predict deprivation
at the 70% threshold is significantly improved. The persistent poverty measure conforms to our expectations in that the level of deprivation rises systematically as the degree of exposure to poverty increases. This is in contrast to the pattern observed for cross-sectional income poverty measures as one moves from more to less generously defined income lines�.

DELSA/ELSA/WD/SEM(2006)6
44
Table 13. Share of individuals counted as poor on different criteria who report different types of social exclusion in the United Kingdom, 1999
Percentages
Persons counted as "poor" based of different criteria1: Material
deprivation Self-
assessment Low income Poor on all
three criteria
Not-poor on all dimensions
Different types of social exclusion2 Excluded from the labour market 31 33 30 60 4 Lacking two or more essential services 46 37 32 50 19 Unable to participate in three or more social activities
81 56 40 84 6
No contact with family or friends 13 12 10 13 12 Lack of support in four or more areas 19 20 21 15 23 Confined at home because of fear of going out
75 60 43 77 17
1. Material deprivation is defined as the inability to afford four or more necessities within a broad range of items referring to basic needs and social activities. Self-assessment of poverty is based on two questions: �How many pounds a week, after tax, do you think are necessary to keep a household such as the one you live in, out of poverty�?; and �How far above or below that level would you say your household is?�: individuals are considered as subjectively poor when answering to the latter question with �a little or a lot below that level of income�. Income poverty is assessed on the basis of 60% of median household equivalised disposable income. 2. Exclusion from the labour market refers to individuals living in households where no one works. Essential services include items such as power and water supplies, public transport and shopping facilities. Lack of support refers to items such as informal care, help with relationship problems, advice, and help with household heavy jobs. Source: Bradshaw and Finch (2003), based on data from the Poverty and Social Exclusion Survey.
Possible explanations of the mismatch between income poverty and material deprivation
63. The range of factors that may account for the relatively small overlap between income- and material deprivation measures of poverty (at the relative thresholds conventionally used in comparative analyses) is large. Bradshaw and Finch (2003) identify three factors: i) the different size of the groups of income poor, deprived, and those feeling poor; ii) the inclusion among the income-poor of individuals who are facing transitory conditions (e.g. persons who have just exited the labour market � either definitively, as retired people, or temporarily, as unemployed); and iii) the fact that the income variable does not include housing costs, which leads to an underestimate of income poverty.50 Other factors relate to the wealth holdings of different groups of individuals (people can have income below the poverty line and yet avoid material deprivation by relying on savings and accumulated wealth)51 and the possibility that people with income just above the poverty line might incur additional costs (e.g. commuting, child care and other costs borne by people with paid jobs) that increase their risk of incurring material deprivation.
64. Given the difficulties in assessing the relative validity of these various factors, most authors agree that �different methods lead to different conclusions regarding levels of exclusion� but with �quite different groups identified as excluded depending on the indicator on which one focuses�.52 This suggests that one may talk of �poverties� rather than poverty, and that different policies may be required to respond to the needs of different groups of poor people.
50. An additional factor explaining the small overlap between different measures of poverty is �false
consciousness�, i.e. misreporting, lack of understanding or low expectations (Bradshaw and Finch, 2003). This factor, however, is only relevant for measures of consistent poverty based on subjective aspects.
51. In Ireland households with income below the (60%) poverty line who did not experience material deprivation have much higher savings and housing wealth than income-poor households who did experience material deprivation, whatever the status of the household head.
52. Whelan and Nolan (2004). See also Halleröd et al. (1998) and Nolan and Whelan (1996).

DELSA/ELSA/WD/SEM(2006)6
45
CONCLUSIONS
65. This review of the evidence and research on material deprivation in OECD countries has implications for both measurement and policies. With regard to measurement, cross-country comparisons of the extent of material deprivation have traditionally been limited to European countries, building on the availability of common survey questions through the European Community Household Panel and other EU surveys. This paper has tried to extend the scope for such comparisons by identifying survey questions in different countries that may provide a basis for a comparative assessment of the extent and nature of material deprivation. This preliminary analysis is limited in several dimensions. Fist, it is based on summary statistics rather than on micro records that would allow constructing measures of multiple deprivation and of the overlap between monetary and non-monetary poverty. Second, much of the analysis is conducted on the basis of arbitrary choice of questions rather than on scales constructed through statistical analysis of individuals' responses. Finally, comparability of results is affected by differences in wording of survey-questions.
66. This paper has relied on simple summary measures of material deprivation constructed as �averages� of the share of households reporting different forms of deprivation. These summary measures highlight a number of patterns. Across OECD countries, data on the prevalence of different forms of material deprivation are (with few exceptions) highly correlated to each other, suggesting that they measure the same underlying phenomenon. Depending on the scope of cross-country comparisons, these measures are either more closely correlated to country-levels of GDP per capita or to measures of the prevalence of low income.
67. More systematic and comparable data on material deprivation holds the potential of allowing a more accurate description of the experience of poverty in OECD countries. Moreover, their benefits extend to the nature of the policies to deal with it. Measures of poverty based on inputs draw attention to income transfers (taxes and benefits) and to policies to improve capacity of poor households to gain adequate earnings in the labour market. Conversely, poverty measures based on outcomes underscore the importance of identifying individuals that cumulate several types of deprivation at the same time, and of integrated policies aimed at reducing the extent of actual exclusion from society in a variety of fields (e.g. provision of non-cash services in the fields of hunger, health and housing). The pay-off from these selective measures is especially important when poverty is concentrated on individuals with well-defined characteristics, and when considering the dynamic processes that lead to poverty: people that today may not qualify as poor based on their income may nevertheless experience conditions (e.g. dropping out of school) that could lead to poverty tomorrow. This strengthens the case for shifting from �reactive� policies to �preventive� interventions targeted to people experiencing deprivation in specific aspects of social life.

DELSA/ELSA/WD/SEM(2006)6
46
REFERENCES
Abe A. (2006), �Empirical Analysis of Relative Deprivation and Poverty in Japan�, IPSS Discussion Paper Series No. 2005-7, National Institute of Population and Social Security Research, Tokyo.
Atkinson A.B. and F. Bourguignon (1982), �The Comparison of Multidimensional Distributions of Economic Status�, Revue of Economic Studies, 49, pp. 183-201.
Atkinson A.B., B. Cantillon, E. Marlier and B. Nolan (2002), Social Indicators: the EU and Social Inclusion, Oxford University Press, Oxford.
Atkinson A. B., B. Cantillon, E. Marlier and B. Nolan, (2005), Taking forward the EU Social Inclusion Process, Report Commissioned by the Luxembourg Presidency of the EU, mimeo.
Bauman K. (1998), �Direct Measures of Poverty as Indicators of Economic Need: Evidence from the Survey of Income and Program Participation�, Population Division Technical Working Paper No.°30, US Census Bureau.
Bauman K. (1999), �Extended Measures of Well-Being: Meeting Basic Needs�, Current Population Reports, U.S. Census Bureau, P70-67.
Bauman K. (2003), �Extended Measures of Well-Being: Living Conditions in the United States�, Current Population Reports, U.S. Census Bureau, P70-87.
Bradshaw J. and N. Finch (2003), �Overlaps in Dimensions of Poverty�, Journal of Social Policy, 32, 4, pp. 513-525.
Bray J. R. (2001), �Hardship in Australia�, Department of Family and Community Services, Occasional Paper No.°4.
Breunig R., D. Cobb-Clark, X. Gong and D. Venn (2005), �Disagreement in Partner Reports of Financial Difficulty�, IZA Discussion Paper No. 1624, May.
Cheli B. and A. Lemmi (1995), �A �Totally� Fuzzy and Relative Approach to the Multidimensional Analysis of Poverty�, Economic Notes, 24-1, pp. 115-134.
Callan, T., B. Nolan and C. T. Whelan (1993), �Resources, Deprivation and the Measurement of Poverty�, Journal of Social Policy¸ 22, 2: pp. 141-172.
Callan, T., B. Nolan, B. J. Whelan, C. J. Whelan, J. Williams (1996), Poverty, Evidence from the 1994 in the Living in Ireland Survey 1990s, Oak Tree Press, Dublin.
Beverly, S. G. (2000), �Using Measures of Material Hardship to Assess Well-being�, Focus, 21, 2.
Boushey, H., C. Brocht, B. Gundersen and J. Bernstein, (2001), �Hardship in America -- The Real Story of Working Families�, Economic Policy Institute, Washington.

DELSA/ELSA/WD/SEM(2006)6
47
Desai, M. and A. Shah (1988), �An Econometric Approach to the Measurement of Poverty�, Oxford Economic Papers, 40, 3, pp. 505-522.
Dutta, I. P.K. Pattanaik and Y. Xu, (2005) �On Measuring Deprivation and the Standard of Living in a Multidimensional Framework on the Basis of Aggregate Data�, Economica, Vol. 70, No. 278.
Edin, K. and L. Lein (1996), �Work, Welfare and Single Mothers� Economic Survival Strategies�, American Sociological Review, 61 (Feb.), pp. 253-266.
Engeland, J. and R. Lewis (2004), �Exclusion from Acceptable Housing � Canadians in Core Housing Need�, Policy Research Initiative, 7, 2.
Eurostat (2002), Deuxième Rapport sur le revenue, la pauvreté et l�exclusion sociale, Statistiques Sociales Européennes.
Fergusson, D. M., Horwood, L. J., and Beautrais, A. �The Measurement of Family Material Well-being�, Journal of Marriage and Family, August.
Fergusson, D. M., B. Hong, J. Horwood, J. Jensen, and P. Travers, (2001), �Living Standards of Older New Zealanders: A Technical Account�, Ministry of Social Policy, Wellington.
Fleurbaey, M.,M. Herpin, M. Martinez and D. Verger, �Mesurer la pauvreté? �, Economie et Statistique, pp. 308-310.
Förster, M. (2005), �The European Social Space Revisited: Comparing Poverty in the Enlarged European Union�, Journal of Comparative Policy Analysis, 7, 1, pp. 29-48.
Förster, M. and M. Mira d'Ercole (2005), �Income Distribution and Poverty in OECD Countries in the Second Half of the 1990s�, OECD Social, Employment and Migration Working Papers, No. 22, Paris.
Gallie, D. and S. Paugam (2002), Social Precarity and Social Integration, Rapport pour la Direction Générale de l�Emploi de la Commission Européenne.
Gordon D., R. Levitas, C. Pantazis, D. Patsios, S. Payne and P. Townesend (2000), Poverty and Social Exclusion in Britain, Joseph Rowntree Foundation, York.
Halleröd, B. (1995), �The truly poor: direct and indirect consensual measurement of poverty in Sweden�, Journal of European Social Policy, 5, 2, pp. 111-129.
Headey B. (2005), �A Framework for Assessing Poverty, Disadvantage and Low Capabilities in Australia�, paper presented for the HILDA conference, 29-30 September, University of Melbourne.
Hoffman, A., E. Giovannini, M. Nardo, M. Saisana, A. Saltelli and S. Tarantola (2005), �Handbook on Constructing Composite Indicators: Methodology and User Guide�, OECD Statistics Working Paper, Paris.
Kangas, O. and V-M. Ritakallio (1998), �Different Methods- Different Results? Approaches to Multidimensional Poverty�, in H-J Andress (ed.), Empirical Poverty Research in a Comparative Perspective, Aldershot: Ashgate, pp. 167-203.

DELSA/ELSA/WD/SEM(2006)6
48
Kolm, S. K. (1977), �Multidimensional Egalitarianisms�, The Quaterly Journal of Economics, 91-1, pp. 1-13.
Jensen, J., M. Spittal, S. Crichton, S. Sathiyandra, V. Krishnan (2002), �Direct Measures of Living Standards: the New Zealand ELSI Scale�, Ministry of Social Development, Wellington.
Mayer, S. E. and C.S. Jencks (1989), �Poverty and the Distribution of Material Hardship�, The Journal of Human Resources, 24, 1, pp. 88-113.
Layte, R., B. Maître, B. Nolan, and C. T. Whelan (2001), �Persistent and Consistent Poverty in the 1994 and 1995 Waves of the European Community Household Panel�, Review of Income and Wealth, Series 47, 4.
Lee, P. and A. Murie (1997), Poverty, Housing Tenure and Social Exclusion, The Policy Press in association with the Joseph Rowntree Foundation.
Lollivier, S. and D. Verger (1997), �Pauvreté d�existence, monétaire ou subjective sont distinctes�, Economie et Statistique, pp. 308-310.
Mack, J. and S. Lasley (1985), Poor Britain, Allen & Unwin, London.
Maasoumi E. (1986), �The Measurement and Decomposition of Multi-Dimensional Inequality�, Econometrica, 54-4, pp. 991-997.
Tsui, K. (1995), �Multidimensional Generalisations of the Relative and Absolute Inequality Indices: the Atkison-Kolm-Sen Approach.�, Journal of Economic Theory, 64, pp. 145-157.
Muffels, R. (1993), �Deprivation Standards and Style of Living Indices�, in J. Berghman, B. Cantillon and H. Deleeck, The European Face of Social Security, Avebury, Aldershot.
Nolan, B. and C. Whelan (1996a), Resources, Deprivation and Poverty, Oxford University Press, Oxford.
Nolan, B. and C. Whelan (1996b), �Measuring Poverty using Income and Deprivation Indicators: Alternative Approaches�, Journal of European Social Policy, 6, 3, pp. 225-240.
Nord, M., M. Andrews and S. Carlson (2001), �Household Food Security in the United States, 2002�, Food Assistance and Nutrition Research Report, N° 35, United States Department of Agriculture, Economic Research Service.
Ouellette, T., N. Burskin, B. Long and E. Beecroft (2004), �Measures of Material Hardship�, US Department of Health and Human Services.
Piachaud D. (1981) �Peter Townsend and the Holy Grail�, New Society, 57: pp. 419-421.
Perry, B. (2002), �The mismatch between income measures and direct outcome measures of poverty�, Social Policy Journal of New Zealand, 19, pp. 101-127.
Pyper, D. (2002), �Falling Behind�, Perspectives 21, Autumn.
Rainville, B. and S. Brink (2001), �Food Insecurity in Canada, 1998-1999�, Applied Research Branch Strategic Policy, Human Resources Development Canada, R-01-2E.

DELSA/ELSA/WD/SEM(2006)6
49
Ringen, S. (1987), The Possibility of Politics, Clarendon Press, Oxford.
Ringen, S. (1988), �Direct and Indirect Measures of Poverty�, Journal of Social Policy, 17(3), pp. 351-365.
Rochford, M. (1987), �A Survey of Living Standards of Beneficiaries�, Research Series 8. Wellington: Department of Social Welfare.
Sen, A. K. (1983), �Poor, Relatively Speaking�, Oxford Economic Paper N°35.
Sen A.K. (2000), �Social Exclusion: Concept, Application, and Scrutiny�, Social Development Papers, Asian Development Bank, No. 1.
Short K. (2003), �Material and Financial Hardship and Alternative Poverty Measures�, paper presented at the 163th annual meeting of the American Statistical Association.
Townsend, P. (1979), Poverty in the United Kingdom, Harmondsworth, Penguin.
Townsend, P. (1988), �Deprivation�, Journal of Social Policy, 16, pp. 125-146.
Tsaklogou, P. and F. Papadopoulos (2000), �Poverty, material deprivation and multi-dimensional disadvantage during four life-stages: Evidence from the ECHP� (mimeo).
Van den Bosch K. (2001), Identifying the Poor: Using Subjective and Consensual Measures, Ashgate, Aldershot.
Verma, V. and Betti, G. (2002), �Longitudinal Measures of Income Poverty and Life-Style Deprivation�, Working Paper n°50, Dipartimento di Metodi Quantitativi, Università di Siena.
Whelan, C.T., R. Layte, B. Maître (2002), �Persistent Deprivation in European Union�, Schmollers Jahrbuch: Journal of Applied Social Sciences, 122, 1:3.
Whelan, C.T., R. Layte, B. Maître (2004), �Understanding the Mismatch between Income Poverty and Deprivation: A Comparative Analysis�, European Sociological Review, 20, 4.

DELSA/ELSA/WD/SEM(2006)6
50
ANNEX 1. MEASUREMENT AND ANALYSIS IN INDIVIDUAL COUNTRIES
68. OECD countries differ in their approaches to the measurement of material deprivation. The main differences refer to:
• The �latent� concept that surveys aims to capture (e.g. social exclusion, poverty of living conditions, low well-being, material and financial hardships, etc.).
• The number of dimensions chosen to approximate the latent concept (e.g. necessities, housing conditions, financial stress, access to health, education, social relationships etc.).
• The number and nature of indicators used to measure each specific dimension. For example, �decent life� can be assessed in terms of a few basics items � as in most survey on material hardship � or extend beyond subsistence levels � as in most European surveys. Further, the selection of the items included in the questionnaire can either correspond to socially perceived necessities or be selected on an ad hoc basis.
• The method used by researchers to aggregate data on specific items into a composite index of deprivation, and how such composite indices are analysed, in particular with respect to income-based poverty measures.
Annex Table A.1 summarises some of the main features of measurement and research on material deprivation in selected OECD countries.

DELSA/ELSA/WD/SEM(2006)6
51
Annex Table A.1. Approaches to the measurement of material deprivation in OECD countries
Concept Dimensions Number and kind of Indicators (and Survey)
Summary Indexes
European countries
Material, Social or Generalised Deprivation (�Exclusion from minimum acceptable way of life in one�s own society because of inadequate resources1�) Townsend, 1979; Callan et al., 1993; Nolan and Whelan, 1996. Enforced lack of socially perceived necessities (Mack and Lansley 1985) Inability to participate in the ordinary life of a society due to lack of resources (Layte et al. 2001; Whelan et al. 2002) Social Exclusion (Whelan and Maître, 2004)
Basic Needs Basic Leisure and Social Activities Housing Conditions Consumer Durables Financial Stress Social Relationships
Townsend (1979) : -60 deprivation items (ad hoc survey in London district) Mack and Lansley (1985): - 35 items by distinguishing whether lacks are enforced and whether items are socially perceived necessities (ad hoc survey) Calan and al. (1993): - 24 items (with Mack and Lansley format2) Studies relying on the ECHP: Layte et al. (2001); Whelan et al. (2002) - 25 items (with enforced lack format if relevant) Eurostat (2002): - 24 items (with enforced-lack format if relevant) Dekkers (2003) -37 items (with enforced-lack format if relevant)
Townsend, 1979: Additive scale of 12 (most significant) items Mack and Lansley, 1985: Majority Necessity Index: simple aggregation of 22 items Callan et al. 1993: Life-style Index: simple aggregation of 24 items & Basic Deprivation Index: simple aggregation of 8 items selected trough FA Lollivier and Verger, 1997: Poverty of living conditions score: simple aggregation of 25 items Layte et al. 2001; Whelan et al. 2001: Current Life-Style Deprivation (CLSD) index: weighted average of 13 items (weights inversely correlated to the item�s predominance in the population) Eurostat, 2002: Overall index of deprivation: weighted average of 24 items; Szeles, 2004: Multidimensional Poverty Index: Totally and Fuzzy Relative approach + weighting function applied to seven dimensions of poverty (including financial and material aspects). Dekkers, 2003: Multidimensional poverty rate: A two-steps procedure applied to 37 items consisting of a CFA and a Cluster Analysis3. Tsakloglou and Papadopoulos, 2002: 3 synthetic indexes built as weighted average of sub-sets of deprivation items (living conditions, necessities life and social relations )
Australia Hardship Financial Stress Basic Needs Basic Leisure and Social Activities
Bray, 2001: - 13 items (HES)
Bray, 2001: Three dimensions (Missing Out, Cash-flow Problems, Hardship) through factor analysis. Summary indices built as simple average of within-dimension items.
Canada Housing Core Need Housing Conditions Based on the recommendations of the "Canada and Mortgage Corporation Standard": -Adequate Dwelling Units (i.e. not requiring many repairs) - Suitable Dwelling Units (enough bedrooms and make-up) - Affordable Dwelling, i.e. housing cost less than 30% of before-tax household income (National Census)
Engeland and Lewis, 2004: Head Count Ratio of Households in Core Housing Need, that is whether lacking one or more conditions of CHMC�s standard
Food Insecurity Basic Needs (Food) Rainville and Brink (2001): - Food Anxiety: worry there is no enough food due to lack of money - Compromised Diet: could not eat the quality or variety of food desired because of lack of
Rainville and Brink (2001): -Food Insecure households: households experiencing any difficulty among food anxiety, compromised diet and food poverty.

DELSA/ELSA/WD/SEM(2006)6
52
Concept Dimensions Number and kind of Indicators (and Survey)
Summary Indexes
money - Food Poverty: not have enough food because of lack of money
Falling behind Financial Stress Pyper (2002): - Households with arrears in paying utility bills -Households reporting outstanding balances
Pyper (2002): -No summary index provided.
Japan Material deprivation Basic Needs Basic Leisure and Social Activities Consumer Durables Financial Stress Housing Conditions Social relationships
Abe (2006): Abe (2006): Relative Deprivation Index: weighted additive scale of 16 items selected as socially perceived necessities.
Mexico None Consumer Durables, Housing Conditions
New Zealand
Economic Living Standard Index : full-spectrum measure of Standards of Living
Basic Needs Basic Leisure and Social Activities Consumer Durables Financial Stress Housing Conditions Social relationships
Fergusson et al. 2001, Jensen et al. 2002: -29 consumer durables and housing facilities (Mack and Lansley�s format) - 10 social participation items (Mack and Lansley�s format) - 20 types of economising behaviours (plus 11 items for households with children) - 6 financial problems -3 self-rating questions (satisfaction with (a) income, (b) material standard of living, (c) evaluation of living standard (NZ Living Conditions Survey)
Fergusson et al., 2001: Material Well-Being Scale: Additive scale of 6 indicators that are linked to a single latent dimension (living standard) using the CFA approach. Jensen et al. 2002: Economic Living Standard Index: Weighted sum of 6 indicators selected through Item analysis.
United States
Material and Financial Hardships
Financial Stress Food security Health Care Child Care
Mayer and Jencks, 1989: - 1 food insecurity item - 4 financial stress items - 7 housing problems - 3 health insurance items (ad hoc survey in Chicago district) Bauman, 1998 - 3 financial stress items - 1 food security item - 2 restriction to health care items (SIPP) Boushey et al., 2001: -4 food security items - 5 housing items - 3 health care items - 3 child care items (SIPP and NSAF)
Bauman, 1998: Multiple hardships index:: head count ratio of number of households cumulating two or more forms of hardship Boushey et al. 2001Critical Hardship Index: and Serious Hardship Index: both being built as simple averages/ head count ratios of respectively 3 more critical deprivation items and 8 less severe forms of deprivation Short, 2003Material Hardship Index: simple average of 7 items
1. This definition is given by Perry (2002); we chose it as adequately illustrating the concept of generalised deprivation elaborated by previous scholars like Townsend, Callan, Nolan and Whelan.
2. The Mack and Lansley�s format correspond to the twofold specification of lacked items as enforced lacks and as socially perceived necessities.
3. The cluster containing individuals poor in the two dimensions (previously identified with the CFA) are considered multidimensional poor. These two dimensions are arrears in material conditions and arrears in living and housing conditions.

DELSA/ELSA/WD/SEM(2006)6
53
ANNEX 2. HOUSEHOLDS SURVEYS COVERING MATERIAL DEPRIVATION
69. This Annex describes the main features of the surveys used in this paper. Surveys are presented by country. Annex Table A.2 provides a synthetic description of surveys, their scope and dimensions of material deprivation covered. Annex Table A.3 describes the wording of survey question on material deprivation covered by different surveys.
European countries
Community Surveys
European Community Household Panel
70. The �European Community Household Survey� (ECHP) is a longitudinal survey conducted annually between 1994 and 2001. Some countries joined the survey in later waves (Austria in 1995, Finland in 1996). The survey is based on a standardized questionnaire administrated to 60 500 households from nationally representative samples (around 130 000 individuals aged 16 years or more). It collects information about income, housing, health, education and employment. Beyond its multi-dimensional coverage, one peculiarity of ECHP is that it is conceived to allow better cross-countries comparability through identical survey-design and implementation procedures, as well as a centralized support provided by Eurostat.
71. The ECHP contains three sections on deprivation and poverty. These deal with financial situation, accommodation, and consumer durables. The financial situation module investigates both monetary and non monetary aspects of the households� finances: it contains questions on the affordability of basic needs (BN) and basic leisure and social activities (BLSA)53. The accommodation module reports on the housing conditions (HC) of the household.54 The module on amenities covers the most common Consumer Durables (CD) owned by the household. Questions on necessities are use the Mack and Lansley (1985) format. The survey also contains questions on a small number of financial stress (FS) and other subjective deprivation (SD) variables, as well as questions about social relationships (e.g. whether member of the household regularly participate in some social activities, if they have frequent contacts with neighbours, friends and relatives).
53. Several questions are asked about whether the respondent is able to make ends meet, if he can afford a
certain number of housing outlays for basic necessities (such as heating, replacing worn-out furniture) as well as if he has some problems of arrears (for paying utility bills, rents or mortgages, hire purchase installments). Questions about the affordability of other basic expenditures (such as the purchase of new clothes, meat or fish with a regular periodicity, meals for friends and family and at least one week holiday once a year) were also in this section.
54. Among those housing conditions main characteristics of the dwelling, and in particular the state of disrepair of it, its salubrious conditions (dampness, rot, darkness, etc.) and the presence of some basic facilities (such as bathroom, indoor flushing toilet or hot running water). This section contains also some questions on the housing outlays met by households (such as the amount of rent, the amount of heating and other utility bills, etc.). There is also a general question on whether housing costs are felt as a financial burden by families.

DELSA/ELSA/WD/SEM(2006)6
54
European Union Survey of Living Conditions
72. EU-SILC is the new continuous surveys of national panels introduced in 2004 to replace the ECHP and improve some aspects of the latter. Relative to ECHP, EU-SILC extends the number of participating countries (candidate countries will join EU-SILC in 2005 or 2006). However, since data are not longer collected through a standardized questionnaire (and may come from different sources in different countries) international comparability may be affected. EU-SILC covers a broad range of topics including income, social exclusion, labour market and housing. However, much of detailed information on non-monetary indicators has been dropped from EU-SILC. The sections of EU-SILC on deprivation cover basic needs (BN), basic leisure and social activities (BLSA), housing conditions (HC), consumer durables (CD) and financial stress (FS) of households.
Eurobarometer
73. Eurobarometer is a survey conducted to study the evolution of public opinion in European Union. The Eurobarometer includes a standard survey (started in 1973, with each survey consisting of approximately 1000 face-to-face interviews in each country) and some special modules, dealing with themes such as enlargement, social situation, health, culture, information technology, environment and defence. While the standard Eurobarometer survey does not contain questions on deprivation and poverty of living conditions, four special surveys dealing with precariousness and social exclusion were conducted in 1976, 1989, 1993 and 2001. The 2001 Eurobarometer provides information on subjective deprivation (SD)55 and on financial stress (FS). Some questions also relate to the social environment and help from social network (HSN). Eurobarometer also provides information on deprivation in candidate countries, asking about possession of selected common consumer durables (CD), subjective perception of financial situation. Data on financial stress and housing conditions are also available.
European Quality of Life Survey
74. The �European Quality of Life Survey� (EQLS) was launched in 2003 by the European Foundation for the Improvement of Living and Working Conditions, with the objective of collecting information on living standards in 28 European countries (the 15 EU Member States, the 10 acceding countries and the three candidate countries). The survey was carried out one-off and consisted of 1 000 interviews in each country. The survey covers a broad range of domains, including economic situation, housing and local environment, employment and education, health, subjective well-being and perceived quality of life. The EQSL contains several questions on deprivation, through questions (similar to those used in ECHP) covering basic needs (BN), basic leisure and social activities (BLSA), consumer durables (CD), housing conditions (HC) and financial stress (FS). In addition, some questions on help received from social networks (HSN) are also asked (e.g. household�s ability to raise money in case of financial emergency).
55. For instance, respondents are asked about the kind of goods that are absolutely necessary to live, as well as
about the minimum income that a household like the interviewed person�s one would need in order to make ends meet. Questions on financial stress refer to the household�s ability to pay utility bills, rent, etc. Some questions are also asked about the general standard of living of people living in the same area than the household and about the kind of help that the household would receive in case of problems.

DELSA/ELSA/WD/SEM(2006)6
55
National surveys
France
75. Data on material deprivation are available through the �Enquête Permanente sur les conditions de vie des ménages� (PCV). PCV is a cross-sectional annual survey based on a nationally representative sample of 8 000 households. The survey is designed to monitor the evolution of social trends. It is composed of a core section (asking questions about health, housing, debts, employment, characteristics of living area, participation in social activities and frequency of social contacts of households) and topical modules on specific aspects of families� living conditions (assets, public services and infrastructures, social relationships, purchase attitudes, etc.). The PCV core section contains questions on basic needs (BN) and basic leisure and social activities (BLSA) in the Mack and Lansley (1985) format which are almost identical to those used by ECHP. It also contains some questions on financial stress (FS) and households� debts and overdrawn bank accounts. The PCV module on deprivation also covers housing conditions (HC) and consumer durables (CD) are also a part of the PCV�s module on deprivation (although questions are less detailed than in the case of surveys in the United Kingdom).
Germany
76. The �German Welfare Survey� is a comprehensive survey on the well-being of the German population. The survey is cross-sectional (without a regular periodicity) first introduced to measure individual well-being and perceived quality of live. The last (1998) wave of the survey, which now covers both eastern and western länders, was based on 3042 personal interviews dealing with objective and subjective dimensions of households� living conditions. The last wave contains new questions on processes of social exclusion and integration. The most important deprivation items covers by the survey relate to subjective deprivation (SD), social environment and help from social networks (HSN). However, the survey also covers basic needs (BN), basic leisure and social activities (BLSA), consumer durables and the housing conditions (HC). Questions are phrased using the Mack and Lansley (1985)�s format (as in ECHP and other European national surveys).
United Kingdom
77. Several surveys are available in the United Kingdom. These include:
• The �Millenium Study of Poverty and Social Exclusion� (PSE) is a one-off survey conducted in 1999 as a follow-up of the 1998-1999 �General Household Survey� (GHS), which asked individuals which items they consider to be necessary to live. The PSE survey covers those items which were judged as necessities by 50% or more of GHS respondents: the main topics covered are satisfaction with housing, health and disability, social network and support, debts and arrears, going without items when money is short, subjective assessment of living standard and satisfaction with the area. The survey over-samples people with low-income (40% of the 1 534 respondents are from the lowest income quintile, 30% from the fourth quintile and 10% from each of the three highest quintiles). PSE contains deprivation questions on 54 items for adults and 30 items for children. The survey provides data on housing conditions (HC), basic needs (BN), basic leisure and social activities (BLSA); consumer durables (CD); subjective deprivation (SD), financial stress (FS); social environment and help from social networks (HSN).
• The �Family and Children Study� (FACS) is a longitudinal survey that has taken place in 1999, 2001 and 2002 (and now covers 7500 families). While in 1999 and 2000 the survey only covered low-income couples with children, since 2001 the sample is nationally representative. The main purpose of FACS is to study the effectiveness of work incentives measures and the effects on

DELSA/ELSA/WD/SEM(2006)6
56
social policies on families� well-being. FACS provides detailed information about material and immaterial deprivation, with questions on basic needs (BN) and basic leisure and social activities (BLSA), on necessities and households� inability to make ends meet (e.g. �Is there anything else that your children need at the moment but which you just can't find the money for?�). FACS also asks questions on financial stress (FS), help received from (and provided to) social networks (HSN), housing conditions (HC) and consumer durables (CD).
Other OECD countries
Australia
Monthly Population Survey
78. The �Monthly Population Survey� is based on a multi-stage sample of private dwellings (houses, flats, etc.) and a sample of non-private dwellings (hotels, motels, etc.). The supplementary survey collects data on a set of changing topics which rotate over three years. The March 2005 topic focused on energy use and conservation and included questions on the types of household appliances used in households. The March 2003 issue included data on car ownerships by households. The sample for a monthly population survey is approximately 30 000 dwellings, but only half of these (i.e. 15 000) were included in the supplementary survey.
Household Expenditure Survey
79. The �Household Expenditure Survey� (HES), conducted every five years, collects information on expenditures, income and household characteristics of around 7 000 households living in private dwellings. The main aim of the survey is to measure the levels and the patterns of households� expenditures according to the income and other socio-economic characteristics of individuals. The HES also contains a special module on financial stress, which provides detailed information on basic needs (BN), basic leisure and social activities (BLSA), financial stress (FS) and help received from social networks (HSN). For some of these items, the wording of the survey questions is similar to those used in the ECHP (for European countries) and the SIPP (for the United States). The HES also provides some information about consumer durables (CD).
Australian Housing Survey
80. The �Australian Housing Survey� (AHS) is a cross-sectional survey conducted in 1994 and in 1999 to get better information about the characteristics, the physical conditions and the quality of the housing. The 1999 data collection was the last in that form, but some of the data it contained will be collected periodically in the �Survey of Income and Housing�. The scope of the survey coincides with the usual residents of private dwellings: the 1999 AHS sample includes 13 788 households and 27 688 persons. The AHS only provides information about and the housing conditions (HC) aspects of material deprivation.
Canada
Household Income, Facilities and Equipment Survey
81. The �Household Income, Facilities and Equipment� survey (HFE) was conducted annually over a representative sample of around 18 000 households. Before 1997, HFE was run as a separate survey; after that data, much of the HFE�s content has been integrated into the �Survey of Household Spending� (SHF). The new survey provides comprehensive data on housing expenditures and dwelling characteristics, and is conducted annually over 20 000 households. It covers housing conditions (HC) and consumer durables
DELSA/ELSA/WD/SEM(2006)6
57
(CD). The survey provides a great deal of information on these items; however, since the survey is census likewise designed, the questions are not formulate as to discriminate between lacks due to financial constraints and lacks due to households� preferences.
Survey of Financial Security
82. Survey of Financial Security (SFS) was conducted one-off in 1998 to collect comprehensive information on the income, assets, wealth and debts of Canadian households. The sample contains around 23 000 households. The survey contains some questions on the indebtedness of families, as well as the occurrence of financial troubles and arrears in paying bills and other housing related expenditures. It thus includes useful information on Financial Stress dimension of deprivation.
National Population Health Survey
83. The National Population Health Survey (NPHS) is an on-going national survey conducted on about 17 000 households, which covers several topics related to health and health care domains. The survey is longitudinal, with a new cycle taking place every two years. One special module of NPHS deals with food deprivation, thus including some Basic Needs questions. This special module on Food Insecurity was carried out one-off in 1998 on the initiative of Human Development Resources Canada.
Japan
84. Very limited information on material deprivation is provided by official surveys (with the partial exception of data on consumer durables and housing conditions from the National Survey on Family Income and Expenditure). More comprehensive information is however available through the �Survey on Living Conditions� (Shakai Seikatsu Chousa), an unofficial and experimental survey designed by the National Institute of Population and Social Security Research in Tokyo and run in the context of a three year research project funded by Ministry of Health, Labour and Welfare. The (nationally representative) sample of this survey is limited to around 2 000 households and around 6 000 persons aged 20 years and above, from all of Japan, with a response rate of about 76%. The research was conducted in two stages. First, in 2002, a survey asked respondents to rate whether a range of items are required for a regular family to live in Japan today (following the model of the �Poverty and Social Exclusion Survey� in the United Kingdom); second, information on deprivation with respect to these �socially perceived necessities� was collected between November and December 2003. The �Survey on Living Conditions� provides information on all aspects of material deprivation described in the main body of this paper.
Mexico
�Encuesta Nacional de Ingresos Y Gastos de Los Hogares�
85. The Encuesta Nacional de Ingresos Y Gastos de Los Hogares (ENIGH) is a cross-sectional survey which takes place without a regular periodicity (around every 3 or 4 years). Over 20 000 resident households are interviewed with the aim of collecting information about their main socio-economic characteristics, work conditions, income and expenditure. The ENIGH contains questions on consumer durables (CD) and housing conditions (HC).
�Lo que dicen los pobres�
86. This survey, conducted one-off in 2003 was conceived to study the living conditions of poor people, with special attention to their subjective feeling of deprivation and social exclusion. It was administered to some 3 000 households living in poverty. The survey collects data on individuals' views about well-being and social justice, subjective perceptions of discrimination and precariousness, attitudes
DELSA/ELSA/WD/SEM(2006)6
58
towards public institutions and help received from them. The survey covers the subjective items of material deprivation, providing some information about financial stress (FS) and help received from social networks (HSN).
New Zealand
87. Information on material deprivation is available through the �New Zealand Living Conditions Survey�. Three waves of this survey have been conducted as part of the Living Standards Research Program initiated by the Super 2000 Taskforce group and then continued by the Ministry of Social Policy. Differently from other surveys reviewed above, the scope of the New Zealand Living Surveys is not households but three groups of people: the Older New Zealanders survey, targeted to households containing a person aged 65 and more; the survey of Older Maori, based on a random sample of Maori aged 65-69 years; the survey of the working-age, for people aged 18-64 living permanently in private dwellings. These surveys have provided the basis for the construction of the ELSI scale, which is a synthetic measure of standards of living.
88. The New Zealand Living Standards Surveys provides information on all the dimensions of material deprivation described in Chapter 3: basic needs (BN), basic leisure and social activities (BLSA), consumer durables (CD), housing conditions (HC), financial stress (FS), Help Received from Social Networks (HSN) and Subjective Deprivation (SD). Survey questions follow the format suggested by Mack and Lansley (1985). A section of the survey refers to households� strategies to keep costs down.
United States
Survey of Income and Program Participation
89. The �Survey of Income and Program Participation� (SIPP) is a continuous series of national panels, with samples ranging from 14 000 to 36 700 households. The lengths of the panel vary between 2 ½ and 4 years. SIPP is divided into a core part (collecting information on labour force status, program participation and income) and topical modules, administered in particular waves of the survey and covering issues like personal history, wealth and living conditions. Questions on deprivation are included in the topical module on �Extended Measures of Well-Being�, �Basic Needs� and �Adult Well-Being� carried over one-off for a specific wave of the panel. These modules contain questions on basic needs (BN) and basic leisure and social activities (BSLA), which however do not distinguish between different reasons for lacking different goods and amenities. Detailed questions also cover housing conditions (HC), social environment and help received from social networks (HSN). With respect to the latter, SIPP represents one of the richest sources of information, with separate questions on �expected� and �actually received� help. SIPP also includes questions on diet adequacy and food shortages that household can face in case of financial difficulties.
The National Survey of America�s Families
90. The �National Survey of America�s Families� (NSAF) is a cross-sectional survey administered three times until 2002. The interviewed sample includes more than 40 000 families (more than 100 000 individuals aged less than 65), with over-sampling of low-income families with children. The survey has five sections covering child well-being, family environment, health and health care, economic security, and socio-economic characteristics of the families as well their attitudes towards welfare, work and children. The economic security section of NSAF contains two parts on material deprivation covering food security and housing and economic hardship. The latter section includes questions on basic needs (BN), consumer durables (CD), housing conditions (HC), and financial stress (FS). There are also a few questions on help received from social network (HSN) as well as on subjective deprivation (SD).

DELSA/ELSA/WD/SEM(2006)6
59
Current Population Survey
91. The �Current Population Survey� (CPS) is the main source of information on labour force characteristics. This cross-sectional survey is conducted monthly over a nationally-representative sample of over 50 000 households. Special modules cover school enrolment, income, previous work experience, health and employee benefits. A special module on Food Insecurity provides relevant data for comparisons of material deprivation relating to Basic Needs.
Annex Table A.2. Surveys on material deprivation, by countries
Country Survey Years available
Type of Data
Sample size Main themes covered
Components of material deprivation
European countries
European Community Household Panel (ECHP, 15 countries)
1994 to 2001 Longitudinal 60 500 households
Income, Health, Education, Housing
Basic needs Basic leisure and social activities Consumer durables Housing conditions Financial stress
EU-Survey on Income and Leaving conditions (replacing ECHP)
From 2003 Longitudinal Similar to ECHP
Income, Health, Education, Housing
Basic needs Basic Leisure and social activities Consumer durables Housing conditions Financial stress
Eurobarometer special module (15 countries)
1976, 1989, 1993, 2001
Cross-sectional
1000 households (in each country)
Social exclusion, perception of poverty
Consumer durables Housing conditions Financial stress
European Quality of Life Survey (28 countries)
2003 Cross-sectional
1000 households (in each country)
Material conditions, living and working situation, etc.
Basic needs Basic Leisure and social activities Consumer durables Housing conditions Financial stress
United Kingdom
Millenium Study of Poverty and Social Exclusion (PSE)
1998 Cross-sectional
1534 households
Deprivation poverty Social Exclusion
Basic needs Basic Leisure and social activities Consumer durables Housing conditions Financial stress Help from social network
Family and Children Study (FACS)
From 1999 to 2001
Refreshed Longitudinal
6550 to 8000 households
Effect of work incentive and policy on families� living standards
Basic needs Basic Leisure and social activities Consumer durables Housing conditions Financial stress Help from social network
France Permanent Survey of Household Living Conditions (Enquête Permanente sur les conditions de vie des ménages, PCV
From 1996 to 2003
Cross-sectional
8000 households
Social Indicators, Health, housing, debts
Basic needs Basic leisure activities Housing conditions Financial stress
Germany Germany Welfare Survey
1978, 1980, 1984, 1988, 1990, 1993, 1998
Cross-sectional
3000 households
Development of objective living conditions and subjective well-being
Basic needs Basic leisure activities Housing conditions Consumer durables Help from social network Subjective deprivation

DELSA/ELSA/WD/SEM(2006)6
60
Country Survey Years available
Type of Data
Sample size Main themes covered
Components of material deprivation
United States
Survey of Income and Program Participation (SIPP)
From 1984, on going. Topical module on adult well-being in 1992, 1995, 1998 and 2003
Core data longitudinal Topical data cross-sectional
From 14 000 to 36,700 households
Poverty, income, employment, and health insurance coverage
Basic needs Basic leisure activities Housing conditions Financial stress Help from social network Subjective deprivation
National Survey of American Families
1997, 1999, 2002
Cross-sectional
40000 households (low income families with children are over-sampled)
Child well-being, family environment, economic security, health and health care
Consumer durables Housing conditions Financial stress Help form social networks
Current Population Survey "Food Security Supplement"
From 1995, annual
Cross-sectional yearly
50000 households
Labour force characteristics
Basic needs
Canada Household Income, Facilities and Equipment (HFE)
1971 to 1996
Cross-sectional
18000 Household living conditions
Consumer durables Housing conditions
Survey of Household Spending (SHS)
From 1997 on-going (integrates HFE and FAMEX)
Cross-sectional, yearly
20000 Household spending
Consumer durables Housing conditions
National Population Health Survey (NPHS)
Started in 1994, conducted every two years
Longitudinal (topical module on food insecurity one off in 1998-1999
17000 Health (various aspects)
Basic needs
Survey of Financial Security (SFS)
1999, 2005 Cross-sectional
21000 households
Incomes, Assets, Indebtedness
Financial Stress
Mexico National Survey of Household Income and Expenditure (Encuesta Nacional de Ingresos Y Gastos de Los Hogares, ENIGH
From 1983-84 to 2004
Cross-sectional
20252 households
Incomes and expenditures
Consumer durables Housing conditions
Japan National Survey on Family Income and Expenditure
From 1959, every five years
Cross-sectional
60000 households
Income and expenditures consumer goods, housing
Consumer durables Housing conditions

DELSA/ELSA/WD/SEM(2006)6
61
Country Survey Years available
Type of Data
Sample size Main themes covered
Components of material deprivation
Survey on Living Conditions (Shakai Seikatsu Chousa)
Experimental survey. Conducted in Nov.-Dec. 2003
Cross sectional
2000 households
Deprivation poverty Social Exclusion
Basic needs Basic Leisure and social activities Consumer durables Housing conditions Financial stress Help from social network
Australia Housing Expenditure Survey
From 1974 (every five years)
Cross-sectional
7000 Households� expenditures
Basic needs Basic leisure activities Financial stress Help from social network Subjective deprivation
Australian Housing Survey
From 1994 to 1999
Cross-sectional
13800 households (in 1999)
Characteristics, affordability and adequacy of dwellings, tenure and housing costs of persons and households.
Basic leisure activity Consumer durables Housing conditions
New Zealand
New Zealand Living Standard Survey
2000 Cross-sectional
3682 working age adults
Living conditions
Basic needs Basic leisure activities Consumer durables Financial stress Help from social network Subjective deprivation

DELSA/ELSA/WD/SEM(2006)6
62
Annex Table A.2. Survey questions on material deprivation
Format question Component and indicators
Countries concerned European countries United States Canada Japan Australia New Zealand
BASIC NEEDS
Ability to adequately heat home
European countries United States
Japan, Australia New Zealand
«Could the household afford to heat» (ECHP)
«Is the household satisfied with the warmth of home in winter» (SIPP)
NA «Could not afford heating and cooling devices such as air conditioners, eaters and kotatsu» (SLC)
«It happened that the household was not able to heat the dwelling because of a shortage of money»
(HES)
-«In the last 12 months has the household put up with feeling cold to save heating
cold» -«In the last 12 months have you stayed in bed longer to save heating
costs» -«Cannot afford heating in all main rooms» -«Cannot afford warm bedding in winter» (NZLSS)
Ability to have a healthy diet
European countries (15) United States Canada
New Zealand
«Could the household afford to eat meat or chicken every second day if wished» (ECHP)
«Enough but not always the kind of the food we want to eat» (SIPP) «Could not afford balanced meals» (SIPP, CPS)
«Did not eat the quality or variety of food that you wanted to eat because of a lack of money» (NPHS)
NA «A special meal once a week» (HES)
-«Cannot afford a special meal at home at least once a week » -«Bought cheaper cuts of meat or eat less meat than would like to help keep costs down» -«Gone without fresh fruit and vegetables to help keep costs down» (NZLSS)
Food insecurity European countries (15) United States Canada
Australia
«Has your household at any time during the past 12 months run out to pay for food» (EQLS)
-«Sometimes not enough to eat» (SIPP) -«Often not enough to eat» (SIPP) -«Any member of household has cut the size of the meals or skip meals because of shortage of money» (SIPP, CPS) -«Any member of the household has eaten less than they felt they should because of shortage of money» (SIPP, CPS) -«Any member of the household has not
-«Not enough food to eat because of a lack of money» (NPHS)
NA «Went without meals because of a shortage of money» (HES)
NA

DELSA/ELSA/WD/SEM(2006)6
63
Format question Component and indicators
Countries concerned European countries United States Canada Japan Australia New Zealand
eaten for a whole day because of shortage of money» (SIPP, CPS) -«Have lost weight because you didn�t have enough money for food (CPS)»
Worries about food
United States Canada
NA -«The food that I�ve bought just didn�t last and I didn�t have money to get more» (SIPP, CPS)» -«We worried our food would run before we got money to buy more» (CPS)
-«Did you or anyone else in your household worry that there would not be enough to eat because of a lack of money» (NPHS)
NA NA
Clothing properly
European countries (25)
Japan Australia New Zealand
«Could the household afford to buy new rather second-hand clothes» (ECHP, EQLS)
NA NA «Being able to buy new underwear once a year» and «Cannot afford buying clothes for special occasions such as funerals and weddings» (SLC)
«Cannot afford buying new and not second-hand clothes, most of time» (HES)
-«In the 12 last months the family bought second hand clothing instead of new to help keep costs down» -«In the last 12 months did you continue wearing clothing that was worn out because you»
Restricted access to health care
European countries (15) United States
Japan, New Zealand
«On the last occasion you needed to see a doctor or medical specialist, to what extent the cost of it makes it difficult for you to do so » (EQLS)
«In the past 12 months was there a time any member of the household needed to see a doctor but did not go» «In the past 12 months was there a time any member of the household needed to see a dentist but did not go» (SIPP)
NA «Cannot afford to go to a doctor when needed» (SLC)
NA -«In the last 12 months have you postponed or put off visits to the doctor to help keep costs down» -«In the last 12 months have you postponed or put off visits to the dentist to help keep costs down» -«Gone without glasses you needed because you couldn�t afford them» -«Not picked up prescriptions to keep down costs» (NZLSS)
BASIC LEISURE AND SOCIAL ACTIVITIES
Having family at home
European countries (25) Australia New Zealand
«Could the household afford having friends/family at home for a drink/meal at least once a month»
NA NA NA -«Could afford having family/friends over a meal at least once a month» (HES)
-«Could afford having family/friends over for a meal at least once a month» (NZLSS)

DELSA/ELSA/WD/SEM(2006)6
64
Format question Component and indicators
Countries concerned European countries United States Canada Japan Australia New Zealand
(ECHP, EQLS) Having one week-holiday
European countries (25) Australia New Zealand
«Could the household afford one week holiday away from home at least once a year» (ECHP, EQLS)»
NA NA «Family cannot afford one overnight trip per year because of financial reasons» (SLC)
«Could afford a holiday away from home for at least one week a year» (HES)
-«Could afford having holidays away from home every year» (NZLSS)
CONSUMER DURABLES«»
Television European countries (25) United States Canada
Australia New Zealand
«Does not have as cannot afford» (ECHP, EQLS)
«Does not have in home in working conditions» (SIPP)
«Does not have» (SHS)
NA «Does not have» (AHS)
«Does not have as cannot afford» (NZLSS)
Video-recorder European countries (25) United States Canada
Japan Australia New Zealand
«Does not have as cannot afford» (ECHP, EQLS)
«Does not have in home in working conditions » (SIPP)
«Does not have» (SHS)
«Cannot afford» (SLC) «Does not have» (AHS)
«Does not have as cannot afford» (NZLSS)
Microwave oven
European countries (25) United States
Japan Canada
Australia New Zealand
«Does not have as cannot afford» (ECHP, EQLS)
«Does not have in home in working conditions » (SIPP)
«Does not have» (SHS)
«Cannot afford» (SLC) «Does not have» (AHS)
«Does not have as cannot afford» (NZLSS)
Telephone European countries (25) United States Canada
Japan Australia New Zealand
«Does not have as cannot afford» (ECHP, EQLS)
«Does not have in home in working conditions » (SIPP)
«Does not have» (SHS)
«Cannot afford» (SLC) «Does not have» (AHS)
«Does not have as cannot afford» (NZLSS)
Car European countries (25) Canada
Japan Australia New Zealand
«Does not have as cannot afford» (ECHP, EQLS)
NA «Does not have» (SHS)
«Cannot afford» (SLC) «Does not have» (AHS)
«Does not have as cannot afford» (NZLSS)
Personal computer
European countries (25) United States
«Does not have as cannot afford» (ECHP, EQLS)
«Does not have in home in working conditions » (SIPP)
«Does not have» (SHS)
«Cannot afford» (SLC) «Does not have» (AHS)
«Does not have as cannot afford» (NZLSS)

DELSA/ELSA/WD/SEM(2006)6
65
Format question Component and indicators
Countries concerned European countries United States Canada Japan Australia New Zealand Canada
Japan Australia New Zealand
HOUSING CONDITIONS
Overcrowding European countries (25) United States Canada
Japan Australia New Zealand
-«Number of rooms with and without kitchen» (ECHP)
«Number of rooms with kitchen and without bath»
«Number of rooms with kitchen and without bath»
«Cannot afford more than one bedroom» «Cannot afford a bedroom different from living room» «Cannot afford adequate storage space» (SLC)
«Number of sufficient and spare bedrooms »
«Number of bedrooms» (NZLSS)
Need of repair European countries (15) United States Canada
Japan Australia New Zealand
-«Does the accommodation have leaky roof» -«Does the accommodation damp walls/foundations/floors» -«Does the accommodation have rot in windows/frames/floors» (ECHP)
-«Does the accommodation have problems with mice, rats, insects» -«Does the accommodation have leaking roof or ceiling» -«Does the accommodation have broken windows glass» -«Does the accommodation have exposed electrical wires» -«Does the accommodation have boiler/toilet not working» -«Does the accommodation have holes in the floor» (SIPP)
«Was the accommodation in major needs of repairs (corroded pipes, damaged electrical wiring, sagging floors, damp walls and ceilings, crumbling foundation, etc.), or in minor needs of repair (small cracks in walls and ceilings, broken light fixtures and switches, cracked or broken window, some missing paint, etc.) or only regular maintenance was needed (painting, leaking faucets, etc.)»
«Dampness and no fresh water in the dwelling» «Rainwater seeps into the house and outside air comes in through spaces» (SLC)
«Was the dwelling in essential need of repairs (AHS)»
«Does the accommodation have problems of draughts, dampness, plumbing, wiring, interior paintwork, windows, roof, piles or foundations, exterior paintwork, fencing, paving» (NZLSS)
Availability of bath/shower
European countries (15) Canada
Australia Japan
-«Does the accommodation have bath/shower» (ECHP)
NA NA «Cannot afford a bathroom for the family own use not shared with other families» (SLC)
-«Does the accommodation have working bath/shower connection» (AHS)
NA
Availability of toilets
European countries (15)
Japan
-«Does the accommodation have indoor flushing toilets»
NA NA «Cannot afford toilet for the family own use not shared with other
-«Does the accommodation have working toilet» (AHS)
-«Does the accommodation have inside lavatory or toilet» (NZLSS)

DELSA/ELSA/WD/SEM(2006)6
66
Format question Component and indicators
Countries concerned European countries United States Canada Japan Australia New Zealand Australia New Zealand
(ECHP)
families» (SLC)
Availability of hot water
European countries (15)
Japan New Zealand
-«Does the accommodation have hot running water» (ECHP)
NA NA «Cannot afford a hot water heater» (SLC
NA -«Does the accommodation have hot running water» (NZLSS)
Uncomfortable environmental conditions
European countries (15) United States
Japan New Zealand
-«Does the accommodation have noise from neighbours or outside» -«Is there any pollution, grime or other environmental problem caused by traffic or industry» -«Is there any crime or vandalism in the area» (ECHP)
-«Street noise or heavy street traffic» -«Streets in need of repair» -«Trash, litter, or garbage in the street» -«Rundown or abandoned houses or buildings» -«Industries, businesses, or other non-residential activities» -«Odours, smoke, or gas fumes» (SIPP)
NA «Neighbours can be heard» (SLC
NA «Does the accommodation have problems of industrial pollution, smell, noise from traffic, trains or aircrafts» (NZLSS)
Affordability European countries (15) United States Canada
Australia New Zealand
Housing Costs (ECHP) -«»
Housing Costs (ACS) Available Income (SIPP) -«»
Housing Costs, Income (SFS) -«»
NA Housing Costs, Income (HES, AHS) -«»
Housing Costs, Income (HES, AHS)
-«»
FINANCIAL STRESS
Arrears in payments of utility bills
European countries (15) United States Canada
Japan New Zealand
-«Has the household been unable to pay scheduled utility bills during the past 12 months» (ECHP)
-«During the past 12 months, has there been a time when household did not pay the full amount of the gas, oil or electricity bills» - -«did household was disconnected from services for not paying the bills»
-«In 2004 were any of you behind two months or more in rent or mortgage» (SFS)
«In the past year some services (gas, water, telephone, others) got stopped because of failure to pay bills » (SLC)
NA -«In the last 12 months you couldn't keep with payments for mortgages, rents» (NZLSS)
Arrears in mortgages/
rents
European countries (15) United States Canada
-«Has the household been unable to pay scheduled rent/mortgages for the
-«During the past 12 months, has there been a time when household did not pay
-«In 2004 were any of you behind two months or more in bills or loans» (SFS)
Either «The family has arrears in rents» or «in the past year the family had arrears in
-«Over the past year Could not pay gas/electricity/telephone bill of a shortage of
-«In the last 12 months you couldn't keep with payments for electricity, gas or water» (NZLSS)

DELSA/ELSA/WD/SEM(2006)6
67
Format question Component and indicators
Countries concerned European countries United States Canada Japan Australia New Zealand
Japan Australia New Zealand
accommodation during the past 12 months» (ECHP)
the full amount of the rent or mortgage» -«did household was evicted from your home for not paying the rent/mortgage»
replaying loans including mortgages» (SLC)
money»
Arrears in hire purchase loans
European countries (15) Canada
Japan New Zealand
-«Has the household been unable to pay scheduled hire purchase instalments or other loan repayment during the past 12 months» (ECHP)
NA -«In 2004 were any of you behind two months or more in other repayments» (SFS)
«In the past year the family had arrears in repaying credit cards or small-scale money lenders» (SLC)
NA -«In the last 12 months you couldn't keep with payments for such things as hire-purchase, credit cards or store cards» (NZLSS)
Ability to make ends meet
European countries (15)
Japan New Zealand
-«Thinking of your household�s total monthly income, is your household able to make ends meet with great/some difficulty/fairly easily,..» (ECHP, Eurobarometer CC)
-«During the past 12 months, has there been a time when your household did not meet all of your essential expenses» (SIPP)
NA «The family runs into red every month»
NA -«How well your income meets your everyday needs» (NZLSS)
Ability to save European countries (25) Canada
Japan Australia New Zealand
-«Is there normally some money left to save (considering household's income and expenses)» (ECHP)
NA -«In 2004, excluding any money spent on investments or the purchase of a home or automobile, would you say that your family's spending exceeded/was equal/was less than your income»
«The family can never save or has to run down previous savings» (SLC)
-«Thinking of your household's situation over the last 12 months, which one of the following statements best describes your household's financial situation : spend more money than we get/ just break even most weeks/ able to save money most weeks» (HES)
-«Your household spent less money than received/ just broke even months/spent more than received» (NZLSS)
Coping strategies to keep costs
down
Canada Australia New Zealand
NA NA -«Did you sell/use an asset to repay a loan» -«Did you sell or pawn something» -«Did you declare bankruptcy» (SFS)
NA -«Did you pawned or sold something» -Did you seek for assistance» (HES)
-«Did you pawn or sell something» -Various other (but not directly comparable)
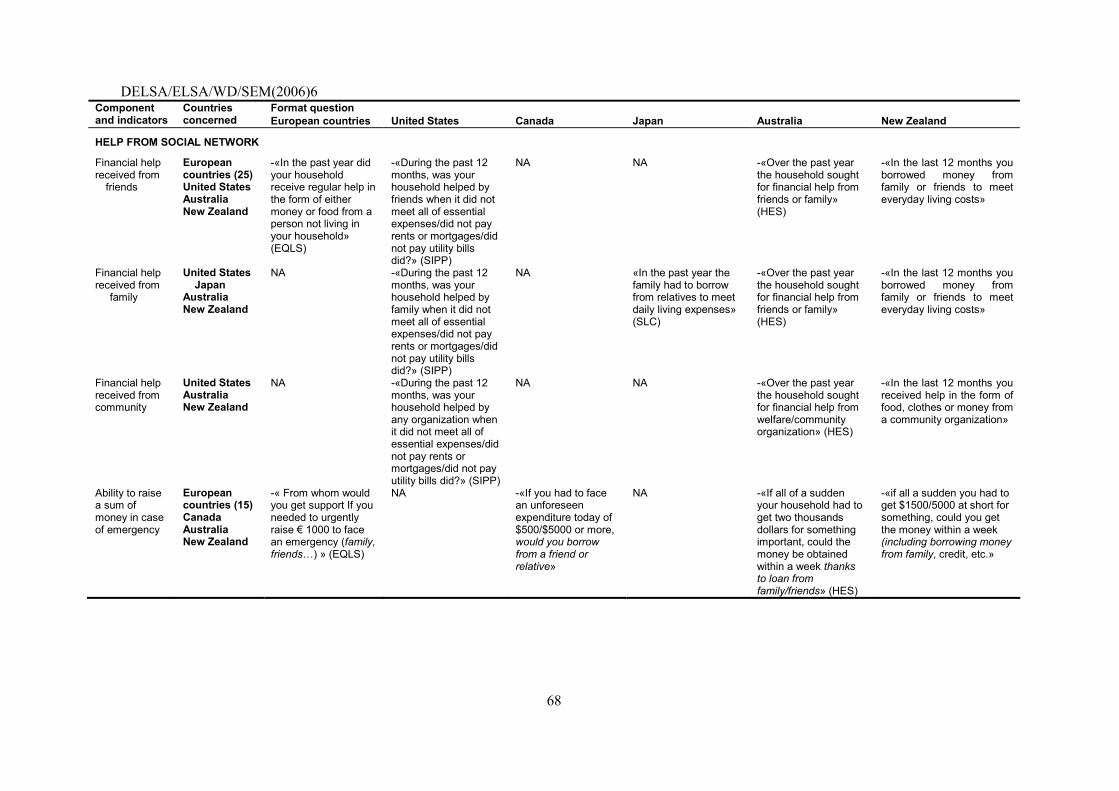
DELSA/ELSA/WD/SEM(2006)6
68
Format question Component and indicators
Countries concerned European countries United States Canada Japan Australia New Zealand
HELP FROM SOCIAL NETWORK
Financial help received from
friends
European countries (25) United States Australia New Zealand
-«In the past year did your household receive regular help in the form of either money or food from a person not living in your household» (EQLS)
-«During the past 12 months, was your household helped by friends when it did not meet all of essential expenses/did not pay rents or mortgages/did not pay utility bills did?» (SIPP)
NA NA -«Over the past year the household sought for financial help from friends or family» (HES)
-«In the last 12 months you borrowed money from family or friends to meet everyday living costs»
Financial help received from
family
United States Japan
Australia New Zealand
NA -«During the past 12 months, was your household helped by family when it did not meet all of essential expenses/did not pay rents or mortgages/did not pay utility bills did?» (SIPP)
NA «In the past year the family had to borrow from relatives to meet daily living expenses» (SLC)
-«Over the past year the household sought for financial help from friends or family» (HES)
-«In the last 12 months you borrowed money from family or friends to meet everyday living costs»
Financial help received from community
United States Australia New Zealand
NA -«During the past 12 months, was your household helped by any organization when it did not meet all of essential expenses/did not pay rents or mortgages/did not pay utility bills did?» (SIPP)
NA NA -«Over the past year the household sought for financial help from welfare/community organization» (HES)
-«In the last 12 months you received help in the form of food, clothes or money from a community organization»
Ability to raise a sum of money in case of emergency
European countries (15) Canada Australia New Zealand
-« From whom would you get support If you needed to urgently raise � 1000 to face an emergency (family, friends�) » (EQLS)
NA -«If you had to face an unforeseen expenditure today of $500/$5000 or more, would you borrow from a friend or relative»
NA -«If all of a sudden your household had to get two thousands dollars for something important, could the money be obtained within a week thanks to loan from family/friends» (HES)
-«if all a sudden you had to get $1500/5000 at short for something, could you get the money within a week (including borrowing money from family, credit, etc.»

DELSA/ELSA/WD/SEM(2006)6
69
OECD SOCIAL, EMPLOYMENT AND MIGRATION WORKING PAPERS
Most recent releases are:
No. 36 FROM INACTIVITY TO WORK: THE ROLE OF ACTIVE LABOUR MARKET POLICIES Stéphane Carcillo and David Grubb
No. 35 EMPLOYMENT PATTERNS IN OECD COUNTRIES: REASSESSING THE ROLE OF POLICIES AND INSTITUTIONS Andrea Bassanini and Romain Duval
No. 34 AN AGE PERSPECTIVE ON ECONOMIC WELL-BEING AND SOCIAL PROTECTION IN NINE OECD COUNTRIES (2006) Thai-Thanh Dang, Herwig Immervoll, Daniela Mantovani, Kristian Orsini, Holly Sutherland
No. 33 ALTERNATIVE MEASURES OF WELL-BEING (2006) Romina Boarini, Asa Johansson and Marco Mira d�Ercole
No: 32 SOCIAL DISADVANTAGE AND EDUCATION EXPERIENCES (2006) Stephen Machin
No. 31 CAN PARENTS AFFORD TO WORK? CHILDCARE COSTS, TAX-BENEFIT POLICIES AND WORK INCENTIVES (2005) Herwig Immervoll and David Barber
No. 30 CHALLENGES FACING LABOUR OFFICES AND SOCIAL INSURANCE (2005) Anders Reutersward
No. 29 NET SOCIAL EXPENDITURE, 2005 EDITION Willem Adema & Maxime Ladaique
No. 28 WELFARE REFORM IN EUROPEAN COUNTRIES: A MICROSIMULATION ANALYSIS (2005) Herwig Immervoll, Henrik Jacobsen Kleven, Claus Thustrup Kreiner and Emmanuel Saez
No. 27 TRENDS AND DETERMINANTS OF FERTILITY RATES: THE ROLE OF POLICIES (2005) Cristina d'Addio & Marco Mira d'Ercole
No. 26 THE �ENABLING STATE?� (2005) Neil Guilbert
No. 25 COUNTING IMMIGRANTS AND EXPATRIATES IN OECD COUNTRIES: A NEW PERSPECTIVE (2005) Jean-Christophe Dumont and Georges Lemaître
No. 24 TAXATION, ETHNIC TIES AND THE LOCATION CHOICE OF HIGHLY SKILLED IMMIGRANTS (2005) Thomas Liebig and Alfonso Sousa-Poza
No. 23 SHOULD WE EXTEND THE ROLE OF PRIVATE SOCIAL EXPENDITURE? (2005) Mark Pearson and John P. Martin
No. 22 INCOME DISTRIBUTION AND POVERTY IN OECD COUNTRIES IN THE SECOND HALF OF THE 1990S (2005) Michael Förster and Marco Mira d'Ercole
No. 21 DESIGN CHOICES IN MARKET COMPETITION FOR EMPLOYMENT SERVICES FOR THE LONG-TERM UNEMPLOYED (2004) Ludo Struyven
No. 20 BENEFIT COVERAGE RATES AND HOUSEHOLD TYPOLOGIES: SCOPE AND LIMITATIONS OF TAX-BENEFIT INDICATORS (2004) Herwig Immervoll, Pascal Marianna and Marco Mira D�Ercole
Recent available working papers can be found on the OECD website: http://www.oecd.org/els/workingpapers.
Other series of working papers available from the OECD include: OECD HEALTH WORKING PAPERS
DELSA/ELSA/WD/SEM(2006)6
70
RECENT RELATED OECD PUBLICATIONS:
INTERNATIONAL MIGRATION OUTLOOK: SOPEMI - 2006 Edition
AGEING AND EMPLOYMENT POLICIES: LIVE LONGER, WORK LONGER (2006)
BABIES AND BOSSES: Reconciling Work and Family Life, Volume 4 Canada, Finland, Sweden and the United Kingdom (2005)
PENSIONS AT A GLANCE: Public policies across OECD countries (2005)
EXTENDING OPPORTUNITIES � How active social policy can benefit us all (2005)
SOCIETY AT A GLANCE: OECD Social Indicators (2005)
OECD EMPLOYMENT OUTLOOK (2006)
AGEING AND EMPLOYMENT POLICIES: AUSTRALIA (2005)
AGEING AND EMPLOYMENT POLICIES: AUSTRIA (2005)
AGEING AND EMPLOYMENT POLICIES: CANADA (2005)
AGEING AND EMPLOYMENT POLICIES: DENMARK (2005)
AGEING AND EMPLOYMENT POLICIES: FRANCE (2005)
AGEING AND EMPLOYMENT POLICIES: GERMANY (2005)
AGEING AND EMPLOYMENT POLICIES: IRELAND (2006)
AGEING AND EMPLOYMENT POLICIES: NETHERLANDS (2005)
AGEING AND EMPLOYMENT POLICIES: UNITED STATES (2005)
PROMOTING ADULT LEARNING (2005)
MIGRATION, REMITTANCES AND DEVELOPMENT (2005)
MIGRATION FOR EMPLOYMENT: BILATERAL AGREEMENTS AT A CROSSROADS (2004)
INCOME DISPARITIES IN CHINA: AN OECD PERSPECTIVE (2004)
BENEFITS AND WAGES: OECD Indicators (2004)
REFORMING PUBLIC PENSIONS: SHARING THE EXPERIENCES OF TRANSITION AND OECD COUNTRIES (2004)
BABIES AND BOSSES: Reconciling Work and Family Life, Volume 3, New Zealand, Portugal, Switzerland (2004)
ASSET BUILDING AND THE ESCAPE FROM POVERTY: A NEW WELFARE POLICY DEBATE (2003)
MANAGING DECENTRALISATION: A NEW ROLE FOR LABOUR MARKET POLICY (2003)
COMBATING CHILD LABOUR: A REVIEW OF POLICIES (2003)
BABIES AND BOSSES: Reconciling Work and Family Life, Volume 2, Austria, Ireland and Japan (2003)
For a full list, consult the OECD On-Line Bookstore at www.oecd.org