Embed Size (px)
Citation preview

Measuring & Analyzing Financial Performance

ANALYZING FINANCIAL POSITION AND PERFORMANCE
Analyze Financial Statement information
Learn two basic types of analysis
Use five key financial criteria
Learn how to calculate key financial measures

TWO TYPES OF ANALYSIS
1. Comparative statement analysis
2. Financial ratio analysis
The purpose of both types of analysis is to:
FIND, LOCATE AND ISOLATE


RATIOSMonitoring Tools
Used in conjunction with other information
Rules of thumb are only guidelines
Unlimited number of- physical ratios
- financial ratios
Take time to develop- a “feel”
- understand- internalize

RATIO ANALYSIS
Trends over time
Compare to industry standards
Comparison to similar firms
Comparison to performance objectives

FINANCIAL RATIO ANALYSIS
Types of ratios to look at:
Liquidity:
Measures ability to meet obligations when due without disrupting normal operations
Solvency:
Measures borrowed capital in relation to owner’s equity capital invested in the business

FINANCIAL RATIO ANALYSIS (cont’d)
Profitability:
Measures amount of profit from use of labor, management and capital
Repayment Capacity:
Measures ability to repay debts from both farm and non-farm income
Financial Efficiency:
Measures degree of efficiency in use of labor, management and capital

TESTS OF LIQUIDITYA. Working Capital =
B. Current ratio =
C. Acid test ratio =
D. Cash flow coverage ratio =
Total current farm assets minus total current farm liabilities
Current assetsCurrent liabilities
Liquid assetsCurrent liabilities
Cash available1
Cash required2
1Beginning cash + cash received from operating activities+ cash received from investing activities + proceeds from term loans + cash received from equity contributions
2Cash paid for operating activities + cash paid for investing activities + principal paid on term loans and capital leases + cash equity distributions

TESTS OF SOLVENCY
A. Debt-to-assets =
B. Equity-to-assets ratio =
C. Debt-to-equity ratio =
total liabilities
total assets
total farm equity
total farm assets
total farm liabilities
total farm equity

TESTS OF PROFITABILITYA. Return on equity = net income from farm
operations - value of unpaid labor/management average owners equity
B. Return on assets = net income from farm operations interest expense
- value of unpaid labor/management total farm assets
C. Operating profit margin ratio = net farm income from operations + farm interest expense - value of unpaid labor/mgmt
gross farm revenues

REPAYMENT OF CAPACITY RATIOS Term debt and capital lease coverage ratio =
net farm income from operations + total non-farm income + depreciation/amortization expenses +
interest on term debt + interest on capital leases - total income tax expense- withdrawals for family living annual scheduled principal and interest on
term debt + annual scheduled principal and interest on capital leases
Debt-to-income ratio = average total farm liabilities net farm income from operations
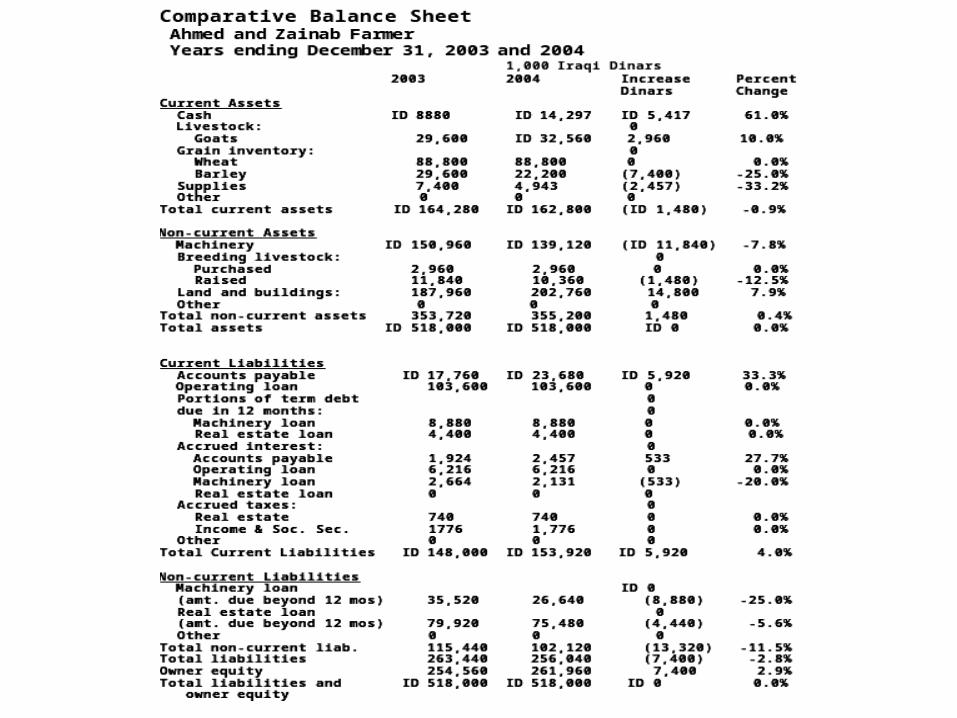
FINANCIAL EFFICIENCY RATIOS
A. Asset turnover ratio = gross farm revenue average total assets
B. Operating expense ratio = total expenses (excl. int. & depr. expense) gross farm revenues
C. Depreciation expense ratio = depreciation expense gross farm revenue
D. Interest expense = total farm interest expense gross farm revenue
E. Net farm income = net farm income from operationsfrom operations ratio gross farm revenues

OTHER EFFICIENCY RATIOS
Labor productivity ratio =
gross farm revenues
labor and salary expense + value of unpaid
labor and management
Machinery and equipment productivity ratio =
gross farm revenues
avg. investment in farm machinery and equip.

OTHER COMPARISONS
Carrying charge on owned landvs.
Cash rental rate on comparable loan
Family withdrawal as a percent of- value of farm production- total expenses
Machinery investment per acre
Nonproductive assets as a percent of total assets

COMPARING RATIOS 1. Net income, is it
✧ before or after taxes ✧ cash or accrual ✧ farm or farm plus non-farm ✧ before or after family living withdrawls
2. Balance sheet and resulting net worth ✧ cost, market or something in between ✧ have accrued items been included or omitted ✧ are deferred tax liabilities included or omitted
3. Is the information based on the individual, the business or a combination of the two
4. Is the ratio based an average, beginning of the year or end of the year figures

COMPARING RATIOS (cont’d)5. The legal structure of the entity
- corporation vs. proprietorship- treatment of salaries vs. withdrawals
6. Same fiscal year or point in time
7. What are you comparing to- industry, state average, or loan portfolio average...- a specific farm category, size
8. Type of business- dairy vs. grain vs. cattle
9. Are the firms from the same geographic area:- production methods (seasonality, irrigated vs. dry land,
confinement vs. pasture, double vs. single crop)

CASE STUDY
Ahmed and Zainab own and farm 130 dunum. On 100 tilled dunum, they grow 65 dunum of wheat and 35 dunum of barley. They also cash rent 500 dunum (320 dunum of wheat and 165 dunum of barley) and rent 400 dunum (200 dunum of wheat and 200 dunum of barley) on a 50-50 share lease. So, in year 2004 they farmed 585 dunum of wheat and 400 dunum of barley. They also sold 550 goats. Ahmed and Zainab work full time on the farm and have one hired man who works for them full time.

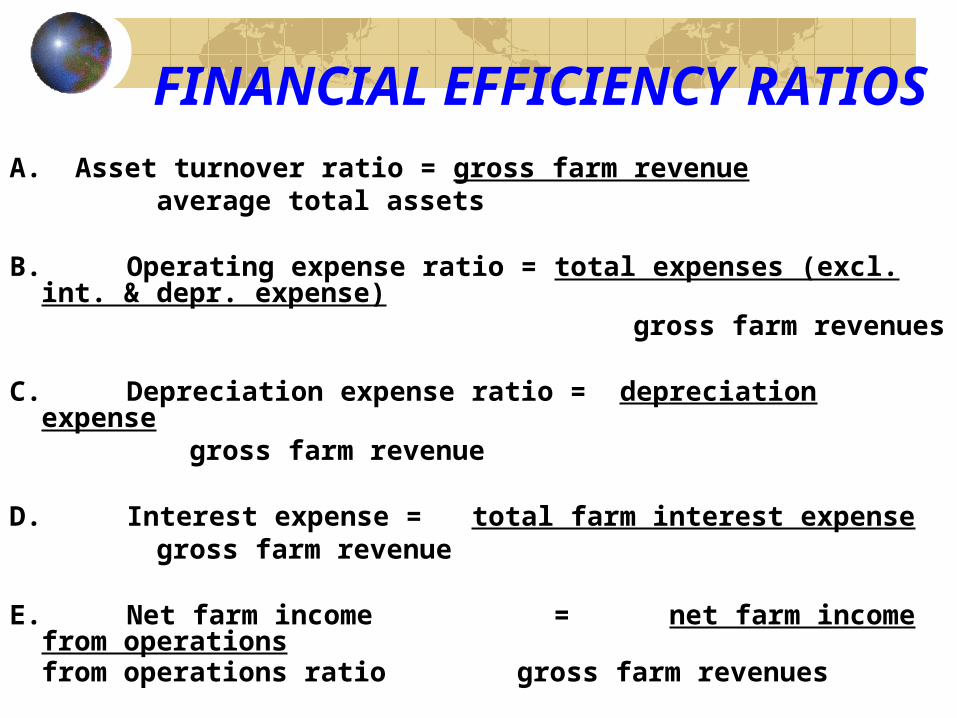
Ending Balance SheetName: Ahmed & Zainab Farmer 1,000 Iraqi Dinars Date: December 31, 2004
ASSETS LIABILITIES AND OWNER EQUITY
Cost Market Value Cost Market Value
Current assets Current liabilities
Cash
Livestock:
Goats
Grain inventory:
Wheat
Barley
Supplies
Other
ID 14,297
32,560
88,800
22,200
4,943
0
ID 14,297
32,560
88,800
22,200
4,943
0
Accounts payable
Operating loan
Portions of term debt due in 12 mo:
Machinery loan
Real estate loan
Accrued interest:
Accounts payable
Operating loan
Machinery loan
Real estate loan
Accrued taxes:
Real estate
Income & SS
Other
ID 23,680
103,600
8,880
4,440
2,457
6,216
2,131
0
740
1,776
0
DI 23,680
103,600
8,880
4,440
2,457
6,216
2,131
0
740
1,776
0
Total current assets ID 162,800 ID 162,800 Total current liabilities ID 153,920 ID 153,920
Non-current assets Non-current liabilities
Machinery:
Cost
Acc. Dep.
Breeding livestock:
Purchased
Raised
Land & Buildings
Cost
Acc. Dep.
Other
ID 177,600
57,720
2,960
10,360
183,520
20,720
0
ID 139,120
119,880
2,960
10,360
202,760
Total non-current assets ID 296,000 ID 355,200 Total non-current liabilities ID 102,120 ID 102,120
Total liabilities ID 256,040 ID 256,040
Owner equity ID 202,760 ID 202,760
Total assets ID 458,800 ID 518,000 Total liabilities and owner equity ID 458,800 ID 518,000

Income statement: gross revenue approach 1,000 Iraqi Dinars Name: Ahmed and Zainab Farmer 12 month period ending 12/31/2003
Revenue Cash Accrual
Cash farm revenue
Wheat ID 112,554 Barley 66,008 Goats 79,565 Breeding livestock 4,529 Other 0
Gross cash farm revenues ID262,656 ID 262,656
InventoryAdjustments
Inventories Beg. End.
Difference (End.-Beg.)
Wheat Barley Goats Breeding livestock Other
ID 88,800 29,600 29,600 14,800 0
ID 88,800 22,200 32,560
13,320 0
ID 0 (7,400) 2,960 (1,480) 0
Total inventory adjustment ± ID (5,920)
Gross farm revenues =ID 262,656 =ID 256,736
Expenses - Cash Farm
Purchased feed ID 26,640Other cash farm operating expenses 156,791Interest 27,928
Total cash farm expenses - ID 211,359 - ID 211,359
Net cash farm income = ID 51,297
Depreciation - ID 25,160 - ID 25,160
Non-cash expense adjustments
Assets Inventories Beg. End.
Difference (End.-Beg.)
Unused supplies Other
ID 7,400 0
ID 4,943 0
ID (2,457) 0
Liabilities (Beg.-End)
Accounts payable Accrued interest Accrued taxes Other
ID 17,760 10,804 740 0
ID 23,680 10,804 740
0
ID (5,920) 0 0 0
Total non-cash expense adjustments ±ID (8,377)
Net farm income from operations =ID 26,137 = ID 11,840
Gain/loss on sale of farm capital assets ± ID 1,480 ±ID 1,480
Net farm income = ID 27,528 = ID 13,320

Statement of Cash Flows
Name: Ahmed and Zainab Farmer 1,000 Iraqi Dinars For the period: 1/1/2003 through 12/31/2004
Cash flows from operation activities
Cash received from operationsCash received from non-farm incomeCash paid for feeder livestock, purchased feed & other items purchase for resaleCash paid for operating expensesCash paid for interestNet cash paid for income and Social Security taxesNet Cash paid for other operating activitiesCash withdrawals for family living
+ID 262,656+ 0- 26,640- 156,791- 27,928- 1,776- 0- 33,744
Net cash provided by operating activities ± $ 15,777
Cash flows from investing activities
Cash received from sale of breeding stock (other than normal culling)Cash received from sale of machinery and equipmentCash received from sale of farm real estateCash received from sale of marketable securitiesCash received from sale of non-farm investments & retirement acct. withdrawalsCash paid to purchase breeding stockCash paid to purchase machinery and equipmentCash paid to purchase real estate and buildingsCash paid to purchase marketable securitiesCash paid to purchase non-farm investments & retirement acct. deposits
+ ID 0+ 4,440+ 0+ 0+ 0- 1,480- 0- 0- 0- 0
Net cash provided by investing activities ± ID 2,960
Cash flows from financing activities
Proceeds from operating loansProceeds from term loansCash received from capital contributions, gifts and inheritancesPrincipal payments on operating loansPrincipal payment on capital leasesPrincipal payment on term loansCash dividends and capital distributions
+ID 148,000+ 0+ 0- 148,000- 0- 13,320- 0
Net cash provided by financing activities ±ID (13,320)
Net increase (decrease) in cash and cash equivalents ±ID 5,417
±ID 8,880
± ID 9,660
Cash and cash equivalents at beginning of year
Cash and cash equivalents at end of year


1Beginning cash + cash received from operating activities + cash received from investing activities + proceeds from term loans + cash received from equity contributions
2Cash paid for operating activities + cash paid for investing activities + principal paid on term loans and capital leases + cash equity distributions
Analyzing financial performance for Ahmed and Zainab Farmer
1. Using information from Ahmed and Zainab’s 2003 and 2004 market-value balance sheets, 2003 income statement, 2003 statement of cash flows, 2003 cash flow statement and reconciliation of owner equity, calculate the following measures of financial performance.

A. Working capital=
B. Current ratio=
C. Cash flow coverage ratio=
D. Debt-to-asset ratio=
E. Equity-to-asset ratio (percent ownership) =
total current farm assets less
total current farm liabilities
current assets
current liabilities
cash available¹
cash required²
total liabilities
total assets
total farm equity
total farm assets
ID 16,280,000
1.11
N/A
0.51
0.49
_____________
_____________
_____________
_____________
_____________
2003 2004

F. Debt-to-equity ratio (leverage)=
G. Rate of return on assets=
H. Rate of return on equity=
I. Operating profit margin ratio=
total farm liabilities
total farm equity
net income from farm
operations + int. expense
-value of unpaid labor/management
total farm assets
net income from farm operations -value of unpaid labor/management
average owners equity
net farm income from operations+farm interest expense
-value of unpaid labor/mgmt
gross farm revenues
1.03
NA
NA
NA
______________
______________
______________
______________

J. Term debt and capital lease coverage ratio=
K. Debt-to-income ratio=
net farm income from operations+farm interest expense
-value of unpaid labor/mgmt
gross farm revenues
net farm income from operations+ total non-farm income +depreciation/amortization expenses+interest on term debt+interest on capital leases-total income tax expense
- withdrawals for family living
annual scheduled principal and interest on term debt +annual scheduled principal and interest on capital leases
NA
NA
______________
______________

L. Asset turnover ratio=
M. Operating expense ratio=
N. Depreciation expense ratio=
O. Interest expense ratio=
P. Net farm income from operations ratio=
total farm equity
total farm assets
total farm liabilities
total farm equity
net income from farm
operations + int. expense
-value of unpaid labor/management
total farm assets
net income from farm operations
-value of unpaid labor/management
average owners equity
0.49
1.03
NA
NA
______________
______________
______________
______________

Exercise (cont’d)
2. Compare Ahmed and Zainab’s working capital and current ratio on December 31, 2003, with those measures on December 31, 2004. Are Ahmed and Zainab Farmer more or less liquid in 2004 than in 2003?
3. Compare Ahmed & Zainab’s 1.2% rate of return on assets to your calculated rate of return on equity. What does the relationship imply about the Farmers’ use of borrowed capital?

Exercise (cont’d)
4. What are the Farmers’ debt-to-asset ratios on December 31, 2003, and December 31, 2004, using the cost method of valuing assets? Are the ratios higher or lower than the ratios calculated for 2003 and 2004 using the market-value method?
5. The total of Ahmed and Zainab’s operating, depreciation and interest expenses as a percentage of gross farm revenues in 2004 equals _____%. If that amount is added to net farm income from operations/gross farm revenues, the total equals _____%.

Summary
TESTS OF LIQUIDITY
TESTS OF SOLVENCY
TESTS OF PROFITABILITY
TESTS OF REPAYMENT CAPACITY
TESTS OF EFFICIENCY
OTHER MEASURES PECULIAR TO THE TYPE OF OPERATION