Embed Size (px)
Citation preview
Measuring and Funding Performance
A Presentation to Connecticut Legislatorsby
The New England Board of Higher Education
February 27, 2013
Friday, March 1, 2013
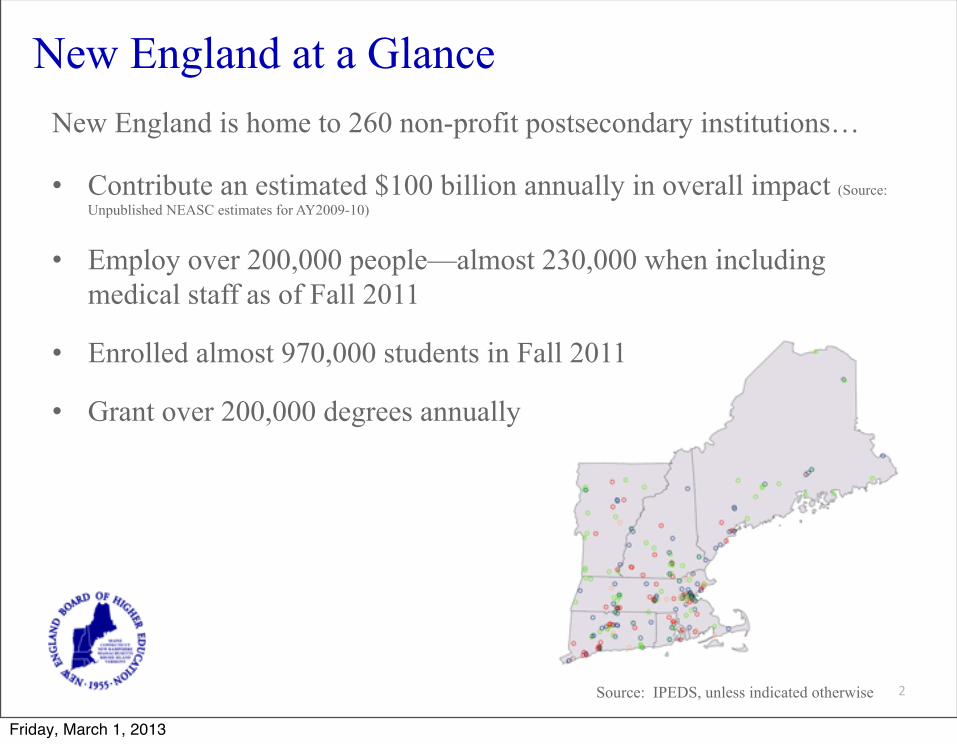
New England at a GlanceNew England is home to 260 non-profit postsecondary institutions…
• Contribute an estimated $100 billion annually in overall impact (Source: Unpublished NEASC estimates for AY2009-10)
• Employ over 200,000 people—almost 230,000 when including medical staff as of Fall 2011
• Enrolled almost 970,000 students in Fall 2011
• Grant over 200,000 degrees annually
Source: IPEDS, unless indicated otherwise 2
Friday, March 1, 2013
About NEBHE
• Interstate agency, chartered by New England Governors in 1955
• Mission: Expand educational opportunities and resources
• Key areas:
• Cost savings & affordability
• College readiness & success
• Policy leadership on key issues related to education & economy
• Strengthening higher education’s link to local and regional economic development
3
Friday, March 1, 2013

• Regional Student Program “Tuition Break”
• Issue-oriented Conferences & Annual Excellence Awards
• Professional & Curriculum Development in STEM fields
• The New England Journal of Higher Education (formerly Connection)
• Policy & Research Reports, including “Trends & Indicators”
• Master Property Insurance Cost-saving Collaborative
About NEBHE
4
Friday, March 1, 2013
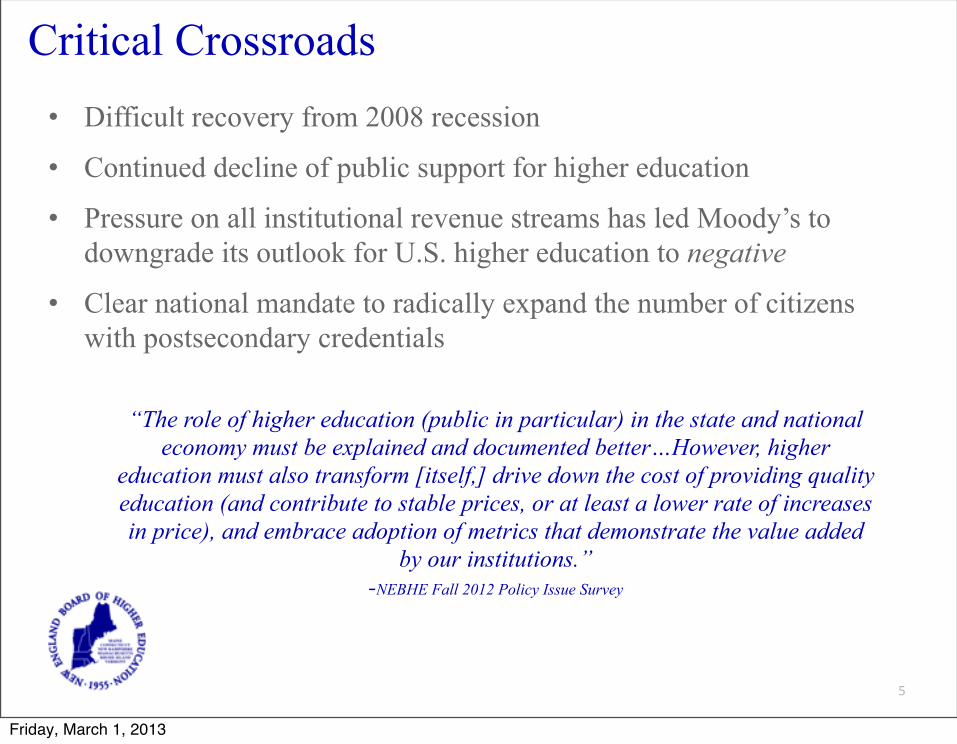
Critical Crossroads• Difficult recovery from 2008 recession
• Continued decline of public support for higher education
• Pressure on all institutional revenue streams has led Moody’s to downgrade its outlook for U.S. higher education to negative
• Clear national mandate to radically expand the number of citizens with postsecondary credentials
“The role of higher education (public in particular) in the state and national economy must be explained and documented better…However, higher
education must also transform [itself,] drive down the cost of providing quality education (and contribute to stable prices, or at least a lower rate of increases in price), and embrace adoption of metrics that demonstrate the value added
by our institutions.”-NEBHE Fall 2012 Policy Issue Survey
5
Friday, March 1, 2013
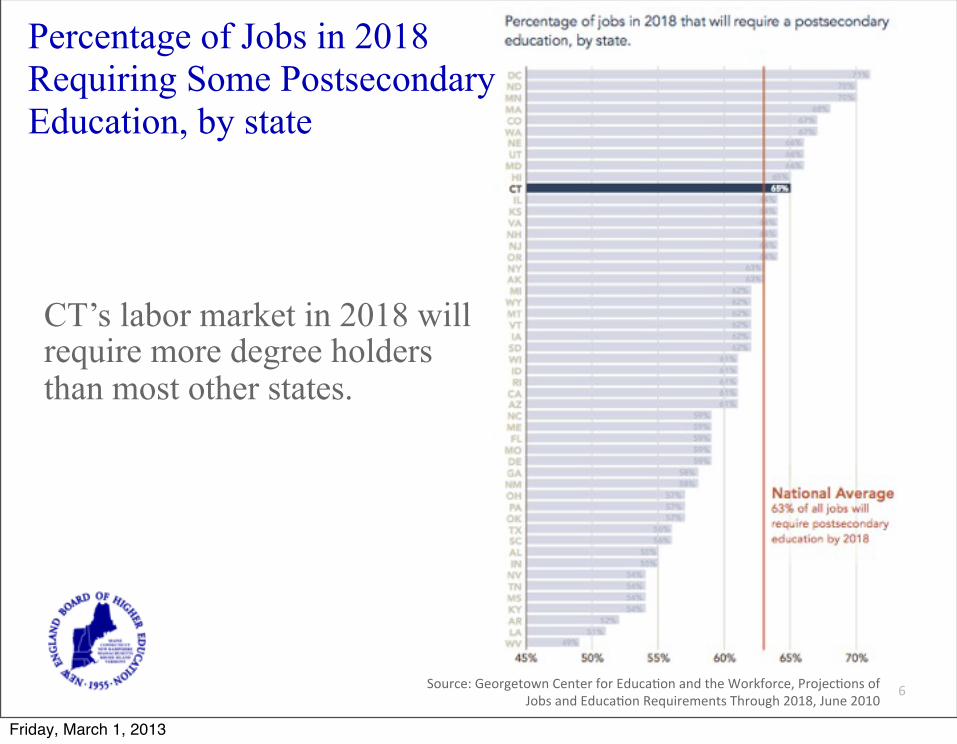
Percentage of Jobs in 2018 Requiring Some Postsecondary Education, by state
6Source: Georgetown Center for Educa8on and the Workforce, Projec8ons of Jobs and Educa8on Requirements Through 2018, June 2010
CT’s labor market in 2018 will require more degree holders than most other states.
Friday, March 1, 2013
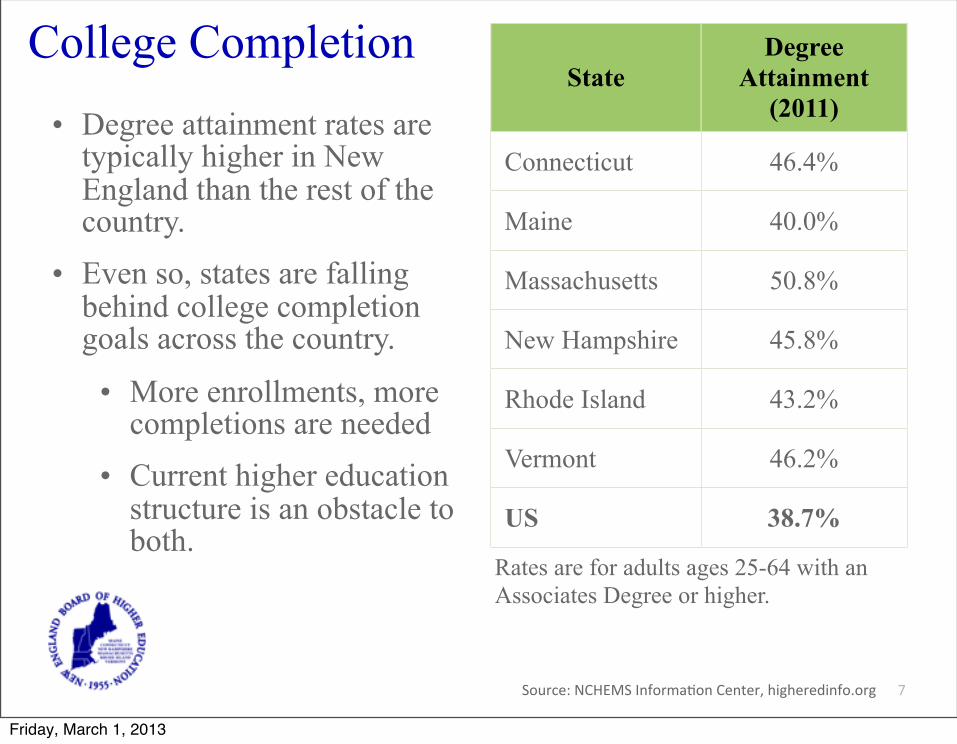
College Completion
7
StateDegree
Attainment(2011)
Connecticut 46.4%
Maine 40.0%
Massachusetts 50.8%
New Hampshire 45.8%
Rhode Island 43.2%
Vermont 46.2%
US 38.7%
Source: NCHEMS Informa8on Center, higheredinfo.org
• Degree attainment rates are typically higher in New England than the rest of the country.
• Even so, states are falling behind college completion goals across the country.
• More enrollments, more completions are needed
• Current higher education structure is an obstacle to both.
Rates are for adults ages 25-64 with an Associates Degree or higher.
Friday, March 1, 2013

Source: IPEDS Trend Generator, Accessed Feb. 2013
!"#
!!#
$"#
$!#
%"#
&""&# &""'# &""(# &""!# &""$# &""%# &"")# &""*# &"+"#
,-.-# /0# 12# 13# 45# 67# 80#
Four-Year Graduation Rates in Six YearsCollege Completion
8
Friday, March 1, 2013
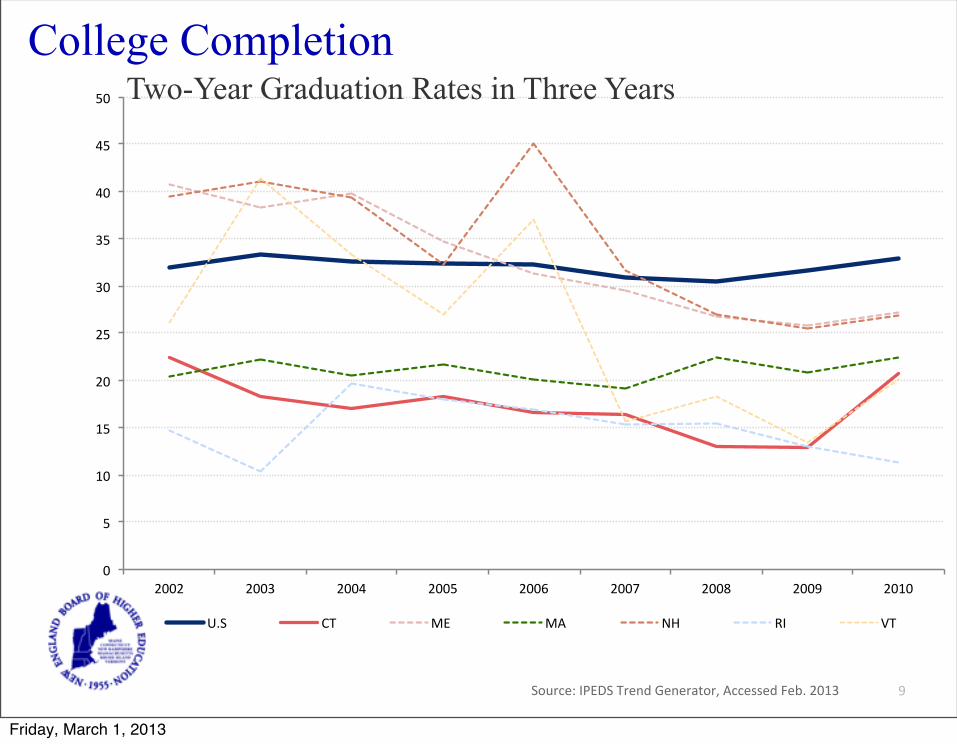
Source: IPEDS Trend Generator, Accessed Feb. 2013
!"
#"
$!"
$#"
%!"
%#"
&!"
&#"
'!"
'#"
#!"
%!!%" %!!&" %!!'" %!!#" %!!(" %!!)" %!!*" %!!+" %!$!"
,-." /0" 12" 13" 45" 67" 80"
College Completion
9
Two-Year Graduation Rates in Three Years
Friday, March 1, 2013

College Completion
10
• Incentive Programs
• Performance or Outcomes-based Funding
Friday, March 1, 2013
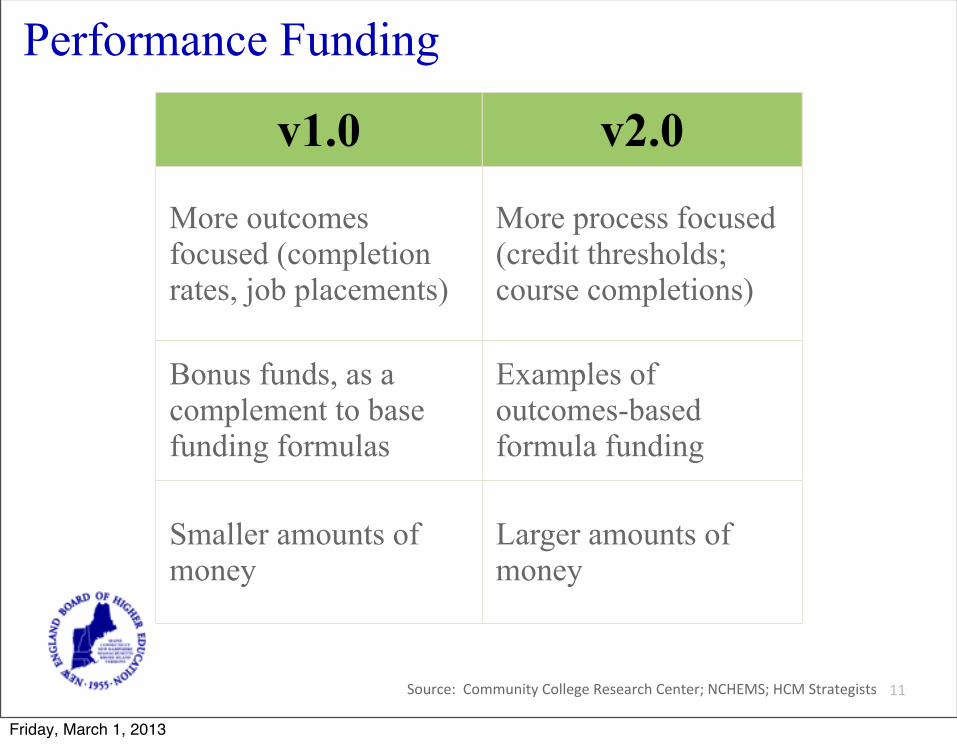
Performance Funding
11Source: Community College Research Center; NCHEMS; HCM Strategists
v1.0 v2.0
More outcomes focused (completion rates, job placements)
More process focused (credit thresholds; course completions)
Bonus funds, as a complement to base funding formulas
Examples of outcomes-based formula funding
Smaller amounts of money
Larger amounts of money
Friday, March 1, 2013
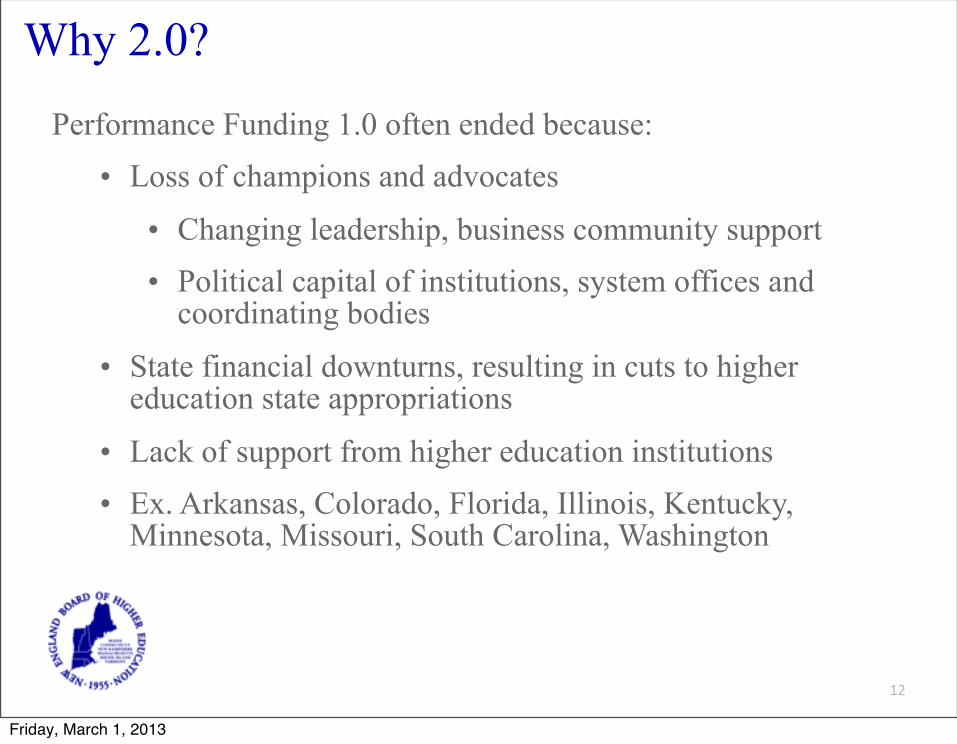
Why 2.0?
12
Performance Funding 1.0 often ended because:
• Loss of champions and advocates
• Changing leadership, business community support
• Political capital of institutions, system offices and coordinating bodies
• State financial downturns, resulting in cuts to higher education state appropriations
• Lack of support from higher education institutions
• Ex. Arkansas, Colorado, Florida, Illinois, Kentucky, Minnesota, Missouri, South Carolina, Washington
Friday, March 1, 2013
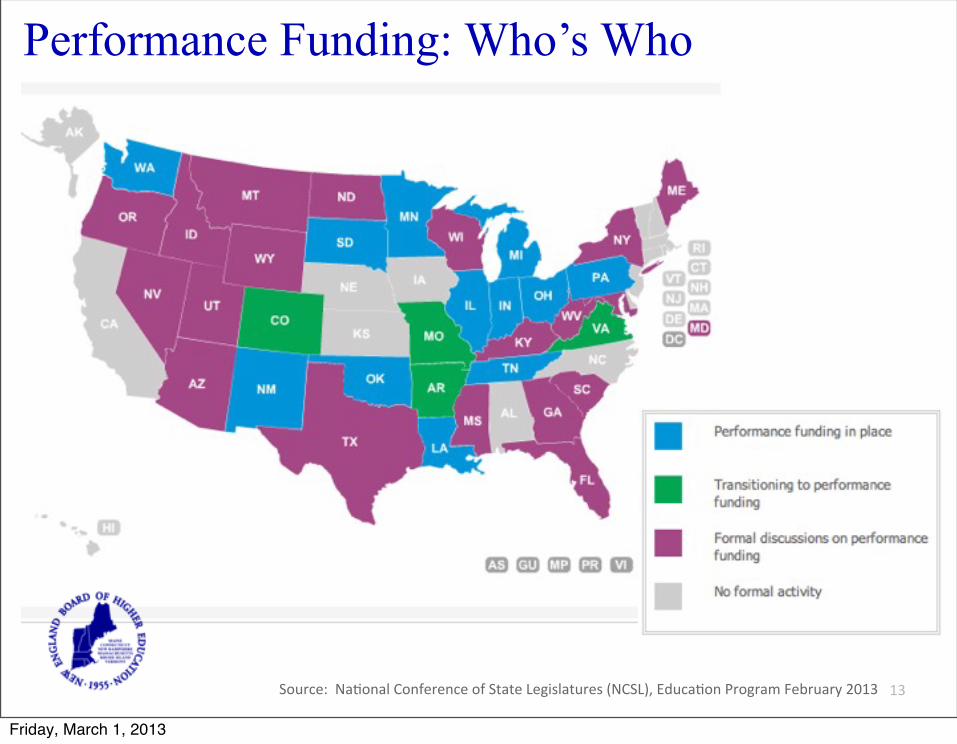
Performance Funding: Who’s Who
13Source: Na8onal Conference of State Legislatures (NCSL), Educa8on Program February 2013
Friday, March 1, 2013
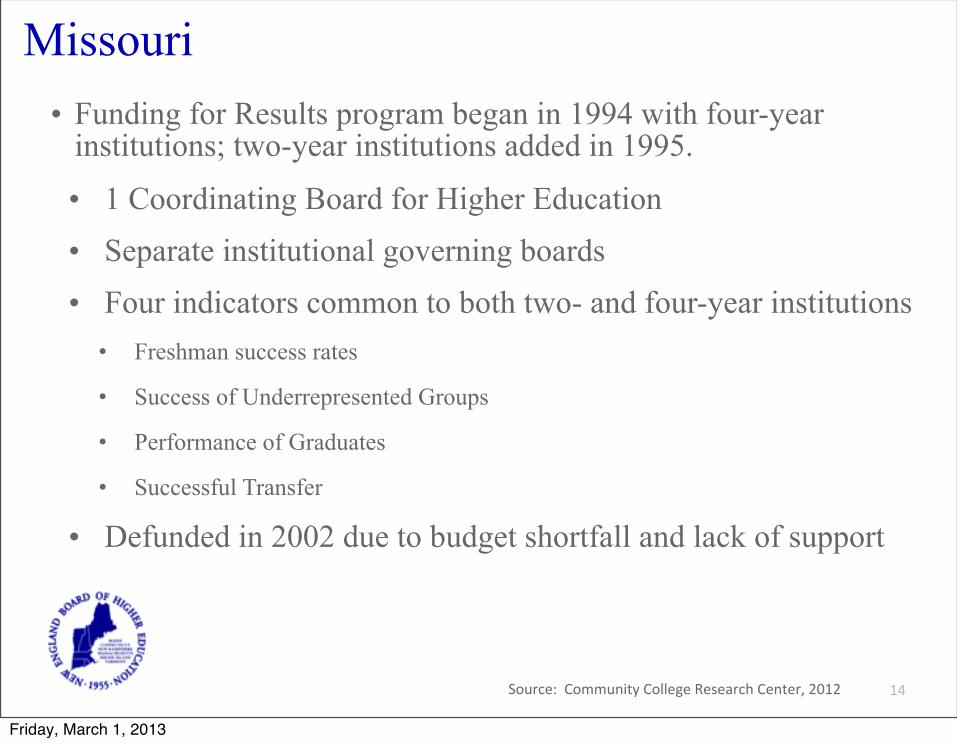
Missouri
14
• Funding for Results program began in 1994 with four-year institutions; two-year institutions added in 1995.
• 1 Coordinating Board for Higher Education
• Separate institutional governing boards
• Four indicators common to both two- and four-year institutions• Freshman success rates
• Success of Underrepresented Groups
• Performance of Graduates
• Successful Transfer
• Defunded in 2002 due to budget shortfall and lack of support
Source: Community College Research Center, 2012
Friday, March 1, 2013
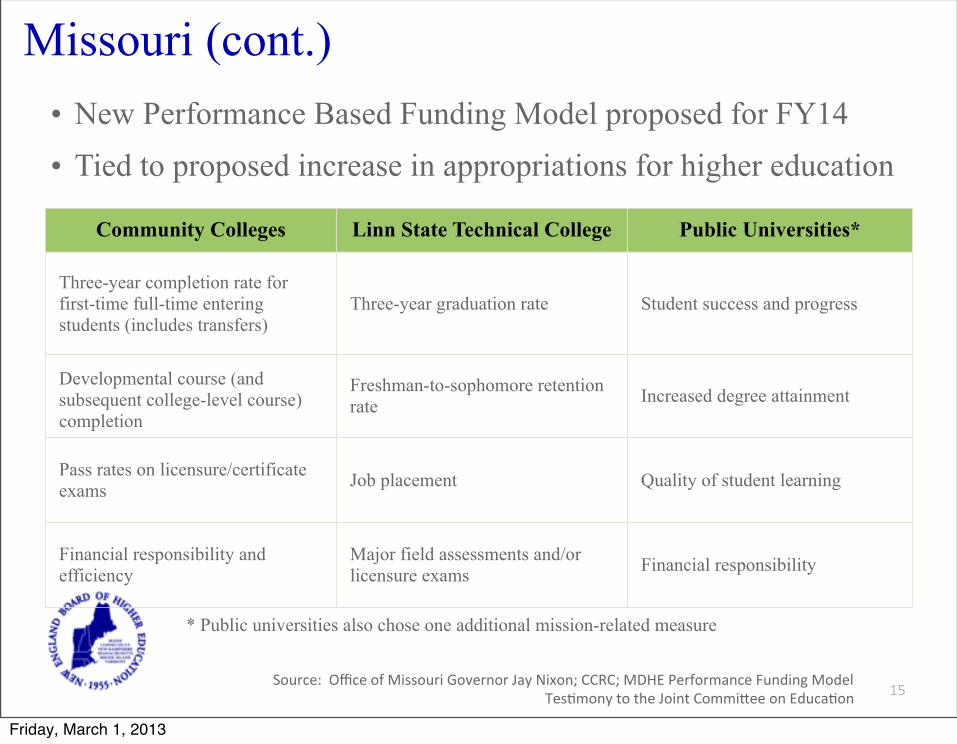
Missouri (cont.)
15
• New Performance Based Funding Model proposed for FY14
• Tied to proposed increase in appropriations for higher education
Community Colleges Linn State Technical College Public Universities*
Three-year completion rate for first-time full-time entering students (includes transfers)
Three-year graduation rate Student success and progress
Developmental course (and subsequent college-level course) completion
Freshman-to-sophomore retention rate Increased degree attainment
Pass rates on licensure/certificate exams Job placement Quality of student learning
Financial responsibility and efficiency
Major field assessments and/or licensure exams Financial responsibility
* Public universities also chose one additional mission-related measure
Source: Office of Missouri Governor Jay Nixon; CCRC; MDHE Performance Funding Model Tes8mony to the Joint Commi^ee on Educa8on
Friday, March 1, 2013
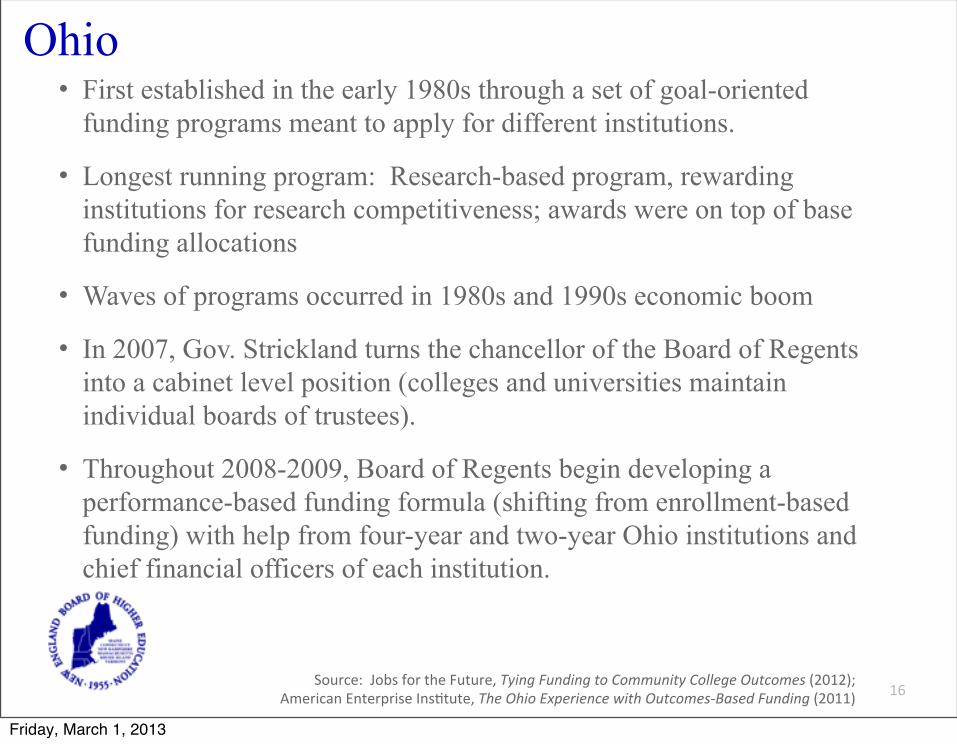
Ohio
16
• First established in the early 1980s through a set of goal-oriented funding programs meant to apply for different institutions.
• Longest running program: Research-based program, rewarding institutions for research competitiveness; awards were on top of base funding allocations
• Waves of programs occurred in 1980s and 1990s economic boom
• In 2007, Gov. Strickland turns the chancellor of the Board of Regents into a cabinet level position (colleges and universities maintain individual boards of trustees).
• Throughout 2008-2009, Board of Regents begin developing a performance-based funding formula (shifting from enrollment-based funding) with help from four-year and two-year Ohio institutions and chief financial officers of each institution.
Source: Jobs for the Future, Tying Funding to Community College Outcomes (2012); American Enterprise Ins8tute, The Ohio Experience with Outcomes-‐Based Funding (2011)
Friday, March 1, 2013
Ohio (cont.)
17
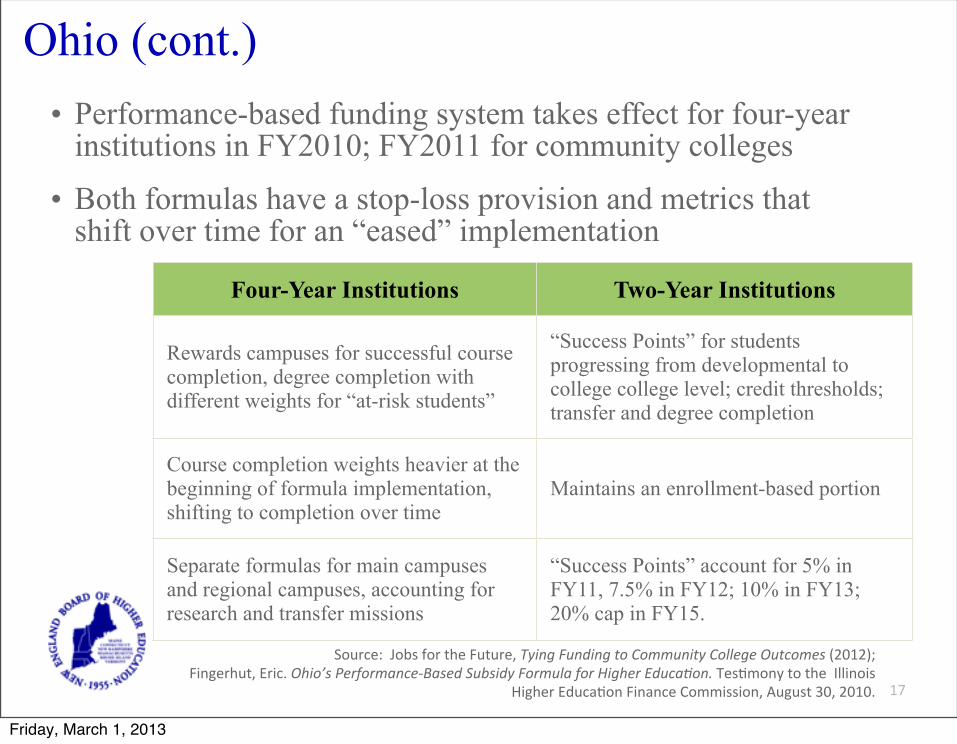
• Performance-based funding system takes effect for four-year institutions in FY2010; FY2011 for community colleges
• Both formulas have a stop-loss provision and metrics that shift over time for an “eased” implementation
Four-Year Institutions Two-Year Institutions
Rewards campuses for successful course completion, degree completion with different weights for “at-risk students”
“Success Points” for students progressing from developmental to college college level; credit thresholds; transfer and degree completion
Course completion weights heavier at the beginning of formula implementation, shifting to completion over time
Maintains an enrollment-based portion
Separate formulas for main campuses and regional campuses, accounting for research and transfer missions
“Success Points” account for 5% in FY11, 7.5% in FY12; 10% in FY13; 20% cap in FY15.
Source: Jobs for the Future, Tying Funding to Community College Outcomes (2012); Fingerhut, Eric. Ohio’s Performance-‐Based Subsidy Formula for Higher EducaBon. Tes8mony to the Illinois
Higher Educa8on Finance Commission, August 30, 2010.
Friday, March 1, 2013
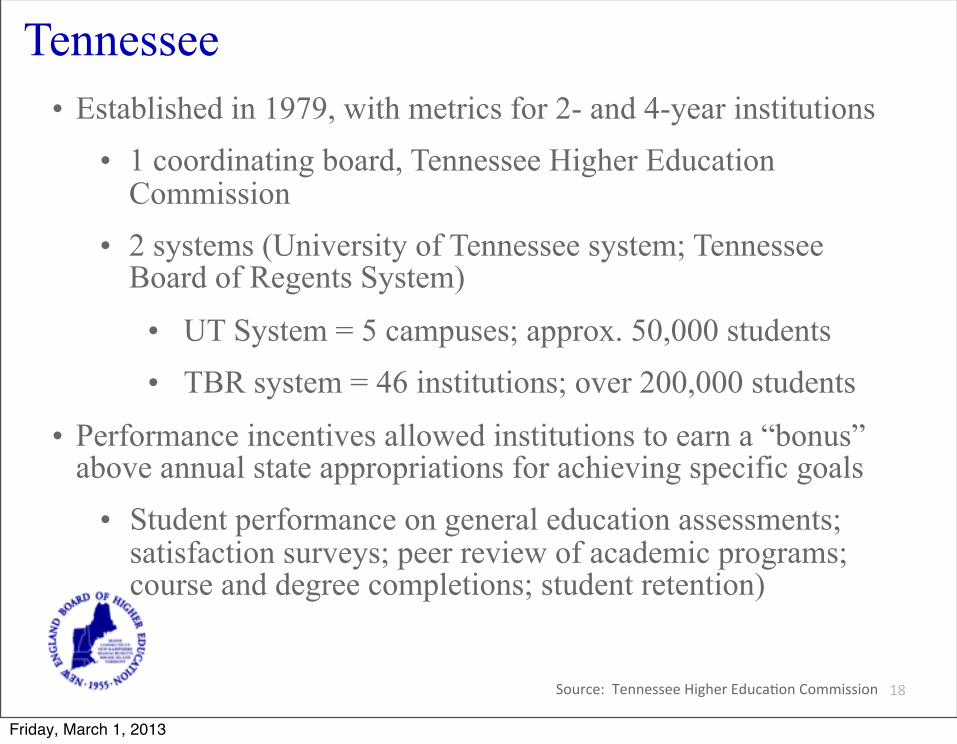
Tennessee
18
• Established in 1979, with metrics for 2- and 4-year institutions
• 1 coordinating board, Tennessee Higher Education Commission
• 2 systems (University of Tennessee system; Tennessee Board of Regents System)
• UT System = 5 campuses; approx. 50,000 students
• TBR system = 46 institutions; over 200,000 students
• Performance incentives allowed institutions to earn a “bonus” above annual state appropriations for achieving specific goals
• Student performance on general education assessments; satisfaction surveys; peer review of academic programs; course and degree completions; student retention)
Source: Tennessee Higher Educa8on Commission
Friday, March 1, 2013
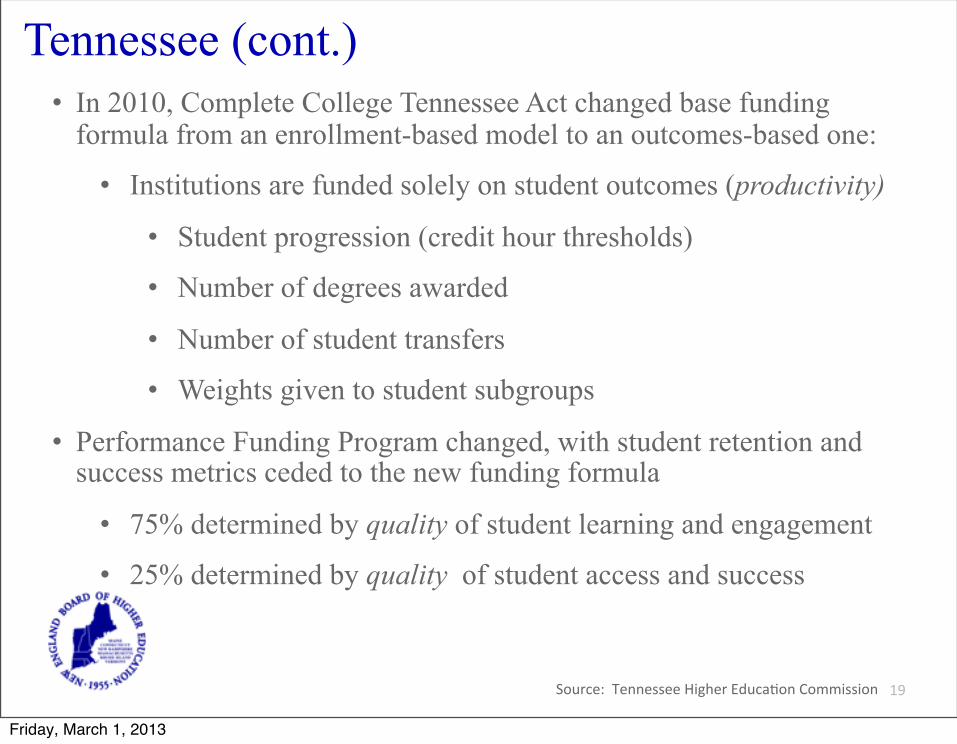
Tennessee (cont.)
19
• In 2010, Complete College Tennessee Act changed base funding formula from an enrollment-based model to an outcomes-based one:
• Institutions are funded solely on student outcomes (productivity)
• Student progression (credit hour thresholds)
• Number of degrees awarded
• Number of student transfers
• Weights given to student subgroups
• Performance Funding Program changed, with student retention and success metrics ceded to the new funding formula
• 75% determined by quality of student learning and engagement
• 25% determined by quality of student access and success
Source: Tennessee Higher Educa8on Commission
Friday, March 1, 2013

Three-State Summary
20Source: Adapted from SREB’s Outcomes-‐Based Funding Policy Brief and CCRC’s Working Paper No. 37
Missouri Ohio Tennessee
Who initiated formula development?
Coordinating Board for Higher Education; Governor’s office
Ohio Board of Regents, with input from institutions
Complete College Tennessee Act mandated an updated base funding formula
Separate formulas by institution type? Yes Yes
Yes; also, unique weights for metrics by institution
Are the outcomes tied for base or bonus funding?
Originally bonus; new program proposed for FY14
Base Base & Bonus
Additional items to consider:
Rolling averages; “Sustained Excellence” benchmark
Stop-loss provision; shifting metrics over time
Credit hour thresholds; “quality” metrics
Friday, March 1, 2013

Areas of Consideration
21Source: Adapted from SREB’s Outcomes-‐Based Funding Policy Brief and CCRC’s Working Paper No. 37
• Current revenue sources for institutions that might fall under purview of PBF formula
• Current budgets, allocations, and funding formulas
• Data system and reporting capacity across institutions and system
• Institutional missions
• Long- & short-term goals of higher education funding formulas
Friday, March 1, 2013
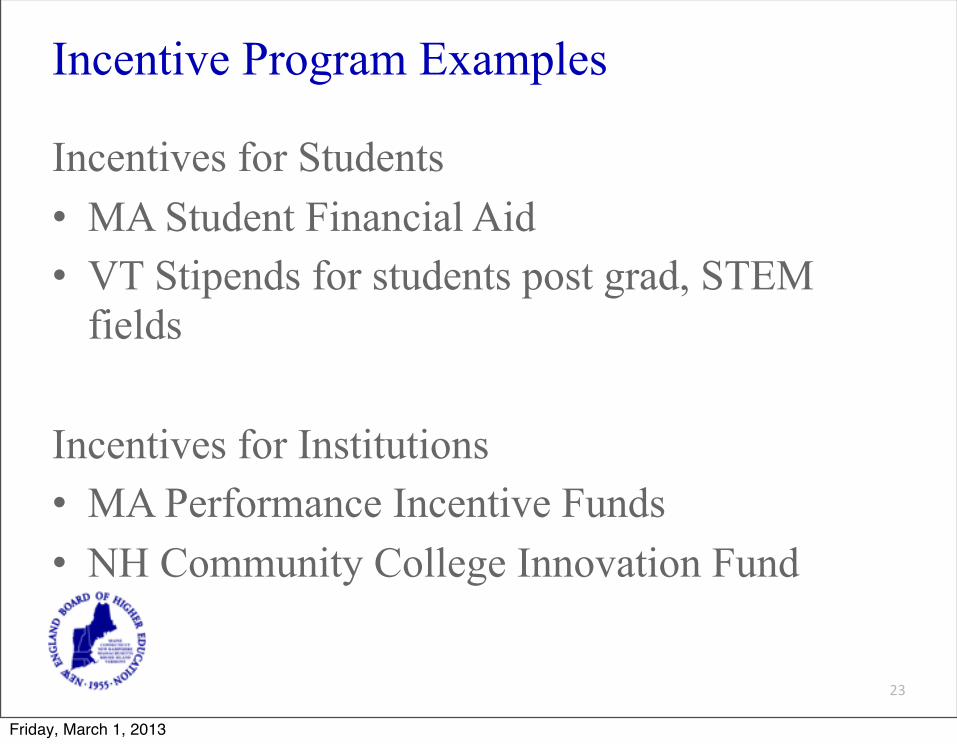
Incentive Program Examples
Incentives for Students• MA Student Financial Aid• VT Stipends for students post grad, STEM
fields
Incentives for Institutions• MA Performance Incentive Funds• NH Community College Innovation Fund
23
Friday, March 1, 2013
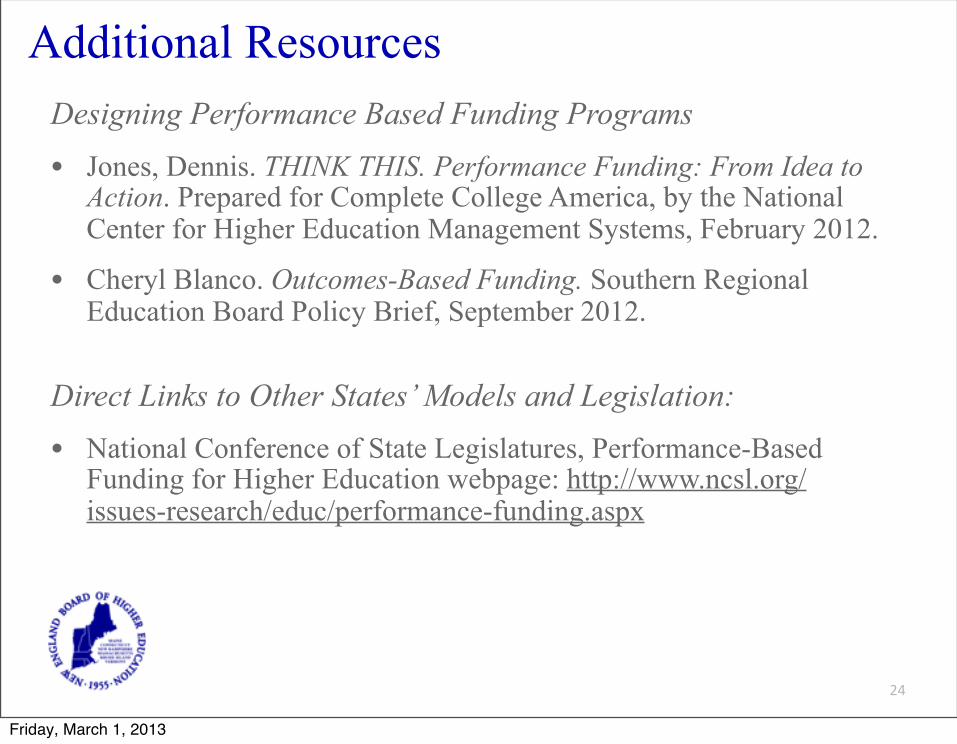
Additional Resources
24
Designing Performance Based Funding Programs
• Jones, Dennis. THINK THIS. Performance Funding: From Idea to Action. Prepared for Complete College America, by the National Center for Higher Education Management Systems, February 2012.
• Cheryl Blanco. Outcomes-Based Funding. Southern Regional Education Board Policy Brief, September 2012.
Direct Links to Other States’ Models and Legislation:
• National Conference of State Legislatures, Performance-Based Funding for Higher Education webpage: http://www.ncsl.org/issues-research/educ/performance-funding.aspx
Friday, March 1, 2013

Additional Resources
25
Performance Based Funding History
• National Center for Higher Education Management Systems (NCHEMS)
• Jones, Dennis and Martha Snyder. (May 12, 2012) Performance Funding and Strategic Finance for Higher Education. Presentation at the NGA Center for Best Practices Postsecondary Policy Academy, Denver, CO.
• Community College Research Center (CCRC)• Dougherty, K. J. & Reddy, V. (2011) The Impacts of State Performance
Funding Systems on higher Education Institutions: Research Literature Review and Policy Recommendations. (CCRC Working Paper No. 37). New York, NY: Columbia University, Teachers College, Community College Research Center.
• Dougherty, K.J., Natow, R. S., & Vega, B.E. (2012). Popular but unstable: Explaining why state performance funding systems in the United States often do not persist. Teachers College Record, 114(3).
Friday, March 1, 2013

Cost and Spending, FY10
26Source: NEBHE analysis of Delta Cost Project data, avail. from the U.S. Dept of Educa8on
State Four-Year Private Institutions
Four-Year Private Institutions
Four-Year Public Institutions
Four-Year Public Institutions Two-Year Public Two-Year Public
E&R Per FTE
E&R Per Completion
E&R Per FTE
E&R Per Completion
E&R Per FTE
E&R Per Completion
CT $33,526 $115,425 $16,617 $66,775 $12,389 $72,040ME $25,942 $106,649 $18,967 $87,695 $11,046 $47,272MA $28,098 $96,559 $14,699 $63,085 $10,348 $53,323NH $24,057 $95,666 $13,538 $52,048 $12,007 $46,423RI $24,457 $86,382 $12,364 $56,826 $8,870 $64,485VT $24,988 $86,552 $18,227 $75,079 NA NA
New England $23,295 $91,710 $13,649 $59,494 $19,816 $42,472
Note: E&R (education and related) spending is the amount of money spent by institutions on costs related to directly to instruction. Research expenditures are not included, although a pro-rated share of an institution’s academic services and physical plant is included.
Since FY2005, education and related (E&R) spending per FTE and per completion have gone up. On average across the region and across institution types, spending per completion has risen more quickly than spending per FTE in actual dollar amounts during this time.
Friday, March 1, 2013

State Support of Higher Education
27
• State appropriations are typically higher than national averages, and the highest in the region.
• Since FY11, state appropriations have declined, in CT and across the region.
• FY13 state fiscal support for higher education dropped 11% in CT since FY11
State FY11 State Appropriations per FTE
CT $8,176 US $6,290 ME $6,155 MA $5,599 RI $4,674 NH $2,646 VT $2,599
Source: SHEEO SHEF Report, 2011; Grapevine Survey, FY2012-‐13
Friday, March 1, 2013
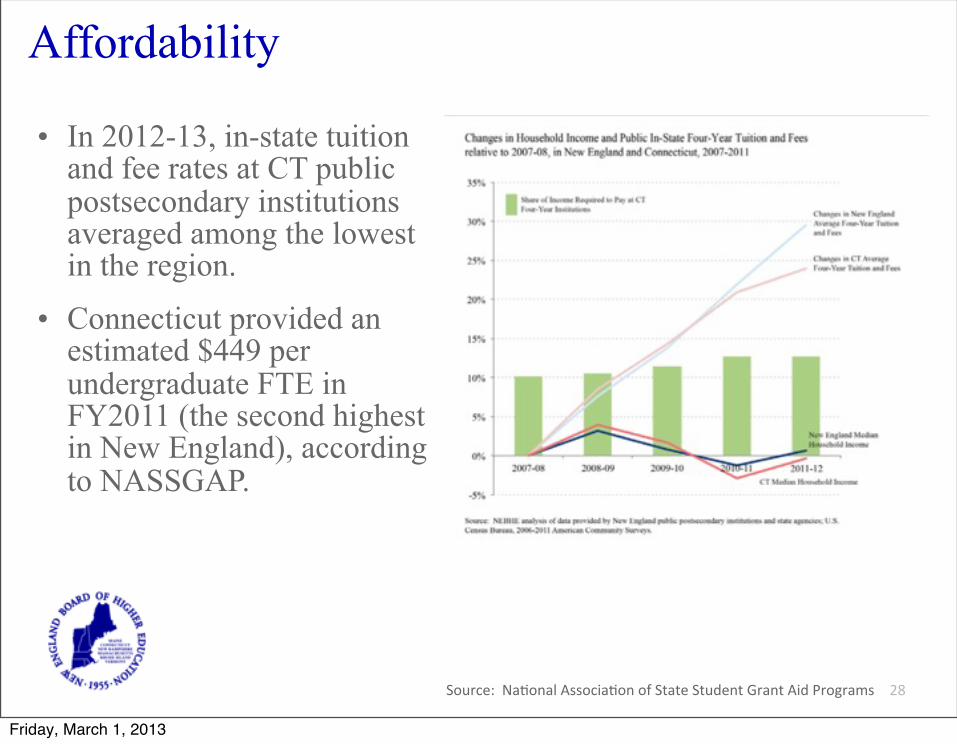
Affordability
28
• In 2012-13, in-state tuition and fee rates at CT public postsecondary institutions averaged among the lowest in the region.
• Connecticut provided an estimated $449 per undergraduate FTE in FY2011 (the second highest in New England), according to NASSGAP.
Source: Na8onal Associa8on of State Student Grant Aid Programs
Friday, March 1, 2013