Embed Size (px)
Citation preview
MEASURING AND IMPROVING THE QUALITY OF HOUSEHOLD
GROCERY FOOD PURCHASES
by
Philip James Brewster
A thesis submitted to the faculty of The University of Utah
in partial fulfillment of the requirements for the degree of
Master of Science
Department of Biomedical Informatics
The University of Utah
May 2017

Copyright © Philip James Brewster 2017
All Rights Reserved

T h e U n i v e r s i t y o f U t a h G r a d u a t e S c h o o l
STATEMENT OF THESIS APPROVAL
The thesis of Philip James Brewster
has been approved by the following supervisory committee members:
John F. Hurdle , Chair 3-8-2017
Date Approved
Patricia M. Guenther , Member 3-14-2017
Date Approved
Kristine C. Jordan , Member 3-8-2017
Date Approved
and by Wendy W. Chapman , Chair/Dean of
the Department/College/School of Biomedical Informatics
and by David B. Kieda, Dean of The Graduate School.
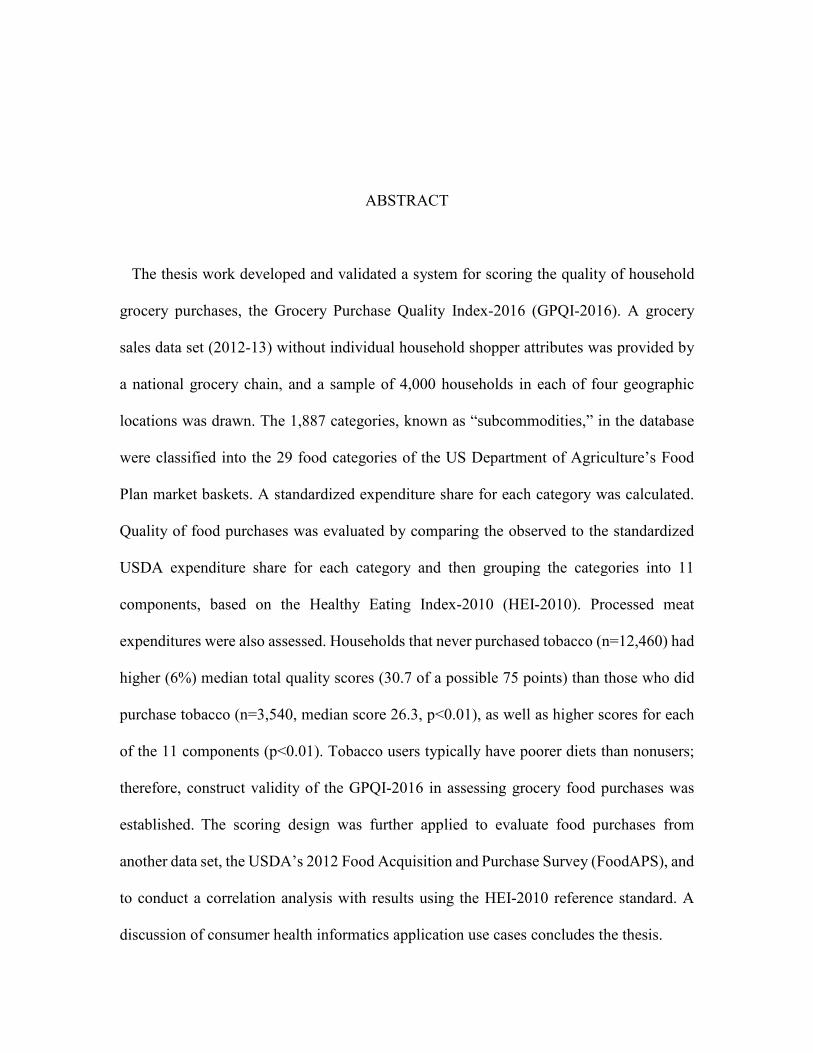
ABSTRACT
The thesis work developed and validated a system for scoring the quality of household
grocery purchases, the Grocery Purchase Quality Index-2016 (GPQI-2016). A grocery
sales data set (2012-13) without individual household shopper attributes was provided by
a national grocery chain, and a sample of 4,000 households in each of four geographic
locations was drawn. The 1,887 categories, known as “subcommodities,” in the database
were classified into the 29 food categories of the US Department of Agriculture’s Food
Plan market baskets. A standardized expenditure share for each category was calculated.
Quality of food purchases was evaluated by comparing the observed to the standardized
USDA expenditure share for each category and then grouping the categories into 11
components, based on the Healthy Eating Index-2010 (HEI-2010). Processed meat
expenditures were also assessed. Households that never purchased tobacco (n=12,460) had
higher (6%) median total quality scores (30.7 of a possible 75 points) than those who did
purchase tobacco (n=3,540, median score 26.3, p<0.01), as well as higher scores for each
of the 11 components (p<0.01). Tobacco users typically have poorer diets than nonusers;
therefore, construct validity of the GPQI-2016 in assessing grocery food purchases was
established. The scoring design was further applied to evaluate food purchases from
another data set, the USDA’s 2012 Food Acquisition and Purchase Survey (FoodAPS), and
to conduct a correlation analysis with results using the HEI-2010 reference standard. A
discussion of consumer health informatics application use cases concludes the thesis.

Dedicated to my parents, Bob and Nancy, and to friends everywhere.
TABLE OF CONTENTS
ABSTRACT ....................................................................................................................... iii
LIST OF TABLES ............................................................................................................ vii
LIST OF FIGURES ......................................................................................................... viii
ACKNOWLEDGEMENTS ............................................................................................... ix
Chapters
1. INTRODUCTION .........................................................................................................1
1.1 Public Health Implications .................................................................................2 1.2 Motivation and Aims .........................................................................................3
2. BACKGROUND ...........................................................................................................6
2.1 Approaches and Challenges in Grocery Purchase Quality Assessment ............6 2.2 The USDA Food Plan Model .............................................................................7 2.3 Previous Approaches .........................................................................................8
3 METHODS ...................................................................................................................10
3.1 USDA Food Plans’ Model Market Basket.......................................................10 3.2 The Food Plan Dietary Patterns Meet or Exceed the HEI-2010 Standards .....11 3.3 Components of the Grocery Purchase Quality Index-2016 .............................12 3.4 Scoring Design of the Grocery Purchase Quality Index-2016.........................14 3.5 The Grocery Transaction Data Set…………………………………………...15 3.5.1 Household Sample Selection .................................................................15 3.5.2 The Grocery Food Item Mapping Process ............................................16 3.6 Validity Testing ...............................................................................................17
4. RESULTS AND DISCUSSION ..................................................................................24
4.1 Results ..............................................................................................................24
4.2 Discussion ........................................................................................................25 4.2.1 Strengths and Limitations ......................................................................26 4.3 Conclusion .......................................................................................................28
5. FURTHER VALIDATION STUDIES ........................................................................33
5.1 The 2012 USDA-ERS FoodAPS .....................................................................33 5.2 Food Plan Category Mapping ..........................................................................35 5.3 Characteristics of the Analytic Data Set ..........................................................36 5.4 Correlation Analysis ........................................................................................38 5.5 Class Variable Analysis ...................................................................................40
6. FUTURE DIRECTIONS .............................................................................................61
6.1 Alternative Directions in Decision Theory ......................................................61 6.2 A Behavioral Theory Application Framework; Recommender Systems ........64
REFERENCES ..................................................................................................................68
vi
LIST OF TABLES
3.1. The 4 Food Plan dietary patterns meet or exceed the HEI-2010 standards ..............19
3.2 USDA Food Plan food categories .............................................................................20
3.3 Household inclusion and exclusion criteria ..............................................................23
4.1 Median Grocery Purchase Quality Index-2016 scores (n=16,000)…………….. ....31
4.2 Median Grocery Purchase Quality Index-2016 scores by tobacco group……….....32
5.1 Complete USDA-ERS food group to USDA Food Plan food category map…… ...42
5.2 FoodAPS household inclusion and exclusion criteria ………………………….. ...46
5.3 USDA Food Plan food categories that comprise the components of the Grocery Purchase Quality Index-2016 ....................................................................................47 5.4 FoodAPS weighted mean GPQI-2016 scores using expenditure shares ..................50
5.5 FoodAPS weighted mean GPQI-2016 scores using food amounts per week ...........51
5.6 Correlation of GPQI-2016 scores using expenditure shares with HEI-2010 ............52
5.7 Correlation of GPQI-2016 scores using food amounts per week with HEI-2010.. .53
5.8 Correlation of GPQI-2016 scores………………………………………………... ..54
5.9 Total HEI-2010 scores in relation to characteristics of interest ................................55
5.10 Total GPQI-2016 scores using expenditure shares, in relation to characteristics of interest………………………………………………………………………….. .....57
5.11 Total GPQI-2016 scores using food amounts per week, in relation to characteristics
of interest………………………………………………………………………... ...59
LIST OF FIGURES
1.1. Conceptual model of the food environment................................................................5
4.1 Median grocery expenditures for eight categories of foods to increase ………….. 29
4.2 Median grocery expenditures for three categories of foods to decrease ………... ...30
ACKNOWLEDGEMENTS
First of all, I would like to express my deep gratitude to my mentor in Biomedical
Informatics, Dr. John Hurdle, who has been an encouraging presence and has supported
this work enthusiastically from the beginning. The counsel and questions of Dr. Patricia
Guenther have sharpened the focus of this thesis in countless ways. Dr. Kris Jordan has
been a pleasure to work with and has always been willing to help me address just the right
questions of interest in the field of nutrition.
This work was funded in part by a University of Utah Vice President for Research
Innovation Seed Grant, a National Institutes of Health (NLM) Training Grant (T15-
LM007124), a research grant from the Western Regional Nutrition Education and Obesity
Prevention Center of Excellence (USDA-NIFA-OP-004574), and a research grant from the
USDA National Institute of Food and Agriculture (2015-09151). Special thanks to Jennifer
North for expert assistance with mapping retail grocery foods to the USDA Food Plan food
categories; to Valliammai Chidambaram for creating and maintaining the databases and
for assisting with the graphics used in the figures for Chapter 4; and to Dr. Le-Thuy Tran
for technical support.
Dr. Kristina Brinkerhoff helped launch this direction of study in the Biomedical
Informatics department in 2007 and deserves special mention here.
An extra-special thanks to all the administrative staff, graduate students, and faculty at
the Department who have given me encouragement over the years.
CHAPTER 1
INTRODUCTION
The act of buying food at a grocery store and the underlying set of decisions that may
reflect or otherwise impact a consumer’s dietary quality belong to an unobserved set of
‘observations of daily living’ [1] that exist outside the usual purview of health research in
the clinical setting. The contextual background constituted by such everyday activities
among a freestanding population of grocery shoppers is emphasized at the conceptual level
throughout this study.
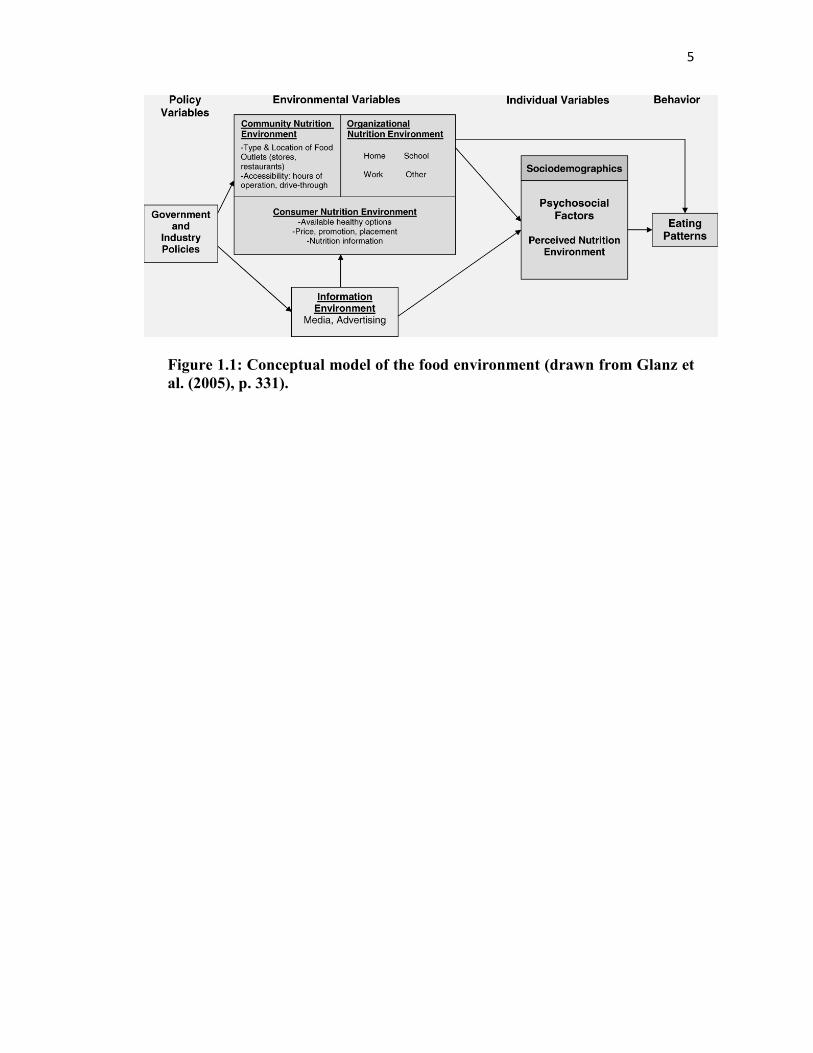
The scope and complexity of the food environment are illustrated in a conceptual model
(Figure 1.1) [2], with the relationship between the consumer nutrition environment and
consumer behavior (household food purchases) being of particular importance in this
study, and the retail grocery item set representing price constraints and the availability of
healthy options. Given the unit of analysis will be at the household level, this relationship
is further mediated by the community nutrition environment, such as the accessibility of
grocery store outlets, and by the organizational nutrition environment (the home) in the
model, although these aspects will be presupposed rather than explicated or analyzed
systematically in any detail within the current scope of work. Overall, the conceptual model
clearly shows that there are many intersecting dimensions in the process of translating
policy into behavioral change that may either facilitate or impede the success of that
2
process and its goal of promoting healthier decisions about diet.
1.1 Public Health Implications
A 'toxic’ (obesogenic) food environment [13 14] and habitual patterns of poor dietary
choices have been identified as significant factors that have increased the American
population’s susceptibility for obesity since the mid-1980s. In contrast to genetically
determined causes, factors such as diet and exercise may be more amenable to
improvement through behavioral or lifestyle changes, which can often be facilitated and
maintained through targeted interventions, guidance, and recommendations [15]. Some
evidence suggests that as little as a 10% reduction in total body mass can mitigate an
individual’s degree of risk for chronic disease due to obesity [16 17].
As the risks associated with obesity become more urgently communicated by public
health agencies, many physicians are motivated to discuss preventive measures more
frequently and more openly in the clinical setting [20-25]. A number of studies, however,
have pointed to a certain reticence or hesitancy among clinicians to recommend a program
of dietary or lifestyle changes to their overweight or obese patients in the absence of
identifiable symptoms for a specific chronic disease condition, such as diabetes [23 26 27].
As recently as in a 2005 survey [28], fewer than 50% of the responding clinicians said they
had broached the topic of a lifestyle change or other preventive measures with patients who
were clinically obese (with Body Mass Index [BMI] > 30 kg/m2), but who otherwise
appeared healthy at the time of the office visit.
3
1.2 Motivation and Aims
In the context of an obesity epidemic and the uneven implementation of clinical
guidelines in response to it, the need for consumer-oriented information and education to
help bridge the gap between evidence-based dietary standards and actual dietary behaviors
emerges all the more clearly as a means of assisting in the prevention of obesity and
reducing the incidence of nutrition-related chronic diseases in the population [3]. It is likely
that a significant proportion of the population in need of dietary change remains in a
‘precontemplative stage,’ as the transtheoretical model of behavioral change would
categorize it [46], and either that population does not seek out information on diet or is
being passively provided inaccurate information through food marketing and
advertisements.
This perspective means that the public health effort of publishing more and better dietary
guidance is necessary to establish norms and measures for a healthy diet, yet still
insufficient to induce dietary change. The gap between the guidance and dietary behavior
is therefore a categorical one (e.g., between the normative and the descriptive) and may be
expected to persist until and unless the guidance can be translated back into more familiar
contexts of dietary decision-making behavior, such as which foods a shopper chooses to
buy at the grocery store.
Dietary quality indexes encapsulate nutritional and dietary knowledge in a single value
on an ordinal scale, which may function as a score to measure and rate the compliance of
an observed behavioral pattern with a set of dietary guidelines [4-7]. Dietary patterns can
be analyzed in this way to determine, for example, whether the distribution of food groups
purchased by a household is well balanced and includes adequate proportions of
4
components for overall dietary quality, such as fruits, whole grains, and vegetables [8-13].
This thesis explores the hypothesis that a longitudinal record of household grocery
purchases can indicate the quality of the household food environment in relation to a set of
dietary guidelines. The primary aim of the following chapters is to develop and validate a
grocery food purchase quality index to measure this dimension of consumer health at the
household level.
5
Figure 1.1: Conceptual model of the food environment (drawn from Glanz et
al. (2005), p. 331).
CHAPTER 2
BACKGROUND
2.1. Approaches and Challenges in Grocery Purchase Quality Assessment
Assessment of the quality of grocery sales data has been limited in previous research
[14], primarily due to a lack of direct collaborations with retailers or chains who would
automatically collect and provide the data over time and make sales transactions available
for secondary analysis. Researchers have had to rely instead on the collection of food
purchase data from smaller samples of individual consumers, either in the form of paper
sales receipts [15-21] or by providing households with hand-scanning units to read the
electronic barcodes of purchases, along with scales to record the weights of nonpackaged
foods, in the home [22, 23]. Several studies have also analyzed summary grocery sales
data, such as those collected electronically on a regular basis by proprietary third-party
marketing research aggregators, such as the Nielsen Company and Information Resources
Inc. (IRI), to gain insight into household food purchasing histories [24-27]. Additionally,
a number of researchers have collaborated with grocery retailers to stage interventions at
the point of purchase [28-30], primarily aiming to demonstrate the effectiveness of
information and cues that promote healthier eating habits while households are shopping
and making their purchasing decisions about which foods to buy.
7
2.2. The USDA Food Plan Model
The present study uses the US Department of Agriculture’s (USDA) Food Plans as the
basis for assessing the quality of household grocery purchases, a proxy for the home food
environment. The USDA Center for Nutrition Policy and Promotion (USDA-CNPP)
periodically releases four Food Plans, each of which represents a model market basket of
foods, optimized to meet dietary standards [31, 32]. Each Food Plan corresponds to a
different quartile of the estimated total expenditures for foods at home nationally. The most
recent Food Plans, published in 2007, follow the recommendations found in the 2005
Dietary Guidelines for Americans [33], the USDA Food Patterns [34], and the Dietary
Reference Intakes [35], for promoting a healthy diet in the general population [31]. By
design, the Food Plans do not account for that portion of the household budget spent on
foods away from home. The Plans are intended to vary solely by the cost of food at home,
not by energy level or by nutritional quality, such that a nutritious and healthful diet can be
achieved by following any of the four Plans, whether it be the Thrifty and the Low-Cost
Food Plans in the lower two quartiles or the Moderate-Cost and Liberal Food Plans in the
upper two quartiles of total food at home expenditures.
Historically, a goal of the Food Plans has been to inform consumer household decision
making on how best to achieve a family’s nutritional needs within certain budget
constraints [36]. USDA researchers have demonstrated that healthy diets need not be
expensive and have thereby sought to address concerns about the affordability and
availability of healthy foods in the marketplace [32, 37, 38]. Several studies have affirmed
that all four USDA Food Plans contain illustrative market baskets that can provide
nutritionally adequate, healthful meals at different cost levels [31, 39-41].
8
2.3. Previous Approaches
To date, few studies have explored in detail the possibility of using USDA’s Food Plan
market baskets as models for defining food-category-specific target values for the optimal
distribution of food-at-home expenditures. The Food Plans’ market baskets could serve as
an indicator of how closely household spending patterns follow, or fail to follow, the Food
Plans and thereby be used to evaluate the healthfulness of the underlying household food
environment. Two key studies from the USDA Economic Research Service (USDA-ERS)
have taken such an approach. Stewart and Blisard (2006) focused on the Thrifty Food Plan
(TFP) and assessed the likelihood of compliance with the TFP in spending on specific food
categories by simulating average food expenditures in the lowest quartile of total food
expenditures across a wide array of household demographic characteristics. The authors of
that study used the TFP’s cost of food as a benchmark for whether a low-income household
is allocating its food budget such that the nutritional quality of the household’s diet is
optimized. Volpe et al. (2013) analyzed national retail data from the Nielsen Homescan
panel and proposed generalizable methods for scoring the overall healthfulness of a
consumer household market basket, based on its proximity to the expenditure shares per
food category in the USDA’s market baskets for the Liberal Food Plan. They chose the
Liberal Plan because their sample had a higher median household income than the national
average.
Building on these approaches, the purpose of the research presented here was to develop
and validate the food-based Grocery Purchase Quality Index-2016 (GPQI-2016), a tool that
can be used to assess the quality of the household food environment using the USDA Food
Plan market basket model, unobtrusively and at scale. Given similar grocery data sets, the

9
proposed index could be applied, using units of analysis other than the household, to
explore and assess quality at the level of the store, the neighborhood, and the regional food
environment.
CHAPTER 3
METHODS
3.1 The USDA Food Plan Model Market Basket
Each USDA Food Plan’s model market basket includes amounts (i.e., pounds per week)
of food to be purchased for each of 15 age-gender groups to meet their varying nutritional
needs. These amounts are derived using a mathematical model that balances and optimizes
both food cost and food quality criteria within a given quartile of total food-at-home
expenditures. Tables of age-gender weighted food expenditure shares for each of the 29
food categories in the market baskets are also provided in USDA’s documentation and
were used to create the standardized expenditure shares used in the present study.
Household-level market baskets may be estimated by averaging across the age-gender
groups within any given Food Plan, using nationally representative statistical weights [39].
For this study, a composite market basket was obtained from the four Food Plans by
weighting the average food category expenditure shares for each age-gender group using
2012 US Census information on the distribution of these same 15 age-gender groups in the
U.S. population [42], and then averaging the four weighted expenditure shares per food
category into a single standardized expenditure share to form a composite Food Plan
market basket.
The GPQI-2016 is modeled after the food-based components of the Healthy Eating
11
Index-2010 (HEI-2010) [43, 44]. Although the 2015-2020 Dietary Guidelines have been
published [45], an HEI-2015 had not been released by the time this work was completed.
The HEI-2010 contains nine adequacy components, where the recommendations found in
the Dietary Guidelines for Americans (DGA) stresses foods to increase in one’s diet, and
three moderation components, where the DGA stresses foods to decrease.
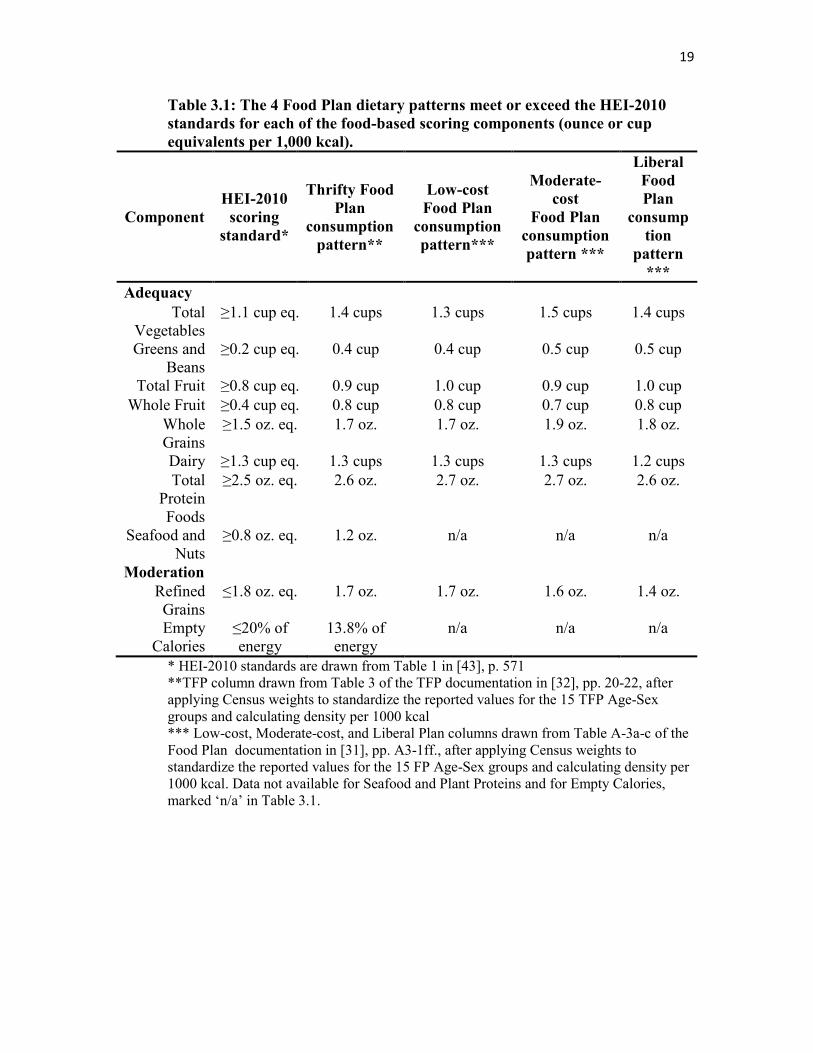
3.2 The Food Plan Dietary Patterns Meet or Exceed the HEI-2010 Standards
The underlying relationship between the USDA Food Plan market basket model and the
HEI-2010 is presented in Table 3.1. It illustrates how the dietary patterns for each of the
four Food Plans [34, 46], after being standardized across all 15 age-gender groups using
2012 Census population data, meet or exceed the standards used for scoring the respective
food-based components of the HEI-2010. The USDA documents the Food Plan patterns
for each food-based component using the Food Pattern (formerly MyPyramid) system of
cup and ounce equivalents for specific total calorie levels. After the age-gender group
standardization step, the values for each component were recalculated and are listed here
in terms of their density measures per 1,000 kilocalories of energy, for the sake of the
comparison.
Overall, the four Food Plans demonstrate a similar degree of compliance with the DGA
as that expressed by the HEI-2010 standards. The one exception in this estimate was the
Dairy component from the Liberal plan, which fell slightly below the HEI-2010 standard.
Documentation for three of the four plans does not include as much detail for the individual
components as the Thrifty Food Plan (TFP) documentation does. Therefore, the density
values for Seafood and Plant Proteins and for Empty Calories could only be computed for
12
comparison with the HEI-2010 values using the TFP (see Appendix 3: Food Plan
Consumption Patterns in USDA MyPyramid Amounts of Foods, in [31]).
The TFP documentation notes the TFP consumption patterns may exceed the USDA
Food Pattern recommendations, due to a 5% waste factor that is included in modeling
purchased foods for this Food Plan [32]. Data for the three other plans were also converted
from ‘as-purchased’ to ‘as-consumed’ form, using waste factors of 10% (Low-cost), 20%
(Moderate-cost), and 30% (Liberal), respectively [31]. The TFP documentation further
states that the proportion of whole fruit, in particular, is greater than the recommended 50%
of total fruit in most age-sex groups, due to the Food Plan modeling algorithm’s emphasis
on finding good sources of fiber [32].
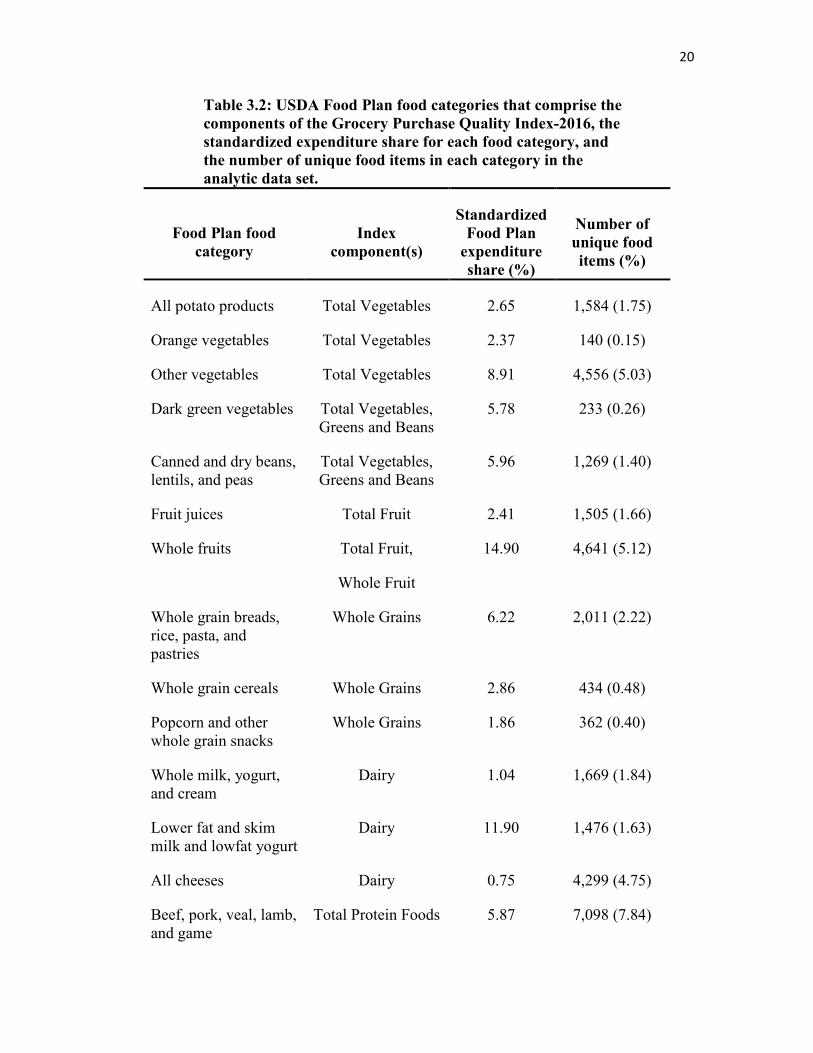
3.3 Components of the Grocery Purchase Quality Index-2016
The 29 food categories used for the USDA Food Plan market baskets align well with the
HEI-2010 components that assess foods. As we have just seen (Table 3.1), both are derived
from the food groups in the USDA Food Pattern (formerly MyPyramid) guidance system
[34]. Table 3.2 shows how these categories relate to each other in the scoring design. As
with the HEI, several of the categories are counted towards more than one component of
the GPQI-2016. For example, Whole Fruits contribute to Total Fruits, while Greens and
Beans also count towards Total Vegetables. In the GPQI-2016, ratios between observed
and expected expenditure shares signify the degree of adherence to the Dietary Guidelines.
The GPQI-2016 includes a moderation component for Processed Meats, not found in the
HEI-2010, for the following reasons. The 2010 Dietary Guidelines for Americans [47]
included a statement about processed meats being a major contributor of solid fats and
13
presented evidence suggesting an association between the higher intake of processed meats
and increased risk of colorectal cancer and cardiovascular disease. However, no
quantitative recommendation was made regarding limits. Although the 2015 Dietary
Guidelines Advisory Committee [48], which focused their work on overall dietary patterns,
included red and processed meats as foods associated with increased risk of chronic
disease, the 2015-2020 Dietary Guidelines also do not contain quantitative limits. The
2015-2020 Dietary Guidelines [45] do, however, suggest choosing fresh poultry, seafood,
and lean meat, rather than processed meat and poultry, as a strategy for lowering sodium
intake. Dietary goals set by the American Heart Association [49] include limiting processed
meats to less than two servings per week. More recently, the International Agency for
Research on Cancer [50] concluded that there was sufficient evidence in human beings for
the carcinogenicity of the consumption of processed meat.
Although many diet quality indexes do not include processed meat in their scoring
method, at least 11 of them do. Five of these, the American Heart Association (AHA) Diet
Score [51], the Food Quality Score [52], the Mediterranean Diet Pattern Score [53], the
Comprehensive Healthy Dietary Pattern score [54], and an a priori diet quality index [55]
count processed meat in its own component, as does the GPQI-2016; whereas the other six,
the Alternate Healthy Eating Index-2010 (AHEI-2010) [56], the Dietary Approaches to
Stop Hypertension (DASH) Score [57], the alternate Mediterranean Diet Index (aMED)
[58], the Mediterranean Diet Score variant (MDS-alt) [59], the Mediterranean Score [60],
and a modified Mediterranean Diet score (mMedDiet) [61] combine red meat and
processed meat in one component. The decision to include processed meats, but not red
meats, in the GPQI-2016 was based primarily on the relative strength of the evidence
14
underlying the International Agency for Research on Cancer report [50] and the 2010
Dietary Guidelines for Americans [47] regarding health effects.
3.4 Scoring Design of the Grocery Purchase Quality Index-2016
Following the approach taken by Stewart and Blisard [62], the scoring design developed
here uses the ratio of observed to expected food expenditures to represent household
compliance. A ratio-based approach has the benefit of being flexible and scalable, as well
as readily interpretable [9, 63, 64].
The scoring standards for the index were created by first summing the standardized
expenditure shares for the Food Plan categories that contribute to each of the 11
components. Similarly, the observed household expenditure shares per Food Plan category
are summed. However, for the Dairy component, the two Food Plan categories with regular
fat content were constrained so that expenditures from these categories could not contribute
more than the per-category standardized expenditure share to the cumulative observed
expenditure share of all Dairy purchases during aggregation for a household’s Dairy
component scoring. To obtain a GPQI-2016 score for each of the 11 components, the
aggregate observed food category expenditure share is divided by the aggregate
standardized expenditure share. For the adequacy components, multiplying the ratio by the
maximum points for the component results in the component score. For ratios greater than
1.0, the component score is constrained so as to equal the maximum number of points. For
the moderation components, a ratio of 1.0 or less corresponds to compliance with the
DGAs, and maximum points are assigned. A ratio of 5.0 or higher results in the minimum
score of zero points. Ratios from 1.0 to 5.0 are assigned scores linearly from the maximum
15
points (MaxPoints) to zero. Expressed mathematically,
Score=MaxPoints*(max(0.0,min(1.0,1.0-((ratio-1.0)/4.0)))). Finally, the total GPQI-2016
score is the sum of the 11 component scores. A maximum of 75 points is possible.
3.5 The Grocery Transaction Data Set
3.5.1 Household Sample Selection
A readily available convenience sample of 15 months of sales transaction data from
January 2012 through March 2013 was donated by a national grocery retail chain for
134,146 households in four market areas, two in the south and two in the west. The data
were de-identified, that is, no household attributes or characteristics were included.
Household transaction histories had been traced using uniquely assigned loyalty card
numbers, recorded by the automated store UPC scanning system at the time of purchase,
as part of a previously existing marketing and promotional shopping program. Each
household shopping occasion had occurred at a specific retail grocery store location and
was recorded automatically by the store’s electronic point-of-sale system at a given date
and time and is uniquely identifiable in the context of that household’s total shopping
history.
The difference between the standardized expenditure shares, described above, and the
observed values determined each household’s purchasing pattern; that is, by what degree
they over-spent or under-spent relative to the standardized shares derived from the Food
Plan composite market basket. The study was approved with an exempt status by the
University of Utah Institutional Review Board (#18830).
Informaticists organized the data into transactional and analytical databases, using
16
MySQL, and stored the tables on a HIPAA-compliant, secure data server at the University
of Utah. Household-level shopping histories were extracted and summarized using queries
in SQL. Selection criteria to obtain the analytical sample were applied as shown in Table
3.3. Households spending less than $3.82 per person per day in 2002 dollars, the per-person
minimum for the TFP, were excluded [39]. According to the Consumer Price Index
inflation adjustment calculator [65], the equivalent value in 2012 dollars was $4.88 per
day or $2,186.24 per person for the 15-month period. Households spending less than this
amount could not reliably fit the composite Food Plan model. Theoretically, including
these households could result in lower scores due to insufficient expenditures rather than
to noncompliance with the standardized expenditure shares. Imposing a minimum
expenditure was intended to mitigate that possibility, despite the tradeoff of a high number
of excluded households.
A sample of 4,000 households from each of the four geographic locations was randomly
selected without replacement. The target number was approximately 75% of the
households from the location with the smallest number of households in the data set. This
step reduced the likelihood of systematic error due to local market differences, such as
regional variation in food prices.
3.5.2 The Grocery Food Item Mapping Process
A nutritionist classified the grocery items purchased into the 29 food categories used in
the USDA Food Plans. This mapping process was facilitated by the common practice in
grocery retail systems of aggregating food items into categories and subcategories, known
as departments, commodities, and subcommodities, for operational data management
17
purposes. An example of a department, commodity, subcommodity, and food item would
be “fresh vegetables, salad vegetables, lettuce, and romaine,” respectively. The first step
of the mapping process was conducted at the commodity and subcommodity level
(n=1,887). Then, food items that do not have Food Plan categories, such as bottled water
and alcoholic beverages, were excluded. The remaining unmapped food items, which
mainly fell under heterogeneous subcommodities, such as “kosher foods and products” and
“misc hispanic grocery,” or were of particular nutritional interest, such as whole-grain
foods, were hand-mapped at the item UPC level, using the often cryptic food descriptions
found in the grocery database.
Of all the purchased food items in the data set, 12.4% were excluded because they are
not in the Food Plans and 0.6% could not be mapped to the 29 categories in the Food Plans.
After independent review by a second nutritionist, the results of this mapping process were
accepted for use in this study. Overall, a total item set of 90,589 products was mapped to a
corresponding Food Plan category (see per-category frequencies in Table 3.2).
3.6 Validity testing
The sample households were stratified by tobacco purchasing history (ever/never). That
is, if any of the transactions in a household’s history included a tobacco product, the
household was placed in the group that had ever purchased tobacco; otherwise, the
household was in the group that had never purchased tobacco. Tobacco purchases served
as a proxy for tobacco use. Because nonsmokers are known to have better diet quality than
smokers, the known-groups design [66, 67] was used to test the concurrent criterion
validity, a type of construct validity, of the Index. The distributions for each of the
component scores as well as for their underlying base ratios did not satisfy statistical tests
18
for normality (Kolmogorov-Smirnov D-statistic p < 0.01). Therefore, the nonparametric
Wilcoxon Rank-Sum (Mann-Whitney U) Test was used to determine differences in the
food quality component scores between the two groups [68]. All statistical tests were
performed using SAS 9.4 [69].
19
Table 3.1: The 4 Food Plan dietary patterns meet or exceed the HEI-2010
standards for each of the food-based scoring components (ounce or cup
equivalents per 1,000 kcal).
Component
HEI-2010
scoring
standard*
Thrifty Food
Plan
consumption
pattern**
Low-cost
Food Plan
consumption
pattern***
Moderate-
cost
Food Plan
consumption
pattern ***
Liberal
Food
Plan
consump
tion
pattern
***
Adequacy
Total Vegetables
≥1.1 cup eq. 1.4 cups 1.3 cups 1.5 cups 1.4 cups
Greens and Beans
≥0.2 cup eq. 0.4 cup 0.4 cup 0.5 cup 0.5 cup
Total Fruit ≥0.8 cup eq. 0.9 cup 1.0 cup 0.9 cup 1.0 cup
Whole Fruit ≥0.4 cup eq. 0.8 cup 0.8 cup 0.7 cup 0.8 cup
Whole Grains
≥1.5 oz. eq. 1.7 oz. 1.7 oz. 1.9 oz. 1.8 oz.
Dairy ≥1.3 cup eq. 1.3 cups 1.3 cups 1.3 cups 1.2 cups
Total Protein Foods
≥2.5 oz. eq. 2.6 oz. 2.7 oz. 2.7 oz. 2.6 oz.
Seafood and Nuts
≥0.8 oz. eq. 1.2 oz. n/a n/a n/a
Moderation
Refined Grains
≤1.8 oz. eq. 1.7 oz. 1.7 oz. 1.6 oz. 1.4 oz.
Empty Calories
≤20% of energy
13.8% of energy
n/a n/a n/a
* HEI-2010 standards are drawn from Table 1 in [43], p. 571 **TFP column drawn from Table 3 of the TFP documentation in [32], pp. 20-22, after applying Census weights to standardize the reported values for the 15 TFP Age-Sex groups and calculating density per 1000 kcal *** Low-cost, Moderate-cost, and Liberal Plan columns drawn from Table A-3a-c of the Food Plan documentation in [31], pp. A3-1ff., after applying Census weights to standardize the reported values for the 15 FP Age-Sex groups and calculating density per 1000 kcal. Data not available for Seafood and Plant Proteins and for Empty Calories, marked ‘n/a’ in Table 3.1.
20
Table 3.2: USDA Food Plan food categories that comprise the
components of the Grocery Purchase Quality Index-2016, the
standardized expenditure share for each food category, and
the number of unique food items in each category in the
analytic data set.
Food Plan food
category
Index
component(s)
Standardized
Food Plan
expenditure
share (%)
Number of
unique food
items (%)
All potato products Total Vegetables 2.65 1,584 (1.75)
Orange vegetables Total Vegetables 2.37 140 (0.15)
Other vegetables Total Vegetables 8.91 4,556 (5.03)
Dark green vegetables Total Vegetables, Greens and Beans
5.78 233 (0.26)
Canned and dry beans, lentils, and peas
Total Vegetables, Greens and Beans
5.96 1,269 (1.40)
Fruit juices Total Fruit 2.41 1,505 (1.66)
Whole fruits Total Fruit,
Whole Fruit
14.90 4,641 (5.12)
Whole grain breads, rice, pasta, and pastries
Whole Grains 6.22 2,011 (2.22)
Whole grain cereals Whole Grains 2.86 434 (0.48)
Popcorn and other whole grain snacks
Whole Grains 1.86 362 (0.40)
Whole milk, yogurt, and cream
Dairy 1.04 1,669 (1.84)
Lower fat and skim milk and lowfat yogurt
Dairy 11.90 1,476 (1.63)
All cheeses Dairy 0.75 4,299 (4.75)
Beef, pork, veal, lamb, and game
Total Protein Foods 5.87 7,098 (7.84)
21
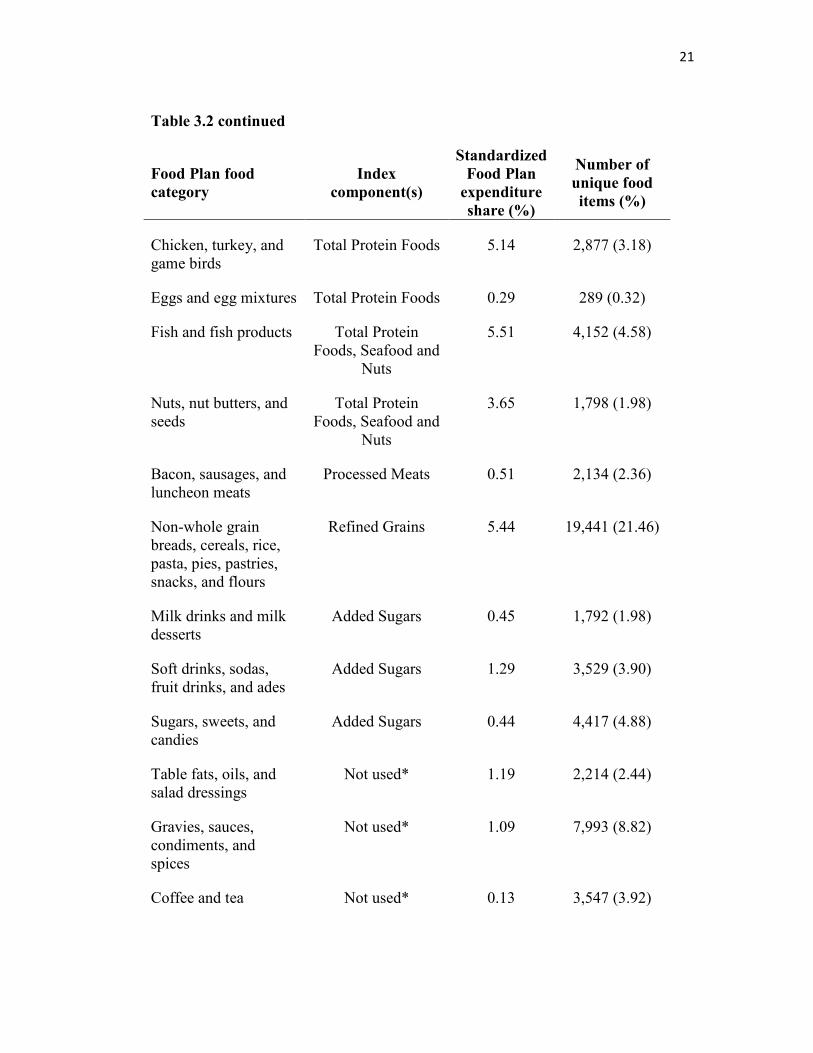
Table 3.2 continued
Food Plan food
category Index
component(s)
Standardized
Food Plan
expenditure
share (%)
Number of
unique food
items (%)
Chicken, turkey, and game birds
Total Protein Foods 5.14 2,877 (3.18)
Eggs and egg mixtures Total Protein Foods 0.29 289 (0.32)
Fish and fish products Total Protein Foods, Seafood and
Nuts
5.51 4,152 (4.58)
Nuts, nut butters, and seeds
Total Protein Foods, Seafood and
Nuts
3.65 1,798 (1.98)
Bacon, sausages, and luncheon meats
Processed Meats 0.51 2,134 (2.36)
Non-whole grain breads, cereals, rice, pasta, pies, pastries, snacks, and flours
Refined Grains 5.44 19,441 (21.46)
Milk drinks and milk desserts
Added Sugars 0.45 1,792 (1.98)
Soft drinks, sodas, fruit drinks, and ades
Added Sugars 1.29 3,529 (3.90)
Sugars, sweets, and candies
Added Sugars 0.44 4,417 (4.88)
Table fats, oils, and salad dressings
Not used* 1.19 2,214 (2.44)
Gravies, sauces, condiments, and spices
Not used* 1.09 7,993 (8.82)
Coffee and tea Not used* 0.13 3,547 (3.92)
22
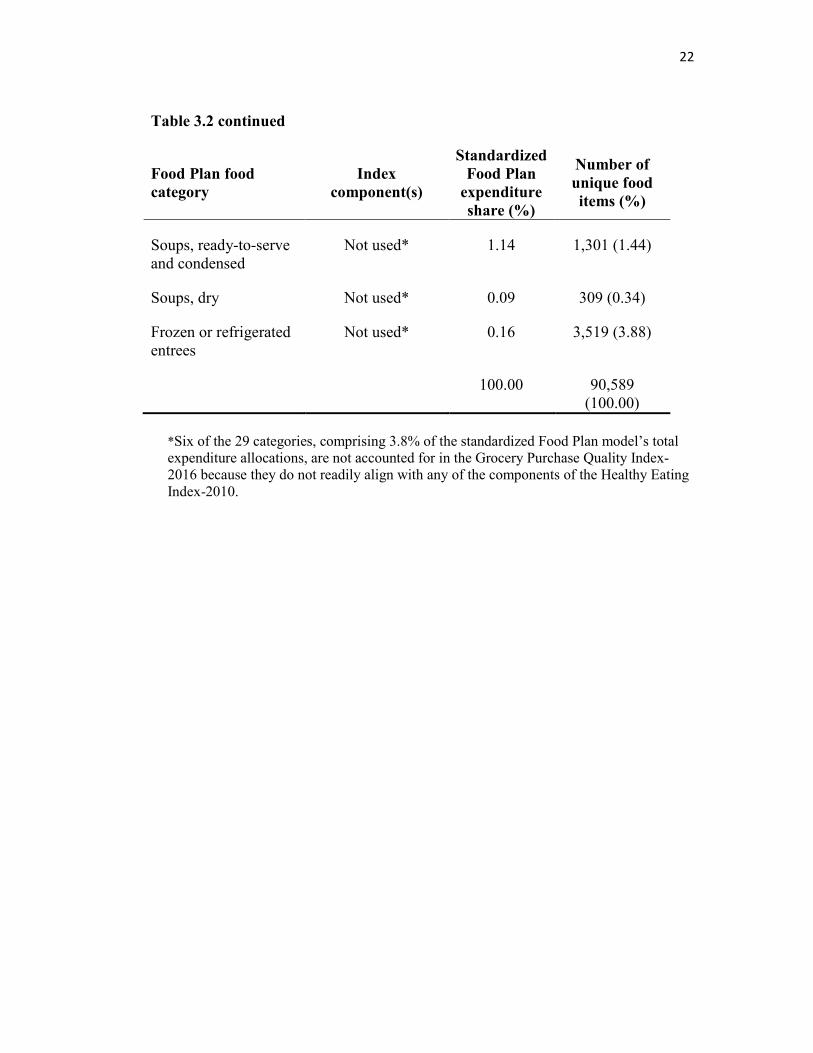
Table 3.2 continued
Food Plan food
category Index
component(s)
Standardized
Food Plan
expenditure
share (%)
Number of
unique food
items (%)
Soups, ready-to-serve and condensed
Not used* 1.14 1,301 (1.44)
Soups, dry Not used* 0.09 309 (0.34)
Frozen or refrigerated entrees
Not used* 0.16 3,519 (3.88)
100.00 90,589 (100.00)
*Six of the 29 categories, comprising 3.8% of the standardized Food Plan model’s total expenditure allocations, are not accounted for in the Grocery Purchase Quality Index-2016 because they do not readily align with any of the components of the Healthy Eating Index-2010.
23
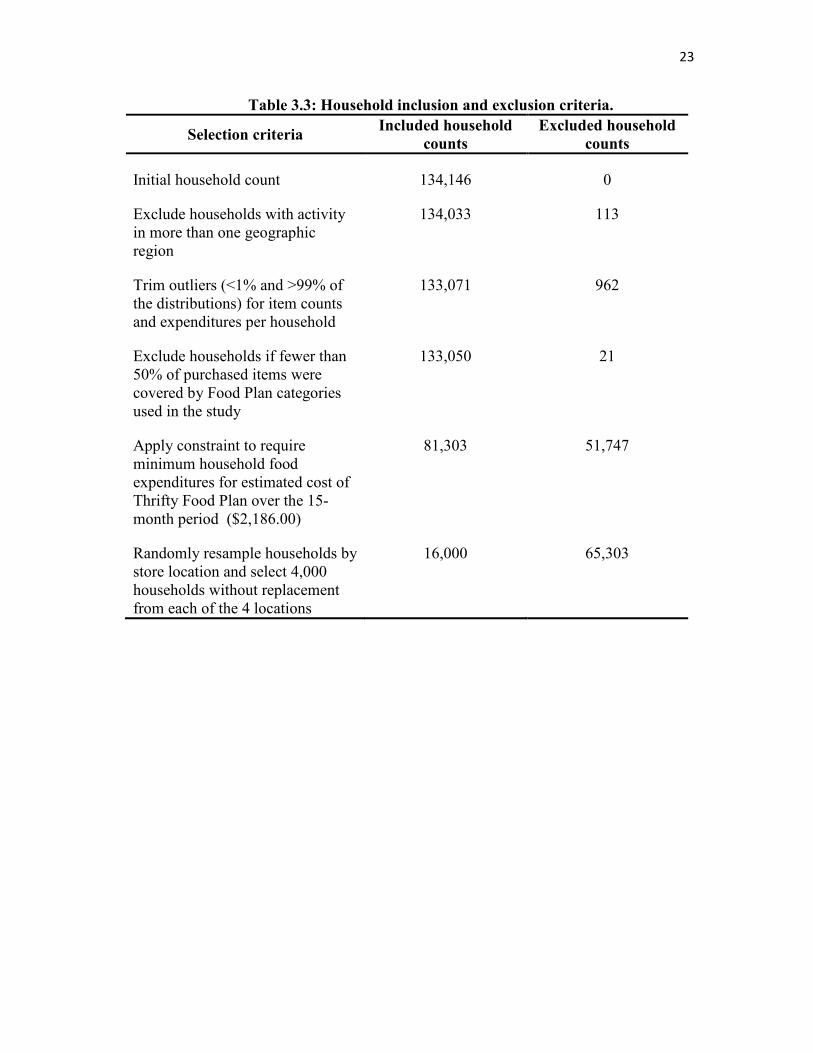
Table 3.3: Household inclusion and exclusion criteria.
Selection criteria Included household
counts
Excluded household
counts
Initial household count 134,146 0
Exclude households with activity in more than one geographic region
134,033 113
Trim outliers (<1% and >99% of the distributions) for item counts and expenditures per household
133,071 962
Exclude households if fewer than 50% of purchased items were covered by Food Plan categories used in the study
133,050 21
Apply constraint to require minimum household food expenditures for estimated cost of Thrifty Food Plan over the 15-month period ($2,186.00)
81,303 51,747
Randomly resample households by store location and select 4,000 households without replacement from each of the 4 locations
16,000 65,303
CHAPTER 4
RESULTS AND DISCUSSION
4.1. Results
Because the sample was de-identified, demographic characteristics of the sample
households are not available. Households that ever purchased tobacco were 22% of the
sample, which is similar to the proportion of adults who smoke nationally (19% in 2011)
[70].
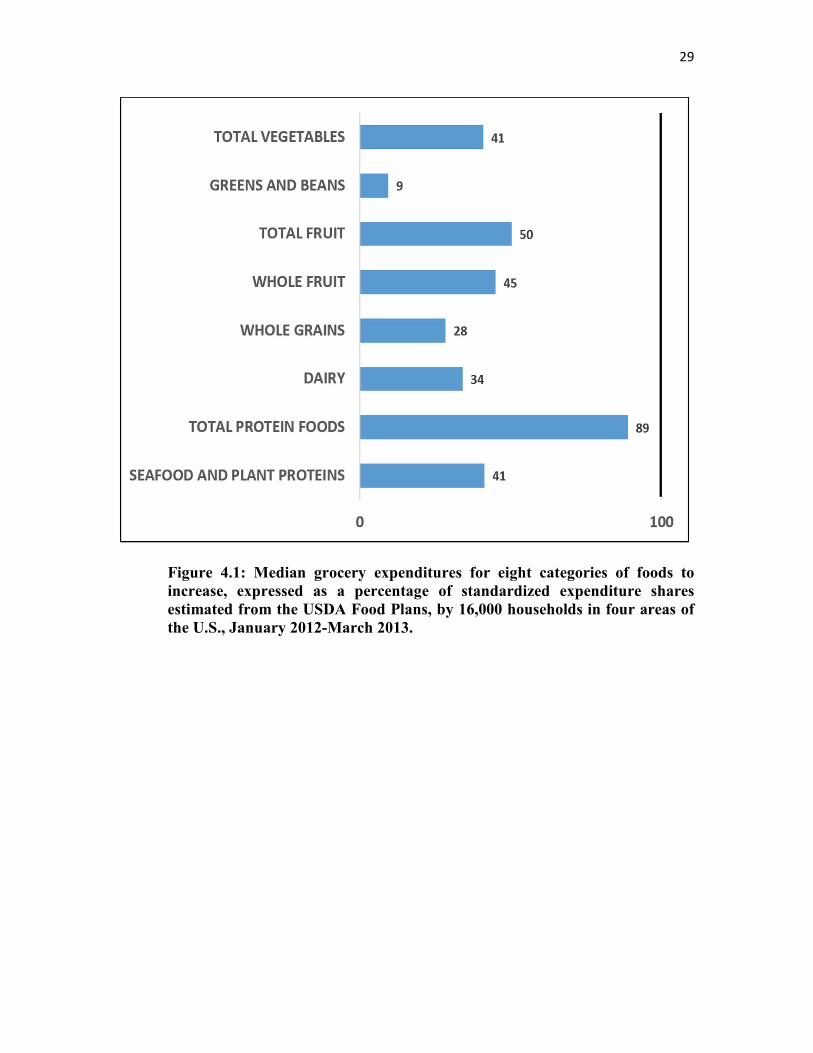
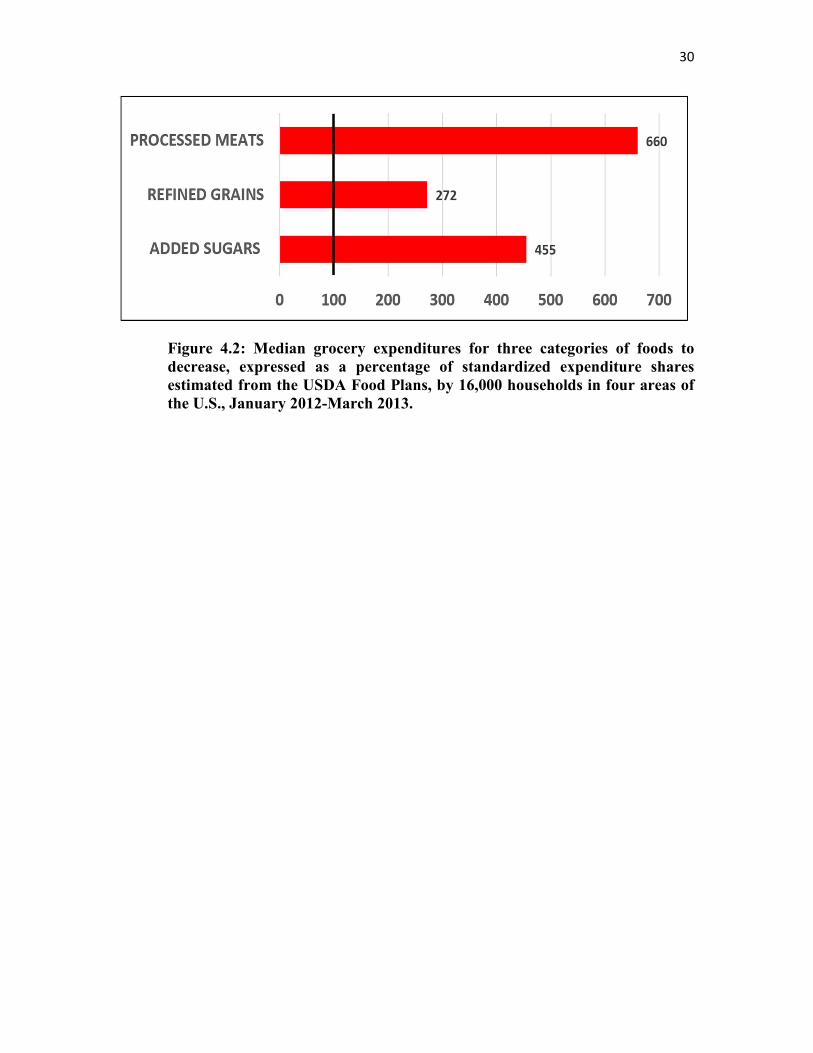
The differences between the observed household expenditure shares and the standardized
Food Plan expenditure shares for the food categories represented in the GPQI-2016 are
illustrated in Figure 4.1 and Figure 4.2. The difference was small only for Total Protein
Foods (beef, pork, veal, lamb, poultry, fish, eggs, nuts, and seeds).
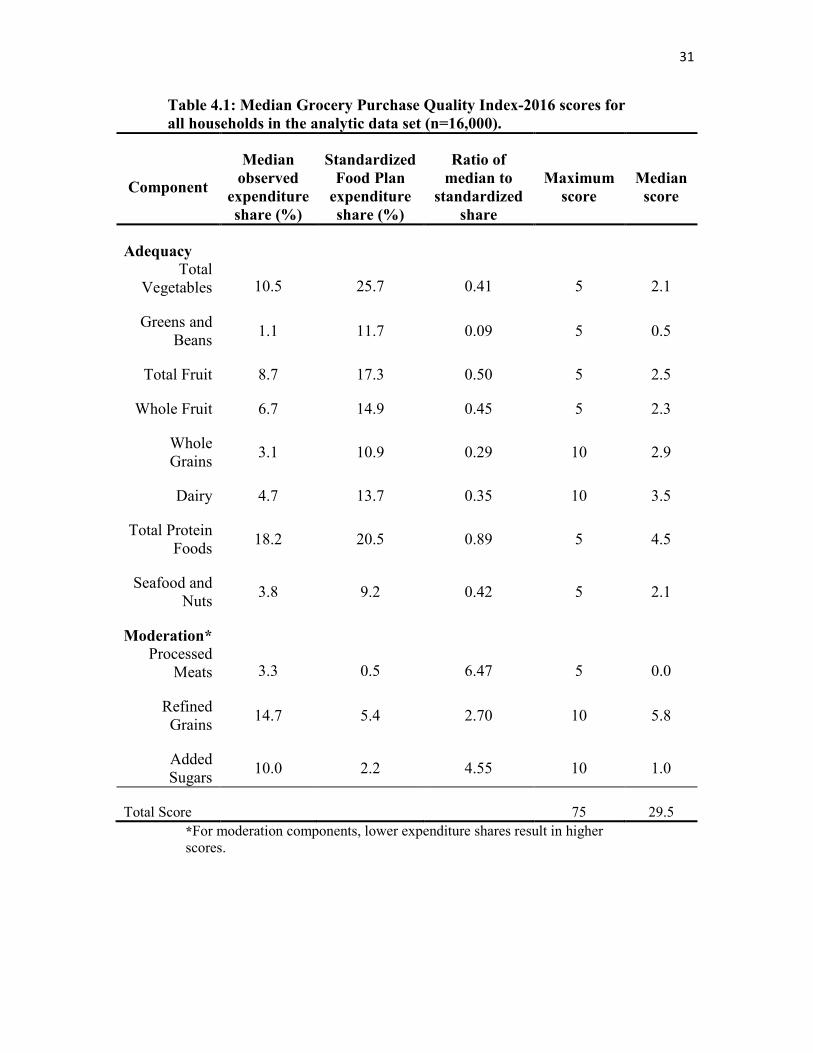
Table 4.1 shows each step in the scoring procedure, the median score for each of the
components of the GPQI-2016, and the total score for the total sample. Total scores for
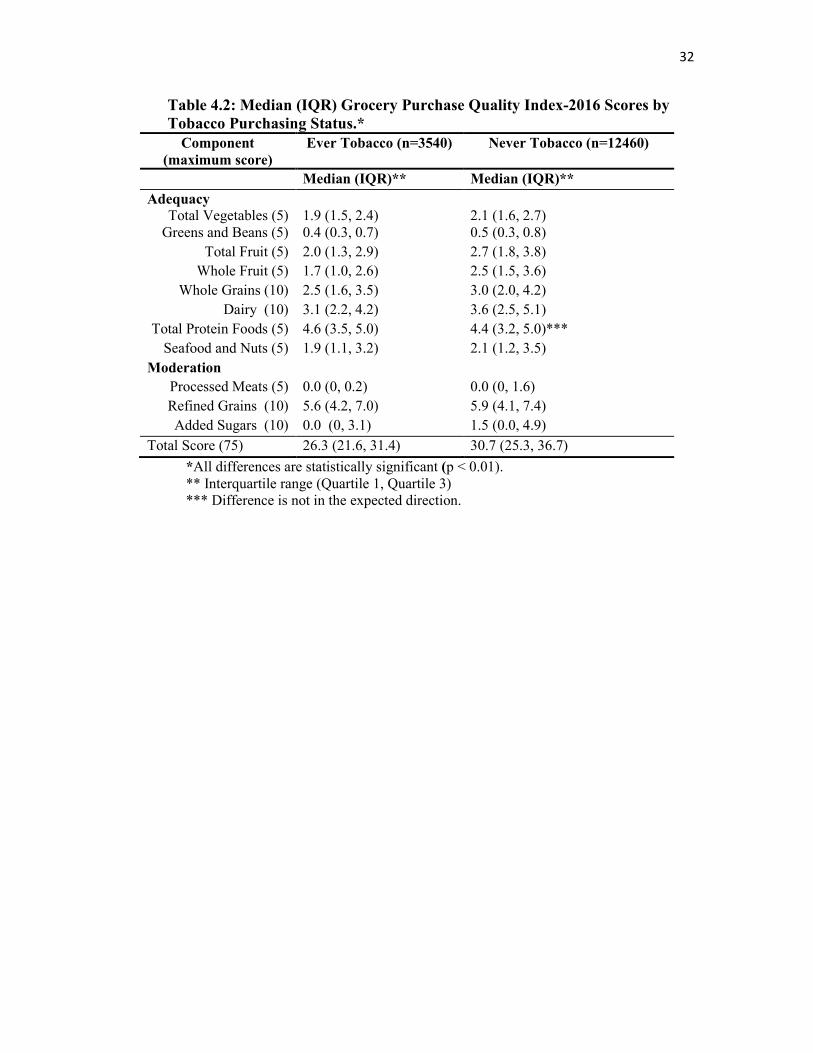
households that never purchased tobacco were 17% higher than those for households that
had any history of tobacco purchases (p < 0.01) (Table 4.2). Differences in the median
scores for each component were also statistically significant; and the differences were in
the expected direction, except for Total Protein Foods, where the tobacco group score was
5% higher.
25
4.2. Discussion
As recorded in the retail point-of-sale transaction log, the data elements and variables
representing a customer’s set of grocery food purchases do not include direct indicators of
the food products’ nutritional quality. These indicators were lacking because a grocery
store’s operational database is designed primarily to register the sale of an item rather than
to describe the product details. Therefore, variables for the meaningful secondary use of
retail grocery transaction databases for nutrition analysis, such as package size and weights
of foods that are not packaged, were missing or not readily available for most food items
in the data set. Third-party proprietary data solutions, such as the Gladson Nutrition
Database [71], provide more detailed item catalogs of packaged retail foods, including
some or all of the Nutrition Facts Panel information, for example; and a number of
proprietary third-party dietary quality measures for grocery food products have been
developed, such as NuVal [72, 73] and Guiding Stars [74-76], and deployed at some retail
chains. However, these solutions are typically expensive to license or employ methods of
food quality assessment that are not reproducible by the nutrition research community at
large [77]. Furthermore, these instruments do not provide the food-based variables needed
for a food-based assessment, such as the Healthy Eating Index. In the future, semi-
automated item search and classification tools might expedite the mapping process and
reduce the risk of classification error, given sufficient expert-curated training sets and
reference standards for annotation [78].
26
4.2.1 Strengths and Limitations
Using grocery store sales data offers several strengths for assessing the quality of the
home food environment. Nearly all grocery stores collect sales data linked to bar codes and
the product codes used on produce, so household-specific data can be collected passively,
imposing little respondent burden. Importantly, sales data are free of recall error. The
GPQI-2016 potentially could scale from the household to the neighborhood- and to the
regional-level of analysis, thereby facilitating study designs that are relatively inexpensive.
The difference in scores between ever and never tobacco-purchasing households generally
reflects the previously reported association between smoking and diet quality [44, 79],
demonstrating the Index’s construct validity.
A further strength of the GPQI-2016 is that it is built on the evidence base that underlies
the Healthy Eating Index-2010, namely the evidence behind the 2010 DGA. It also includes
a moderation component for processed meats, and the evidence base for that is quite strong.
The Index, however, does not capture the elements of the DGA that are measured by the
nutrient-based components of the HEI-2010: sodium and the fatty acid ratio. Nor does it
capture the solid fat and alcohol represented in the empty calories component. Therefore,
total scores of the GPQI-2016 do not signify the same degree of compliance with the 2010
DGA as total HEI-2010 scores do.
It would have been desirable to create an adequacy component for oils and a moderation
component for solid table fats and shortening. Although it would be easy enough to identify
food products that would belong in each of those categories, it was not possible to create
such components for the GPQI-2016 because these two types of foods are unfortunately
combined into one category in the Food Plans, and a target expenditure share for each of
27
them separately has not been set by the USDA.
A limitation of this study was its reliance on USDA Food Plans, published almost a
decade ago (2006-2007) and developed using data from NHANES, 2001-02. The GPQI-
2016 scoring design assumes the distribution of expenditure shares in each Food Plan
market basket is less subject to variation than food prices over time, but accepting and
applying this older USDA model to 2012-13 purchasing data likely introduced an unknown
amount of error into the results presented here.
The current study’s methods were further limited by the fact that the sample was drawn
from only one grocery chain. It is unknown whether the households shopped only at this
chain or whether they visited other retailers (including farmers’ markets) and if so, how
often. A possible source of unmeasured error consists of cases where a shopper for a given
household forgot or did not swipe the household’s loyalty card or provide an alternate ID
while making a grocery purchase. Mapping at the food item level would provide for greater
accuracy in the assignment of grocery foods to Food Plan categories but was not feasible
at the time. Reliance on subcommodity-level mappings introduced an unknown degree of
measurement error. Demographic characteristics of households were not available, so
analyzing other variables of interest could not be attempted. Finally, grocery food
purchases are unlikely to be a complete reflection of a household’s total home food
environment because foods purchased at places other than stores and then brought into the
home are not included.
28
4.3. Conclusion
Since nonsmokers are known to have better diet quality than smokers, results of this study
establish the concurrent criterion validity, a type of construct validity, of the GPQI-2016
as a method for assessing the quality of household grocery purchases. This approach to
assessing food purchase behavior is unobtrusive and scalable to any number of households.
It could also be used at higher levels, such as store, neighborhood, and geographic regions.
In the future, it could be applied to longitudinal grocery data to describe and evaluate
population-level trends and to assess the effectiveness of interventions.
29
Figure 4.1: Median grocery expenditures for eight categories of foods to
increase, expressed as a percentage of standardized expenditure shares
estimated from the USDA Food Plans, by 16,000 households in four areas of
the U.S., January 2012-March 2013.
30
Figure 4.2: Median grocery expenditures for three categories of foods to
decrease, expressed as a percentage of standardized expenditure shares
estimated from the USDA Food Plans, by 16,000 households in four areas of
the U.S., January 2012-March 2013.
31
Table 4.1: Median Grocery Purchase Quality Index-2016 scores for
all households in the analytic data set (n=16,000).
Component
Median
observed
expenditure
share (%)
Standardized
Food Plan
expenditure
share (%)
Ratio of
median to
standardized
share
Maximum
score Median
score
Adequacy
Total Vegetables 10.5 25.7 0.41 5 2.1
Greens and Beans
1.1 11.7 0.09 5 0.5
Total Fruit 8.7 17.3 0.50 5 2.5
Whole Fruit 6.7 14.9 0.45 5 2.3
Whole Grains
3.1 10.9 0.29 10 2.9
Dairy 4.7 13.7 0.35 10 3.5
Total Protein Foods
18.2 20.5 0.89 5 4.5
Seafood and Nuts
3.8 9.2 0.42 5 2.1
Moderation*
Processed Meats 3.3 0.5 6.47 5 0.0
Refined Grains
14.7 5.4 2.70 10 5.8
Added Sugars
10.0 2.2 4.55 10 1.0
Total Score
75 29.5
*For moderation components, lower expenditure shares result in higher scores.
32
Table 4.2: Median (IQR) Grocery Purchase Quality Index-2016 Scores by
Tobacco Purchasing Status.*
Component
(maximum score)
Ever Tobacco (n=3540) Never Tobacco (n=12460)
Median (IQR)** Median (IQR)**
Adequacy Total Vegetables (5)
1.9 (1.5, 2.4)
2.1 (1.6, 2.7)
Greens and Beans (5) 0.4 (0.3, 0.7) 0.5 (0.3, 0.8)
Total Fruit (5) 2.0 (1.3, 2.9) 2.7 (1.8, 3.8)
Whole Fruit (5) 1.7 (1.0, 2.6) 2.5 (1.5, 3.6)
Whole Grains (10) 2.5 (1.6, 3.5) 3.0 (2.0, 4.2)
Dairy (10) 3.1 (2.2, 4.2) 3.6 (2.5, 5.1)
Total Protein Foods (5) 4.6 (3.5, 5.0) 4.4 (3.2, 5.0)***
Seafood and Nuts (5) 1.9 (1.1, 3.2) 2.1 (1.2, 3.5)
Moderation
Processed Meats (5) 0.0 (0, 0.2) 0.0 (0, 1.6)
Refined Grains (10) 5.6 (4.2, 7.0) 5.9 (4.1, 7.4)
Added Sugars (10) 0.0 (0, 3.1) 1.5 (0.0, 4.9)
Total Score (75) 26.3 (21.6, 31.4) 30.7 (25.3, 36.7)
*All differences are statistically significant (p < 0.01). ** Interquartile range (Quartile 1, Quartile 3) *** Difference is not in the expected direction.
CHAPTER 5
FURTHER VALIDATION STUDIES
5.1 The 2012 USDA-ERS FoodAPS
In 2012-13, the USDA-ERS conducted the first National Household Food Acquisition
and Purchase Survey (FoodAPS) [80]. As distinct from the National Health and Nutrition
Examination Survey (NHANES), which collects two 24-hour dietary recalls of foods
consumed by individual respondents, the FoodAPS participants recorded foods as
purchased by household members for a week, including both foods at home (FAH) that
were bought at retail grocery stores or other outlets, as well as foods away from home
(FAFH), which were acquired at restaurants, schools, or other locations. Previously
restricted to use by research teams collaborating with USDA-ERS, public-use data sets
from this survey are now available, with certain limitations intended mainly to protect the
anonymity of the household respondents. These FoodAPS data were used to further
evaluate the previously described scoring design based on the USDA Food Plans and its
ability to assess food purchase quality: the Grocery Purchase Quality Index-2016 (GPQI-
2016).
A detailed description of the survey design and data collection procedures can be found
in the USDA-ERS documentation [80]. One limitation is that the FoodAPS had a fairly
low overall study response rate of 41.5%. As with the NHANES, sampling weights for the
34
FoodAPS are intended to make the results representative of the US population; however,
they cannot correct for bias introduced when respondents differ from nonrespondents. The
survey design included oversampling for groups of particular interest, such as participants
in the Supplemental Nutrition Assistance Program (SNAP). Households using SNAP
comprised 33% of the total 2012 FoodAPS sample: n=1,581 of 4,826 households total. The
FAH shopping data for all the households in the sample were used to validate the GPQI-
2016. With this information on SNAP participation status, target expenditure shares of
purchased food amounts drawn directly from the Thrifty Food Plan tables could perhaps
be used in future work. This study used the GPQI-2016, which uses a composite of all four
Food Plans.
The FoodAPS data sets separate the reported household food acquisitions and purchases
into distinct sets of files, based on their provenance as foods at home or as foods away from
home. Household-level variables for each set contain a unique primary key (household ID
number) to link and merge household attributes, such as the household’s income, with
specific information about the foods purchased or otherwise acquired by the household
during the 7-day reporting period. A detailed transaction log of food items (n=143,050
FAH items for all 4,826 households) is structured by a unique event ID per household, such
as a single grocery shopping trip, followed by sequential item numbers within that event
representing the set of items in the market basket for that shopping trip. The food items
reported by households during the survey period further include food descriptors, scanned
product codes (UPCs), and package size information, when available (e.g., through third
parties such as IRI). These food items are linked together using the same sequence of
structured key variables: by household, purchasing event. A fourth data file shows the
35
related nutrition information at the food item level, to match up with USDA food
composition databases, the Food and Nutrition Database for Dietary Studies (FNDDS), and
the Food Pattern Equivalents Database (FPED), using an 8-digit USDA-assigned FNDDS
food code. These data are also identified in the FoodAPS by a higher-order (categorical)
food classification schema developed by the USDA-ERS (variable name ‘foodgroup’).
There were n=3,113 unique USDA food codes in the FoodAPS FAH item and nutrient
data sets of 143,050, once duplicate item rows within and between households were
removed. Many of these item records (n=109,598) included a nonmissing UPC number
(variable name ‘barcode’); however, text item descriptors relating to these UPCs were far
less frequent (n=1,700 out of 33,689 unique UPC items). If the FNDDS main food
descriptors are included, then most of the UPC items can be accounted for (n=33,303 of
n=33,689 unique UPC items). The FoodAPS data further provide indicators of the
reliability of the UPC and its related variables, such as package size; e.g., whether the UPC
was scanned or keyed in later from shopper panel diaries and receipts by survey staff
(variable names ‘barcodesource’ and ‘itemreportmethod’). For example, the record
indicates whether the reported item was available on the IRI database, a national reference
standard for aggregated retail food purchasing information (variable name
‘upcreceiptmatch’).
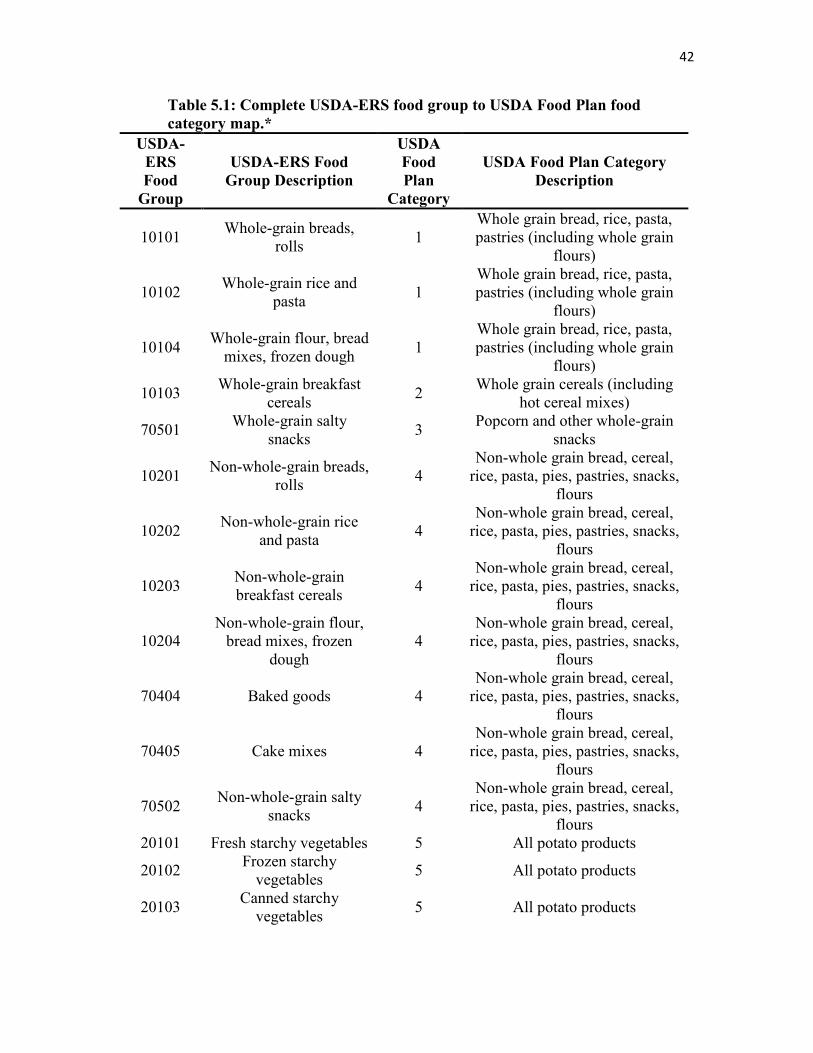
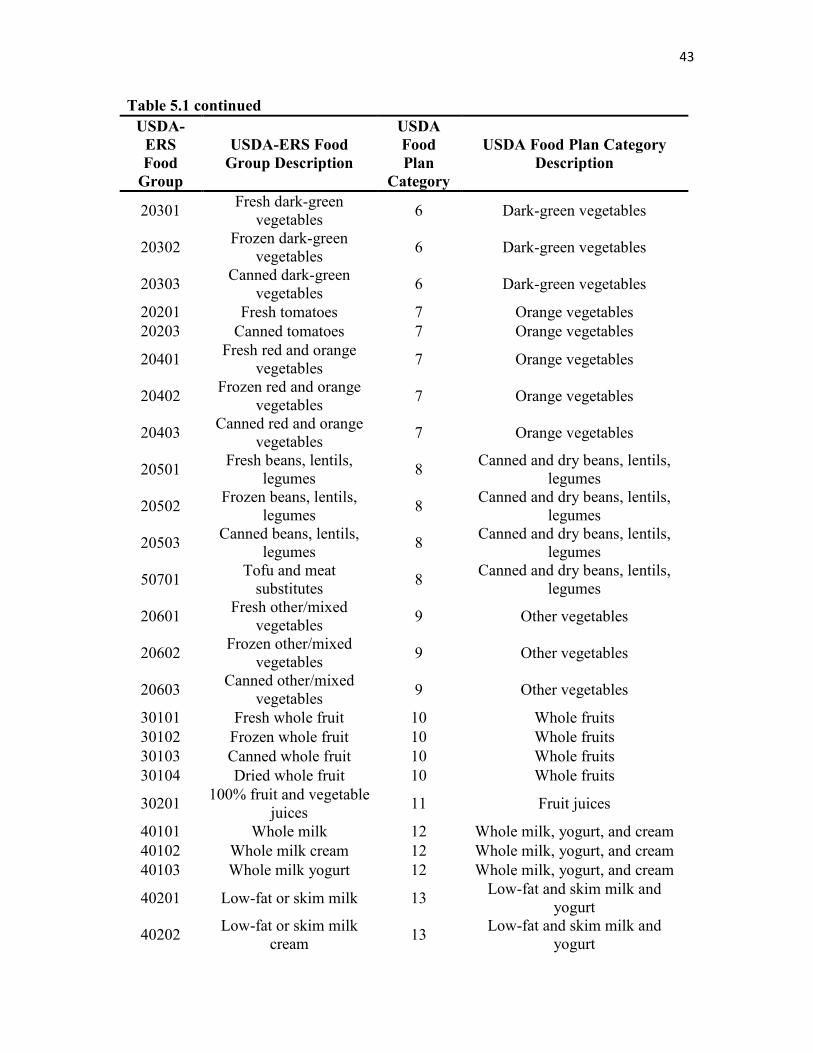
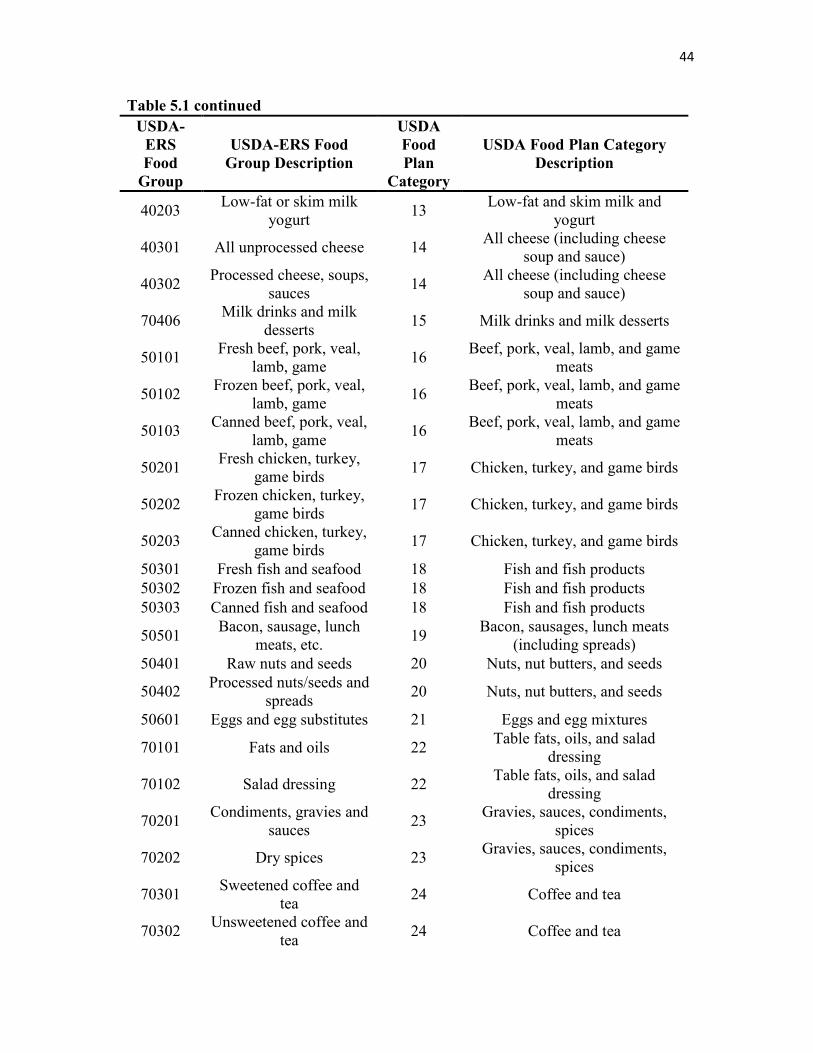
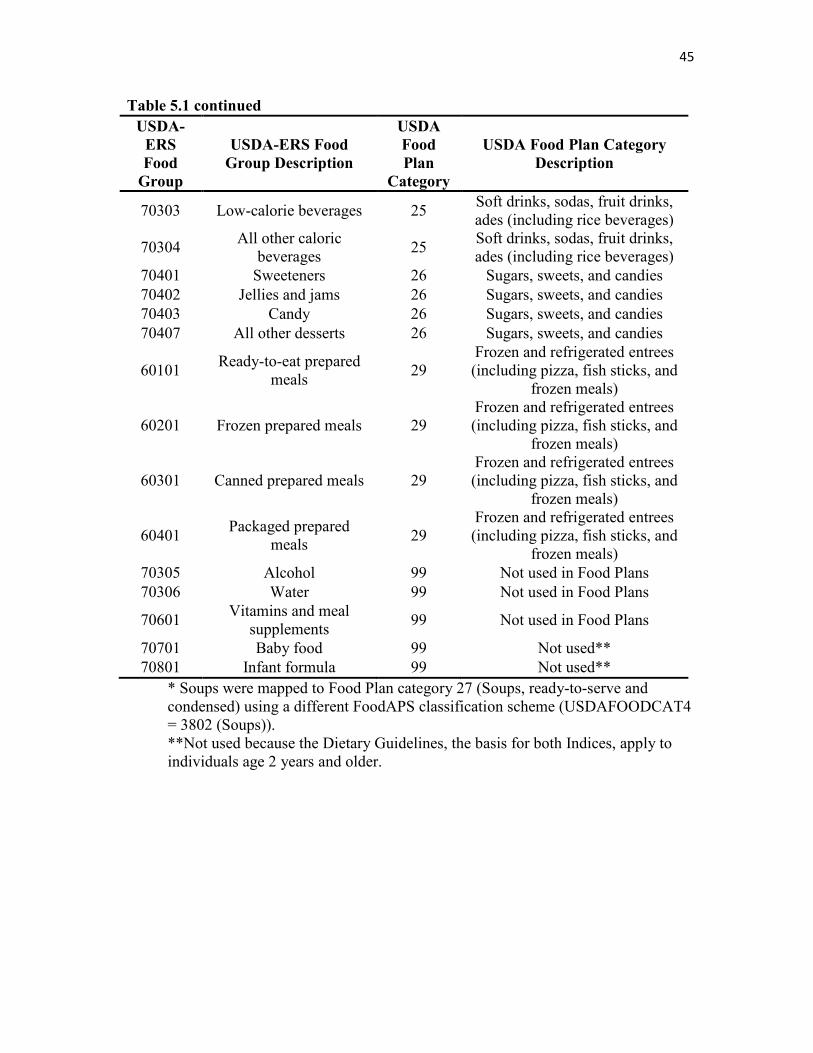
5.2 Food Plan Category Mapping
The clearest association with the schema used in the Food Plan market basket food
categories can be discerned by comparing it to the USDA-ERS ‘foodgroup’ classification
level, as shown in Table 5.1. For the purposes of this analysis, the 5-digit ERS food group
36
numbers were used to map reported FAH items to the 29 Food Plan food categories and
then to build on the existing ERS food group –> FNDDS food code relationship in the
FoodAPS data sets for scoring the same household food items with the HEI-2010, to
prepare for validating the GPQI-2016. One exception was the case of soups (Food Plan
category 27 and 28), which were not specifically represented in the ERS food group
schema. Therefore, for future reference, soups were recoded using a second FoodAPS
classification variable (USDAFOODCAT4=3802) for the mappings, but are not included
in the GPQI-2016. (Compare Table 3.2.) As noted in the USDA documentation of the
plans, the Food Plan market basket model does not pertain to foods away from home, so
only the food at home items from the FoodAPS were included in these analyses.
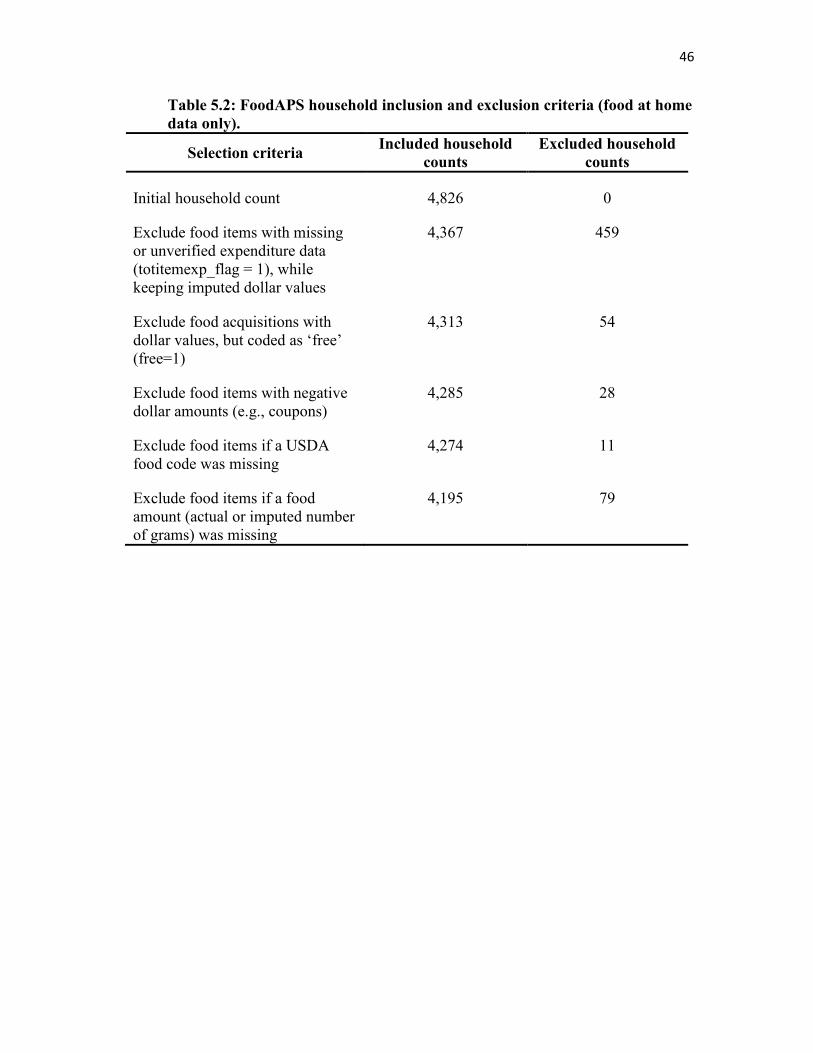
In order to score the same sets of household FAH items, the base variables (‘inputs’) for
each of the scoring methods had to be present. As described in Table 5.2, the inclusion and
exclusion criteria filtered out items, and subsequently households if no eligible food items
remained, according to 1) whether the items had valid price data, 2) whether they had been
mapped to a USDA food code, and 3) whether they had valid (nonmissing) values for item
weights in grams, whereby imputed values assigned by FoodAPS researchers were also
considered acceptable.
5.3 Characteristics of the Analytic Data Set
The FoodAPS data sets include information on the self-reported price (dollars) for each
food item within a household purchasing event or transaction. Additional indicators help
to assess the reliability of these amounts, e.g., if paper receipts of the transactions were
presented in the household’s completed survey diary for the week. Selecting for food items
37
with a valid dollar amount greater than zero, the total set of n=143,050 rows was reduced
to n=135,977 reported FAH items, and the total household count of n=4,826 was reduced
to n=4,285 eligible households for GPQI-2016 assessment. Once this working set of item
transactions had been merged with the mapped set of food codes and items with valid
portion weights in grams for HEI-2010 scoring, the final analytical sample was n=4,195
households with n=99,376 reported FAH item purchases. See Table 5.2.
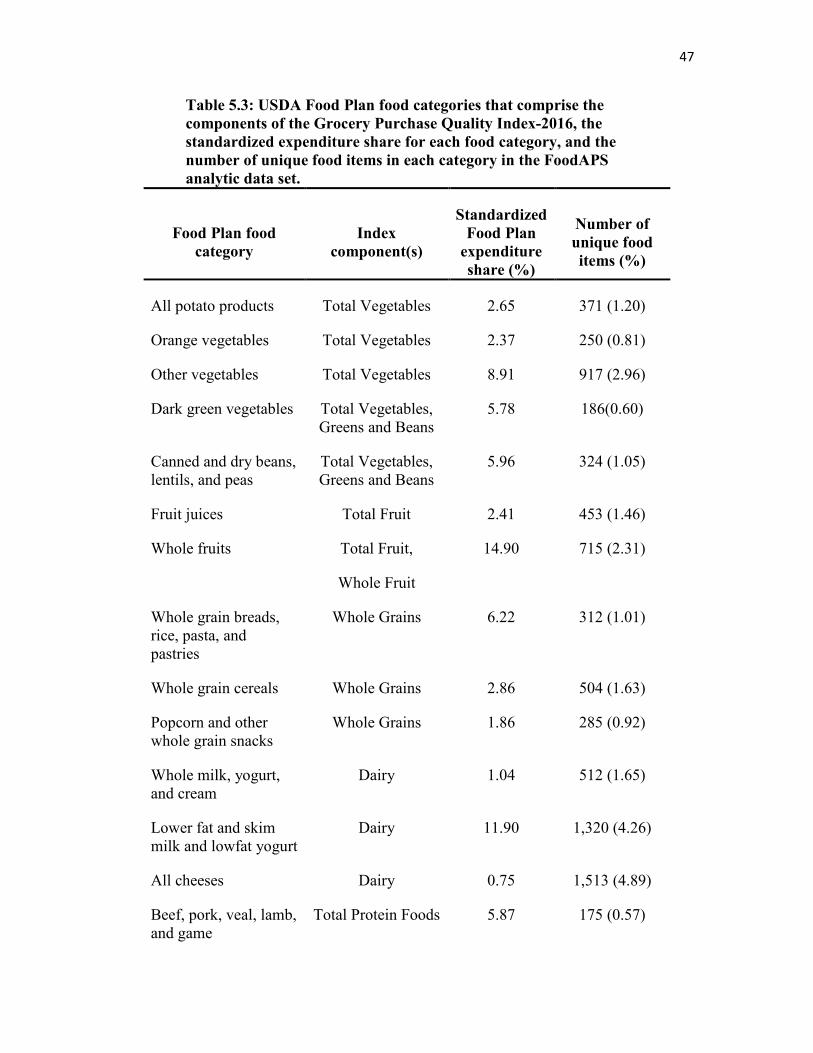
Distilling the unique number of items reported in the survey for an estimate of the
contribution to each Food Plan category (see Table 5.3) was accomplished by testing for
discrete items at the UPC level. For the analytic data set (n=99,376 item records), there
were 29,786 unique UPC items in the 29 Food Plan categories. This FoodAPS item set is
much smaller than what was available from the grocery database reported previously (see
Table 3.2), and the item counts for several categories (e.g., meats) that consist of non-
packaged foods without a UPC may be understated in Table 5.3 as a consequence.
Having mapped household food purchases to an appropriate Food Plan category using
the USDA-ERS food group classification schema as a guide (see Table 5.1) and having
aggregated household FAH food expenditures for the reporting period to serve as the
denominator for calculating observed expenditure shares per Food Plan food category,
calculating the Grocery Purchase Quality Index-2016 is relatively straightforward. Results
are shown in Table 5.4. Since the FoodAPS data sets include all the variables required to
calculate the HEI-2010, such as energy (kcal), number of edible grams of foods as-
consumed, and the FPED values for 100 gram portions of each food as identified by an
FNDDS food code, as well as nutrients of interest, such as sodium and saturated fat, the
reference standard for assessing FoodAPS household food quality was established for
38
comparison. Edible grams for foods as-consumed are distinguished from total (unadjusted)
grams as-purchased in the FoodAPS item nutrient record file codebook and kept in separate
variables [80]. For many items, a refuse factor is also given (variable name ‘refuse’) to
document this conversion process. In addition to the HEI-2010, the GPQI-2016 was
calculated using the food amount tables in the USDA documentation (pounds per week,
converted to grams in the as-purchased form as reported in the FoodAPS), after
standardizing across age-gender groups using the 2012 Census population weights, as
previously described for the expenditure share method. See Table 5.5.
5.4 Correlation Analysis
In previous sections of the thesis, the validity of the GPQI-2016 was demonstrated using
the known groups method. The statistically significant difference between the Food Plan
scores for households that had never purchased tobacco, as compared to households that
had ‘ever’ purchased tobacco, offered evidence of construct validity. Using a different
(independent) set of households for analysis with the 2012 FoodAPS data, it becomes
possible to validate the GPQI-2016 by comparing it directly with the reference standard in
this domain: the HEI-2010 scores for the same households and the same sets of reported
foods. Although the focus of the thesis remains on the Food Plan category expenditure
shares model of the GPQI-2016, results showing the GPQI-2016 scores calculated using
the Food Plan documentation’s food amount tables (pounds per week in grams) have been
included in a second set of GPQI-2016 tables.
A first step in this comparison was to conduct a correlation analysis using the weighted
Pearson’s r coefficient (Table 5.6) for the components found in both indexes. (The
39
correlation between the two components that are not common to both, Processed Meats
and Sodium, was 0.25.) The strength of the correlations between the HEI-2010 and the
Grocery Purchase Quality Index-2016 varied by component. Some adequacy components
had associations as strong as r=0.85-0.86 (Total Fruits; Whole Fruits; Whole Grains), with
most falling in the ‘moderate’ range of r=0.59-0.71. The moderation components had lower
correlations than the adequacy components did: 0.55 for Refined Grains and 0.41 for
Added Sugars. The weaker result for Moderation scoring is perhaps attributable to the
greater divergence between the two methods when assessing these food components. Thus,
the linear algorithmic model used to calculate GPQI-2016 moderation component scores,
described in Chapter 3, lacks a range of both minimum and maximum levels of
acceptability for these foods to contribute to the overall household diet without penalty.
The standardized expenditure share is a limit for the maximum end of this range, with zero
given as the minimum only by default. In addition, the component with the weakest
correlation (Added Sugars) is one of the two components of the GPQI-2016 not directly
reflected by the set of HEI-2010 components. The relationship between Added Sugars and
Empty Calories is incomplete, or is only a partial relationship (again, solid fats are missing
from the GPQI-2016 component). Despite these limitations, the weighted Pearson’s
correlation coefficient between the total Grocery Purchase Quality Index-2016 and the
Total HEI-2010 score was r=0.65, which is in the range of what is usually interpreted as
being a moderately strong (positive) correlation [81, 82], thereby indicating construct
validity for the GPQI-2016. See Table 5.6 and Table 5.7. The correlation between the two
GPQI-2016 methods, using expenditure shares and using food weight amounts in pounds
(grams) per week, is reported in Table 5.8 and is quite strong overall, r=0.80 for the total
40
score. The weakness of the correlation between these two methods for the Refined Grains
component score (r=0.54) was unexpected and merits further investigation.
5.5 Class Variable Analysis
The next step in this analysis of the FoodAPS data, comparing HEI-2010 and Grocery
Purchase Quality Index-2016 results, is presented in Table 5.9 and Tables 5.10-5.11,
respectively. The total score served as the dependent variable in a weighted univariate
regression model to illustrate the contribution of various subgroups of households
comprising different response levels of a noncontinuous class variable. The reported t-
statistic indicates the significance of the difference between each response group in relation
to a reference group (or control), set to zero in the model. An alpha level of 0.05 was used.
The main outcome of note is that both total scores, the Total HEI-2010 and the Total
Grocery Purchase Quality Index-2016, show roughly parallel patterns of similarity and
difference among groups of interest in the respective statistical models.
In each case, for example, a higher-scoring reference region (West) has a statistically
different modeling effect than lower-scoring regions (South and Midwest), and a similar
one, as indicated by a nonsignificant p-value, for the other high-scoring region (Northeast).
Each score (i.e., dependent variable) in the model varies across the same levels of other
class variables selected as being of potential value in determining the effect of nutritional
or educational information on food purchase quality. The higher frequency with which
households use the Nutrition Facts Panel and shop with a grocery list, for example, is
associated with higher total scores in both the HEI-2010 and the GPQI-2016. The use of
grocery lists, in particular, suggests a certain degree of forethought and attention to food
41
purchasing and meal preparation decisions in the household that may affect food purchase
quality in a positive direction. The beliefs (self-assessment) of the household about the
quality of the FAH food environment also showed a similar pattern of significance.
An unexpected result, though the Total HEI-2010 showed borderline statistical
significance at p=0.05, is the statistical nonsignificance of the factor indicating whether or
not a household had attended a nutrition education event in the past 2 months. The event
in question could have been anything from a college or night-school course on nutritional
health to a weekend cooking class, but the household respondent’s level of nutritional
knowledge would generally be expected to be associated with higher quality food quality
scores, and yet that was not evident in these models.
Corroborating the findings in the main sections of this thesis on the relationship between
tobacco use and the quality of food purchases, each of the indices is able to detect a
statistically significant difference between the weighted mean total scores of households
with a tobacco user present and households with no reported tobacco use. As expected from
the literature and from the previous conclusions of the thesis (Chapter 4), higher total scores
are found in the nontobacco group for both the HEI-2010 and the GPQI-2016.
42
Table 5.1: Complete USDA-ERS food group to USDA Food Plan food
category map.*
USDA-
ERS
Food
Group
USDA-ERS Food
Group Description
USDA
Food
Plan
Category
USDA Food Plan Category
Description
10101 Whole-grain breads,
rolls 1
Whole grain bread, rice, pasta, pastries (including whole grain
flours)
10102 Whole-grain rice and
pasta 1
Whole grain bread, rice, pasta, pastries (including whole grain
flours)
10104 Whole-grain flour, bread
mixes, frozen dough 1
Whole grain bread, rice, pasta, pastries (including whole grain
flours)
10103 Whole-grain breakfast
cereals 2
Whole grain cereals (including hot cereal mixes)
70501 Whole-grain salty
snacks 3
Popcorn and other whole-grain snacks
10201 Non-whole-grain breads,
rolls 4
Non-whole grain bread, cereal, rice, pasta, pies, pastries, snacks,
flours
10202 Non-whole-grain rice
and pasta 4
Non-whole grain bread, cereal, rice, pasta, pies, pastries, snacks,
flours
10203 Non-whole-grain breakfast cereals
4 Non-whole grain bread, cereal,
rice, pasta, pies, pastries, snacks, flours
10204 Non-whole-grain flour,
bread mixes, frozen dough
4 Non-whole grain bread, cereal,
rice, pasta, pies, pastries, snacks, flours
70404 Baked goods 4 Non-whole grain bread, cereal,
rice, pasta, pies, pastries, snacks, flours
70405 Cake mixes 4 Non-whole grain bread, cereal,
rice, pasta, pies, pastries, snacks, flours
70502 Non-whole-grain salty
snacks 4
Non-whole grain bread, cereal, rice, pasta, pies, pastries, snacks,
flours 20101 Fresh starchy vegetables 5 All potato products
20102 Frozen starchy
vegetables 5 All potato products
20103 Canned starchy
vegetables 5 All potato products
43
Table 5.1 continued
USDA-
ERS
Food
Group
USDA-ERS Food
Group Description
USDA
Food
Plan
Category
USDA Food Plan Category
Description
20301 Fresh dark-green
vegetables 6 Dark-green vegetables
20302 Frozen dark-green
vegetables 6 Dark-green vegetables
20303 Canned dark-green
vegetables 6 Dark-green vegetables
20201 Fresh tomatoes 7 Orange vegetables
20203 Canned tomatoes 7 Orange vegetables
20401 Fresh red and orange
vegetables 7 Orange vegetables
20402 Frozen red and orange
vegetables 7 Orange vegetables
20403 Canned red and orange
vegetables 7 Orange vegetables
20501 Fresh beans, lentils,
legumes 8
Canned and dry beans, lentils, legumes
20502 Frozen beans, lentils,
legumes 8
Canned and dry beans, lentils, legumes
20503 Canned beans, lentils,
legumes 8
Canned and dry beans, lentils, legumes
50701 Tofu and meat
substitutes 8
Canned and dry beans, lentils, legumes
20601 Fresh other/mixed
vegetables 9 Other vegetables
20602 Frozen other/mixed
vegetables 9 Other vegetables
20603 Canned other/mixed
vegetables 9 Other vegetables
30101 Fresh whole fruit 10 Whole fruits
30102 Frozen whole fruit 10 Whole fruits
30103 Canned whole fruit 10 Whole fruits
30104 Dried whole fruit 10 Whole fruits
30201 100% fruit and vegetable
juices 11 Fruit juices
40101 Whole milk 12 Whole milk, yogurt, and cream
40102 Whole milk cream 12 Whole milk, yogurt, and cream
40103 Whole milk yogurt 12 Whole milk, yogurt, and cream
40201 Low-fat or skim milk 13 Low-fat and skim milk and
yogurt
40202 Low-fat or skim milk
cream 13
Low-fat and skim milk and yogurt
44
Table 5.1 continued
USDA-
ERS
Food
Group
USDA-ERS Food
Group Description
USDA
Food
Plan
Category
USDA Food Plan Category
Description
40203 Low-fat or skim milk
yogurt 13
Low-fat and skim milk and yogurt
40301 All unprocessed cheese 14 All cheese (including cheese
soup and sauce)
40302 Processed cheese, soups,
sauces 14
All cheese (including cheese soup and sauce)
70406 Milk drinks and milk
desserts 15 Milk drinks and milk desserts
50101 Fresh beef, pork, veal,
lamb, game 16
Beef, pork, veal, lamb, and game meats
50102 Frozen beef, pork, veal,
lamb, game 16
Beef, pork, veal, lamb, and game meats
50103 Canned beef, pork, veal,
lamb, game 16
Beef, pork, veal, lamb, and game meats
50201 Fresh chicken, turkey,
game birds 17 Chicken, turkey, and game birds
50202 Frozen chicken, turkey,
game birds 17 Chicken, turkey, and game birds
50203 Canned chicken, turkey,
game birds 17 Chicken, turkey, and game birds
50301 Fresh fish and seafood 18 Fish and fish products
50302 Frozen fish and seafood 18 Fish and fish products
50303 Canned fish and seafood 18 Fish and fish products
50501 Bacon, sausage, lunch
meats, etc. 19
Bacon, sausages, lunch meats (including spreads)
50401 Raw nuts and seeds 20 Nuts, nut butters, and seeds
50402 Processed nuts/seeds and
spreads 20 Nuts, nut butters, and seeds
50601 Eggs and egg substitutes 21 Eggs and egg mixtures
70101 Fats and oils 22 Table fats, oils, and salad
dressing
70102 Salad dressing 22 Table fats, oils, and salad
dressing
70201 Condiments, gravies and
sauces 23
Gravies, sauces, condiments, spices
70202 Dry spices 23 Gravies, sauces, condiments,
spices
70301 Sweetened coffee and
tea 24 Coffee and tea
70302 Unsweetened coffee and
tea 24 Coffee and tea
45
Table 5.1 continued
USDA-
ERS
Food
Group
USDA-ERS Food
Group Description
USDA
Food
Plan
Category
USDA Food Plan Category
Description
70303 Low-calorie beverages 25 Soft drinks, sodas, fruit drinks, ades (including rice beverages)
70304 All other caloric
beverages 25
Soft drinks, sodas, fruit drinks, ades (including rice beverages)
70401 Sweeteners 26 Sugars, sweets, and candies
70402 Jellies and jams 26 Sugars, sweets, and candies
70403 Candy 26 Sugars, sweets, and candies
70407 All other desserts 26 Sugars, sweets, and candies
60101 Ready-to-eat prepared
meals 29
Frozen and refrigerated entrees (including pizza, fish sticks, and
frozen meals)
60201 Frozen prepared meals 29 Frozen and refrigerated entrees (including pizza, fish sticks, and
frozen meals)
60301 Canned prepared meals 29 Frozen and refrigerated entrees (including pizza, fish sticks, and
frozen meals)
60401 Packaged prepared
meals 29
Frozen and refrigerated entrees (including pizza, fish sticks, and
frozen meals)
70305 Alcohol 99 Not used in Food Plans
70306 Water 99 Not used in Food Plans
70601 Vitamins and meal
supplements 99 Not used in Food Plans
70701 Baby food 99 Not used**
70801 Infant formula 99 Not used**
* Soups were mapped to Food Plan category 27 (Soups, ready-to-serve and condensed) using a different FoodAPS classification scheme (USDAFOODCAT4 = 3802 (Soups)). **Not used because the Dietary Guidelines, the basis for both Indices, apply to individuals age 2 years and older.
46
Table 5.2: FoodAPS household inclusion and exclusion criteria (food at home
data only).
Selection criteria Included household
counts
Excluded household
counts
Initial household count 4,826 0
Exclude food items with missing or unverified expenditure data (totitemexp_flag = 1), while keeping imputed dollar values
4,367 459
Exclude food acquisitions with dollar values, but coded as ‘free’ (free=1)
4,313 54
Exclude food items with negative dollar amounts (e.g., coupons)
4,285 28
Exclude food items if a USDA food code was missing
4,274 11
Exclude food items if a food amount (actual or imputed number of grams) was missing
4,195 79
47
Table 5.3: USDA Food Plan food categories that comprise the
components of the Grocery Purchase Quality Index-2016, the
standardized expenditure share for each food category, and the
number of unique food items in each category in the FoodAPS
analytic data set.
Food Plan food
category
Index
component(s)
Standardized
Food Plan
expenditure
share (%)
Number of
unique food
items (%)
All potato products Total Vegetables 2.65 371 (1.20)
Orange vegetables Total Vegetables 2.37 250 (0.81)
Other vegetables Total Vegetables 8.91 917 (2.96)
Dark green vegetables Total Vegetables, Greens and Beans
5.78 186(0.60)
Canned and dry beans, lentils, and peas
Total Vegetables, Greens and Beans
5.96 324 (1.05)
Fruit juices Total Fruit 2.41 453 (1.46)
Whole fruits Total Fruit,
Whole Fruit
14.90 715 (2.31)
Whole grain breads, rice, pasta, and pastries
Whole Grains 6.22 312 (1.01)
Whole grain cereals Whole Grains 2.86 504 (1.63)
Popcorn and other whole grain snacks
Whole Grains 1.86 285 (0.92)
Whole milk, yogurt, and cream
Dairy 1.04 512 (1.65)
Lower fat and skim milk and lowfat yogurt
Dairy 11.90 1,320 (4.26)
All cheeses Dairy 0.75 1,513 (4.89)
Beef, pork, veal, lamb, and game
Total Protein Foods 5.87 175 (0.57)
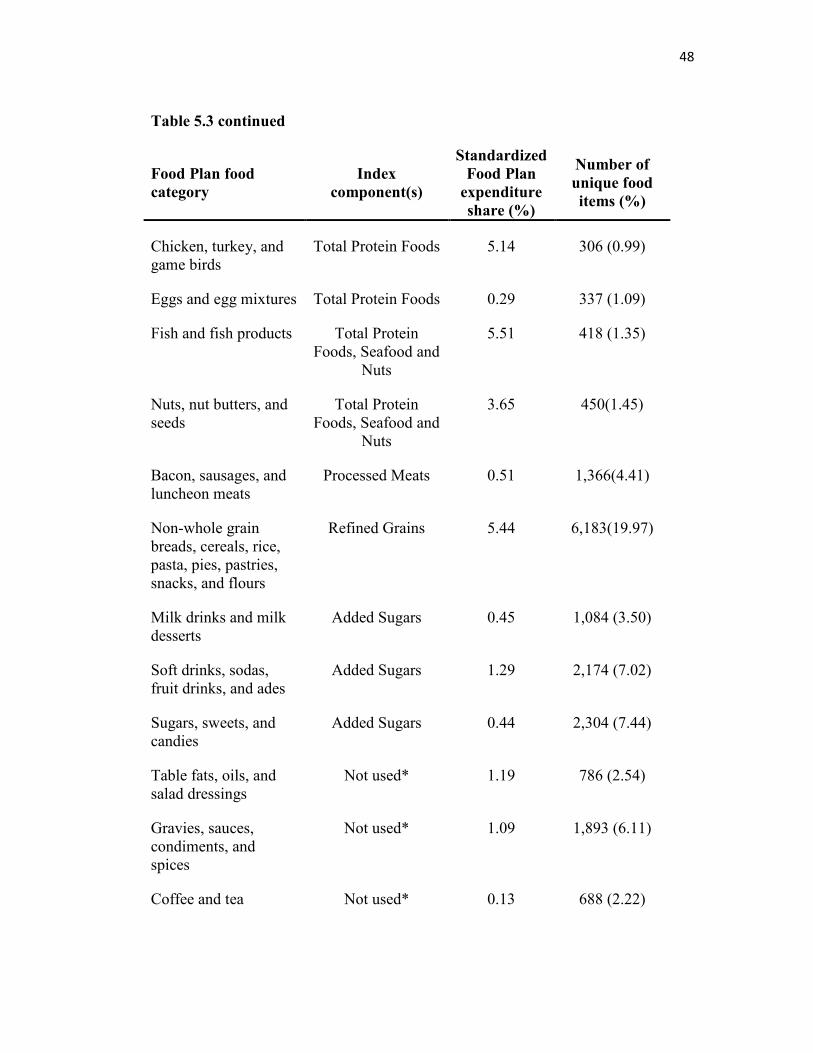
48
Table 5.3 continued
Food Plan food
category Index
component(s)
Standardized
Food Plan
expenditure
share (%)
Number of
unique food
items (%)
Chicken, turkey, and game birds
Total Protein Foods 5.14 306 (0.99)
Eggs and egg mixtures Total Protein Foods 0.29 337 (1.09)
Fish and fish products Total Protein Foods, Seafood and
Nuts
5.51 418 (1.35)
Nuts, nut butters, and seeds
Total Protein Foods, Seafood and
Nuts
3.65 450(1.45)
Bacon, sausages, and luncheon meats
Processed Meats 0.51 1,366(4.41)
Non-whole grain breads, cereals, rice, pasta, pies, pastries, snacks, and flours
Refined Grains 5.44 6,183(19.97)
Milk drinks and milk desserts
Added Sugars 0.45 1,084 (3.50)
Soft drinks, sodas, fruit drinks, and ades
Added Sugars 1.29 2,174 (7.02)
Sugars, sweets, and candies
Added Sugars 0.44 2,304 (7.44)
Table fats, oils, and salad dressings
Not used* 1.19 786 (2.54)
Gravies, sauces, condiments, and spices
Not used* 1.09 1,893 (6.11)
Coffee and tea Not used* 0.13 688 (2.22)
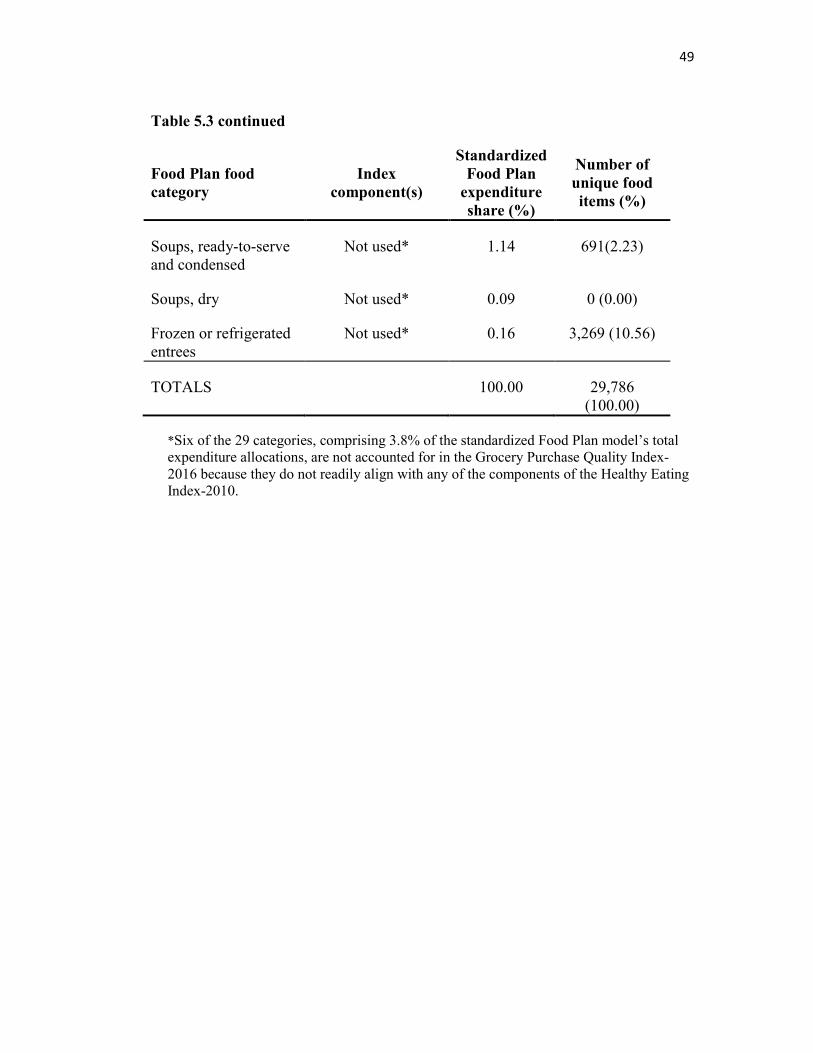
49
Table 5.3 continued
Food Plan food
category Index
component(s)
Standardized
Food Plan
expenditure
share (%)
Number of
unique food
items (%)
Soups, ready-to-serve and condensed
Not used* 1.14 691(2.23)
Soups, dry Not used* 0.09 0 (0.00)
Frozen or refrigerated entrees
Not used* 0.16 3,269 (10.56)
TOTALS 100.00 29,786 (100.00)
*Six of the 29 categories, comprising 3.8% of the standardized Food Plan model’s total expenditure allocations, are not accounted for in the Grocery Purchase Quality Index-2016 because they do not readily align with any of the components of the Healthy Eating Index-2010.
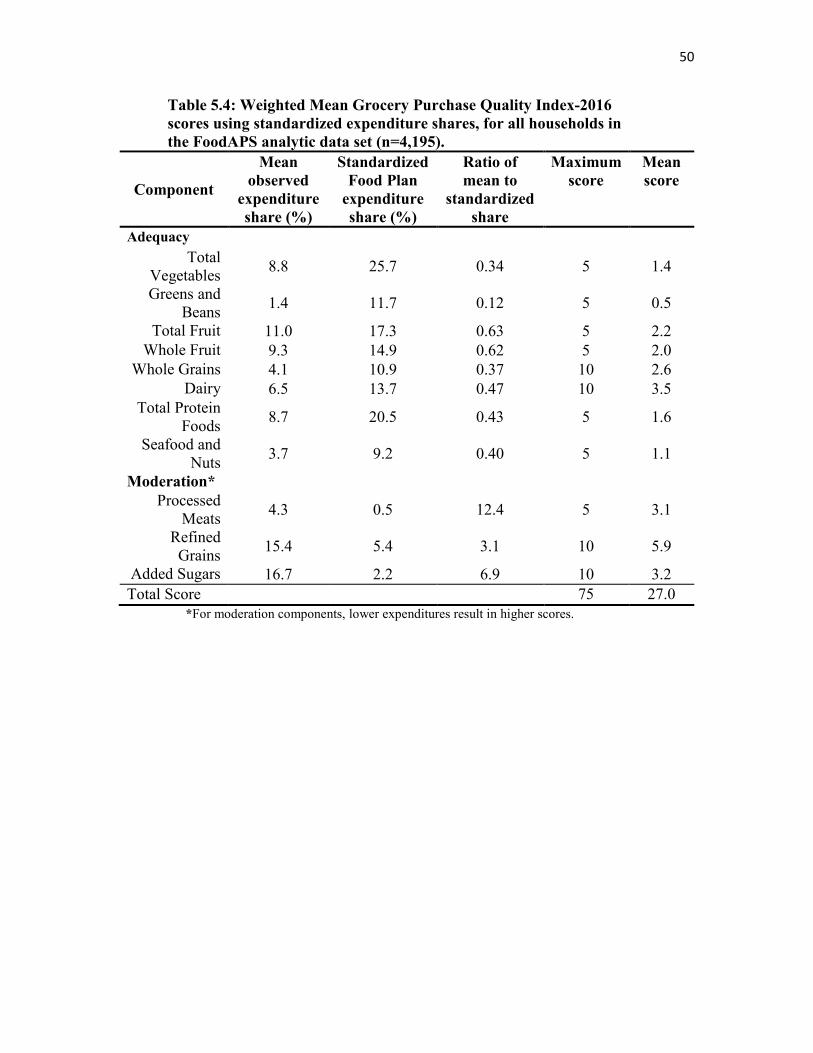
50
Table 5.4: Weighted Mean Grocery Purchase Quality Index-2016
scores using standardized expenditure shares, for all households in
the FoodAPS analytic data set (n=4,195).
Component
Mean
observed
expenditure
share (%)
Standardized
Food Plan
expenditure
share (%)
Ratio of
mean to
standardized
share
Maximum
score Mean
score
Adequacy
Total Vegetables
8.8 25.7 0.34 5 1.4
Greens and Beans
1.4 11.7 0.12 5 0.5
Total Fruit 11.0 17.3 0.63 5 2.2
Whole Fruit 9.3 14.9 0.62 5 2.0
Whole Grains 4.1 10.9 0.37 10 2.6
Dairy 6.5 13.7 0.47 10 3.5
Total Protein Foods
8.7 20.5 0.43 5 1.6
Seafood and Nuts
3.7 9.2 0.40 5 1.1
Moderation*
Processed Meats
4.3 0.5 12.4 5 3.1
Refined Grains
15.4 5.4 3.1 10 5.9
Added Sugars 16.7 2.2 6.9 10 3.2
Total Score
75 27.0
*For moderation components, lower expenditures result in higher scores.
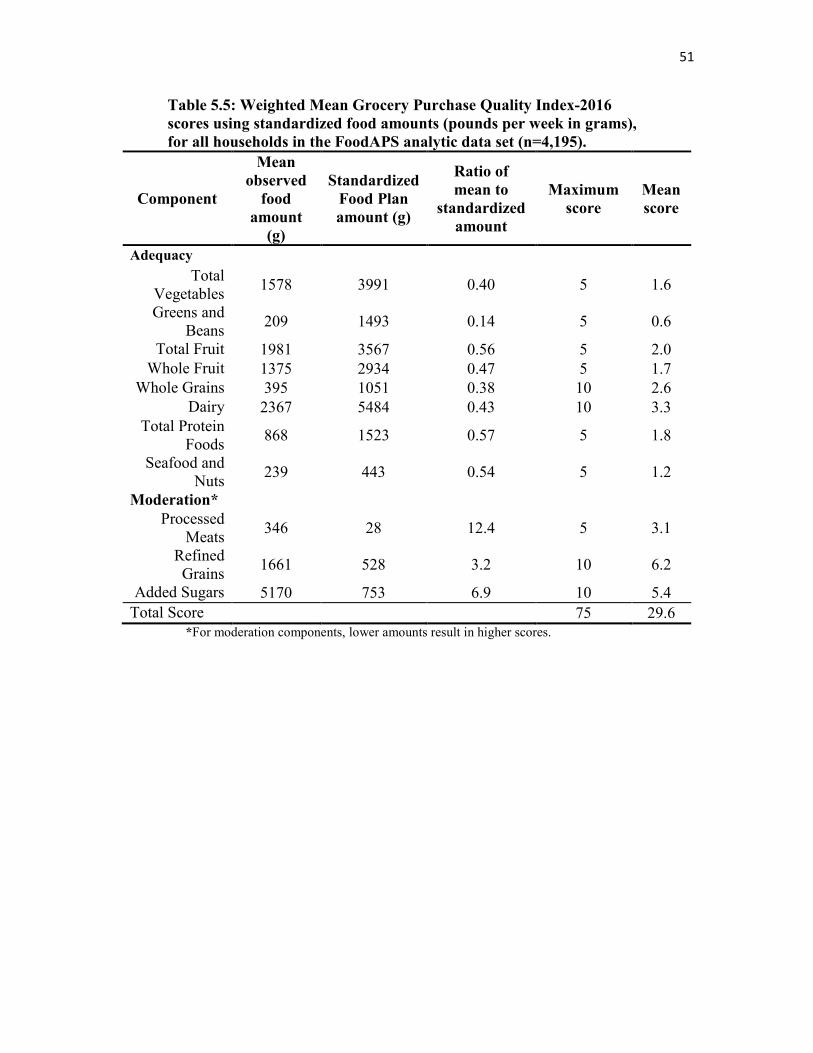
51
Table 5.5: Weighted Mean Grocery Purchase Quality Index-2016
scores using standardized food amounts (pounds per week in grams),
for all households in the FoodAPS analytic data set (n=4,195).
Component
Mean
observed
food
amount
(g)
Standardized
Food Plan
amount (g)
Ratio of
mean to
standardized
amount
Maximum
score Mean
score
Adequacy
Total Vegetables
1578 3991 0.40 5 1.6
Greens and Beans
209 1493 0.14 5 0.6
Total Fruit 1981 3567 0.56 5 2.0
Whole Fruit 1375 2934 0.47 5 1.7
Whole Grains 395 1051 0.38 10 2.6
Dairy 2367 5484 0.43 10 3.3
Total Protein Foods
868 1523 0.57 5 1.8
Seafood and Nuts
239 443 0.54 5 1.2
Moderation*
Processed Meats
346 28 12.4 5 3.1
Refined Grains
1661 528 3.2 10 6.2
Added Sugars 5170 753 6.9 10 5.4
Total Score 75 29.6 *For moderation components, lower amounts result in higher scores.

52
Table 5.6: Grocery Purchase Quality Index-
2016 scores using standardized expenditure
shares; correlation with HEI-2010 scores
(n=4195).
GPQI-2016
Component
HEI-2010
Component
Weighted
Pearson’s
Correlation
Coefficient*
Adequacy Adequacy
Total Vegetables
Total Vegetables
0.71
Greens and Beans
Greens and Beans
0.59
Total Fruit Total Fruit 0.85
Whole Fruit Whole Fruit 0.86
Whole Grains Whole Grains 0.85
Dairy Dairy 0.65
Total Protein Foods
Total Protein Foods
0.62
Seafood and Nuts
Seafood and Nuts
0.67
Moderation Moderation
Refined Grains
Refined Grains
0.55
Added Sugars Empty Calories
0.41
Total Score Total Score 0.65
* p < 0.01
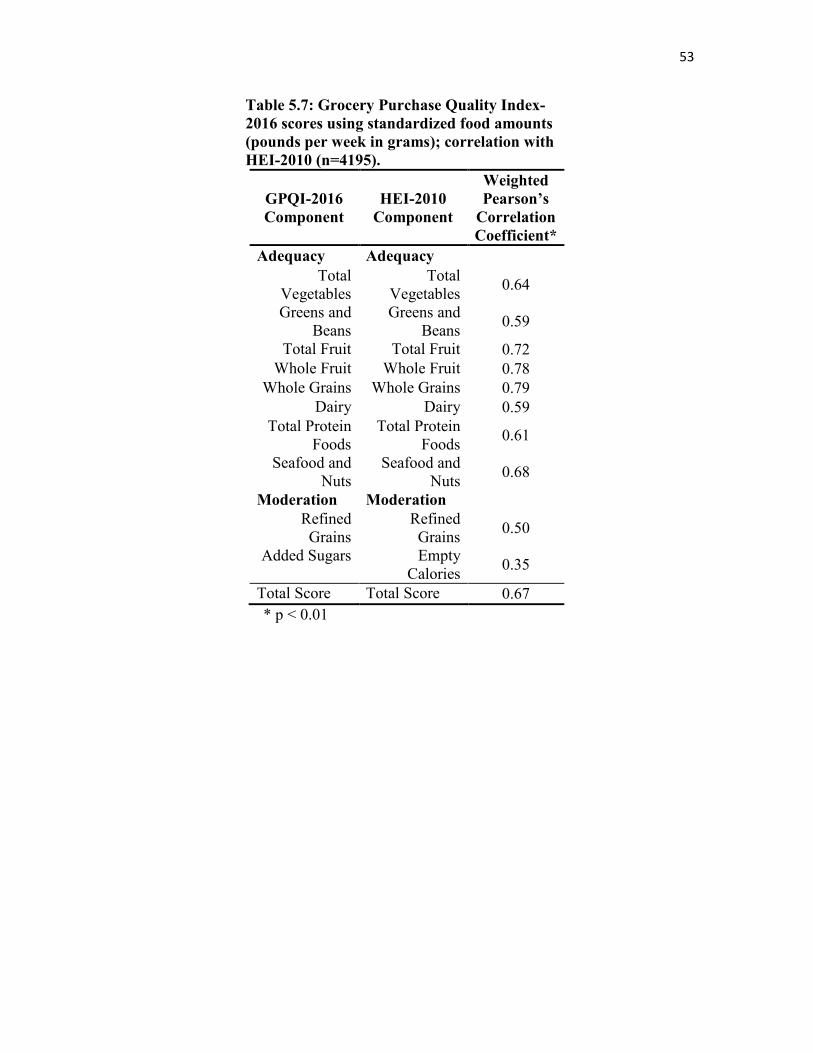
53
Table 5.7: Grocery Purchase Quality Index-
2016 scores using standardized food amounts
(pounds per week in grams); correlation with
HEI-2010 (n=4195).
GPQI-2016
Component
HEI-2010
Component
Weighted
Pearson’s
Correlation
Coefficient*
Adequacy Adequacy
Total Vegetables
Total Vegetables
0.64
Greens and Beans
Greens and Beans
0.59
Total Fruit Total Fruit 0.72
Whole Fruit Whole Fruit 0.78
Whole Grains Whole Grains 0.79
Dairy Dairy 0.59
Total Protein Foods
Total Protein Foods
0.61
Seafood and Nuts
Seafood and Nuts
0.68
Moderation Moderation
Refined Grains
Refined Grains
0.50
Added Sugars Empty Calories
0.35
Total Score Total Score 0.67
* p < 0.01
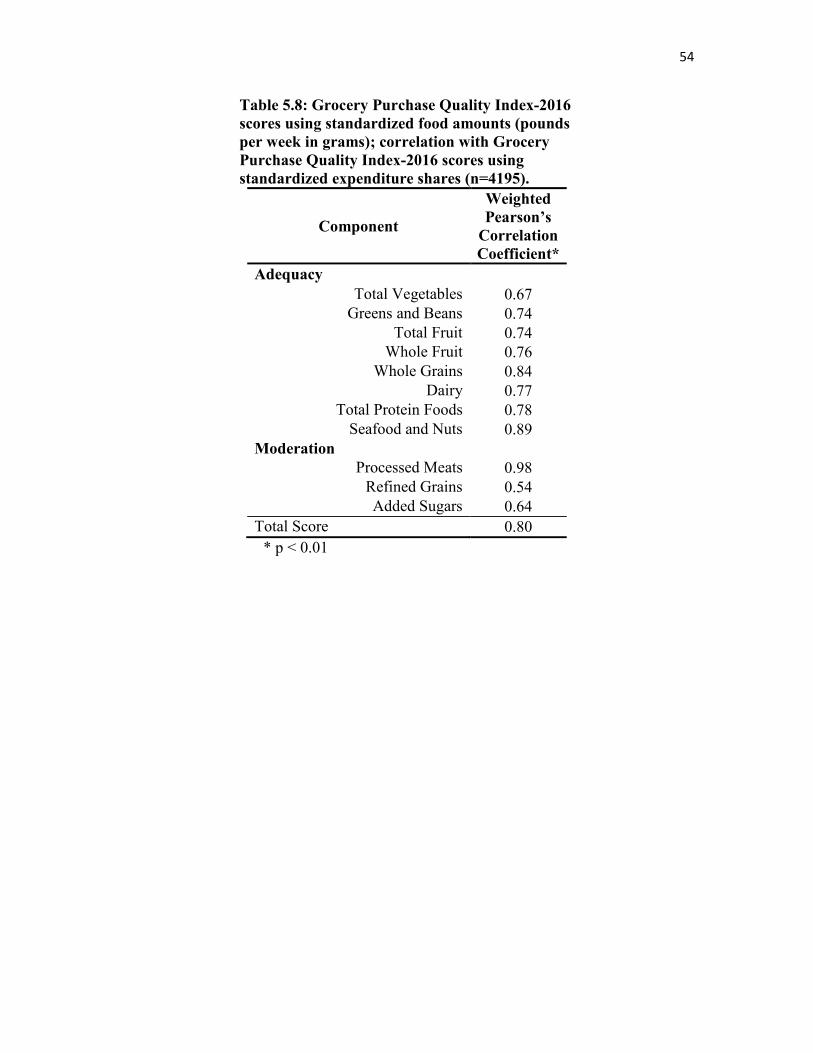
54
Table 5.8: Grocery Purchase Quality Index-2016
scores using standardized food amounts (pounds
per week in grams); correlation with Grocery
Purchase Quality Index-2016 scores using
standardized expenditure shares (n=4195).
Component
Weighted
Pearson’s
Correlation
Coefficient*
Adequacy
Total Vegetables 0.67
Greens and Beans 0.74
Total Fruit 0.74
Whole Fruit 0.76
Whole Grains 0.84
Dairy 0.77
Total Protein Foods 0.78
Seafood and Nuts 0.89
Moderation
Processed Meats 0.98
Refined Grains 0.54
Added Sugars 0.64
Total Score 0.80
* p < 0.01
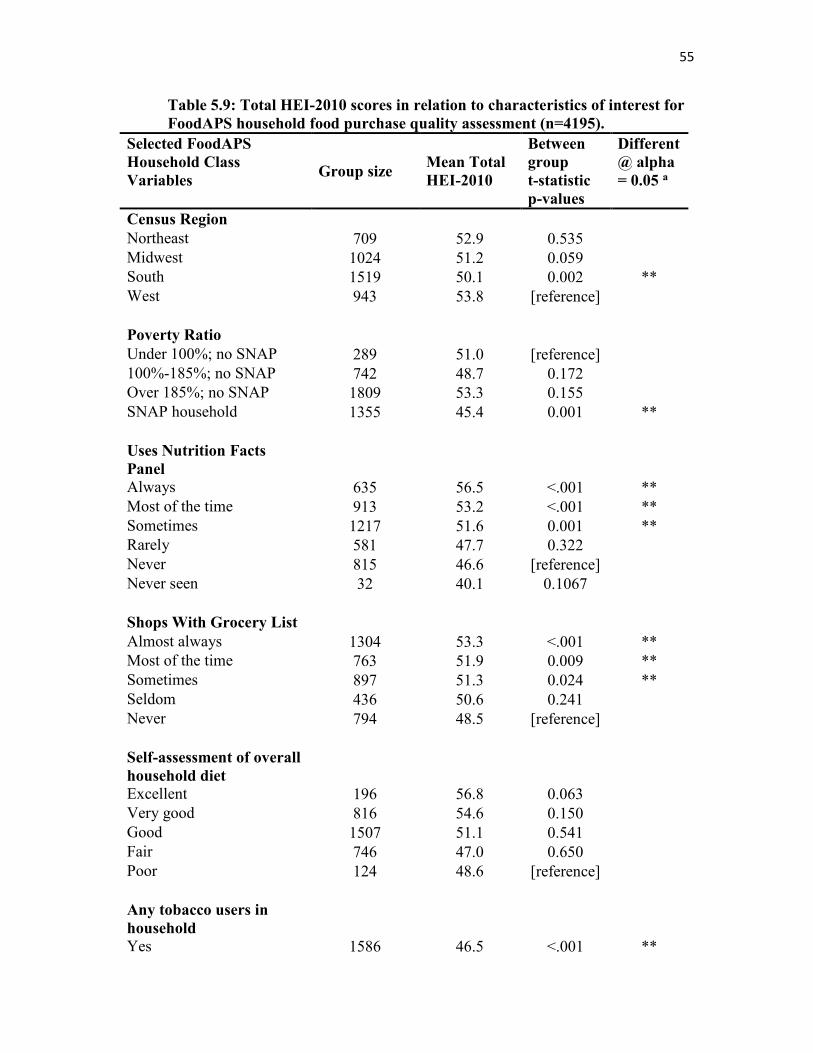
55
Table 5.9: Total HEI-2010 scores in relation to characteristics of interest for
FoodAPS household food purchase quality assessment (n=4195).
Selected FoodAPS
Household Class
Variables
Group size Mean Total
HEI-2010
Between
group
t-statistic
p-values
Different
@ alpha
= 0.05 a
Census Region
Northeast 709 52.9 0.535
Midwest 1024 51.2 0.059
South 1519 50.1 0.002 **
West 943 53.8 [reference]
Poverty Ratio
Under 100%; no SNAP 289 51.0 [reference]
100%-185%; no SNAP 742 48.7 0.172
Over 185%; no SNAP 1809 53.3 0.155
SNAP household 1355 45.4 0.001 **
Uses Nutrition Facts
Panel
Always 635 56.5 <.001 **
Most of the time 913 53.2 <.001 **
Sometimes 1217 51.6 0.001 **
Rarely 581 47.7 0.322
Never 815 46.6 [reference]
Never seen 32 40.1 0.1067
Shops With Grocery List
Almost always 1304 53.3 <.001 **
Most of the time 763 51.9 0.009 **
Sometimes 897 51.3 0.024 **
Seldom 436 50.6 0.241
Never 794 48.5 [reference]
Self-assessment of overall
household diet
Excellent 196 56.8 0.063
Very good 816 54.6 0.150
Good 1507 51.1 0.541
Fair 746 47.0 0.650
Poor 124 48.6 [reference]
Any tobacco users in
household
Yes 1586 46.5 <.001 **
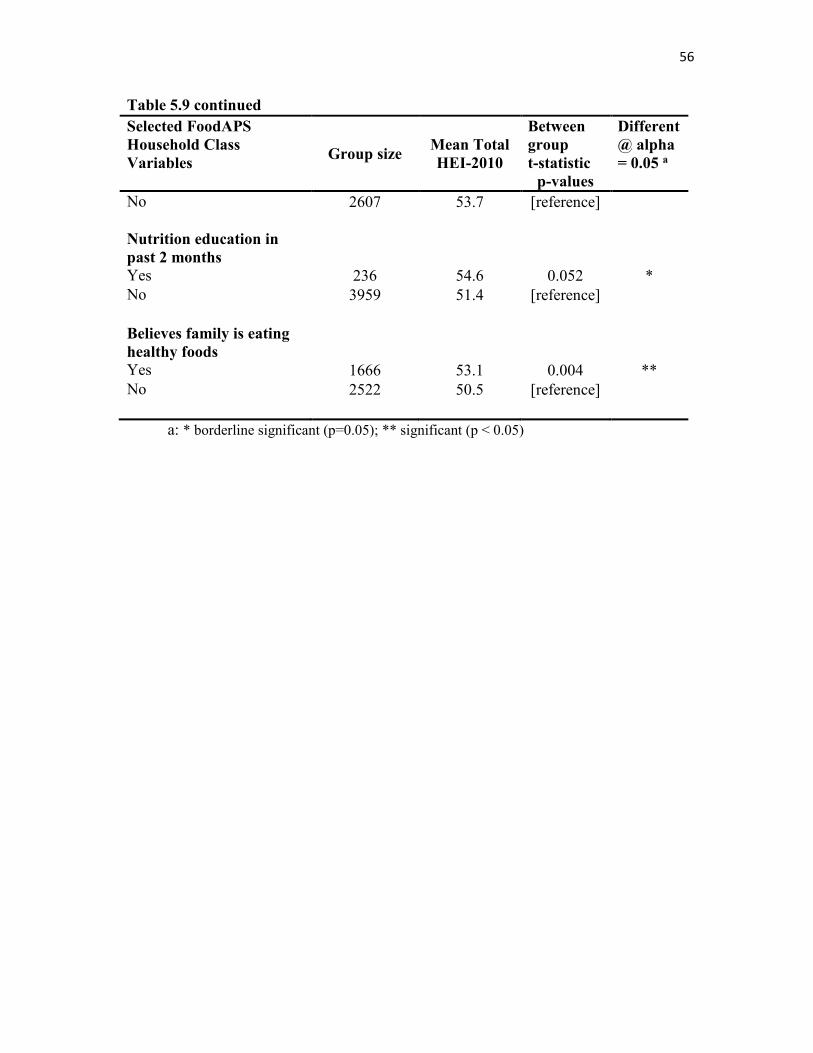
56
Table 5.9 continued
Selected FoodAPS
Household Class
Variables
Group size Mean Total
HEI-2010
Between
group
t-statistic
p-values
Different
@ alpha
= 0.05 a
No 2607 53.7 [reference]
Nutrition education in
past 2 months
Yes 236 54.6 0.052 *
No 3959 51.4 [reference]
Believes family is eating
healthy foods
Yes 1666 53.1 0.004 **
No 2522 50.5 [reference]
a: * borderline significant (p=0.05); ** significant (p < 0.05)
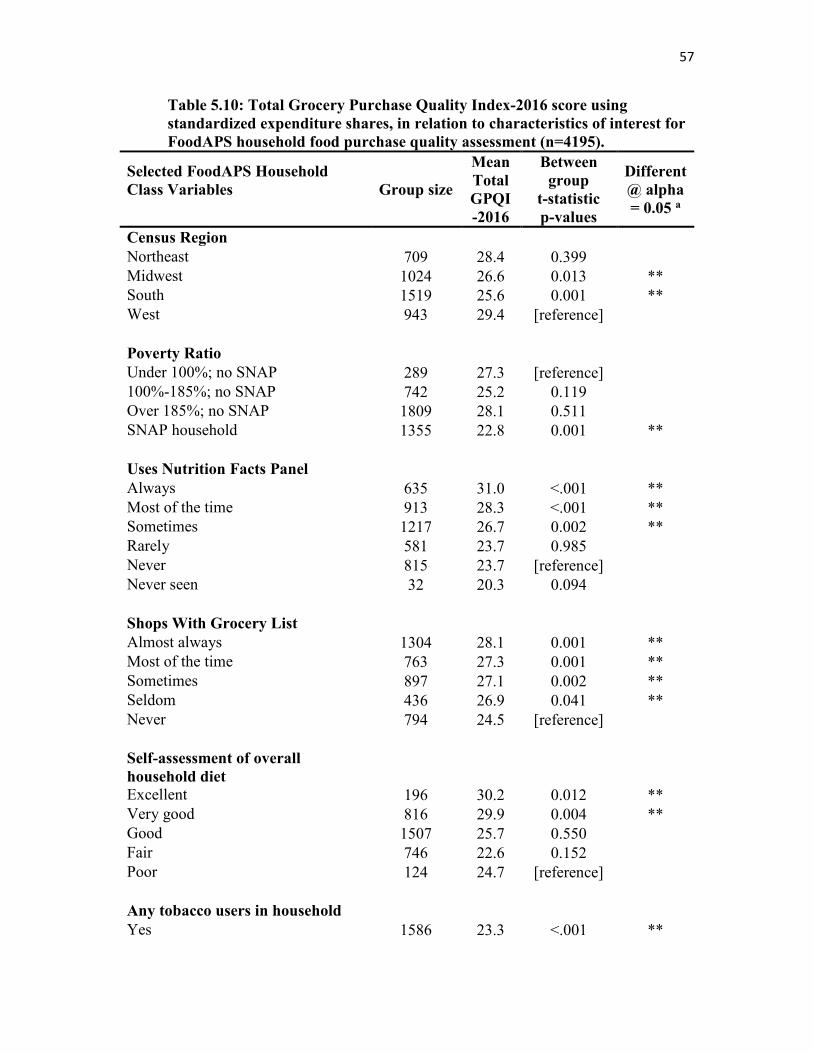
57
Table 5.10: Total Grocery Purchase Quality Index-2016 score using
standardized expenditure shares, in relation to characteristics of interest for
FoodAPS household food purchase quality assessment (n=4195).
Selected FoodAPS Household
Class Variables
Group size
Mean
Total
GPQI
-2016
Between
group
t-statistic
p-values
Different
@ alpha
= 0.05 a
Census Region
Northeast 709 28.4 0.399
Midwest 1024 26.6 0.013 **
South 1519 25.6 0.001 **
West 943 29.4 [reference]
Poverty Ratio
Under 100%; no SNAP 289 27.3 [reference]
100%-185%; no SNAP 742 25.2 0.119
Over 185%; no SNAP 1809 28.1 0.511
SNAP household 1355 22.8 0.001 **
Uses Nutrition Facts Panel
Always 635 31.0 <.001 **
Most of the time 913 28.3 <.001 **
Sometimes 1217 26.7 0.002 **
Rarely 581 23.7 0.985
Never 815 23.7 [reference]
Never seen 32 20.3 0.094
Shops With Grocery List
Almost always 1304 28.1 0.001 **
Most of the time 763 27.3 0.001 **
Sometimes 897 27.1 0.002 **
Seldom 436 26.9 0.041 **
Never 794 24.5 [reference]
Self-assessment of overall
household diet
Excellent 196 30.2 0.012 **
Very good 816 29.9 0.004 **
Good 1507 25.7 0.550
Fair 746 22.6 0.152
Poor 124 24.7 [reference]
Any tobacco users in household
Yes 1586 23.3 <.001 **
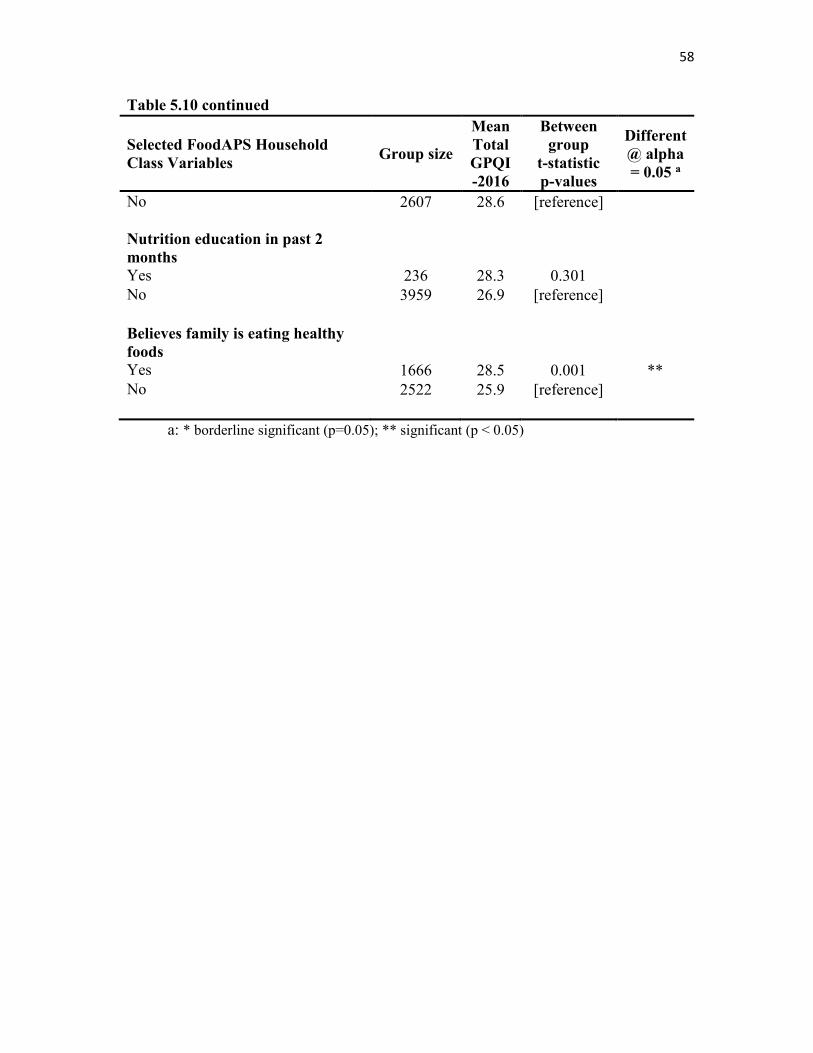
58
Table 5.10 continued
Selected FoodAPS Household
Class Variables Group size
Mean
Total
GPQI
-2016
Between
group
t-statistic
p-values
Different
@ alpha
= 0.05 a
No 2607 28.6 [reference]
Nutrition education in past 2
months
Yes 236 28.3 0.301
No 3959 26.9 [reference]
Believes family is eating healthy
foods
Yes 1666 28.5 0.001 **
No 2522 25.9 [reference]
a: * borderline significant (p=0.05); ** significant (p < 0.05)
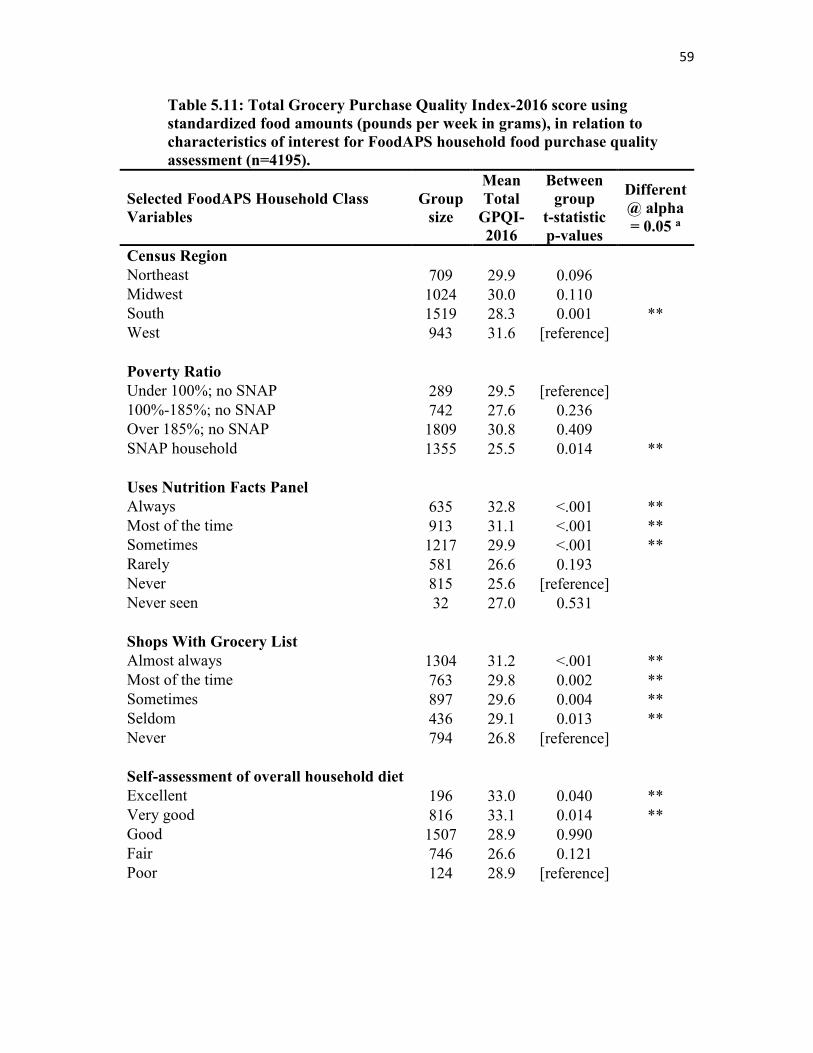
59
Table 5.11: Total Grocery Purchase Quality Index-2016 score using
standardized food amounts (pounds per week in grams), in relation to
characteristics of interest for FoodAPS household food purchase quality
assessment (n=4195).
Selected FoodAPS Household Class
Variables
Group
size
Mean
Total
GPQI-
2016
Between
group
t-statistic
p-values
Different
@ alpha
= 0.05 a
Census Region
Northeast 709 29.9 0.096
Midwest 1024 30.0 0.110
South 1519 28.3 0.001 **
West 943 31.6 [reference]
Poverty Ratio
Under 100%; no SNAP 289 29.5 [reference]
100%-185%; no SNAP 742 27.6 0.236
Over 185%; no SNAP 1809 30.8 0.409
SNAP household 1355 25.5 0.014 **
Uses Nutrition Facts Panel
Always 635 32.8 <.001 **
Most of the time 913 31.1 <.001 **
Sometimes 1217 29.9 <.001 **
Rarely 581 26.6 0.193
Never 815 25.6 [reference]
Never seen 32 27.0 0.531
Shops With Grocery List
Almost always 1304 31.2 <.001 **
Most of the time 763 29.8 0.002 **
Sometimes 897 29.6 0.004 **
Seldom 436 29.1 0.013 **
Never 794 26.8 [reference]
Self-assessment of overall household diet
Excellent 196 33.0 0.040 **
Very good 816 33.1 0.014 **
Good 1507 28.9 0.990
Fair 746 26.6 0.121
Poor 124 28.9 [reference]
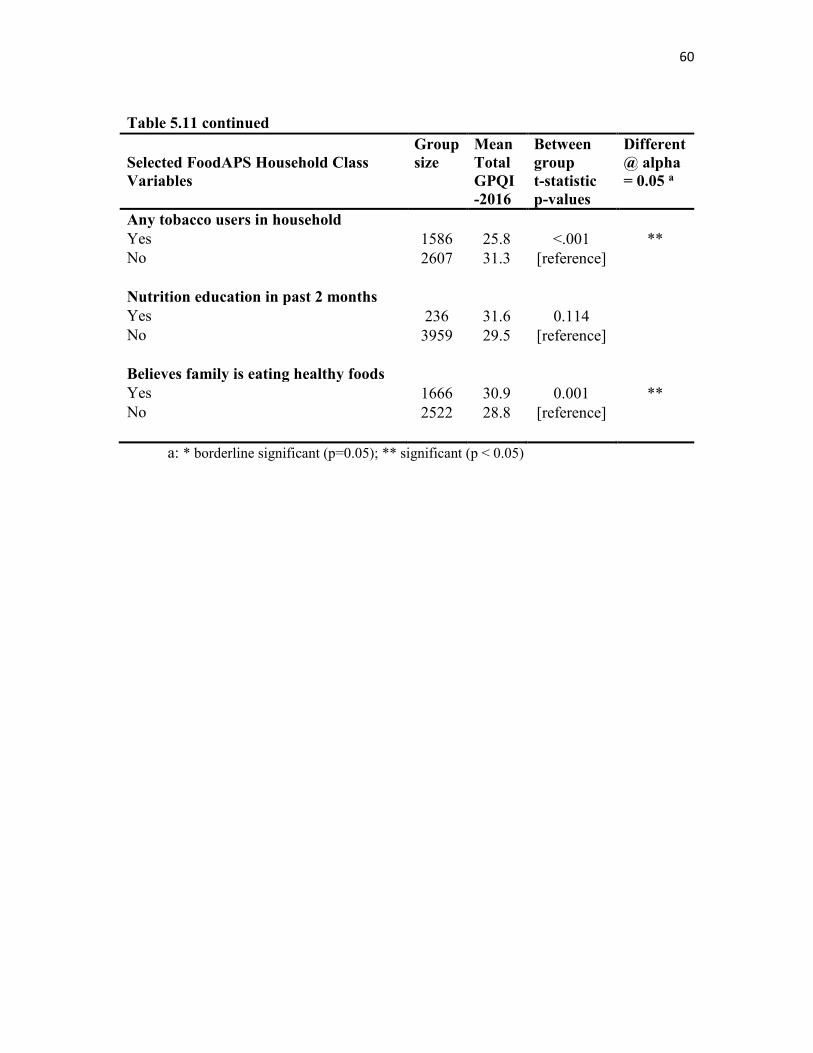
60
Table 5.11 continued
Selected FoodAPS Household Class
Variables
Group
size Mean
Total
GPQI
-2016
Between
group
t-statistic
p-values
Different
@ alpha
= 0.05 a
Any tobacco users in household
Yes 1586 25.8 <.001 **
No 2607 31.3 [reference]
Nutrition education in past 2 months
Yes 236 31.6 0.114
No 3959 29.5 [reference]
Believes family is eating healthy foods
Yes 1666 30.9 0.001 **
No 2522 28.8 [reference]
a: * borderline significant (p=0.05); ** significant (p < 0.05)
CHAPTER 6
FUTURE DIRECTIONS
Given a valid metric for assessing food purchase quality, it remains necessary to
translate and communicate the numeric scale of compliance with dietary standards, e.g.,
an HEI-2010 or a GPQI-2016 score, back into terms that a consumer household can
understand and use to improve the quality of the home food environment. Informatics
applications can be designed using a rule-based approach that will trigger messages if the
gap between observed and expected values exceeds a certain theoretical threshold (e.g.,
scores less than 50% of the maximum score per component). Alternative approaches may
include qualitative factors to assist consumers with the decisions they make in the store
while shopping and ‘nudge’ them in the direction of improved purchase food quality, by
casting those choices in more specific and familiar terms. The conceptual models
informing each of these approaches are the topic of this concluding chapter.
6.1 Alternative Directions in Decision Theory: How to Support Behavioral Change
Normative decision theory focuses on identifying the optimal -- most rational -- choice
from a set of alternatives, based on certain predefined criteria for what is to be considered
‘optimal,’ such as maximizing utility or value when shoppers select from products at
different prices in the marketplace [83-85]. Shoppers following scientific dietary
62
guidelines provide an example of normative decision making about nutrition, where the
goal, or optimal outcome, would be perfect adherence to the criteria set forth in the
guidelines, after accounting for any individual variables such as differences in daily energy
requirements, allergies, or medical conditions.
For normative decision theory, the idea is that the individual has systematically weighed
the available alternatives and exhausted all the relevant possibilities to arrive at the best
decision fitting the criteria for an optimal outcome. At a minimum, it must assume that the
criteria to be applied are already known. In that case, in theory, the more detailed the
information that is available, the more reliable the final decision will tend to be. In the
nutrition example, knowing the number of calories per serving for a given food product is
necessary in order for a consumer to estimate whether or not the choice to buy and consume
that food will cause them to exceed their daily energy requirements. According to this
branch of decision theory, additional information, such as the daily values on the Nutrition
Facts Panel, will also help an individual decide whether consumption of that item compares
positively or negatively with similar items on the shelf. As noted in the previous chapter
on the FoodAPS, use of the facts panel was associated with higher total scores in both the
HEI-2010 and the GPQI-2016 metrics.
Normative decision theory lends itself quite well to a rule-based computational model of
decision making: given this set of criteria and that set of inputs in each case, find the
optimal solution that fits the criteria most closely. Behavioral decision theory draws
attention to the significance of the many nonrational factors in human decision making,
such as the power of habit, the role of preferences, and the use of heuristics or short-cuts
and rough estimates when arriving at specific choices in specific situations. Its proponents
63
argue that it is necessary to account for the limited time and resources that human beings
are normally able to devote to even the most important decisions; that even when they
apply the logic to arrive at a decision using the logical model in normative theory, they
often stop short at solutions that are ‘good enough’ -- called ‘satisficing’ [86] --, in a given
situation or context, rather than continuing to spend time and energy exhausting further
possibilities in order to arrive at an optimal, or 100% correct, decision. Pragmatic choices
are more frequently reached in accordance with the so-called ‘80/20 rule’, without striving
for the perfectly optimal outcome. The idea informing heuristics is that a set of perceptual-
cognitive short-cuts and an ability to understand environmental cues have evolved and
allowed human beings to by-pass the necessity of thinking through each and every decision
from scratch, without sacrificing too much in either utility or accuracy. From this idea, it
follows that higher-order categories might be more quickly and easily recognized and
remembered than more detailed information when making everyday decisions. The idea
itself is not necessarily limited to decisions about food products, but several studies point
to the effective use of heuristics in consumers’ decisions about food [87, 88]. The
significance of these insights in the fields of consumer psychology, marketing research,
and consumer economics is elaborated in the literature, yet may seem counter-intuitive, at
best, in the case of dietary studies, where the goal of nutritional counseling and advice is
so often geared towards trying to break the power of habit and encourage a more thoughtful
and conscious perspective on diet in accordance with evidence-based guidance and
standards.
64
6.2 A Behavioral Theory Application Framework: Recommender Systems
One potential benefit of including behavioral factors to elucidate the conceptual
background for a food purchasing quality decision support or recommender system
application framework is to acknowledge the complex role of habitual behaviors in the
process [89-91]. Habitual dietary behaviors may cause an individual to resist recommended
changes or result in hesitation to try out new foods (‘food neophobia’); yet changes in
dietary behavior must become habitual in order to remain effective over time. There is also
a sense in which it is easier to reform existing habits by redirecting them in the right
direction, as it were, through so-called ‘nudges’, rather than trying to teach or create a new
set of habits from scratch. One hypothesis informing this work is that having a record of
household grocery purchasing behavior can serve as a proxy for existing dietary patterns
and habits, in the form of ‘revealed preferences’ [92], and that evaluating the quality of a
household’s prior food purchases can therefore indicate with greater specificity where
household habits might need to change in order to better conform with the guidelines, while
still keeping the formation of new habits within the familiar context of a given household’s
shopping history.
The current thesis is limited in scope and is not able to evaluate whether taking
purchasing history into account also increases the likelihood that a household will accept a
recommendation or try to follow it. However, that is an important topic for future research.
The literature [93] [94, 95] distinguishes three main approaches to building a
recommender system: 1) collaborative filtering identifies users with similar sets of
preferences and groups them into ‘neighborhoods’ based on a similarity metric; 2) content-
based filtering works with a set of item features, such as product type and item description,
65
to find related items to ones that a user has indicated a preference (high rating) for, and
may employ natural language preprocessing and information retrieval techniques to find
matching items; and 3) knowledge-based recommender systems, which leverage external
sources of information that may include business rules or predefined constraints to narrow
down the possible candidate items for recommendation, as well as domain ontologies with
concepts and terms to govern the recommendation process and messaging beyond what is
available at the descriptive level of an item catalog. Hybrid recommender systems combine
these approaches. There has also been some discussion of dynamic (interactive,
conversational) recommender systems, particularly to assist with the evaluation of a
system’s accuracy and usefulness.
In the context of nutrition informatics, there might be use cases where the collaborative
filtering model could be appropriate, such as web sites offering healthy recipes that a
community of users would rate and that could subsequently be recommended to others with
similar tastes and preferences. One possible obstacle confronting such a project scenario
would be the so-called ‘cold start problem’, since it might take time for a sufficiently large
and active user community to form and rate the recipes so that a recommender system using
collaborative filtering could issue useful recommendations. A larger issue with the ‘plain’
(or default) collaborative filtering model for recommendations is the sensitive question of
whether and to what extent reinforcing existing user preferences is advisable in a nutrition-
related context. So a hybrid combination of this technique with either a content-based or a
knowledge-based approach would likely prove necessary, such that only nutritious foods
and healthy recipes would be made available on the website (content-based criteria) or such
that users and their dietary preferences would be assessed and evaluated independently
66
(knowledge-based criteria), as a factor in their user profile, to reduce the chances that less-
healthy but ‘popular’ food choices would be propagated through the recommender system.
A different nutrition-related informatics project scenario might leverage data from pantry
shelf scans, food diaries, or retail food transactions as a form of implicit feedback for
generating recommendations, without explicit ratings of items by shoppers. Theoretically,
the transaction data could be comprised of restaurant food receipts as well as grocery item
purchases, but would need to be linked to an individual or a household as the ‘user ID’.
Here as well, it would be essential to inject external nutritional knowledge as a filter or
constraint into the recommendation process, so as to encourage behavioral change, as
necessary, rather than only reinforcing existing dietary preferences based on similarity with
other shoppers’ choices and consideration sets.
Conducting independent dietary assessments with a validated set of dietary quality scores
such as the Healthy Eating Index to generate profiles of dietary behavior a priori, and
including demographics such as age, gender, body mass index, and overall health status
indicators, would help to refine the recommendation process using knowledge-based
constraints. A recommender system could then be developed to take these behavioral
factors and dietary quality scores into account to ensure that, given similar user dietary
preferences or similar sets of food items, a ‘more healthy’ individual or household would
allow the system to personalize dietary recommendations to a ‘less healthy’ individual or
household, within the same recommender system ‘neighborhood’.
In accordance with the decision-theory perspective sketched here to contextualize future
use cases for a household food purchase quality scoring method, a combination (hybrid)
design for delivering recommendations and communicating guidance to consumers offers
67
promise in bridging the gap so often observed between dietary standards and dietary
behavior in the general population. As demonstrated earlier in the thesis, the guidance can
be operationalized in the form of food quality scores to assess a household’s level of
adherence to recommendations, but the task of rendering the guidance represented by these
scores meaningful to consumers as a practical step in inducing and maintaining behavioral
change is a vital step beyond its current scope.
REFERENCES
1. Backonja U, Kim K, Casper GR, Patton T, Ramly E, Brennan PF: Observations
of daily living: putting the "personal" in personal health records. NI 2012:
Proceedings of the 11th International Congress on Nursing Informatics, 2012:6. 2. Glanz K, Sallis JF, Saelens BE, Frank LD: Healthy nutrition environments:
concepts and measures. Am J Health Promot 2005, 19(5):330-333. 3. Reedy J, Krebs-Smith SM, Miller PE, Liese AD, Kahle LL, Park Y, Subar AF:
Higher diet quality is associated with decreased risk of all-cause,
cardiovascular disease, and cancer mortality among older adults. J Nutr 2014, 144(6):881-889.
4. Kant AK: Indexes of overall diet quality: a review. J Am Diet Assoc 1996,
96(8):785-791. 5. Waijers PM, Feskens EJ, Ocke MC: A critical review of predefined diet quality
scores. Br J Nutr 2007, 97(2):219-231. 6. Kourlaba G, Panagiotakos DB: Dietary quality indices and human health: A
review. Maturitas 2009, 62(1):1-8. 7. Arvaniti F, Panagiotakos DB: Healthy indexes in public health practice and
research: a review. Crit Rev Food Sci Nutr 2008, 48(4):317-327. 8. Hu FB: Dietary pattern analysis: a new direction in nutritional epidemiology.
Curr Opin Lipidol 2002, 13(1):3-9. 9. Moeller SM, Reedy J, Millen AE, Dixon LB, Newby PK, Tucker KL, Krebs-Smith
SM, Guenther PM: Dietary patterns: challenges and opportunities in dietary
patterns research an Experimental Biology workshop, April 1, 2006. J Am Diet
Assoc 2007, 107(7):1233-1239. 10. Jacobson HN, Stanton JL: Pattern analysis in nutrition. Clin Nutr 1986, 5(6):249-
253. 11. Kant AK: Dietary patterns and health outcomes. J Am Diet Assoc 2004,
104(4):615-635.
69
12. Trichopoulos D, Lagiou P: Dietary patterns and mortality. Br J Nutr 2001, 85(2):133-134.
13. Willett WC, McCullough ML: Dietary pattern analysis for the evaluation of
dietary guidelines. Asia Pac J Clin Nutr 2008, 17 Suppl 1:75-78. 14. French SA, Shimotsu ST, Wall M, Gerlach AF: Capturing the spectrum of
household food and beverage purchasing behavior: a review. J Am Diet Assoc
2008, 108(12):2051-2058. 15. Martin SL, Howell T, Duan Y, Walters M: The feasibility and utility of grocery
receipt analyses for dietary assessment. Nutr J 2006, 5:10. 16. Greenwood DC, Ransley JK, Gilthorpe MS, Cade JE: Use of itemized till receipts
to adjust for correlated dietary measurement error. Am J Epidemiol 2006, 164(10):1012-1018.
17. Ransley JK, Donnelly JK, Botham H, Khara TN, Greenwood DC, Cade JE: Use of
supermarket receipts to estimate energy and fat content of food purchased by
lean and overweight families. Appetite 2003, 41(2):141-148. 18. Ransley JK, Donnelly JK, Khara TN, Botham H, Arnot H, Greenwood DC, Cade
JE: The use of supermarket till receipts to determine the fat and energy intake
in a UK population. Public Health Nutr 2001, 4(6):1279-1286. 19. French SA, Wall M, Mitchell NR, Shimotsu ST, Welsh E: Annotated receipts
capture household food purchases from a broad range of sources. Int J Behav
Nutr Phys Act 2009, 6:37. 20. Cullen K, Baranowski T, Watson K, Nicklas T, Fisher J, O’Donnell S, Baranowski
J, Islam N, Missaghian M: Food category purchases vary by household
education and race/ethnicity: Results from grocery receipts. J Am Diet Assoc
2007, 107(10):1747-1752. 21. Harnack L, Oakes JM, Elbel B, Beatty T, Rydell S, French S: Effects of subsidies
and prohibitions on nutrition in a food benefit program: A randomized clinical
trial. JAMA Intern Med 2016, 176(11): 1610-18. 22. Stevens J, Bryant M, Wang L, Borja J, Bentley ME: Exhaustive measurement of
food items in the home using a universal product code scanner. Public Health
Nutr 2011, 14(2):314-318. 23. Weinstein JL, Phillips V, MacLeod E, Arsenault M, Ferris AM: A universal
product code scanner is a feasible method of measuring household food
inventory and food use patterns in low-income families. J Am Diet Assoc 2006, 106(3):443-445.
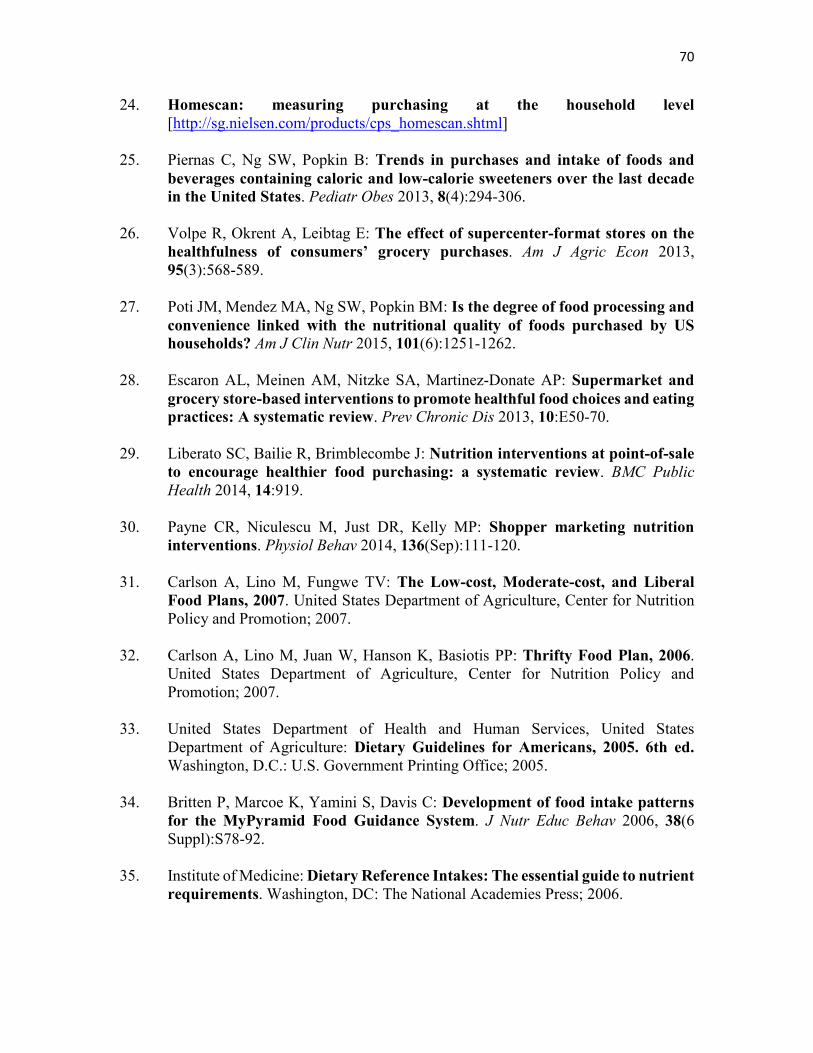
70
24. Homescan: measuring purchasing at the household level
[http://sg.nielsen.com/products/cps_homescan.shtml] 25. Piernas C, Ng SW, Popkin B: Trends in purchases and intake of foods and
beverages containing caloric and low-calorie sweeteners over the last decade
in the United States. Pediatr Obes 2013, 8(4):294-306. 26. Volpe R, Okrent A, Leibtag E: The effect of supercenter-format stores on the
healthfulness of consumers’ grocery purchases. Am J Agric Econ 2013, 95(3):568-589.
27. Poti JM, Mendez MA, Ng SW, Popkin BM: Is the degree of food processing and
convenience linked with the nutritional quality of foods purchased by US
households? Am J Clin Nutr 2015, 101(6):1251-1262. 28. Escaron AL, Meinen AM, Nitzke SA, Martinez-Donate AP: Supermarket and
grocery store-based interventions to promote healthful food choices and eating
practices: A systematic review. Prev Chronic Dis 2013, 10:E50-70. 29. Liberato SC, Bailie R, Brimblecombe J: Nutrition interventions at point-of-sale
to encourage healthier food purchasing: a systematic review. BMC Public
Health 2014, 14:919. 30. Payne CR, Niculescu M, Just DR, Kelly MP: Shopper marketing nutrition
interventions. Physiol Behav 2014, 136(Sep):111-120. 31. Carlson A, Lino M, Fungwe TV: The Low-cost, Moderate-cost, and Liberal
Food Plans, 2007. United States Department of Agriculture, Center for Nutrition Policy and Promotion; 2007.
32. Carlson A, Lino M, Juan W, Hanson K, Basiotis PP: Thrifty Food Plan, 2006.
United States Department of Agriculture, Center for Nutrition Policy and Promotion; 2007.
33. United States Department of Health and Human Services, United States
Department of Agriculture: Dietary Guidelines for Americans, 2005. 6th ed. Washington, D.C.: U.S. Government Printing Office; 2005.
34. Britten P, Marcoe K, Yamini S, Davis C: Development of food intake patterns
for the MyPyramid Food Guidance System. J Nutr Educ Behav 2006, 38(6 Suppl):S78-92.
35. Institute of Medicine: Dietary Reference Intakes: The essential guide to nutrient
requirements. Washington, DC: The National Academies Press; 2006.
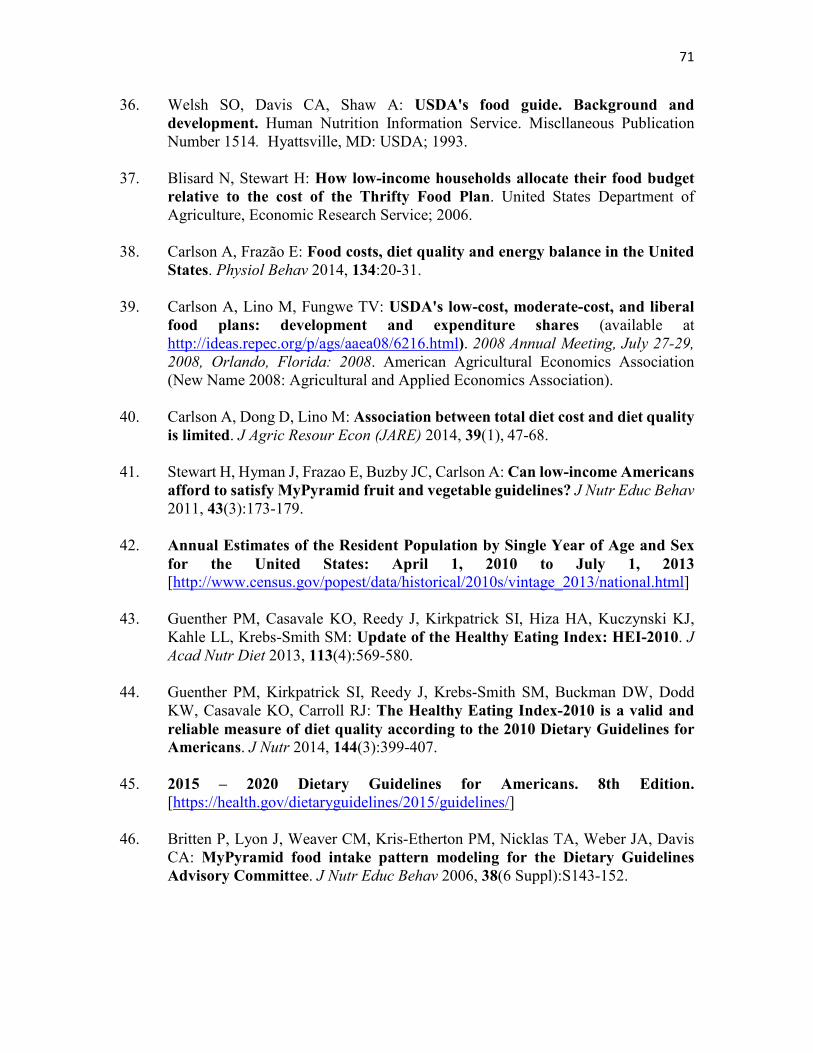
71
36. Welsh SO, Davis CA, Shaw A: USDA's food guide. Background and
development. Human Nutrition Information Service. Miscllaneous Publication Number 1514. Hyattsville, MD: USDA; 1993.
37. Blisard N, Stewart H: How low-income households allocate their food budget
relative to the cost of the Thrifty Food Plan. United States Department of Agriculture, Economic Research Service; 2006.
38. Carlson A, Frazão E: Food costs, diet quality and energy balance in the United
States. Physiol Behav 2014, 134:20-31. 39. Carlson A, Lino M, Fungwe TV: USDA's low-cost, moderate-cost, and liberal
food plans: development and expenditure shares (available at http://ideas.repec.org/p/ags/aaea08/6216.html). 2008 Annual Meeting, July 27-29,
2008, Orlando, Florida: 2008. American Agricultural Economics Association (New Name 2008: Agricultural and Applied Economics Association).
40. Carlson A, Dong D, Lino M: Association between total diet cost and diet quality
is limited. J Agric Resour Econ (JARE) 2014, 39(1), 47-68. 41. Stewart H, Hyman J, Frazao E, Buzby JC, Carlson A: Can low-income Americans
afford to satisfy MyPyramid fruit and vegetable guidelines? J Nutr Educ Behav
2011, 43(3):173-179. 42. Annual Estimates of the Resident Population by Single Year of Age and Sex
for the United States: April 1, 2010 to July 1, 2013
[http://www.census.gov/popest/data/historical/2010s/vintage_2013/national.html] 43. Guenther PM, Casavale KO, Reedy J, Kirkpatrick SI, Hiza HA, Kuczynski KJ,
Kahle LL, Krebs-Smith SM: Update of the Healthy Eating Index: HEI-2010. J
Acad Nutr Diet 2013, 113(4):569-580. 44. Guenther PM, Kirkpatrick SI, Reedy J, Krebs-Smith SM, Buckman DW, Dodd
KW, Casavale KO, Carroll RJ: The Healthy Eating Index-2010 is a valid and
reliable measure of diet quality according to the 2010 Dietary Guidelines for
Americans. J Nutr 2014, 144(3):399-407. 45. 2015 – 2020 Dietary Guidelines for Americans. 8th Edition.
[https://health.gov/dietaryguidelines/2015/guidelines/] 46. Britten P, Lyon J, Weaver CM, Kris-Etherton PM, Nicklas TA, Weber JA, Davis
CA: MyPyramid food intake pattern modeling for the Dietary Guidelines
Advisory Committee. J Nutr Educ Behav 2006, 38(6 Suppl):S143-152.
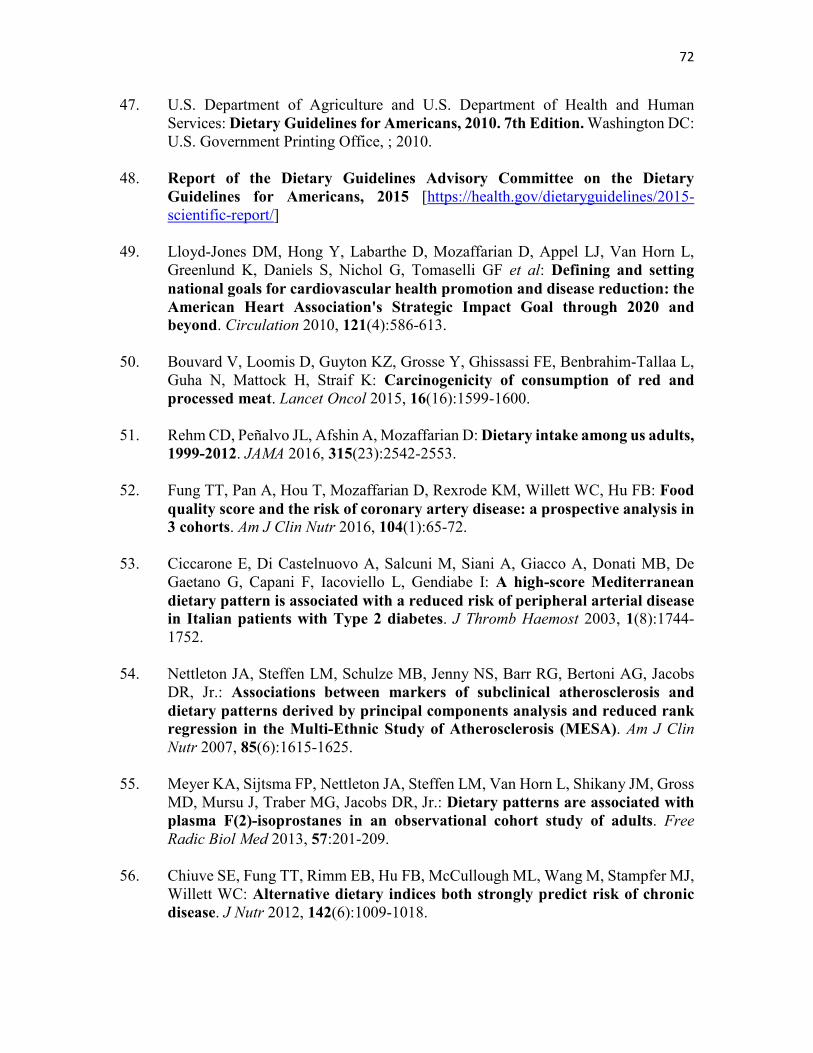
72
47. U.S. Department of Agriculture and U.S. Department of Health and Human Services: Dietary Guidelines for Americans, 2010. 7th Edition. Washington DC: U.S. Government Printing Office, ; 2010.
48. Report of the Dietary Guidelines Advisory Committee on the Dietary
Guidelines for Americans, 2015 [https://health.gov/dietaryguidelines/2015-scientific-report/]
49. Lloyd-Jones DM, Hong Y, Labarthe D, Mozaffarian D, Appel LJ, Van Horn L,
Greenlund K, Daniels S, Nichol G, Tomaselli GF et al: Defining and setting
national goals for cardiovascular health promotion and disease reduction: the
American Heart Association's Strategic Impact Goal through 2020 and
beyond. Circulation 2010, 121(4):586-613. 50. Bouvard V, Loomis D, Guyton KZ, Grosse Y, Ghissassi FE, Benbrahim-Tallaa L,
Guha N, Mattock H, Straif K: Carcinogenicity of consumption of red and
processed meat. Lancet Oncol 2015, 16(16):1599-1600. 51. Rehm CD, Peñalvo JL, Afshin A, Mozaffarian D: Dietary intake among us adults,
1999-2012. JAMA 2016, 315(23):2542-2553. 52. Fung TT, Pan A, Hou T, Mozaffarian D, Rexrode KM, Willett WC, Hu FB: Food
quality score and the risk of coronary artery disease: a prospective analysis in
3 cohorts. Am J Clin Nutr 2016, 104(1):65-72. 53. Ciccarone E, Di Castelnuovo A, Salcuni M, Siani A, Giacco A, Donati MB, De
Gaetano G, Capani F, Iacoviello L, Gendiabe I: A high-score Mediterranean
dietary pattern is associated with a reduced risk of peripheral arterial disease
in Italian patients with Type 2 diabetes. J Thromb Haemost 2003, 1(8):1744-1752.
54. Nettleton JA, Steffen LM, Schulze MB, Jenny NS, Barr RG, Bertoni AG, Jacobs
DR, Jr.: Associations between markers of subclinical atherosclerosis and
dietary patterns derived by principal components analysis and reduced rank
regression in the Multi-Ethnic Study of Atherosclerosis (MESA). Am J Clin
Nutr 2007, 85(6):1615-1625. 55. Meyer KA, Sijtsma FP, Nettleton JA, Steffen LM, Van Horn L, Shikany JM, Gross
MD, Mursu J, Traber MG, Jacobs DR, Jr.: Dietary patterns are associated with
plasma F(2)-isoprostanes in an observational cohort study of adults. Free
Radic Biol Med 2013, 57:201-209. 56. Chiuve SE, Fung TT, Rimm EB, Hu FB, McCullough ML, Wang M, Stampfer MJ,
Willett WC: Alternative dietary indices both strongly predict risk of chronic
disease. J Nutr 2012, 142(6):1009-1018.
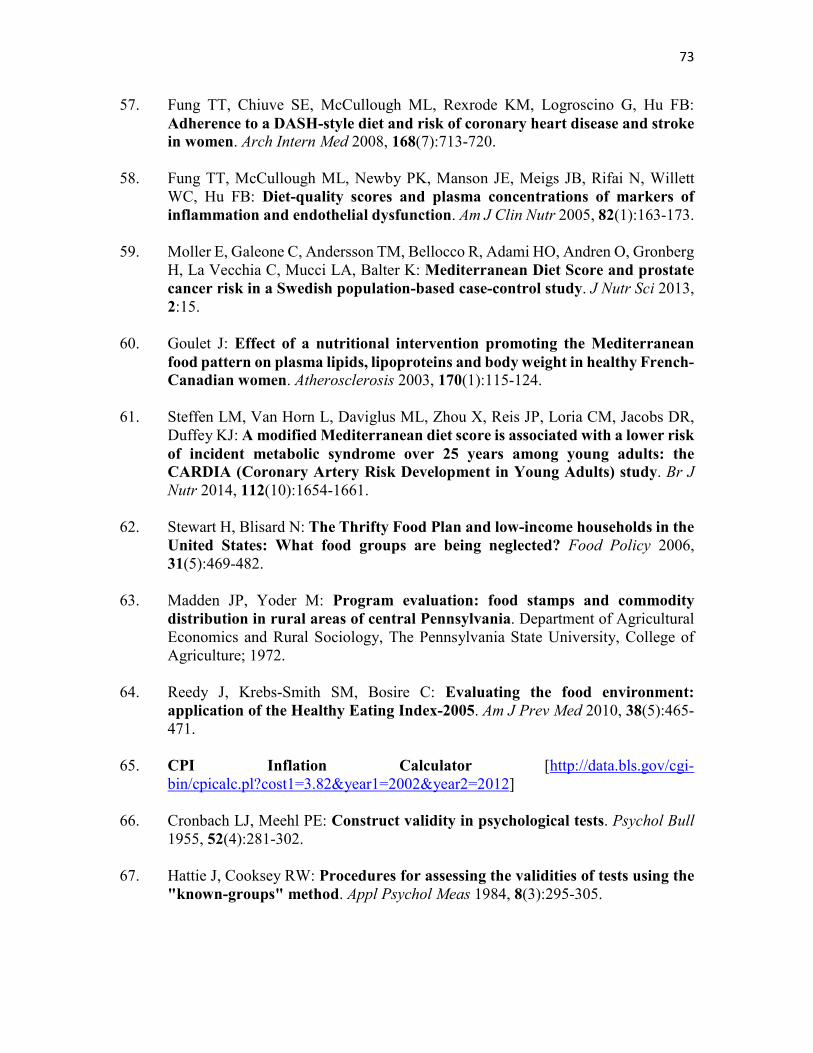
73
57. Fung TT, Chiuve SE, McCullough ML, Rexrode KM, Logroscino G, Hu FB:
Adherence to a DASH-style diet and risk of coronary heart disease and stroke
in women. Arch Intern Med 2008, 168(7):713-720. 58. Fung TT, McCullough ML, Newby PK, Manson JE, Meigs JB, Rifai N, Willett
WC, Hu FB: Diet-quality scores and plasma concentrations of markers of
inflammation and endothelial dysfunction. Am J Clin Nutr 2005, 82(1):163-173. 59. Moller E, Galeone C, Andersson TM, Bellocco R, Adami HO, Andren O, Gronberg
H, La Vecchia C, Mucci LA, Balter K: Mediterranean Diet Score and prostate
cancer risk in a Swedish population-based case-control study. J Nutr Sci 2013, 2:15.
60. Goulet J: Effect of a nutritional intervention promoting the Mediterranean
food pattern on plasma lipids, lipoproteins and body weight in healthy French-
Canadian women. Atherosclerosis 2003, 170(1):115-124. 61. Steffen LM, Van Horn L, Daviglus ML, Zhou X, Reis JP, Loria CM, Jacobs DR,
Duffey KJ: A modified Mediterranean diet score is associated with a lower risk
of incident metabolic syndrome over 25 years among young adults: the
CARDIA (Coronary Artery Risk Development in Young Adults) study. Br J
Nutr 2014, 112(10):1654-1661. 62. Stewart H, Blisard N: The Thrifty Food Plan and low-income households in the
United States: What food groups are being neglected? Food Policy 2006, 31(5):469-482.
63. Madden JP, Yoder M: Program evaluation: food stamps and commodity
distribution in rural areas of central Pennsylvania. Department of Agricultural Economics and Rural Sociology, The Pennsylvania State University, College of Agriculture; 1972.
64. Reedy J, Krebs-Smith SM, Bosire C: Evaluating the food environment:
application of the Healthy Eating Index-2005. Am J Prev Med 2010, 38(5):465-471.
65. CPI Inflation Calculator [http://data.bls.gov/cgi-
bin/cpicalc.pl?cost1=3.82&year1=2002&year2=2012] 66. Cronbach LJ, Meehl PE: Construct validity in psychological tests. Psychol Bull
1955, 52(4):281-302. 67. Hattie J, Cooksey RW: Procedures for assessing the validities of tests using the
"known-groups" method. Appl Psychol Meas 1984, 8(3):295-305.
74
68. Harris JE, Boushey C, Bruemmer B, Archer SL: Publishing nutrition research: a
review of nonparametric methods, part 3. J Am Diet Assoc 2008, 108(9):1488-1496.
69. SAS Institute Inc.: SAS Version 9.4. Cary NC; 2002-2012. 70. Centers for Disease Control Prevention: Current cigarette smoking among
adults - United States, 2011. MMWR Morb Mortal Wkly Rep 2012, 61(44):889-894.
71. The Gladson Nutrition Database [http://www.gladson.com/our-
services/nutrition-database] 72. Katz DL, Njike VY, Rhee LQ, Reingold A, Ayoob KT: Performance
characteristics of NuVal and the Overall Nutritional Quality Index (ONQI). Am J Clin Nutr 2010, 91(4):1102S-1108S.
73. NuVal® [http://www.nuval.com/] 74. Fischer LM, Sutherland LA, Kaley LA, Fox TA, Hasler CM, Nobel J, Kantor MA,
Blumberg J: Development and implementation of the guiding stars nutrition
guidance program. Am J Health Promot 2011, 26(2):55-63. 75. Sutherland LA, Kaley LA, Fischer L: Guiding Stars: the effect of a nutrition
navigation program on consumer purchases at the supermarket. Am J Clin
Nutr 2010, 91(4):1090S-1094S. 76. Guiding Stars® [http://guidingstars.com/] 77. Reedy J, Kirkpatrick SI: The use of proprietary nutrient profiling tools in
nutrition science and policy: a commentary. Am J Prev Med 2011, 40(5):581-582.
78. Chidambaram V, Brewster PJ, Jordan KC, Hurdle JF: qDIET: toward an
automated, self-sustaining knowledge base to facilitate linking point-of-sale
grocery items to nutritional content. AMIA Annu Symp Proc 2013, 2013:224-233.
79. Dallongeville J, Marecaux N, Fruchart JC, Amouyel P: Cigarette smoking is
associated with unhealthy patterns of nutrient intake: a meta-analysis. J Nutr
1998, 128(9):1450-1457. 80. FoodAPS National Household Food Acquisition and Purchase Survey
[https://www.ers.usda.gov/data-products/foodaps-national-household-food-acquisition-and-purchase-survey/]
75
81. Taylor R: Interpretation of the correlation coefficient: A basic review. J Diagn
Med Sonogr 1990, 6(1):35-39. 82. Hinkle DE, Wiersma W, Jurs SG: Applied statistics for the behavioral sciences,
4th edn. Boston: Houghton Mifflin; 1998. 83. Peterson M: An introduction to decision theory. New York: Cambridge
University Press; 2009. 84. French S: Decision theory: an introduction to the mathematics of rationality.
Chichester, UK: Ellis Horwood, Ltd. ; 1986. 85. Einhorn HJ, Hogarth RM: Behavioral decision theory: Processes of judgment
and choice. J Account Res 1981, 19(1):1-31. 86. Schwartz B, Ward A, Monterosso J, Lyubomirsky S, White K, Lehman DR:
Maximizing versus satisficing: happiness is a matter of choice. J Pers Soc
Psychol 2002, 83(5):1178-1197. 87. Schulte-Mecklenbeck M, Sohn M, de Bellis E, Martin N, Hertwig R: A lack of
appetite for information and computation. Simple heuristics in food choice. Appetite 2013, 71:242-251.
88. Scheibehenne B, Miesler L, Todd PM: Fast and frugal food choices: uncovering
individual decision heuristics. Appetite 2007, 49(3):578-589. 89. Guthrie J, Mancino L, Lin C-TJ: Nudging consumers toward better food choices:
Policy approaches to changing food consumption behaviors. Psychol Mark
2015, 32(5):501-511. 90. Rothschild ML: Carrots, sticks, and promises: A conceptual framework for the
management of public health and social issue behaviors. J Mark 1999, 63:24-37.
91. List JA, Samek AS: The behavioralist as nutritionist: Leveraging behavioral
economics to improve child food choice and consumption. J Health Econ 2015, 39:135-146.
92. Samuelson PA: Consumption theory in terms of revealed preference.
Economica 1948, 15(60):243-253. 93. Jannach D: Recommender systems : an introduction. New York: Cambridge
University Press; 2011.

76
94. Lops P, Gemmis M, Semeraro G: Content-based recommender systems: State
of the art and trends. In: Recommender Systems Handbook. Edited by Ricci F, Rokach L, Shapira B, Kantor PB: Springer US; 2011: 73-105.
95. Felfernig A, Friedrich G, Jannach D, Zanker M: Developing constraint-based
recommenders. In: Recommender Systems Handbook. Edited by Ricci F, Rokach L, Shapira B, Kantor PB: Springer US; 2011: 187-215.