Embed Size (px)
Citation preview
Measuring and Improving U.S. Construction Productivity
Chapman, R.E.
Office of Applied Economics, Building and Fire Research Laboratory, National Institute of Standards
and Technology
(email: [email protected])
Butry, D.T
Office of Applied Economics, Building and Fire Research Laboratory, National Institute of Standards
and Technology
(email: [email protected])
Huang, A.L.
Office of Applied Economics, Building and Fire Research Laboratory, National Institute of Standards
and Technology
(email: [email protected])
Abstract
Although the construction industry is a major component of the U.S. economy, it has experienced a
prolonged period of decline in productivity. Due to the critical lack of measurement methods,
however, the magnitude of the productivity problem in the U.S. construction industry is largely
unknown. To address these deficiencies, efforts are underway that focus on the measurement of
construction productivity at three levels: task, project, and industry. We discuss how such measures
can be developed, how they are related to the use of information and automation technologies and
construction processes over the life of the project, and how to build on several ongoing collaborative
efforts aimed at improving the efficiency, competitiveness, and innovation of the U.S. construction
industry. We identify and prioritize activities that have the greatest potential for improving the
productivity of the U.S. construction industry over the next 20 years. These activities include, but are
not limited to, interoperable technology applications via building information modelling (BIM) and
effective performance measurement to drive efficiency and support innovation. The paper concludes
with a vision for the future built around a suite of standards for measuring task and project-level
productivity, a database of task and project-level metrics, guidelines for efficient use of BIM and
modularization techniques, and industry-level metrics. Leaders in the U.S. construction industry are
aware of the successes and benefits that have accrued from the investments in measuring and
monitoring construction safety and can envision the potential for similar improvements in
construction productivity.
Keywords: building economics, construction, economic analysis, information technology, labor
productivity, metrics, performance measurement, productivity
1
1. Construction: an engine for economic growth
Construction is an engine of growth for the U.S. economy. Investment in plant and facilities, in the
form of construction activity, provides the basis for the production of products and the delivery of
services. Investment in infrastructure promotes the smooth flow of goods and services and the
movement of individuals. Investment in housing accommodates new households and allows existing
households to expand or improve their housing. It is clear that construction activities affect nearly
every aspect of the U.S. economy and that the industry is vital to the continued growth of the U.S.
economy.
In 2008, the construction industry’s contribution to gross domestic product (GDP) was $582 billion,
or 4.1 % of GDP (Bureau of Economic Analysis (BEA), 2009). In 2008, the value of construction put
in place was $1072 billion (Census Bureau, 2009). Construction also has a major impact on U.S.
employment. In 2008, 11.0 million persons were employed in the construction industry (Bureau of
Labor Statistics (BLS), 2009). This translates into 7.6 % of the total U.S. workforce. The
composition of the construction workforce differs from much of the U.S. workforce due to the large
number of self-employed workers (sole proprietorships and partnerships). Within the construction
industry, there are 1.8 million self-employed workers. The large number of self-employed workers
both reduces the size of the average firm and increases fragmentation within the construction industry,
where 79 % of construction establishments with employees have fewer than 10 employees (Census
Bureau, 2002a and 2002b). Both factors complicate the adoption of new technologies and practices.
Construction employment is affected by both the weather and the business cycle. Thus, year-to-year
changes in employment can be substantial, resulting in layoffs and hiring surges. The cyclical nature
of construction employment produces shortages in many highly-skilled trades. These shortages
adversely impact productivity in the construction industry. Finally, declining construction
productivity is exacerbated by the influx of unskilled labor from abroad, many of whom find their first
employment opportunity in the construction industry.
2. Productivity and competitiveness
Given the large impact of construction on the U.S. macroeconomic objectives, effective construction
research becomes critical to the economy. Key drivers for change in construction research are
sustainability and environmental security; competition due to globalization and offshoring;
infrastructure renewal; and information technology. The problem is that the U.S. construction
industry invests little in research relative to its significant GDP contribution to the economy. A
landmark study co-sponsored by the Civil Engineering Research Foundation (CERF) and the National
Science Foundation (NSF) involved a nationwide survey of civil engineering-related research and
development (R&D). The study, later published by CERF (1994), is especially noteworthy because it
includes R&D associated with each of the key construction industry stakeholders. The CERF study
reported that all key construction industry stakeholders combined invested in R&D at a rate that
corresponds to only 0.5 % of the value of construction put in place. This translates into approximately
$5.4 billion in 2008. A recently published NSF study covering companies performing industrial R&D
provides a useful contrast (NSF, 2009). Private sector R&D investments in manufacturing totaled
2
nearly $167 billion in 2007. Underinvesting reduces the potential for research-inspired innovations
that contribute to substantial national benefits—namely constructed facilities that are more user and
environmentally friendly, affordable, productive, and that are easier, faster, and more life-cycle cost
effective to build, operate, and maintain. Given the impact of construction spending on the U.S.
economy’s health, construction research becomes a critical variable in generating economic growth.
A recent article by Teicholz (2004) highlights the magnitude of the U.S. construction industry’s
perceived decline in productivity. As measured by constant contract dollars of new construction work
per field work hour, labor productivity in the construction industry has trended downward over the
past 40 years at an average compound rate of -0.6 % per year. That is, construction projects have
required significantly more field work hours per constant dollar of contract. This is particularly
alarming when compared to the increasing labor productivity in all non-farm industries, which has
trended upward at an average compound rate of 1.8 % per year. In other words, the construction
industry seriously lags other industries in developing labor saving ideas and in finding ways to
substitute equipment for labor. Teicholz reiterates the points noted earlier for their adverse impact on
construction labor productivity, namely the lack of R&D spending and fragmentation within the
industry. He also notes that despite the fact that there has been a significant adoption of new
information technology by the construction industry over the past 35 years, these applications tend to
run in a stand-alone mode that does not permit improved collaboration by the project team.
It should be noted that not everyone in the construction industry agrees with Teicholz’s assessment.
For example, Young and Bernstein (2006), in their McGraw Hill SmartMarket Report, contend that
the U.S. construction industry is making productivity improvements through innovation with new
technologies, processes, and services. Teicholz asserts, however, that a fragmented market with very
small players makes application of these innovations less frequent than desired for a healthy increase
in industry productivity. Another reason Teicholz finds declining productivity is that it focuses on
field work. For example, many of the improvements in construction productivity in the oil and gas
industries stem from the use of offsite fabrication facilities, where component production is well-
controlled and highly-automated (Construction Users Roundtable, 2007). The debate about whether
construction productivity is declining, holding its own, or increasing cannot be easily resolved,
because there are no industry-level measures of productivity for either the construction industry as a
whole or its components (i.e., commercial, industrial, infrastructure, and residential). Such measures
do exist for manufacturing, and they are routinely disseminated by the BLS.
To address these challenges, the National Institute of Standards and Technology (NIST) requested
that the National Research Council (NRC) appoint a committee of experts to provide advice for
advancing the competitiveness and productivity of the U.S. construction industry. The committee’s
specific task was to prepare a report that identified and prioritized technologies, processes, and
deployment activities that have the greatest potential to advance significantly the productivity and
competitiveness of the capital facilities sector of the U.S. construction industry over the next 20 years.
To gather data for its report, the NRC committee commissioned three white papers by industry
analysts and held a 2-day workshop in November 2008 to which 50 additional experts were invited.
A range of activities that could improve construction productivity were identified in the three
3
commissioned white papers, at the November 2008 workshop, and by the committee itself. From
among these, the committee identified five interrelated activities that could lead to breakthrough
improvements in construction efficiency and productivity in 2 to 10 years. These activities are
highlighted in the NRC report that states, ―If implemented throughout the capital facilities sector,
these activities could significantly advance construction efficiency and improve the quality,
timeliness, cost-effectiveness, and sustainability of construction projects.‖ (NRC, 2009) The five
activities, entitled ―Opportunities for Breakthrough Improvements,‖ are: (1) Widespread deployment
and use of interoperable technology applications, also called building information modeling (BIM);
(2) Improved job-site efficiency through more effective interfacing of people, processes, materials,
equipment, and information; (3) Greater use of prefabrication, preassembly, modularization, and off-
site fabrication techniques and processes; (4) Innovative, widespread use of demonstration
installations; and (5) Effective performance measurement to drive efficiency and support innovation
(NRC, 2009). Although the focus of this paper is on effective performance measurement (activity 5),
it also provides limited coverage of activities 1 through 4. Readers wishing in-depth discussions are
referred to the NRC report and NIST Special Publication 1101 (Huang et al., 2009).
3. Construction productivity: task, project, industry
The nature of the construction process points to a need for measures of construction productivity at
three levels: (1) task; (2) project; and (3) industry. Tasks refer to specific construction activities such
as concrete placement or structural steel erection. Projects are the collection of tasks required for the
construction of a new facility (e.g., the construction of a new commercial office building) or
renovation (i.e., additions, alterations, and major replacements) of an existing constructed facility.
Industry measures are based on the North American Industrial Classification System (NAICS) codes
for the construction sector and represent the total portfolio of projects.
Producing measures of construction productivity at each level involves the development of both
metrics (i.e., the definition of the appropriate measure that forms the basis for the calculation) and
tools (i.e., the means through which construction industry stakeholders can perform the calculation for
the selected metrics). Once produced, these metrics and tools will help construction industry
stakeholders make more cost-effective investments in productivity enhancing technologies and life-
cycle construction processes; they will also provide stakeholders with new measurement and
evaluation capabilities (Construction Industry Institute [CII], 2003a).
Leading industry groups, such as the Construction Industry Institute (CII, 2005), Construction Users
Roundtable (CURT), and FIATECH (FIATECH, 2004), have identified the critical need for fully
integrating and automating life-cycle construction processes. Having metrics and tools will address
that need and enable those industry groups and other stakeholders to: (1) evaluate the performance of
promising automation and integration technologies and (2) measure the value of real-time monitoring
and control of construction processes.
4
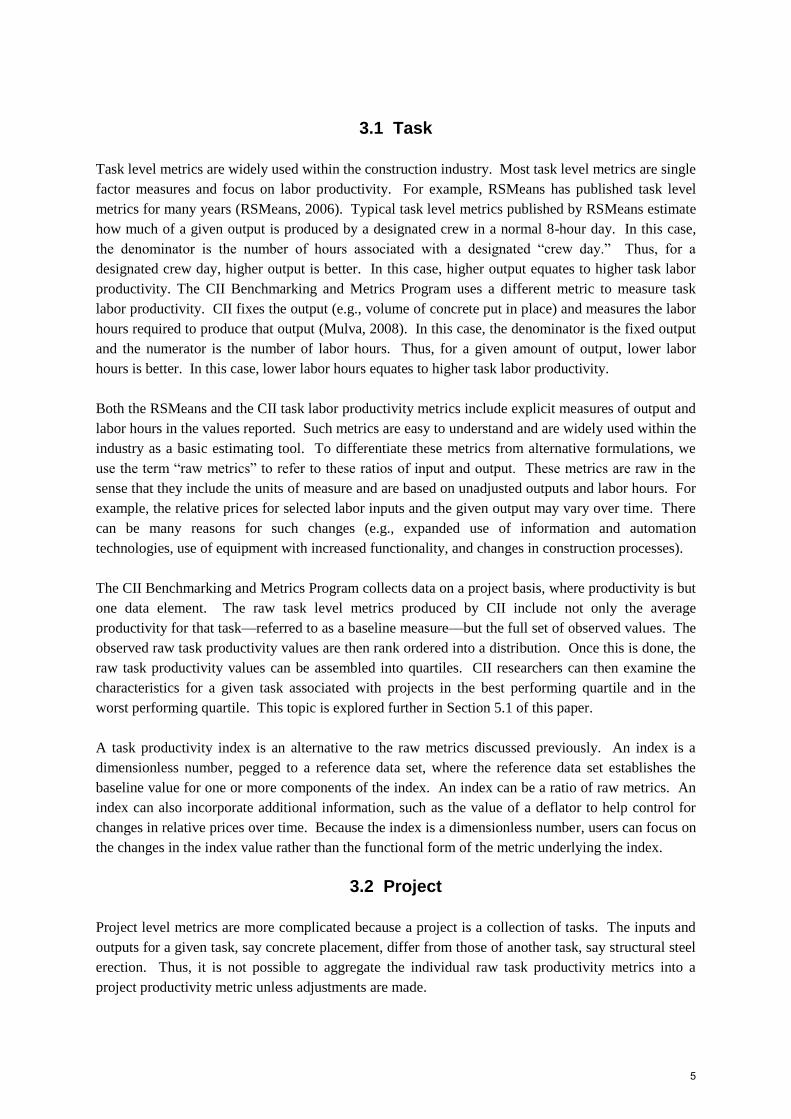
3.1 Task
Task level metrics are widely used within the construction industry. Most task level metrics are single
factor measures and focus on labor productivity. For example, RSMeans has published task level
metrics for many years (RSMeans, 2006). Typical task level metrics published by RSMeans estimate
how much of a given output is produced by a designated crew in a normal 8-hour day. In this case,
the denominator is the number of hours associated with a designated ―crew day.‖ Thus, for a
designated crew day, higher output is better. In this case, higher output equates to higher task labor
productivity. The CII Benchmarking and Metrics Program uses a different metric to measure task
labor productivity. CII fixes the output (e.g., volume of concrete put in place) and measures the labor
hours required to produce that output (Mulva, 2008). In this case, the denominator is the fixed output
and the numerator is the number of labor hours. Thus, for a given amount of output, lower labor
hours is better. In this case, lower labor hours equates to higher task labor productivity.
Both the RSMeans and the CII task labor productivity metrics include explicit measures of output and
labor hours in the values reported. Such metrics are easy to understand and are widely used within the
industry as a basic estimating tool. To differentiate these metrics from alternative formulations, we
use the term ―raw metrics‖ to refer to these ratios of input and output. These metrics are raw in the
sense that they include the units of measure and are based on unadjusted outputs and labor hours. For
example, the relative prices for selected labor inputs and the given output may vary over time. There
can be many reasons for such changes (e.g., expanded use of information and automation
technologies, use of equipment with increased functionality, and changes in construction processes).
The CII Benchmarking and Metrics Program collects data on a project basis, where productivity is but
one data element. The raw task level metrics produced by CII include not only the average
productivity for that task—referred to as a baseline measure—but the full set of observed values. The
observed raw task productivity values are then rank ordered into a distribution. Once this is done, the
raw task productivity values can be assembled into quartiles. CII researchers can then examine the
characteristics for a given task associated with projects in the best performing quartile and in the
worst performing quartile. This topic is explored further in Section 5.1 of this paper.
A task productivity index is an alternative to the raw metrics discussed previously. An index is a
dimensionless number, pegged to a reference data set, where the reference data set establishes the
baseline value for one or more components of the index. An index can be a ratio of raw metrics. An
index can also incorporate additional information, such as the value of a deflator to help control for
changes in relative prices over time. Because the index is a dimensionless number, users can focus on
the changes in the index value rather than the functional form of the metric underlying the index.
3.2 Project
Project level metrics are more complicated because a project is a collection of tasks. The inputs and
outputs for a given task, say concrete placement, differ from those of another task, say structural steel
erection. Thus, it is not possible to aggregate the individual raw task productivity metrics into a
project productivity metric unless adjustments are made.
5
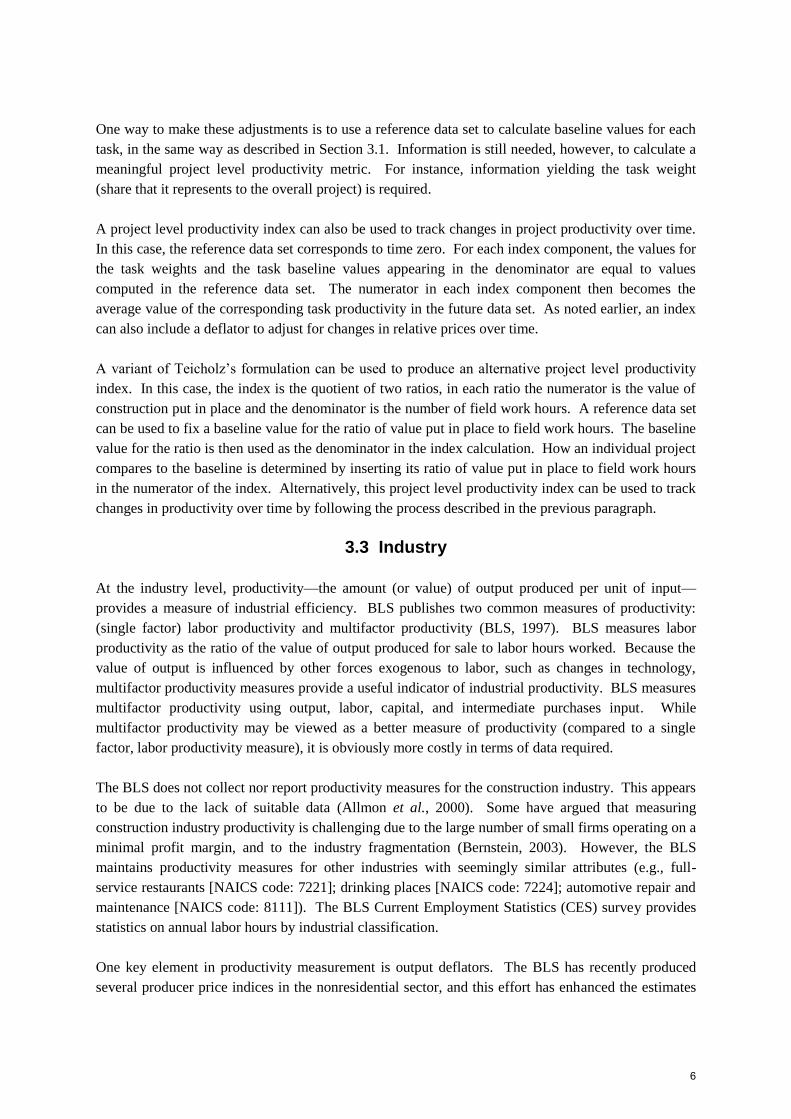
One way to make these adjustments is to use a reference data set to calculate baseline values for each
task, in the same way as described in Section 3.1. Information is still needed, however, to calculate a
meaningful project level productivity metric. For instance, information yielding the task weight
(share that it represents to the overall project) is required.
A project level productivity index can also be used to track changes in project productivity over time.
In this case, the reference data set corresponds to time zero. For each index component, the values for
the task weights and the task baseline values appearing in the denominator are equal to values
computed in the reference data set. The numerator in each index component then becomes the
average value of the corresponding task productivity in the future data set. As noted earlier, an index
can also include a deflator to adjust for changes in relative prices over time.
A variant of Teicholz’s formulation can be used to produce an alternative project level productivity
index. In this case, the index is the quotient of two ratios, in each ratio the numerator is the value of
construction put in place and the denominator is the number of field work hours. A reference data set
can be used to fix a baseline value for the ratio of value put in place to field work hours. The baseline
value for the ratio is then used as the denominator in the index calculation. How an individual project
compares to the baseline is determined by inserting its ratio of value put in place to field work hours
in the numerator of the index. Alternatively, this project level productivity index can be used to track
changes in productivity over time by following the process described in the previous paragraph.
3.3 Industry
At the industry level, productivity—the amount (or value) of output produced per unit of input—
provides a measure of industrial efficiency. BLS publishes two common measures of productivity:
(single factor) labor productivity and multifactor productivity (BLS, 1997). BLS measures labor
productivity as the ratio of the value of output produced for sale to labor hours worked. Because the
value of output is influenced by other forces exogenous to labor, such as changes in technology,
multifactor productivity measures provide a useful indicator of industrial productivity. BLS measures
multifactor productivity using output, labor, capital, and intermediate purchases input. While
multifactor productivity may be viewed as a better measure of productivity (compared to a single
factor, labor productivity measure), it is obviously more costly in terms of data required.
The BLS does not collect nor report productivity measures for the construction industry. This appears
to be due to the lack of suitable data (Allmon et al., 2000). Some have argued that measuring
construction industry productivity is challenging due to the large number of small firms operating on a
minimal profit margin, and to the industry fragmentation (Bernstein, 2003). However, the BLS
maintains productivity measures for other industries with seemingly similar attributes (e.g., full-
service restaurants [NAICS code: 7221]; drinking places [NAICS code: 7224]; automotive repair and
maintenance [NAICS code: 8111]). The BLS Current Employment Statistics (CES) survey provides
statistics on annual labor hours by industrial classification.
One key element in productivity measurement is output deflators. The BLS has recently produced
several producer price indices in the nonresidential sector, and this effort has enhanced the estimates
6
of investments in BEA’s National Income and Product Account tables. BEA and BLS may
collaborate further to develop other nonresidential building construction indexes, such as price
indexes for highways, hospitals, retail, communication, power, and lodging structures (Lally, 2009).
Efforts such as these improve the quality of existing statistics and have spillover benefits for
productivity measurement.
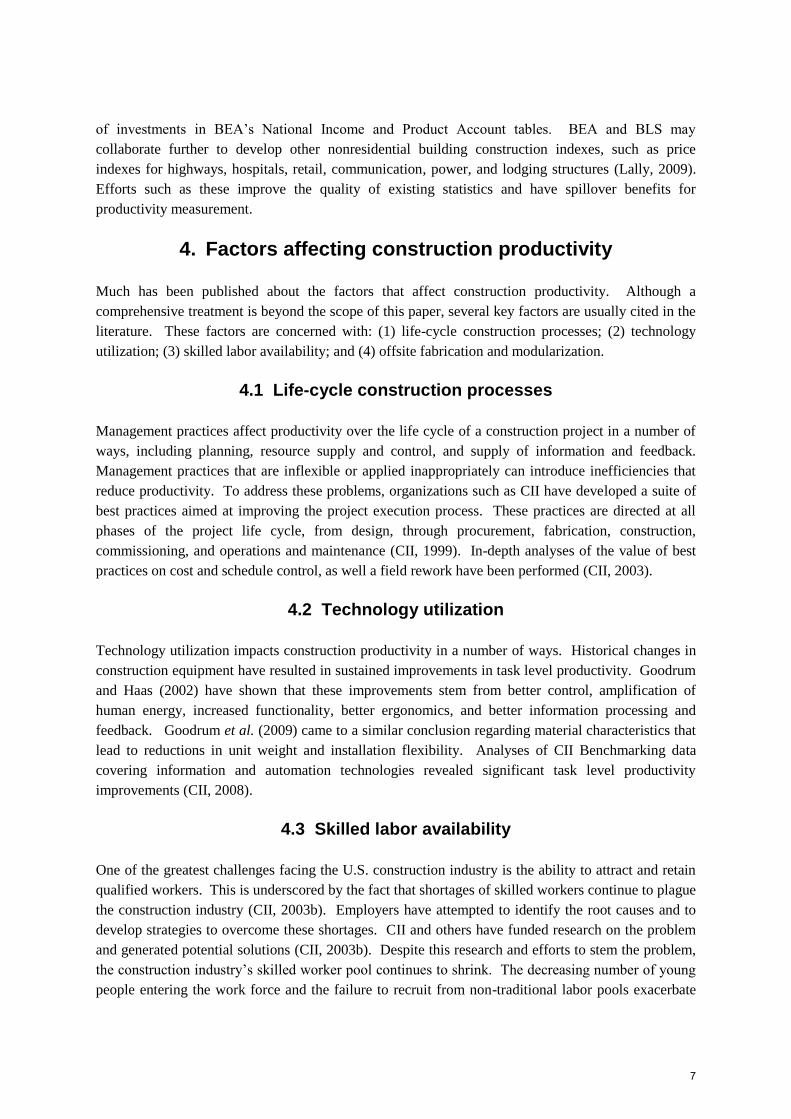
4. Factors affecting construction productivity
Much has been published about the factors that affect construction productivity. Although a
comprehensive treatment is beyond the scope of this paper, several key factors are usually cited in the
literature. These factors are concerned with: (1) life-cycle construction processes; (2) technology
utilization; (3) skilled labor availability; and (4) offsite fabrication and modularization.
4.1 Life-cycle construction processes
Management practices affect productivity over the life cycle of a construction project in a number of
ways, including planning, resource supply and control, and supply of information and feedback.
Management practices that are inflexible or applied inappropriately can introduce inefficiencies that
reduce productivity. To address these problems, organizations such as CII have developed a suite of
best practices aimed at improving the project execution process. These practices are directed at all
phases of the project life cycle, from design, through procurement, fabrication, construction,
commissioning, and operations and maintenance (CII, 1999). In-depth analyses of the value of best
practices on cost and schedule control, as well a field rework have been performed (CII, 2003).
4.2 Technology utilization
Technology utilization impacts construction productivity in a number of ways. Historical changes in
construction equipment have resulted in sustained improvements in task level productivity. Goodrum
and Haas (2002) have shown that these improvements stem from better control, amplification of
human energy, increased functionality, better ergonomics, and better information processing and
feedback. Goodrum et al. (2009) came to a similar conclusion regarding material characteristics that
lead to reductions in unit weight and installation flexibility. Analyses of CII Benchmarking data
covering information and automation technologies revealed significant task level productivity
improvements (CII, 2008).
4.3 Skilled labor availability
One of the greatest challenges facing the U.S. construction industry is the ability to attract and retain
qualified workers. This is underscored by the fact that shortages of skilled workers continue to plague
the construction industry (CII, 2003b). Employers have attempted to identify the root causes and to
develop strategies to overcome these shortages. CII and others have funded research on the problem
and generated potential solutions (CII, 2003b). Despite this research and efforts to stem the problem,
the construction industry’s skilled worker pool continues to shrink. The decreasing number of young
people entering the work force and the failure to recruit from non-traditional labor pools exacerbate
7
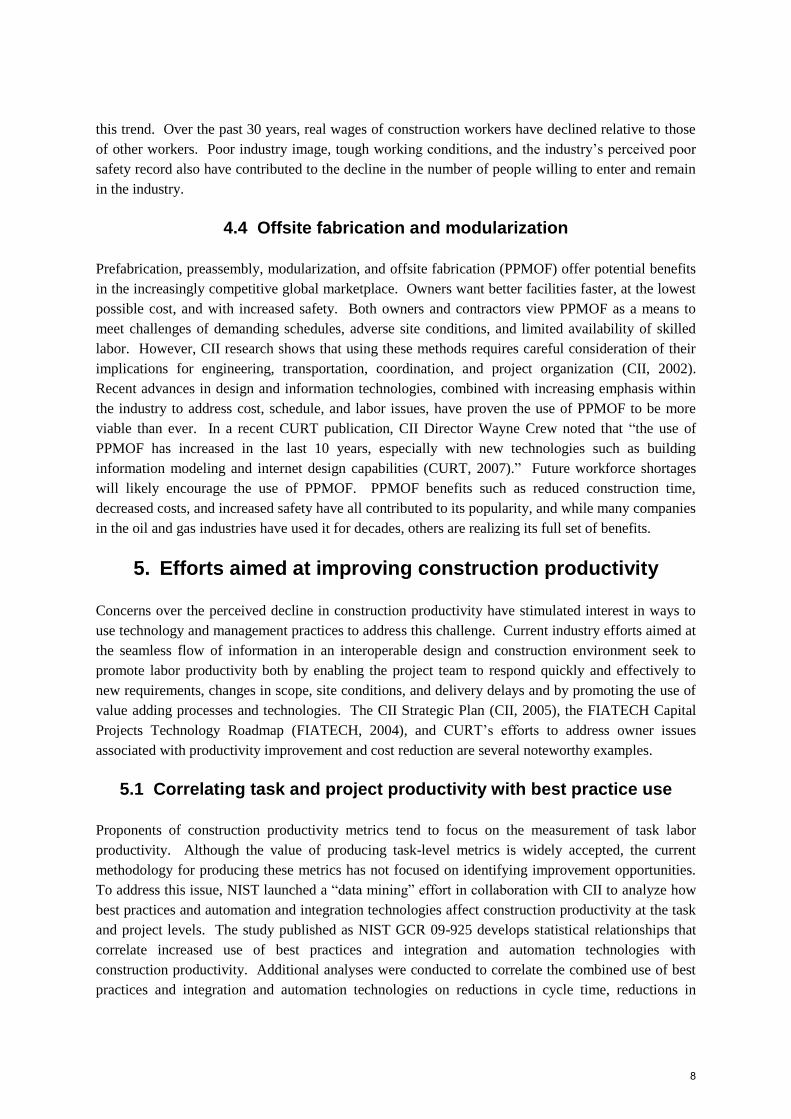
this trend. Over the past 30 years, real wages of construction workers have declined relative to those
of other workers. Poor industry image, tough working conditions, and the industry’s perceived poor
safety record also have contributed to the decline in the number of people willing to enter and remain
in the industry.
4.4 Offsite fabrication and modularization
Prefabrication, preassembly, modularization, and offsite fabrication (PPMOF) offer potential benefits
in the increasingly competitive global marketplace. Owners want better facilities faster, at the lowest
possible cost, and with increased safety. Both owners and contractors view PPMOF as a means to
meet challenges of demanding schedules, adverse site conditions, and limited availability of skilled
labor. However, CII research shows that using these methods requires careful consideration of their
implications for engineering, transportation, coordination, and project organization (CII, 2002).
Recent advances in design and information technologies, combined with increasing emphasis within
the industry to address cost, schedule, and labor issues, have proven the use of PPMOF to be more
viable than ever. In a recent CURT publication, CII Director Wayne Crew noted that ―the use of
PPMOF has increased in the last 10 years, especially with new technologies such as building
information modeling and internet design capabilities (CURT, 2007).‖ Future workforce shortages
will likely encourage the use of PPMOF. PPMOF benefits such as reduced construction time,
decreased costs, and increased safety have all contributed to its popularity, and while many companies
in the oil and gas industries have used it for decades, others are realizing its full set of benefits.
5. Efforts aimed at improving construction productivity
Concerns over the perceived decline in construction productivity have stimulated interest in ways to
use technology and management practices to address this challenge. Current industry efforts aimed at
the seamless flow of information in an interoperable design and construction environment seek to
promote labor productivity both by enabling the project team to respond quickly and effectively to
new requirements, changes in scope, site conditions, and delivery delays and by promoting the use of
value adding processes and technologies. The CII Strategic Plan (CII, 2005), the FIATECH Capital
Projects Technology Roadmap (FIATECH, 2004), and CURT’s efforts to address owner issues
associated with productivity improvement and cost reduction are several noteworthy examples.
5.1 Correlating task and project productivity with best practice use
Proponents of construction productivity metrics tend to focus on the measurement of task labor
productivity. Although the value of producing task-level metrics is widely accepted, the current
methodology for producing these metrics has not focused on identifying improvement opportunities.
To address this issue, NIST launched a ―data mining‖ effort in collaboration with CII to analyze how
best practices and automation and integration technologies affect construction productivity at the task
and project levels. The study published as NIST GCR 09-925 develops statistical relationships that
correlate increased use of best practices and integration and automation technologies with
construction productivity. Additional analyses were conducted to correlate the combined use of best
practices and integration and automation technologies on reductions in cycle time, reductions in
8
construction cost, and reductions in field rework, which also affect construction productivity. Major
findings were that technologies can facilitate the implementation of specific best practices, such as
Front End Planning, Alignment, and Project Risk Assessment. Technologies and specific best
practices, when used synergistically, can improve productivity of capital projects and may also
decrease the amount of rework. These findings help key industry stakeholders understand how
increased use of best practices and integration and automation technologies impacts the bottom line.
5.2 Leveraging technology to improve construction productivity
CII in collaboration with FIATECH established a research team on leveraging technology to improve
construction productivity (CII, 2008). Since many factors impact construction productivity, the
research team adopted a three-pronged approach to better control for any external factors. First, it
examined how historical changes in construction equipment, materials, and information technologies
influenced improvements in construction productivity. Second, a field test of materials tracking and
locating technologies was conducted to measure how using such technologies can improve
productivity on prototypical CII construction projects. Previous CII research identified materials
tracking and locating technologies as significant factors impacting construction productivity. The use
of radio-frequency identification (RFID) tags and a Global Positioning Satellite (GPS) system were
coupled to track materials in lay down areas in two CII member projects (CII, 2008). Improved
materials tracking was shown to increase productivity at the workface because material retrieval
became more efficient. Third, a predictive model that estimates the potential for a technology to have
a positive impact on construction productivity was developed and tested. The predictive model
addresses a technology’s costs, its feasibility, its usage history, and its impact characteristics. One of
the major results of the predictive model is that as a particular technology matures, it will yield higher
performance scores. Technologies with high performance scores may no longer be cutting edge, but
they provide a low-risk and potentially high-reward alternative to an unproven technology. However,
not all companies will limit their technology search to mature, proven technologies. The predictive
model is especially valuable in identifying key characteristics of emerging technologies that provide
attractive risk-reward tradeoffs. Therefore, using the predictive model to choose among alternative
technology investments is the first step in leveraging technology to improve construction productivity.
BIM is one technology that can enhance productivity of an entire project, from the planning phase to
the decommissioning phase. Eastman et al. (2008) describe BIM as ―a new approach to design,
construction, and facility management in which a digital representation of the building process is used
to facilitate the exchange and interoperability of information in digital format.‖ A previous NIST
study on interoperability estimated the cost of inadequate interoperability in the U.S. capital facilities
industry to be $15.6 billion per year (Gallaher et al., 2004), and therefore enhanced interoperability
has a great potential in efficiency gains.
5.3 Vision for the future
A vision for the future is to develop the enabling measurement science for achieving breakthrough
improvements in construction productivity that takes into account the complexity and variability of
construction and leads to well-controlled, repeatable processes. This vision includes the creation of:
9
(1) Standard practices for measuring task-level and project-level productivity; (2) Database of task-
level and project-level productivity measures for capital facilities; (3) Guidelines for efficient use of
BIM and PPMOF techniques; and (4) Industry-level productivity metrics. Achieving the vision is
more likely now because the enabling technologies are sufficiently mature to be applied to
construction processes, the cost of computing is no longer a barrier, and the industry is demanding
new capabilities for assessing and improving construction productivity. Leaders in the U.S.
construction industry are aware of the successes and benefits that have accrued from the investments
in measuring and monitoring construction safety (CII, 2007) and can envision the potential for similar
improvements in construction productivity. These leaders recognize that meeting the challenges of
managing increasingly complex, collaborative projects with changing mixes of stakeholders and
increased global competition requires the application of new measurement techniques to achieve
breakthrough productivity improvements.
6. Summary
This paper identifies and prioritizes technologies, processes, measurement science, and deployment
activities that have the greatest potential to significantly advance the productivity and competitiveness
of the U.S. construction industry over the next 20 years. Much is currently being done to address the
underlying causes of the perceived decline in construction productivity. However, key stakeholders
often have a myopic view of how to best address the underlying causes and remove barriers to change
within the industry. The November 2008 NRC workshop provided an opportunity to bring together
construction industry stakeholders to identify common problems, generate consensus on ways to
address some of these problems, and set priorities for attacking challenges to the industry that will
require a long-term effort to address. By providing a common forum for discussion and planning, the
NRC workshop was a first step in enabling the U.S. construction industry to achieve higher levels of
efficiency and competitive advantage in the global marketplace. This paper provides a vision for the
future for developing the enabling measurement science for achieving breakthrough improvements in
construction productivity, including the development of construction productivity metrics at the task,
project, and industry levels.
References
Allmon, E., C.T. Haas, J.D. Borcherding, and P.M. Goodrum (2000) ―U.S. Construction Labor
Productivity Trends, 1970-1998.‖ Journal of Construction Engineering and Management. 126: 97-
104.
Bernstein, H.M. (2003) Measuring Productivity: An Industry Challenge. Civil Engineering, pp. 46-53.
Bureau of Economic Analysis (2009) ―Gross-Domestic-Product-(GDP)-by-Industry Data.‖ Industry
Economic Accounts (Washington, DC: Bureau of Economic Analysis).
Bureau of Labor Statistics (1997) ―Chapter 11. Industry Productivity Measure.‖ BLS Handbook of
Methods (Washington, DC: Bureau of Labor Statistics), pp. 103-109.
10
Bureau of Labor Statistics (2009) ―Household Data: Employed Persons in Nonagricultural Industries
by Sex and Class of Worker.‖ Current Population Survey (Washington, DC: Bureau of Labor
Statistics).
Civil Engineering Research Foundation (1994) A Nationwide Survey of Civil Engineering-Related
R&D. CERF Report #93-5006 (Reston, VA: American Society of Civil Engineers).
Construction Industry Institute (1999) Design for Maintainability: Improving Project Return on
Investment. RS142-1 (Austin, TX: Construction Industry Institute).
Construction Industry Institute (2002) Prefabrication, Preassembly, Modularization, and Offsite
Fabrication in Industrial Construction: A Framework for Decision-Making. RS 171-1 (Austin, TX:
Construction Industry Institute).
Construction Industry Institute (2003a) Benchmarking and Metrics Value of Best Practices Report.
BMM2003-4 (Austin, TX: Construction Industry Institute).
Construction Industry Institute (2003b) The Shortage of Skilled Craft Workers in the U.S. RS 182-1
(Austin, TX: Construction Industry Institute).
Construction Industry Institute (2005) Strategic Plan (Austin, TX: Construction Industry Institute).
Construction Industry Institute (2007) Safety Report. BMM2007-2 (Austin, TX: Construction Industry
Institute).
Construction Industry Institute (2008) Leveraging Technology to Improve Construction Productivity.
RS 240-1 (Austin, TX: Construction Industry Institute).
Construction Users Roundtable (2007) ―Pre-Assembly Perks: Discover Why Modularization Works.‖
The Voice. (Fall), pp 28-31.
Eastman, C., P. Teicholz, R. Sacks, and K. Liston (2008) BIM Handbook: A Guide to Building
Information Modeling for Owners, Managers, Designers, Engineers, and Contractors. (Hoboken,
New Jersey: John Wiley & Sons, Inc.).
FIATECH (2004) Capital Projects Technology Roadmapping Initiative (Austin, TX: FIATECH).
Gallaher, M.P., A.C. O’Connor, J.L. Dettbarn, Jr., and L.T. Gilday (2004) Cost Analysis of
Inadequate Interoperability in the U.S. Capital Facilities Industry. NIST 04-867. (Gaithersburg, MD:
National Institute of Standards and Technology).
Goodrum, P.M., and C.T. Haas (2002) Partial Factor Productivity and Equipment Technology Change
at Activity Level in the U.S. Construction industry. Journal of Construction Engineering and
Management 128(6): 463-472.
11
Goodrum, P., D. Zhai, M. Yasin (2009) Relationship between Changes in Material Technology and
Construction Productivity. Journal of Construction Engineering and Management 135 (4), 278-287.
Huang, A.L., R.E. Chapman, and D.T. Butry (2009) Metrics and Tools for Measuring Construction
Productivity: Technical and Empirical Considerations. NIST Special Publication 1101 (Gaithersburg,
MD: National Institute of Standards and Technology).
Kang, Y., W. O’Brien, J. Dai, S.P. Mulva, S.R. Thomas, and P. Liao (2009) Measuring
Interoperability and Best Practices Impacts on Capital Project Productivity. NIST GCR 09-925
(Gaithersburg, MD: National Institute of Standards and Technology).
Lally, P. (2009) ―How BEA Accounts for Investment in Private Structures,‖ Survey of Current
Business February: 9-15.
Mulva, S.P. (2008) Associate Director for Benchmarking and Metrics, Construction Industry Institute,
personal communication.
National Research Council (2009) Advancing the Competitiveness and Efficiency of the U.S.
Construction Industry. (Washington, DC: National Academies Press).
National Science Foundation (2009) ―U.S. Business R&D Expenditures Increase in 2007; Small
Companies Performed 19% of Nation’s Business R&D.‖ Info Brief. NSF 09-316, July.
RSMeans (2005) Building Construction Cost Data: 2006. 64th Edition. (Kingston, MA: RSMeans).
Teicholz, P. (2004) ―Labor Productivity Declines in the Construction Industry: Causes and
Remedies.‖ AECbytes Viewpoint. Issue 4. April 14.
United States Census Bureau: Manufacturing and Construction Division (2009) ―Annual Value of
Construction Put in Place.‖ Current Construction Report (CCR) C30 (Washington, DC: United States
Census Bureau).
United States Census Bureau (2002a) ―Nonemployer Statistics.‖ (Washington, DC: United States
Census Bureau).
United States Census Bureau (2002b) ―Economic Census.‖ (Washington, DC: United States Census
Bureau).
Young, N.W. Jr. and H.M. Bernstein (2006) ―Key Trends in the Construction Industry – 2006.‖
SmartMarket Report (New York, NY: McGraw Hill Construction).
12