Embed Size (px)
Citation preview

I
Measuring and modelling the dynamics of carbon and nitrogen mineralization from diverse plant
residues in soil – plant systems
Dissertation
to obtain the Ph. D. degree
in the International Ph. D. Program for Agricultural Sciences in Goettingen (IPAG)
at the Faculty of Agricultural Sciences,
Georg-August-University Göttingen, Germany
presented by
Nguyen, Trung Hai
born in Thua Thien Hue, Vietnam
Göttingen, February 2016

II
D7
1. Name of supervisor: Prof. Dr. Anthony Whitbread
2. Name of co-supervisor: Prof. Dr. Klaus Dittert
Date of dissertation: 03.05.0216

III
Preface
This thesis has been submitted in partial fulfilment of the requirements for the degree “Doktor
der Agrarwissenschaften” (Dr. sc. agr. / Ph.D in Agricultural Sciences) by the Faculty of
Agricultural Sciences at the Georg-August University of Göttingen, Germany on the 1st April
2016.
Date of oral examination: 3rd May 2016
Examination Committee:
First supervisor: Prof. Dr. Anthony Whitbread
Second supervisor: Prof. Dr. Klaus Ditter
External examiner: Dr. Marife Corre

IV
Table of Contents Page
List of Figures ....................................................................................................................... VII
List of Tables ........................................................................................................................... IX
Chapter 1: General introduction .............................................................................................. 1 1.1 Crop residues and their use ........................................................................................................... 1
1.1.1 Global production estimates of crop residue from arable lands ........................................... 1
1.1.2. The application of plant residues and their roles .................................................................. 2
1.2. The dynamic of C and N mineralisation from diverse plant residues .......................................... 9
1.2.1. General conceptual ............................................................................................................... 9
1.2.2. Factors affecting the dynamic of C and N mineralisation ................................................... 10
1.3. The application of model in representing the C and N dynamics in soil – plant – atmosphere
systems .............................................................................................................................................. 14
1.3.1. Overview of some Soil Organic Matter (SOM) models ....................................................... 14
1.3.2. Description of using model – SOILN in APSIM ..................................................................... 17
1.3.3. The application of SOILN in representing the dynamic of C and N ..................................... 18
1.4. Objectives of the study ............................................................................................................... 19
1.5. Structure of the thesis ................................................................................................................ 20
1.6. References .................................................................................................................................. 22
Chapter 2. Evaluating the effect of residue quality on C and N mineralization in soils under
controlled conditions ............................................................................................................... 27 2.1. Introduction ................................................................................................................................ 27
2.2. Materials and methods .............................................................................................................. 29
2.2.1 Soil and residue characteristics .......................................................................................... 29
2.2.2 Treatments and laboratory incubation ................................................................................ 30
2.2.3 Analytical measurements ..................................................................................................... 31
2.3. Results ........................................................................................................................................ 32
2.3.1 Biochemical quality of the residues ..................................................................................... 32
2.3.2 Carbon and nitrogen mineralisation of added residues from different soil types ............... 33
2.3.3 Carbon and nitrogen mineralisation from different residue application methods ............. 40
2.4. Discussion ................................................................................................................................... 46
2.4.1. Biochemical quality of the residues .................................................................................... 46
2.4.2. Carbon and nitrogen mineralisation of added residues from different soil types .............. 46
2.5. Conclusion .................................................................................................................................. 50
2.6. References .................................................................................................................................. 51

V
Chapter 3. Modelling carbon and nitrogen mineralisation from diverse plant residues in
incubation studies .................................................................................................................... 55 3.1. Introduction ................................................................................................................................ 55
3.2. Materials and Methods .............................................................................................................. 58
3.2.1. Description of the APSIM SoilN module .............................................................................. 58
3.2.2. Process for initialising SOILN to simulate diverse residues ................................................. 59
3.2.3. Experimental data used for model performance ................................................................ 62
3.2.4. Carbon and nitrogen analysis and calculated SOILN ........................................................... 65
3.2.5. Model evaluation ................................................................................................................ 66
3.3. Result .......................................................................................................................................... 66
3.3.1. Model parameterization ..................................................................................................... 66
3.3.2. Model performance in different scenarios ......................................................................... 69
3.3.3. Simulation C and N dynamic from SOILN model by using modified parameters ................ 74
3.4. Discussion ................................................................................................................................... 82
3.5 Conclusion ................................................................................................................................... 86
3.6. References ................................................................................................................................. 88
APPENDIX .............................................................................................................................. 92
Chapter 4. Carbon and nitrogen mineralisation and N recovery from 15
N labelled plant
residues under controlled conditions ...................................................................................... 94 4.1. Introduction ................................................................................................................................ 94
4.2. Materials and Methods .............................................................................................................. 96
4.2.1. Soil ....................................................................................................................................... 96
4.2.2. Labelled plant residues ........................................................................................................ 96
4.2.3. Trials .................................................................................................................................... 97
4.2.4. Analytical measurement...................................................................................................... 98
4.2.5. Statistics............................................................................................................................. 100
4.3. Results ...................................................................................................................................... 100
4.3.1. Residue quality and the recovery of 15N isotopic of plants ............................................... 100
4.3.2. Gas fluxes and net N mineralisation from incubation trial ............................................... 102
4.3.3. Dry matter of wheat plant from different applications and residues quality ................... 104
4.3.4. N recovery from added labelled residues to plant ............................................................ 107
4.3.5. Net N mineralisation from different residue types and application ................................. 110
4.4. Discussion ................................................................................................................................. 112
4.4.1. The effect of residue quality on CO2-C emission ............................................................... 112
4.4.2. N mineralisation/immobilisation in the different conditions ........................................... 112
4.4.3. Total 15N recovery .............................................................................................................. 114
VI
4.5. Conclusion ................................................................................................................................ 115
4.6. References ................................................................................................................................ 117
Chapter 5. General discussion and conclusion ................................................................ 119 5.1. General discussion .................................................................................................................... 119
5.1.1. Residue quality and decomposition .................................................................................. 119
5.1.2. Potential application of soil organic matter models ......................................................... 121
5.2. Conclusions and recommendations ......................................................................................... 123
5.2.1. Conclusions ........................................................................................................................ 123
5.2.2. Suggestions for future research related to the findings of this thesis. ............................. 124
5.3. References ................................................................................................................................ 126
Summary ................................................................................................................................ 127
Acknowledgements ................................................................................................................ 130
Publications ........................................................................................................................... 131
Curriculum Vitae ................................................................................................................... 132
Declarations ........................................................................................................................... 133

VII
List of Figures
Page
Figure 1.1. The implication of plant residues .................................................................................. 7
Figure 1.2. The impact of plant residues on soil processes .......................................................... 7
Figure 1.3. Total N content from added residues of different continents since 1960 to 2050.. 8
Figure 1.4. Total CO2 emission equivalent in gigagrams from added residues of different
continents since 1960 to 2050. .......................................................................................................... 8
Figure 1.5. Total N2O emission in gigagrams from added residues of different continents
since 1960 to 2050. . ............................................................................................................................ 9
Figure 1.6. The framework of SOILN module and the transformation occurring in each layer.
............................................................................................................................................................... 18
Figure 2.1. Linear regression between C:N ratio of residue and some carbon distribution
pools of residue. .................................................................................................................................. 33
Figure 2.2. Cumulative CO2-C release from only residues in clay, sand and subsoil . .......... 35
Figure 2.3. The relationships between net C release as percentage of total C input from only
added residues and soil types after 7, 28 and 63 days of incubation. ...................................... 36
Figure 2.4. Net N mineralisation from only residues in clay, sand and subsoil .. ..................... 38
Figure 2.5. The relationship between overall C:N ratio of residues and net carbon mineralised
and net N mineralised in clay soil and sand soil at 7 days, 28 days and 63 days . ................. 39
Figure 2.6. Cumulative CO2-C release from only residues in incorporated application, and
mulched application . ......................................................................................................................... 40
Figure 2.7. Net N mineralisation from only residues in incorporated application, and mulched
application. ........................................................................................................................................... 41
Figure 2.8. The relationship between overall C:N ratio of residues and net C release and net
N mineralised of different residue materials at 7 days, 28 daysand 63 days ............................ 42
Figure 2.9. The relationship between different biochemical components and carbon
mineralised and net N mineralised of different residue materials at 7 days, 28 days and 63
days. ..................................................................................................................................................... 45
Figure 3.1. The framework of SOILN in relationship with other essential modules in APSIM
............................................................................................................................. …………………………….. 61
Figure 3.2. Cumulative CO2-C release and Net N mineralised from unamended soil by
individual fitting 3 parameters. .......................................................................................................... 68
Figure 3.3. Scatter plots of the observation vs. measurement of cumulative CO2-C release
from 20 residues applied in scenario 1 and scenario 2 and 3 .................................................... 70
Figure 3.4. Scatter plots of the observation vs. measurement of net N mineralised from 20
residues applied in scenario 1 and scenario 2 and scenario 3 .................................................. 73

VIII
Figure 3.5. Cumulative CO2-C release and Net N mineralized from residues in soil type 1 by
using modified parameters. .............................................................................................................. 75
Figure 3.6. Cumulative CO2-C release and Net N mineralized from residues in soil type 2 by
using modified parameters. .............................................................................................................. 77
Figure 3.7. Cumulative CO2-C release and Net N mineralized from residues in soil type 4 and
soil type 3 by using modified parameters. . .................................................................................... 79
Figure 3.8. Sensitivity analysis to the variation of ef_biom, ef_fom and ef_hum parameters
applied to mucuna residue (#4) in soil type 2................................................................................. 82
Figure 4.1. Cummulative CO2-C emissions from added residues in incubation trial. ............ 102
Figure 4.2. The relationship between lignin content and CO2 gas flux emission of different
residue materials at 7 days, 28 days, 56 days and 119 days. ................................................... 103
Figure 4.3. Net N mineralisation from added residues in incubation trial.. .............................. 104
Figure 4.4. Dry matter of wheat at 6 WAP and at 12 WAP of different treatments from
mulched (a) and incorporated (b) application in 3 consecutive seasons. ................................ 106
Figure 4.5. 15N recovery from different added residues to plant in various harvesting time and
residues application in the first season, second season and third season.............................. 108
Figure 4.6. Total 15N recovery from different added residues to plant in different residues
applications at 6 WAP and at 12 WAP .......................................................................................... 109
Figure 4.7. Relationship between total 15N derived from residue and lignin content from
incorporated (a) and mulched (b) application at 6 WAP and at 12 WAP ................................. 110
Figure 4.8. Net N mineralisation from added residues in pot trial when incorporated with soil
(a) or placed on the surface (b).. .................................................................................................... 111
Figure 5.1. Decision tree of plant residues application as determined by their litter quality ….
............................................................................................................................................................. 121

IX
List of Tables
Page
Table 1.1. Plant residue production of some main countries and of the world in 2000 and
2014 ...................................................................................................................................... 1
Table 2.1. Some chemical and textural properties of soils used in 3 incubation experiments.
.............................................................................................................................................30
Table 2.2. Chemical properties of residues used …………………………………………….. 31
Table 3.1. Chemical properties of residues used in this study ..............................................64
Table 3.2. Soil characteristics and soil organic matter in first 10 cm layer ............................65
Table 3.3a. Value of some modification parameters of SOILN ..............................................68
Table 3.3b. Statistical analysis of model performance from unamended soil ………………..69
Table 3.4a. Statistical analysis of cumulative CO2-C release from different dataset in the best
scenario performance ...........................................................................................................71
Table 3.4b. Statistical analysis of net N mineralisation from different dataset in the best
scenario performance ……………………………………………………………………………. 73
Table 3.5a. Statistical analysis of cumulative CO2-C release from added residues in different
scenarios ..............................................................................................................................85
Table 3.5b. Statistical analysis of net N mineralized from added residues in different
scenarios ……………………………………………………...………………………………….. 86
Table 4.1. Some biochemical quality of using plant residues ................................................97
Table 4.2. The recovery of 15N isotopic in atom percent excess (APE) of wheat plant from
different 15N labelled residues in 3 consecutive seasons at 6 and 12 weeks after planting of 2
different residue applications .. ........................................................................................... 101
Table 5.1. Different categories of organic materials based on biochemical quality and their
effects on nitrogen supply and soil organic matter .............................................................. 121

1
Chapter 1: General introduction
1.1 Crop residues and their use
1.1.1 Global production estimates of crop residue from arable lands
Plant residue is defined as the non-edible plant parts left in the field after plants have been
harvested (Lal, 2005) and thrashed or left after pastures are grazed (Kumar and Goh, 1999).
Such materials have been considered as waste materials and usually have been burned
directly on the field, especially in developing countries. However, it has become increasingly
apparent that crop residues are an important natural resource for maintaining agricultural
productivity, environmental improvement and an important raw material for energy
generation or other industrial activities. Estimate of the amount of plant residue produced by
different crops are usually computed on the basis of data on the area and productivity and it
differs widely depending on plant characteristics (Lal, 2005, Lal, 1995). Using straw/grain
ratio of some main crops adapted from Lal (2005), the annual residue production in general
has increased since 2000 in which cereal crops as maize, rice, wheat contribute the most
(Table 1.1).
Table 1.1. Plant residue production (in 1000 tones) of some main countries and of the world in 2000
and 2014
Area 2000 2014
Maize Peas Potatoes Rice Sugar cane Wheat Maize Peas Potatoes Rice Sugar cane Wheat
Argentina 16781 11 555 1355 4600 24220 33000 54 466 2373 6149 20895
Australia 406 456 300 1651 9541 33162 390 293 293 1229 7630 37955
Brazil 31879 4 640 16635 81926 2492 79878 4 922 18263 184289 9393
Canada 6954 2864 1142 0 0 39803 11487 3445 1147 0 0 43921
China 106000 1020 16569 281862 16570 149454 215646 1575 24022 309761 31403 189313
France 16018 1937 1609 174 0 56030 1854 512 2014 125 0 58450
Germany 3324 409 3424 0 0 32432 5142 155 2902 0 0 41677
India 12043 815 6250 191197 74831 114553 23670 600 11599 235800 88036 141725
USA 251852 158 5823 12987 9029 90959 361091 778 5014 15039 7001 83093
World Total 592479 10716 81900 898348 313972 878536 1021617 11333 96269 1111434 474998 1093450
(These calculations are done by using straw/grain ratio adapted from Lal (2005) multiple by grain
production calculated from Food and Agriculture Organisation of the United Nations, 2013).

2
1.1.2. The application of plant residues and their roles
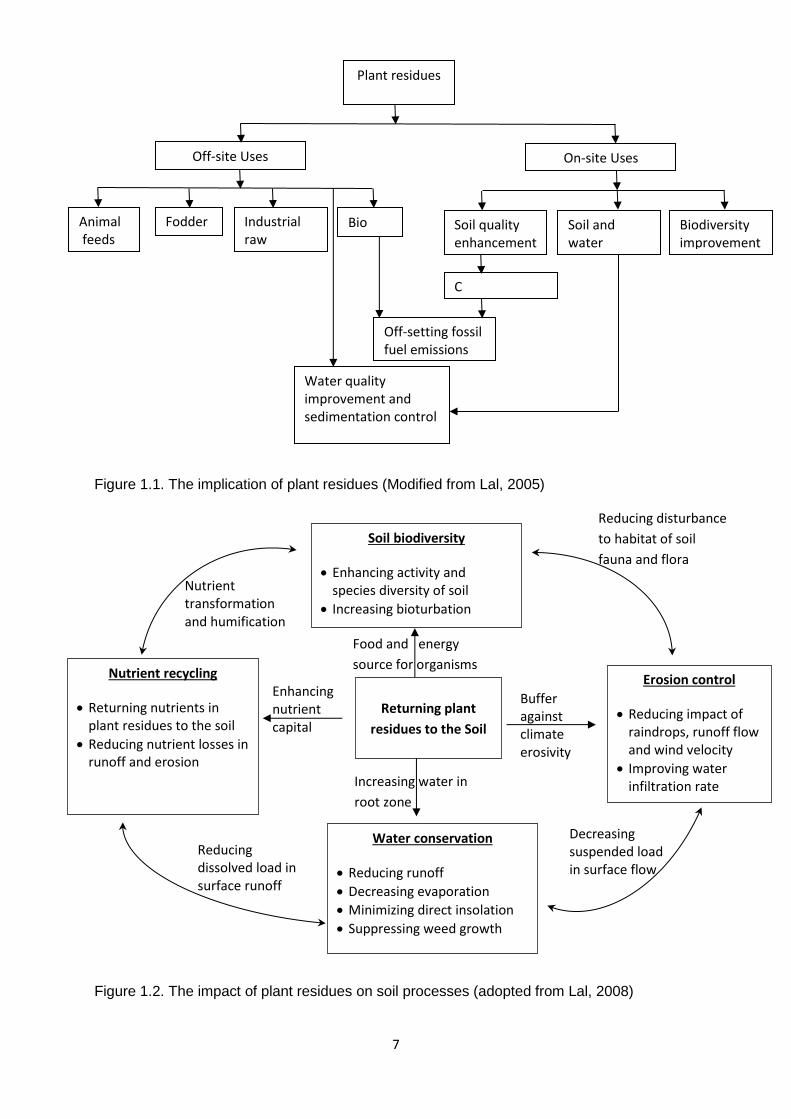
Plant residues nowadays are used in plenty of aspects not only in agricultural activities such
as an important animal feed source, retaining on the field as an organic fertilizer. They are
also a potential source of feedstock for industrial activities such as bioenergy production and
raw materials in paper production (Figure 1.1).
Plant residues in soil quality enhancement
The use of plant residues as a means of maintaining and increasing soil fertility as well as in
nutrient providing has been applied widely, especially in organic farming systems and in
organic agriculture. According to Food and Agriculture Organization of the United Nations,
the total N content from added residues have increased significantly since 1950 in which
Asia has contributed the largest amount, following by Americas and Europe (Figure 1.3) and
this trend will continue till 2050. For example, the total amount of N from plant residues in
2012 from over the world accounted for over 32 million tons in which Asia accounted almost
half of this number, following by Americas (over a quarter) and Europe (15%). In addition to
the N, plant residues are also a source of other macronutrients (P, K) and micronutrients (S,
Cu, Zn, Mo) needed for crop growth and humification of residue (Chen and Avnimelech,
1986). Lal (1995) reported that three principal plant nutrients (N, P, K) contributed from major
cereals plant and leguminous plant residues in the USA were about 58% of the total fertilizer
use. On the global scale, this figure was about 65% of the world annual consumption of
fertilizer. In systems where plant residues are managed well, they add soil organic matter,
which improves the quality of the seedbed and increases the water infiltration and retention
capacity of the soil, buffers the pH and facilitates the availability of nutrients; they also
sequester C in the soil, provide nutrients for soil biological activity and plant uptake, capture
the rainfall on the surface and thus increase infiltration and the soil moisture content, provide
a cover to protect the soil from being eroded and reduce evaporation and avoid desiccation
from the soil surface (Bot and Benites, 2005). According to Shaver et al. (2013), increasing of
crop residue accumulation will have the indirect effect of increased sorptivity via
improvements in soil aggregation, bulk density, and porosity that are conductive to water

3
infiltration. Moreover, organic matter intimately mixed with mineral soil materials has a
considerable influence in increasing moisture holding capacity, especially in the topsoil.
When calculated the cumulative daily losses of water over 100 days simulation, Lascano and
Baumhardt (1996) found the reduction losses of water due to soil evaporation in the
presence of wheat straw in cotton systems compared with conventional cotton. When
expressed water use efficiency as the ratio of lint yield to the total evaporation, the efficiency
of cotton in the wheat –straw systems increased by over 35% compared to the conventional
cotton. van S. J. Donk (2010) reported that the residue-covered soil held approximately
60mm more water in the first 1.8m compared to the bare soil when carried out in the plot
treatments of corn field. The effect of crop residues in mitigation greenhouse gases emission
also mentioned in several researches. Gattinger et al. (2012) found a positive difference in
soil organic carbon concentration, stocks and C sequestration rates when compared organic
and non-organic farming systems in the top soil. In particular, organic farming practice led to
soil organic carbon stocks in the upper 20cm of soil over a period of 14 years were around 4
Mg C ha-1 higher than in non-organic systems. The mean difference of net C sequestration in
the top soil between organic and non-organic farming was about 0.5 Mg C ha-1 per year
(Gattinger et al., 2012). In the global scale, the total net C sequestration was about 0.4 Gt C
per year when switching to organic agriculture, approximately offsetting 3% of current total
greenhouse gas emissions or 25% of total current agricultural emissions and equaling
approximately 25% of the annual technical agricultural mitigation potential. The authors also
predicted that until 2030 the cumulative mitigation would contribute 13% to the cumulative
reductions. In dryland ecosystems such as West Asia and Africa, Lal (2002) recommended
several strategies for increasing soil C sequestration which were including residues
management, cover crops. Tuomisto et al. (2012) reported that organic farming in Europe
had generally lower environmental impacts per unit of area than conventional farming. Food
and Agriculture Organization of the United Nations (2013) predicted that the total amount of
CO2 emission and N2O emission from added residues from 5 different continents and all over
the world will continue to increase until 2050 (Figure 1.4 and 1.5).

4
Plant residues in bioenergy
The utilization of plant residues as raw materials of bioenergy is a promising alternative to
fossil resources for production of energy carriers and chemical ((Cherubini and Ulgiati, 2010;
Lal, 2005; Lal, 2008; Kim and Dale, 2004). Lignocellulosic biomass which was mainly from
cereals plant residues like corn stover and wheat straw has three major components:
cellulose, hemicellulose and lignin. While cellulose and hemicellulose are polysaccharides
that can be hydrolyzed to sugars and then fermented to ethanol, lignin may be useful for
chemical extraction or energy production (Cherubini and Ulgiati, 2010) or for generating
electricity and steam (Kim and Dale, 2004). According to Cherubini and Ulgiati (2010), the
use of plant residues as raw materials in biorefinery is an effective option for reducing
environmental concerns related to fossil resources: biorefinery systems can mitigate climate
change (reduced by about 50% of GHG emissions), reduce dependence on non-renewable
fossil fuels (saved more than 80% of non-renewable energy) and enhance cleaner
production chains based on local and renewable sources. Lal (2005) reported that the energy
value of plant residue produced in the US was 976 x 106 barrels of diesel and in the global
scale was 7516 x 106 barrels of diesel. The share of biomass energy consumption depends
on economic structure, the level of income, the availability of land and other energy sources
and it is widely used as household fuel in developing countries. For example, the share of
biomass in energy consumption is about 47% in Asia, 25% in Africa, 19% in Latin America
whereas this figure is much lower in North America (5%), Europe (3%) and only 1% in
Oceania (Lansink et al., 2003). Johansson and Goldemberg (2002) reported that biomass
consumption for energy used in developing countries accounted for 26% while this number
was only 3.4% in industrialized countries. Kim and Dale (2004) estimated that about 491 GL
year-1 of potential bioethanol was produced from plant residues and waster crops and it could
replace 353 GL of gasoline or 32% of the global gasoline consumption. Plant residues are
responsible for 90% of the total potential bioethanol production. Moreover, when burning
lignin – rich fermentation residues (a co-product of bioethanol made from plant residues and
sugar can bagasse) it could generate about 458 TWh of electricity (approximately 3.6% of

5
world electricity production) and 2.6 EJ of steam (Kim and Dale, 2004). In global scale, Asia
is considered as the largest potential producer of bioethanol (about 291 GL and mainly
comes from rice straw and wheat straw) and is followed by Europe (about 70 GL and mainly
comes from wheat straw). Lal (2008) estimated that about 3 billion Mg of lignocellulosic has
been produced from cereals crops per year which was equivalent to 840 billion L of
bioethanol or 56 x 109 GJ of energy.
Plant residues in animal feeds
The importance of plant residues for feeding livestock, especially in smallholder farming
systems in developing countries has been mentioned widely (E Owen and M C N Jayasuriya,
1989); Aregheore, 1996; Onwuka et al., 1997; Njie and Reed, 1995; Valbuena et al., 2012).
Baudron et al. (2015) reported that cereals residues were a major resource for livestock
feeding in Southern Africa, especially in the dry season. Parthasarathy Rao and Hall (2003)
estimated that over 60% of the total livestock feed on a dry matter basis came from plant
residues in India. The dependence on plant residues was higher in the more marginal and
semi-arid regions in which alternative sources of feed were limited. In maize-based systems
in Ethiopia, over 50% of biomass maize stover was used as livestock feed (Jaleta et al.,
2015) and this figure increased to 73% in Kenya in the same scale (Castellanos-Navarrete et
al., 2015).
Plant residues as raw material for industry
Using plant residues such as straw from wheat, oats or barley as potential sources of bio-
based raw material for industrial purposes has been applied widely (Ververis et al., 2004;
Bowyer, 2001; Willke and Vorlop, 2004). Bowyer (2001) reported that panels made of straw
from cereals and other plant residues are being commercially manufactured in several
countries. The idea of using agricultural residues as an industrial raw material is not new.
Crop residues like bagasse have long been used in making paper in China, India, Pakistan
and other countries. According to Bowyer (2001) production of paper and paperboard from
plant residues increased dramatically, with the percentage of pulp capacity accounted for by
non-wood fiber globally about 12%. Global production of fiber for the panels industry from

6
wheat, barley and oats was about 738 million metric tons in 1999 in which over 40% of
production from China, India, Canada and the US (Bowyer, 2001) and this figure was
predicted increasing to 40 to 60%. Urbaniec and Bakker (2015) mentioned that agricultural
waste and agro-industrial residues were the main feedstocks biohydrogen production due to
theirs abundant, low input cost and biodegradable character.
Plant residues in biodiversity improvement
In order to evaluate the effect of organic farming system on biodiversity from over 70 different
researches, Hole et al. (2005) found that species abundance and/ or richness of a wide
range of taxa, including birds and mammals, invertebrates and arable flora tend to be higher
on organic farms than on locally representative conventional farms. Similar results were also
reported in other studies (Mader, 2002; Bengtsson et al., 2005; Pacini et al., 2003).
Bengtsson et al. (2005) found that organic farms had 30% higher of species richness and
50% higher abundance of organisms than conventional farms. In organic farming systems,
the densities of predators such as carabid beetles and spiders were usually higher than in
conventional ones. Higher amount of organic material in the soil increased soil animals such
as earthworm and soil fauna (Bengtsson et al., 2005; Mader, 2002). Tuomisto et al. (2012)
did not find any negative effect of organic farming on biodiversity. When evaluating the
sustainability of three different farming systems (organic, integrated and convention), Pacini
et al. (2003) found that the organic farming systems performed better than integrated and
conventional farming systems in term of pesticide risk, herbaceous plant biodiversity and
most of the other environmental indicators such as nutrient losses. Average activity density
of carabids, staphylinids, and spiders in the organice plots was almost double that of the
conventional plots (Mader, 2002).
7
Figure 1.1. The implication of plant residues (Modified from Lal, 2005)
Figure 1.2. The impact of plant residues on soil processes (adopted from Lal, 2008)
C Sequestration
Off-setting fossil fuel emissions
Fodder Animal feeds
Bio fuel
Industrial raw materials
Soil quality enhancement
Soil and water conservation
Biodiversity improvement
Plant residues
On-site Uses Off-site Uses
Water quality improvement and sedimentation control
Decreasing suspended load in surface flow
Reducing dissolved load in surface runoff
Increasing water in
root zone
Buffer against climate erosivity
Food and energy
source for organisms
Enhancing nutrient capital
Nutrient transformation and humification
Reducing disturbance
to habitat of soil
fauna and flora
Soil biodiversity
Enhancing activity and species diversity of soil
Increasing bioturbation
Nutrient recycling
Returning nutrients in plant residues to the soil
Reducing nutrient losses in runoff and erosion
Returning plant
residues to the Soil
Erosion control
Reducing impact of raindrops, runoff flow and wind velocity
Improving water infiltration rate
Water conservation
Reducing runoff
Decreasing evaporation
Minimizing direct insolation
Suppressing weed growth

8
Figure 1.3. Total N content from added residues of different continents since 1960 to 2050.
Source: (Food and Agriculture Organization of the United Nations, 2013)
Figure 1.4. Total CO2 emission equivalent in gigagrams from added residues of different
continents since 1960 to 2050. Source: (Food and Agriculture Organization of the United
Nations, 2013)
0
5000
10000
15000
20000
25000
30000
35000
40000
1960 1980 2000 2020 2040
Res
idu
es N
co
nte
nt
(gig
agra
ms)
Year
AfricaAmericasAsiaEuropeOceaniaWorld
0
50000
100000
150000
200000
250000
1960 1980 2000 2020 2040
CO
2 em
issi
on
eq
uiv
alen
t (g
igag
ram
s)
Year
Africa
Americas
Asia
Europe
Oceania
World

9
Figure 1.5. Total N2O emission in gigagrams from added residues of different continents
since 1960 to 2050. Source: (Food and Agriculture Organization of the United Nations,
2013).
1.2. The dynamic of C and N mineralisation from diverse plant residues
1.2.1. General conceptual
Knowledge about the kinetics of plant residues decomposition plays an essential for
management of agroecosystems. The incorporation of plant residues into soil not only
represents an opportunity to limit soil organic matter depletion resulting from cultivation but
also provides a valuable source of nutrients. Under normal conditions, the lost of C from the
system is mainly through the decomposition. In a long term experiment, a single rate
constant has been usually used to describe decomposition and the change of C in the soil
can be expressed mathematically in one kinetic rate constant of decomposition:
Ct = Coe-k1t + Cae
-k2t
0
100
200
300
400
500
600
700
800
1960 1980 2000 2020 2040
N2O
em
issi
on
(gi
gagr
ams)
Year
Africa
Asia
Americas
Europe
Oceania
World

10
Where Ct is the amount of soil C at time t, Co is the amount of soil C at time 0, k1 is the
decomposition rate constant (day-1) of the total soil C pool before amendment of C added, Ca
is the amount of C added (plant residue) with decomposition rate constant is k2 .
If we ignore the dynamic nature of the system, the N mineralisation from a substrate can be
expressed as below:
Nmineralised = Ct(1/Z – E/Y)
Where Z is the C:N ratio of the decomposing substrate, E is a microbiological efficiency
factor and is estimated as a constant (0.4), Y is the C:N ratio of soil organic matter.
Nevertheless, in short term experiment likely in laboratory studies, several authors suggested
that plant residues should be divided into two or more pools with different decomposition
rates. Therefore, the decomposition process is often considered as a first –order reaction for
various C pools. The rapid and slow fractions can be mathematically represented as below:
%decomposed = %rapid (1-exp(-k1t)) + (100-% rapid)(1-exp(-k2t))
Where % rapid is the amount of plant residue C in the rapid pool, (100-%rapid) is the amount
of plant residue C in the slow pool, k1 is the rapid-likely pool rate decomposition constant, k2
is the slow-likely pool rate decomposition constant.
1.2.2. Factors affecting the dynamic of C and N mineralisation
The decomposition process of plant residues depends primarily on the interaction of three
components: the soil organisms, its chemical composition and the physical and chemical
environmental conditions.
Soil organisms
Soil organisms are responsible for the decay and cycling of both macronutrients and
micronutrients, and their activity affects the structure, tilth and productivity of the soil (Bot and
Benites, 2005). In natural humid and subhumid forest ecosystems without human
disturbance, the living and non-living components are in dynamic equilibrium with each other.
When evaluating the effect of microbial biomass on the fate of nitrogen over a period of 6
months in sandy loam soil under controlled condition, Bending et al. (1998) reported that
cumulative microbial respiration during the early stages of decomposition was correlation

11
with net N mineralisation after 2 months, at which time maximum net N mineralisation was
recorded. Moreover, microbial respiration also effected on activities of organisms involved in
immobilization of N and denitrification. Hassink et al. (1994) found that the differences in C
mineralisation rate between the four grasslands could satisfactorily be explained by the
differences in bacterial biomass. The fauna may contribute to C and N mineralisation in two
ways: directly through their own C and N mineralisation and indirectly through their effect on
the growth rate of the microbes in which the direct contribution of the fauna to N
mineralisation ranged from 7 to 28%.
Biochemical composition
The rate of soil organic matter accumulation depends largely on the quantity and quality of
organic matter input. Biochemical compositions such as N content, C:N ratio, water soluble,
hemicellulose, lignin and polyphenol content are considered as an important factor governing
the C and N mineralisation of plant residues (Fox et al., 1994; Constantinides and Fownes,
1994). Palm and Sanchez (1991) reported that polyphenolic content could control the short
term N release and the availability from legumes. Legumes with low polyphenolic content used
as green manure or mulch may release N rapidly and provide sufficient N for plant growth.
Under tropical conditions, applications of readily degradable residues with low C:N ratios, such
as green manure and leguminous cover crops, favor decomposition and increase the labile
nitrogen pool. On the other hand, applications of plant residues with both large C:N ratios and
lignin contents such as cereal straw and grasses generally favour nutrient immobilization,
organic matter accumulation and humus formation, with increased potential for improved soil
structure development (Bot and Benites, 2005). When examining the correlation between N
mineralisation and initial chemical composition of both gramineae and leguminoseae plant
residues, Vahdat et al. (2011) found that lignin content was the most important factor for
prediction of the net effects on soil mineral N dynamics (r =-0.974, P<0.001). It is believed that
lignin is a natural recalcitrant which exerts a control on the overall biodegradability of the plant
residue in soil and thus may play a major role in predicting N mineralisation from plant residue.
A negative correlation was also found between N mineralisation and C:N ratio but no significant

12
correlation was found between N mineralisation and cellulose content. However, the correlation
between hemicellulose and N mineralisation was quite high (r=-0.762, P<0.05). In the woody
agroforestry plant species residues, Tian et al. (1992) also found a negative correlation
between decomposition rate constants and C:N ratio, lignin content and polyphenol content.
When assessing the kinetics of C and N biotransformation of different tissues of Brassica
napus, Trinsoutrot et al. (2000b) found that the rate of C mineralisation (via 13C labelled) from
the residues was influenced by the biochemical composition of the tissues, in particularly by
their soluble C content. As the decomposition or residues of various composition was not
limited by the overall availability of N, the dynamic of decomposition of the added residues
depended mostly on the soluble compounds, cellulose and lignin content, regardless of the N
content of the residue itself. Similar results were also found in Trinsoutrot et al. (2000a) when
evaluating the relationship between the fate of C and N from nearly 50 types of crop residues
and their biochemical properties.
Climate
Several field studies have shown that temperature is a key factor controlling the rate of
decomposition of plant residues. Decomposition normally occurs more rapidly in the tropics
than in temperature areas (Bot and Benites, 2005). When evaluating the effect of 5 different
woody residue species quality and climate on plant residue decomposition, Tian et al. (2007)
found that the direct correlation between the decomposition rate of plant residues and their
quality was only valid in agroeco-zones where there is no moisture stress. Similarly, the
direct correlation between the decomposition rate of plant residues and moisture availability
was only valid for plant residues with high quality. The decomposition of the low quality plant
residue could increase from humid to arid zone in West Africa. In the arid zone, the low
quality plant residue could also decompose faster than high quality plant residue.
Plant residue management
Tillage is one of the major practices that reduce the organic matter level in the soil. When
ploughed, the residues are incorporated in the soil together with air and come into contact
with many micro-organisms, which accelerates the carbon cycle. Cookson et al. (1998)
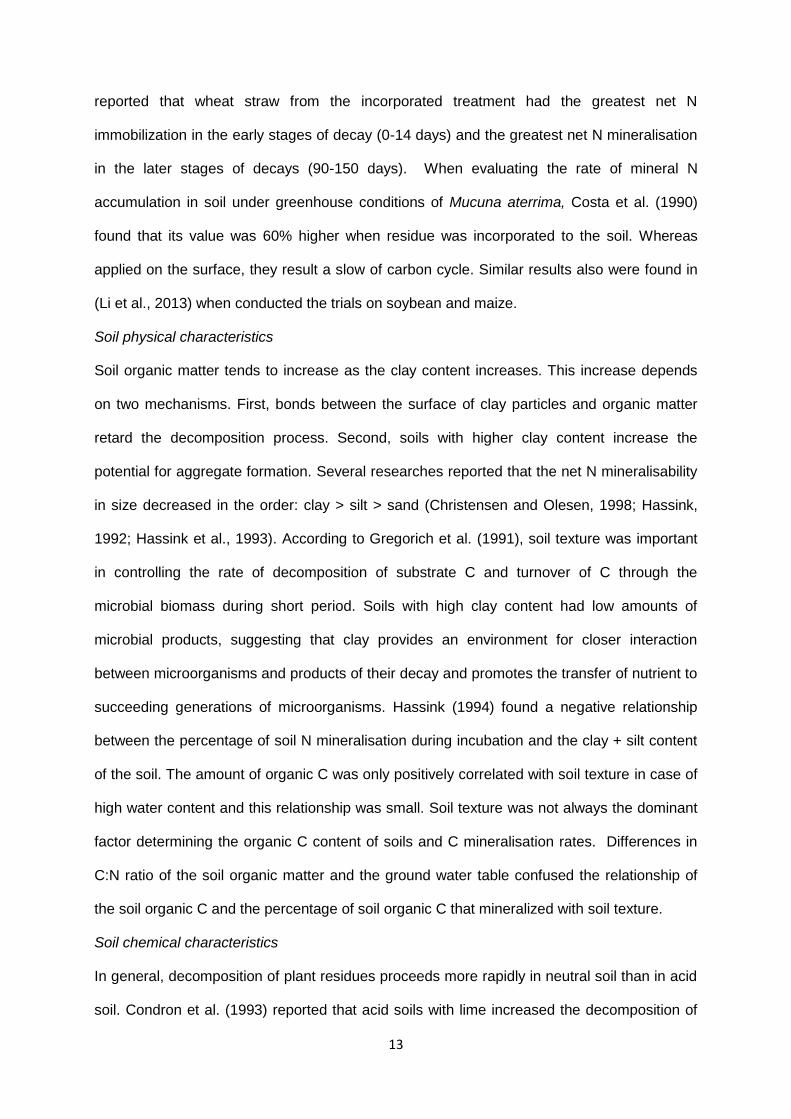
13
reported that wheat straw from the incorporated treatment had the greatest net N
immobilization in the early stages of decay (0-14 days) and the greatest net N mineralisation
in the later stages of decays (90-150 days). When evaluating the rate of mineral N
accumulation in soil under greenhouse conditions of Mucuna aterrima, Costa et al. (1990)
found that its value was 60% higher when residue was incorporated to the soil. Whereas
applied on the surface, they result a slow of carbon cycle. Similar results also were found in
(Li et al., 2013) when conducted the trials on soybean and maize.
Soil physical characteristics
Soil organic matter tends to increase as the clay content increases. This increase depends
on two mechanisms. First, bonds between the surface of clay particles and organic matter
retard the decomposition process. Second, soils with higher clay content increase the
potential for aggregate formation. Several researches reported that the net N mineralisability
in size decreased in the order: clay > silt > sand (Christensen and Olesen, 1998; Hassink,
1992; Hassink et al., 1993). According to Gregorich et al. (1991), soil texture was important
in controlling the rate of decomposition of substrate C and turnover of C through the
microbial biomass during short period. Soils with high clay content had low amounts of
microbial products, suggesting that clay provides an environment for closer interaction
between microorganisms and products of their decay and promotes the transfer of nutrient to
succeeding generations of microorganisms. Hassink (1994) found a negative relationship
between the percentage of soil N mineralisation during incubation and the clay + silt content
of the soil. The amount of organic C was only positively correlated with soil texture in case of
high water content and this relationship was small. Soil texture was not always the dominant
factor determining the organic C content of soils and C mineralisation rates. Differences in
C:N ratio of the soil organic matter and the ground water table confused the relationship of
the soil organic C and the percentage of soil organic C that mineralized with soil texture.
Soil chemical characteristics
In general, decomposition of plant residues proceeds more rapidly in neutral soil than in acid
soil. Condron et al. (1993) reported that acid soils with lime increased the decomposition of

14
plant residues. In particular, over 17 weeks of incubation, the total amounts of CO2-C evolved
from the litter and litter plus lime treated soils accounted to 20% and 30% of the added C
residues. When examining the effects of soil pH on decomposition of added plant residues in
tropical forest soils (pH ranged from 3.9 to 6.7), Motavalli et al. (1995) found a positive
relationship between initial soil pH and cumulative CO2 release after 7 days of incubation and
continued up to 270 days. It is also known that the addition of available nutrients such as
nitrogen, phosphorus and potassium can accelerate the decomposition of soil organic matter
(Muhammad et al., 2011; Recous et al., 1995). The use of some fertilizers, especially N
fertilizers, and pesticides can boost micro-organism activity and thus decomposition of
organic matter. The chemicals provide the microorganisms with easy-to-use N components.
This is especially important where the C: N ratio of the soil organic matter is high and thus
decomposition is slowed by a lack of N. The percentage of soil C mineralisation in sandy
soils was negatively correlated with the C:N ratio of the soil organic matter (Hassink, 1994).
Soil water content
Residue decomposition requires water for microbial growth and for the diffusion of nutrients
during the breakdown process. Decomposition of organic matter occurs more slowly in poorly
aerated soils, where existing the limitation of oxygen, compared with well aerated soils. In a
permanently waterlogged soil, one of the major structural parts of plants, lignin, does not
decompose at all. The ultimate consequence of extremely wet or swampy conditions is the
development of organic (peat or muck) soils, with organic matter contents of more than 30
percent. Where soils are drained artificially for agricultural or other uses, the soil organic
matter decomposes rapidly (Bot and Benites, 2005).
1.3. The application of model in representing the C and N dynamics in soil – plant – atmosphere systems
1.3.1. Overview of some Soil Organic Matter (SOM) models
Understanding the dynamics of soil organic matter which is mainly added from plant residues
plays an important role to face with several issues of environmental and agricultural

15
activities. Many of the issues cannot be explained by direct experimentation due to the long
time periods involved, they also involve consideration climate change scenarios that cannot
be reproduced on a large scale or because broad conclusions are required based on data
from a limited number of sites. Modelling SOM changes is the only practical approach in
many instances. A large number of models are now published in the wide possible range of
environment. Using simulation models to predict the mineralisation of carbon and nitrogen in
farming systems has been mentioned widely in various models such as APSIM, Century,
STICS, DSSAT, CERES…(Mohanty et al., 2011; Probert et al., 2005; Justes et al., 2009;
Nicolardot et al., 2001; Garnier et al., 2003; Corbeels et al., 2005; Jones et al., 2003). All
models of nitrogen turnover in soil share some common features. They just differ in the
complexity with which they deal with these processes. Below we will shortly describe some
popular SOILN models that are being used and its important characteristics.
CANDY (CArbon- Nitrogen-DYnamics) is a modular system of simulation models and a data
base system for model parameters, measurement values, initial values, weather data and
soil management data (Franko, 1995; Franko et al., 1995). It simulates dynamics of soil N,
temperature and water in order to provide information about N uptake by crops, leaching and
water quality. CANDY uses a semi-cohort system to track litter decay, and calculates a
biologically active time to allow comparisons among sites.
CENTURY: The model simulates soil organic matter dynamics in natural or cultivated
systems and represents the dynamics of C, N, P, and S in the soil – plant system using a
monthly time step. The model includes three soil organic matter pools (active, slow and
passive) with different potential decomposition rates, above and below ground litter pools
and a surface microbial pool which is associated with decomposing surface litter (Parton,
1996). At initialization of the simulation, the fractional ratio of these three pools is set, with
SOM1 of only about 2% of total SOM, while SOM2 and SOM3 vary with the management
history of the soil (grassland or cultivated) and the degree of depletion. CENTURY was
developed with data from temperate regions, were not applicable for all cropping systems
(Parton et al., 1988).

16
DAISY: The model is adapted to the wet temperate climate of North Western Europe
(Hansen et al., 1991). The soil organic matter submodel considers three organic pools as
added organic matter (AOM), soil microbial biomass (SMB), and soil organic matter (SOM =
total organic matter C – SMB-C – AOM-C), each pools are divided into two subpools: one
with a slow turnover and one with a fast turnover. The decay rate constants are functions of
soil temperature, soil water and soil clay content. The corresponding N-pools are calculated
from the amount of C in the pools using a fixed CN ratio for each pool (default values). The
soil organic matter (SOM) is subdivided into three subpools designated SOM0, SOM1 and
SOM2. The subpool SOM0 can be neglected as it consists of almost inert organic matter.
The rate of decomposition of SOM1 and SOM2 are simulated by first order reaction kinetics.
The subpool SOM1 is assumed to consist of chemically stabilized organic matter, while the
subpool SOM2 is assumed to consist of organic matter.
DNDC (denitrification and decomposition) model is used to predict emission of CO2, N2O and
N2 from agricultural soils. The organic matter was divided into three pools: decomposable
residues (mainly plant residues), microbial biomass and humads, each pool has a labile and
resistant component and decomposes independently. The residue pool is divided into three
subpools based on its rate of decomposition. The passive organic phase, or stable humus, is
assumed not to interact with the active phase during the short time span of the model (about
1 year). In the DNDC model, nitrogen uptake by vegetation is the key process linking crop
growth with climate and soil status (Li et al., 1992; Li et al., 1994; Li, 1996). In DNDC, SOM
pool consists of several sub-pools of labile/resistant litter, microbes, humads, and humus.
Each sub-pool has its own C:N ratio. The size and quality (C:N ratio) of the SOM pools
dominate the overall decomposition rate. When SOM decomposes from one sub-pool to
another, available N may release from or be required by the decomposing process because
of the deference in C:N ratio between the two sub-pools.
NCSOIL model simulates C and N (total and tracers) transformations in soils (Molina, 1996;
Molina et al., 1983). It comprises four organic pools: plant residues, microbial biomass with a

17
labile (0.33 d-1) and a resistant (0.04 d-1) component, the humads and pool III which is
considered as the stable organic matter (Nicolardot et al., 1994).
1.3.2. Description of using model – SOILN in APSIM
APSIM (Agricultural Production Systems Simulators) is a modelling framework which
provides a flexible structure for the simulation of climatic and soil management effects on
crop growth in farming systems and changes in the soil resource (Keating et al., 2003). The
SoilN module in the APSIM describes the dynamics of both carbon and nitrogen in soil and it
can be traced back via CERES models (Probert et al., 2005). The framework and the
transformations considered in each layer are shown in Figure 1.6. In general, plant residues
and roots added to the soil (sometimes referred as fresh organic matter (FOM)) are
considered into three different pools (FPOOLs) and sometimes referred to as the
carbohydrate-like (FPOOL 1), cellulose-like (FPOOL2) and lignin-like (FPOOL3) fractions of
the residues (Probert et al., 2005). Each FPOOL has its own rate of decomposition, which is
modified by factors to allow effects of soil temperature and soil moisture. In circumstances
where there is inadequate mineral N to meet an immobilization demand, as can occur where
the C:N ratio of the FOM pool is high, the decomposition process is limited by the N available
to be immobilised. Decomposition of FOM results in formation of soil organic matter
comprising the soil microbial biomass (BIOM) and humid (HUM) pools. The BIOM pool is
notionally the more labile organic matter associated with soil microbial biomass, it has a
higher rate of turnover than the bulk of the soil organic matter even though it makes up a
relatively small part of the total soil organic matter. SOILN assumes that the pathway for
synthesis of stable soil organic matter is predominantly through initial formation of BIOM,
though some carbon may be transferred directly to the more stable pool (HUM). The model
further assumes that the soil organic matter pools (BIOM and HUM) have C:N ratios that are
unchanging through time. The C:N ratio of the BIOM pool is typically set at 8, while that of
the HUM pool is based on the C:N ratio of the soil, which is an input at initialisation of a
simulation. The formation of BIOM and HUM thus creates an immobilization demand that has
to be met from the N released from the decomposing pools and/or by drawing on the mineral

18
N (ammonium and nitrate) in the layer. Any release of N above the immobilisation demand
during the decomposition process results in an increase in the ammonium-N.
Figure 1.6. The framework of SOILN module and the transformation occurring in each layer.
1.3.3. The application of SOILN in representing the dynamic of C and N
SOILN has been tested successfully in diverse plant residue to represent the decomposition
of organic input, and the influence of residues quality on nitrogen release in different climate
conditions of various organic materials and soil types. On a Vertosol soil in the Australian
subtropics, the prediction of soil N and water dynamics following 2-year ley phases from
APSIM is closely represented over 4 years of grain sorghum following grazed annual legume
leys or a grass pasture systems (Whitbread and Clem, 2006). By simulation of hypothetical
materials, Probert et al. (2005) shown that SOILN could be parameterized to simulate the
general pattern of N mineralisation of various organic manures and feeds. By using modified
values of added C in the three FPOOLs from the default value as 0.2:0.7:0.1, SOILN could
predict the N mineralisation from a wide range of materials having total C:N ratio from 13-86
(Probert et al., 2005). To specify different proportion of C and N in different FPOOLs, Probert
CO2
CO2
Mineralisation
Immobilisation
FOM
Roots
CO2
CO2
Leaching
Amonium Nitrate
Denitrification
CO2
BIOM
HUM INERT
Plant SurfaceOM

19
et al. (2005) used C and N in the water soluble components for FPOOL1 and measured ADL
to specify the C in FPOOL 3. The C:N of FPOOL2 was estimated from measured data for N
associated with ADF and NDF. However, it still remains a challenge that how to know
appropriate parameters should be selected for a given source and/or how to derive the
parameter values from other information. Using a similar approach, Mohanty et al. (2011)
found an agreement between predicted N mineralisation from Gliricidia and farmyard manure
by APSIM SOILN under different rates of application (5 g kg-1 and 10 g kg-1 on dry matter
basis) and the observed data under incubation condition. Huth et al. (2010) found that
APSIM –SOILN was able to adequately describe the major processes and resultant changes
in soil C and N content within the surface soil layers (0-30cm) when adjusting the
denitrification rate coefficient and C:N ratios in soil organic matter pools. When examining the
performance of APSIM to predict the long term soil C dynamics under various agricultural
practices at four semi-arid sites across the wheat-belt of eastern Australia, Luo et al. (2011)
found that APSIM was able to predict soil C dynamics. Meier et al. (2006) reported that
APSIM SOILN could simulate well the mineral N behavior of the 48-day incubations by using
default values of three FPOOLs. Similar results were also reported in Thorburn et al. (2005),
Thorburn et al. (2010) under sugarcane systems, in Archontoulis et al. (2014) under
Midwestern production systems in America.
1.4. Objectives of the study
Objectives
The main objective of this thesis is to evaluate the dynamics of carbon and nitrogen
mineralization from diverse plant residues in soil – plant systems by comparing measured
data from laboratory and predicted data from modelling. In order to explain for this objective,
some main sub-objectives are:
i) To determine the impact of biochemical quality of different added plant residues,
soil types and residue application methods on the release of C and N under
controlled conditions.

20
ii) To evaluate the performance of original SOILN model and improve the model
parameterization and assess the comprehensive decomposition model of C and N
mineralisation in short term.
iii) To assess the impact of residue application, time of application, residue types on
the gas fluxes (CO2), N mineralisation and 15N recovery to plant.
Hypothesis
The research question at the core of this work can be summarized as followed: How does
the carbon and nitrogen dynamics react to different plant residues and can they be modeled?
To answer this question, this thesis tests the following hypotheses:
i) For low input systems where plant residues play a major role in the supply of
nutrients to crops, residue quality is the most important factor affected on nutrient
release.
ii) Modelling N and C release from diverse residue and connecting to plant growth
modelling is needed for low input tropical systems.
iii) Determining plant quality based on existing analytical techniques can be used as the
basis for parameterizing a soil organic matter model to simulate the
mineralisation/immobilization of C and N of a wide range of biochemical quality of
residues under controlled conditions.
iv) In the long term of application, the N recovery from plant residues will be decreased
and driven by their characteristics.
1.5. Structure of the thesis
This thesis is divided into 5 chapters. Following this general introduction chapter, next three
chapters (2, 3, 4) will focus on three main objectives above. Each chapter is written in the
form of journal articles. In chapter 5 the research results will be generally assessed against
the overall objectives and the conclusions from the study.
21
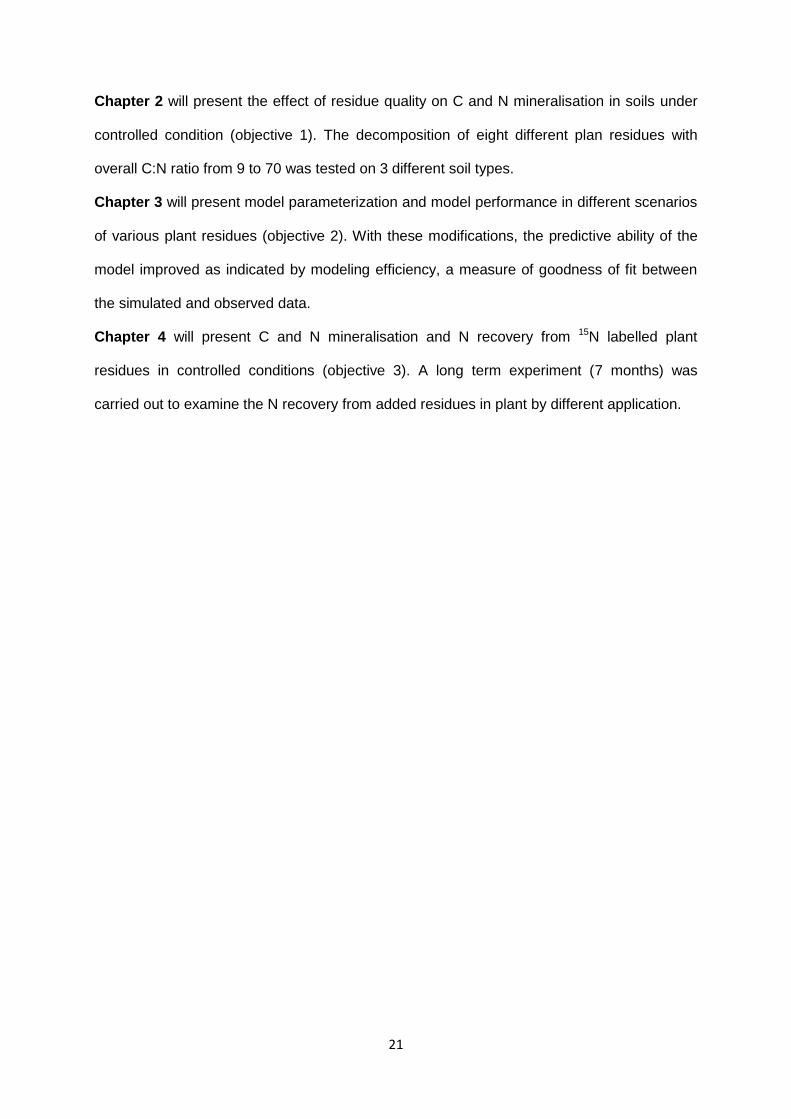
Chapter 2 will present the effect of residue quality on C and N mineralisation in soils under
controlled condition (objective 1). The decomposition of eight different plan residues with
overall C:N ratio from 9 to 70 was tested on 3 different soil types.
Chapter 3 will present model parameterization and model performance in different scenarios
of various plant residues (objective 2). With these modifications, the predictive ability of the
model improved as indicated by modeling efficiency, a measure of goodness of fit between
the simulated and observed data.
Chapter 4 will present C and N mineralisation and N recovery from 15N labelled plant
residues in controlled conditions (objective 3). A long term experiment (7 months) was
carried out to examine the N recovery from added residues in plant by different application.

22
1.6. References
Archontoulis, S. V., Miguez, F. E., and Moore, K. J., Evaluating APSIM Maize, Soil Water, Soil Nitrogen,
Manure, and Soil Temperature Modules in the Midwestern United States, 2014. Aregheore, M., ‘Voluntary intake and nutrient digestibility of crop-residue based rations by goats and
sheep’, Small Ruminant Research, Vol. 22, No. 1, 1996. Baudron, F., Delmotte, S., Corbeels, M., Herrera, J. M., and Tittonell, P., ‘Multi-scale trade-off analysis
of cereal residue use for livestock feeding vs. soil mulching in the Mid-Zambezi Valley, Zimbabwe’, Biomass use trade-offs in cereal cropping systems:Lessons and implications from the developing world, Vol. 134, 2015.
Bending, G. D., Turner, M. K., and Burns, I. G., ‘Fate of nitrogen from crop residues as affected by biochemical quality and the microbial biomass’, Soil Biology and Biochemistry, Vol. 30, No. 14, 1998.
Bengtsson, J., Ahnström, J., and Weibull, A.-C., ‘The effects of organic agriculture on biodiversity and abundance: a meta-analysis’, Journal of Applied Ecology, Vol. 42, No. 2, 2005.
Bot, A., and Benites, J., The importance of soil organic matter. Key to drought-resistant soil and sustained food production, Food and Agriculture Organization of the United Nations, 2005.
Bowyer, J. L. &. S. V. E., ‘Agricultural residues: An exciting bio-based raw material for the global panels industry.’, Forest Products Journal, Vol. 51, No. 1, 2001.
Brisson, N., Gary, C., Justes, E., Roche, R., Mary, B., Ripoche, D., Zimmer, D., Sierra, J., Bertuzzi, P., Burger, P., Bussière, F., Cabidoche, Y. M., Cellier, P., Debaeke, P., Gaudillère, J. P., Hénault, C., Maraux, F., Seguin, B., and Sinoquet, H., ‘An overview of the crop model stics. Modelling Cropping Systems: Science, Software and Applications’, European Journal of Agronomy, Vol. 18, 3–4, 2003.
Castellanos-Navarrete, A., Tittonell, P., Rufino, M. C., and Giller, K. E., ‘Feeding, crop residue and manure management for integrated soil fertility management – A case study from Kenya’, Biomass use trade-offs in cereal cropping systems:Lessons and implications from the developing world, Vol. 134, 2015.
Chen, Y., and Avnimelech, Y., The Role of Organic Matter in Modern Agriculture, Springer Netherlands, 1986.
Cherubini, F., and Ulgiati, S., ‘Crop residues as raw materials for biorefinery systems – A LCA case study’, Applied Energy, Vol. 87, No. 1, 2010.
Christensen, B. T., and Olesen, J. E., ‘Nitrogen mineralization potential of organomineral size separates from soils with annual straw incorporation’, European Journal of Soil Science, Vol. 49, No. 1, 1998.
Condron, L. M., Tiessen, H., Trasar-Cepeda, C., Moir, J. O., and Stewart, J. W. B., ‘Effects of liming on organic matter decomposition and phosphorus extractability in an acid humic Ranker soil from northwest Spain’, Biology and Fertility of Soils, Vol. 15, No. 4, 1993
Constantinides, M., and Fownes, J. H., ‘Nitrogen mineralization from leaves and litter of tropical plants: Relationship to nitrogen, lignin and soluble polyphenol concentrations’, Soil Biology and Biochemistry, Vol. 26, No. 1, 1994.
Cookson, W. R., Beare, M. H., and Wilson, P. E., ‘Effects of prior crop residue management on microbial properties and crop residue decomposition’, Applied Soil Ecology, Vol. 7, No. 2, 1998.
Corbeels, M., McMurtrie, R. E., Pepper, D. A., and O’Connell, A. M., ‘A process-based model of nitrogen cycling in forest plantations: Part II. Simulating growth and nitrogen mineralisation of Eucalyptus globulus plantations in south-western Australia’, Ecological Modelling, Vol. 187, No. 4, 2005.
Costa, F. J. S. A., Bouldin, D. R., and Suhet, A. R., ‘Evaluation of N recovery from mucuna placed on the surface or incorporated in a Brazilian oxisol’, Plant and Soil, Vol. 124, No. 1, 1990.
E Owen and M C N Jayasuriya, ‘Use of crop residues as animal feeds in developing coutries’, Research and development in Agriculture, Vol. 6, No. 3, 1989.

23
Food and Agriculture Organisation of the United Nations, ‘FAOSTAT database (FAOSTAT. 2013), available at http://faostat3.fao.org/download/G1/GA/E’
Fox, R. H., Myers, R. J. K., and Vallis, I., ‘The nitrogen mineralization rate of legume residues in soil as influenced by their polyphenol, lignin, and nitrogen contents’, Plant and Soil, Vol. 129, No. 2, 1990
Garnier, P., Néel, C., AITA, C., Recous, S., Lafolie, F., and Mary, B., ‘Modelling carbon and nitrogen dynamics in a bare soil with and without straw incorporation’, European Journal of Soil Science, Vol. 54, No. 3, 2003.
Gattinger, A., Muller, A., Haeni, M., Skinner, C., Fliessbach, A., Buchmann, N., Mäder, P., Stolze, M., Smith, P., Scialabba, N. E.-H., and Niggli, U., ‘Enhanced top soil carbon stocks under organic farming’, Proceedings of the National Academy of Sciences, Vol. 109, No. 44, 2012.
Gijsman, A. J., Hoogenboom, G., Parton, W. J., and Kerridge, P. C., ‘Modifying DSSAT Crop Models for Low-Input Agricultural Systems Using a Soil Organic Matter–Residue Module from CENTURY’, Agron. J, Vol. 94, No. 3, 2002.
Gregorich, E. G., Voroney, R. P., and Kachanoski, R. G., ‘Turnover of carbon through the microbial biomass in soils with different texture’, Soil Biology and Biochemistry, Vol. 23, No. 8, 1991.
Hansen, S., Jensen, H. E., Nielsen, N. E., and Svendsen, H., ‘Simulation of nitrogen dynamics and biomass production in winter wheat using the Danish simulation model DAISY’, Fertilizer Research, Vol. 27, 2-3, 1991.
Hassink, J., ‘Effects of soil texture and structure on carbon and nitrogen mineralization in grassland soils’, Biology and Fertility of Soils, Vol. 14, No. 2, 1992.
Hassink, J., ‘Effects of soil texture and grassland management on soil organic C and N and rates of C and N mineralization’, Soil Biology and Biochemistry, Vol. 26, No. 9, 1994.
Hassink, J., Bouwman, L. A., Zwart, K. B., Bloem, J., and Brussaard, L., ‘Relationships between soil texture, physical protection of organic matter, soil biota, and c and n mineralization in grassland soils’, Soil Structure/Soil Biota Interrelationships, Vol. 57, 1–2, 1993.
Hassink, J., Neutel, A. M., and ruiter, P. C. de, ‘C and N mineralization in sandy and loamy grassland soils: The role of microbes and microfauna’, Soil Biology and Biochemistry, Vol. 26, No. 11, 1994.
Hole, D. G., Perkins, A. J., Wilson, J. D., Alexander, I. H., Grice, P. V., and Evans, A. D., ‘Does organic farming benefit biodiversity?’, Biological Conservation, Vol. 122, No. 1, 2005.
Huth, N., Thorburn, P., Radford, B., and Thornton, C., ‘Impacts of fertilisers and legumes on N2O and CO2 emissions from soils in subtropical agricultural systems: A simulation study’, Agriculture, Ecosystems & Environment, Vol. 136, 3-4, 2010.
Jaleta, M., Kassie, M., and Erenstein, O., ‘Determinants of maize stover utilization as feed, fuel and soil amendment in mixed crop-livestock systems, Ethiopia’, Biomass use trade-offs in cereal cropping systems:Lessons and implications from the developing world, Vol. 134, 2015.
Johansson, T. B., and Goldemberg, J., Energy for sustainable development. A policy agenda, United Nations Development Programme, 2002.
Jones, J. W., Hoogenboom, G., Porter, C. H., Boote, K. J., Batchelor, W. D., Hunt, L. A., Wilkens, P. W., Singh, U., Gijsman, A. J., and Ritchie, J. T., ‘The DSSAT cropping system model. Modelling Cropping Systems: Science, Software and Applications’, European Journal of Agronomy, Vol. 18, 3–4, 2003.
Justes, E., Mary, B., and NICOLARDOT, B., ‘Quantifying and modelling C and N mineralization kinetics of catch crop residues in soil: parameterization of the residue decomposition module of STICS model for mature and non mature residues’, Plant and Soil, Vol. 325, 1-2, 2009.
Keating, B. A., Carberry, P. S., Hammer, G. L., Probert, M. E., Robertson, M. J., Holzworth, D., Huth, N. I., Hargreaves, J. N. G., Meinke, H., Hochman, Z., McLean, G., Verburg, K., Snow, V., Dimes, J. P., Silburn, M., Wang, E., Brown, S., Bristow, K. L., Asseng, S., Chapman, S., McCown, R. L., Freebairn, D. M., and Smith, C. J., ‘An overview of APSIM, a model designed for farming systems simulation. Modelling Cropping Systems: Science, Software and Applications’, European Journal of Agronomy, Vol. 18, 3–4, 2003.

24
Kim, S., and Dale, B. E., ‘Global potential bioethanol production from wasted crops and crop residues’, Biomass and Bioenergy, Vol. 26, No. 4, 2004.
Kumar, K., and Goh, K. M., ‘Crop Residues and Management Practices: Effects on Soil Quality, Soil Nitrogen Dynamics, Crop Yield, and Nitrogen Recovery’, in Donald L. Sparks (ed.), Advances in Agronomy, Academic Press, 1999.
Lal, R., ‘The Role of Residues Management in Sustainable Agricultural Systems’, Journal of Sustainable Agriculture, Vol. 5, No. 4, 1995.
Lal, R., ‘Carbon sequestration in dryland ecosystems of West Asia and North Africa’, Land Degradation & Development, Vol. 13, No. 1, 2002.
Lal, R., ‘World crop residues production and implications of its use as a biofuel’, Environment International, Vol. 31, No. 4, 2005.
Lal, R., ‘Crop residues as soil amendments and feedstock for bioethanol production’, Waste Management, Vol. 28, No. 4, 2008.
Lansink, A. O., Ierland, E. C., and Best, G., ‘Sustainable Energy in Agriculture: Issues and Scope’, in E. C. Ierland and A. O. Lansink (eds.), Economy & Environment, Kluwer Academic Publishers, 2003.
Lascano, R. J., and Baumhardt, R. L., ‘Effects of crop residue on soil and plant water evaporation in a dryland cotton system’, Theoretical and Applied Climatology, Vol. 54, No. 1, 1996
Li, C., ‘The DNDC Model’, in D. Powlson, P. Smith and J. Smith (eds.), Evaluation of Soil Organic Matter Models, Springer Berlin Heidelberg, 1996.
Li, C., Frolking, S., and Frolking, T. A., ‘A model of nitrous oxide evolution from soil driven by rainfall events: 1. Model structure and sensitivity’, Journal of Geophysical Research: Atmospheres, Vol. 97, D9, 1992.
Li, C., Frolking, S., and Harriss, R., ‘Modeling carbon biogeochemistry in agricultural soils’, Global Biogeochemical Cycles, Vol. 8, No. 3, 1994.
Li, L.-J., Han, X.-Z., You, M.-Y., Yuan, Y.-R., Ding, X.-L., and Qiao, Y.-F., ‘Carbon and nitrogen mineralization patterns of two contrasting crop residues in a Mollisol: Effects of residue type and placement in soils’, European Journal of Soil Biology, Vol. 54, 2013.
Luo, Z., Wang, E., Sun, O. J., Smith, C. J., and Probert, M. E., ‘Modeling long-term soil carbon dynamics and sequestration potential in semi-arid agro-ecosystems’, Agricultural and Forest Meteorology, Vol. 151, No. 12, 2011.
Mader, P., ‘Soil Fertility and Biodiversity in Organic Farming’, Science, Vol. 296, No. 5573, 2002. Meier, E. A., Thorburn, P. J., and Probert, M. E., ‘Occurrence and simulation of nitrification in two
contrasting sugarcane soils from the Australian wet tropics’, Australian Journal of Soil Research, Vol. 44, No. 1, 2006.
Mohanty, M., Reddy, K. S., Probert, M., Dalal, R., Rao, A. S., and Menzies, N., ‘Modelling N mineralization from green manure and farmyard manure from a laboratory incubation study’, Ecological Modelling, Vol. 222, No. 3, 2011.
Molina, J. A. E., ‘Description of the model NCSOIL’, in D. Powlson, P. Smith and J. Smith (eds.), Evaluation of Soil Organic Matter Models, Springer Berlin Heidelberg, 1996.
Molina, J. A. E., Clapp, C. E., Shaffer, M. J., Chichester, F. W., and Larson, W. E., NCSOIL, A Model of Nitrogen and Carbon Transformations in Soil: Description, Calibration, and Behavior1, 1983.
Motavalli, P., Palm, C., Parton, W., Elliott, E., and Frey, S., ‘Soil pH and organic C dynamics in tropical forest soils: Evidence from laboratory and simulation studies’, Soil Biology and Biochemistry, Vol. 27, No. 12, 1995.
Muhammad, W., Vaughan, S., Dalal, R., and Menzies, N., ‘Crop residues and fertilizer nitrogen influence residue decomposition and nitrous oxide emission from a Vertisol’, Biology and Fertility of Soils, Vol. 47, No. 1, 2011.
Nicolardot, B., Molina, J. A. E., and Allard, M. R., ‘C and N fluxes between pools of soil organic matter: Model calibration with long-term incubation data’, Soil Biology and Biochemistry, Vol. 26, No. 2, 1994.

25
Nicolardot, B., Recous, S., and Mary, B., ‘Simulation of C and N mineralisation during crop residue decomposition: A simple dynamic model based on the C:N ratio of the residues’, Plant and Soil, Vol. 228, No. 1, 2001.
Njie, M., and Reed, J. D., ‘Potential of crop residues and agricultural by-products for feeding sheep in a Gambian village’, Animal Feed Science and Technology, Vol. 52, 3–4, 1995.
Onwuka, C. F. I., Adetiloye, P. O., and Afolami, C. A., ‘Use of household wastes and crop residues in small ruminant feeding in Nigeria’, Small Ruminant Research, Vol. 24, No. 3, 1997.
Pacini, C., Wossink, A., Giesen, G., Vazzana, C., and Huirne, R., ‘Evaluation of sustainability of organic, integrated and conventional farming systems: a farm and field-scale analysis’, Agriculture, Ecosystems & Environment, Vol. 95, No. 1, 2003.
Palm, C. A., and Sanchez, P. A., ‘Nitrogen release from the leaves of some tropical legumes as affected by their lignin and polyphenolic contents’, Soil Biology and Biochemistry, Vol. 23, No. 1, 1991.
Parthasarathy Rao, P., and Hall, A. J., ‘Importance of crop residues in crop–livestock systems in India and farmers’ perceptions of fodder quality in coarse cereals’, Approaches to improve the utilization of food-feed crops, Vol. 84, 1–2, 2003.
Parton, W. J., ‘The CENTURY model’, in D. Powlson, P. Smith and J. Smith (eds.), Evaluation of Soil Organic Matter Models, Springer Berlin Heidelberg, 1996.
Parton, W. J., Stewart, J. W. B., and Cole, C. V., ‘Dynamics of C, N, P and S in grassland soils: a model’, Biogeochemistry, Vol. 5, No. 1, 1988.
Probert, M., Delve, R., Kimani, S., and Dimes, J., ‘Modelling nitrogen mineralization from manures: representing quality aspects by varying C:N ratio of sub-pools’, Soil Biology and Biochemistry, Vol. 37, No. 2, 2005.
Recous, S., Robin, D., Darwis, D., and Mary, B., ‘Soil inorganic N availability: Effect on maize residue decomposition’, Soil Biology and Biochemistry, Vol. 27, No. 12, 1995.
Shaver, T. M., Peterson, G. A., Ahuja, L. R., and Westfall, D. G., ‘Soil sorptivity enhancement with crop residue accumulation in semiarid dryland no-till agroecosystems’, Geoderma, Vol. 192, 2013.
Thorburn, P. J., Meier, E. A., and Probert, M. E., ‘Modelling nitrogen dynamics in sugarcane systems: Recent advances and applications’, Field Crops Research, Vol. 92, 2–3, 2005.
Thorburn, P., Biggs, J., Collins, K., and Probert, M., ‘Using the APSIM model to estimate nitrous oxide emissions from diverse Australian sugarcane production systems’, Agriculture, Ecosystems & Environment, Vol. 136, 3-4, 2010.
Tian, G., Badejo, M. A., Okoh, A. I., Ishida, F., Kolawole, G. O., Hayashi, Y., and Salako, F. K., ‘Effects of residue quality and climate on plant residue decomposition and nutrient release along the transect from humid forest to Sahel of West Africa’, Biogeochemistry, Vol. 86, No. 2, 2007.
Tian, G., Kang, B. T., and Brussaard, L., ‘Biological effects of plant residues with contrasting chemical compositions under humid tropical conditions—Decomposition and nutrient release’, Soil Biology and Biochemistry, Vol. 24, No. 10, 1992.
Trinsoutrot, I., Recous, S., Bentz, B., Line`res, M., Che`neby, D., and NICOLARDOT, B., ‘Biochemical Quality of Crop Residues and Carbon and Nitrogen Mineralization Kinetics under Nonlimiting Nitrogen Conditions’, Soil Sci. Soc. Am. J, Vol. 64, No. 3, 2000a.
Trinsoutrot, I., Recous, S., Mary, B., and NICOLARDOT, B., ‘C and N fluxes of decomposing 13C and 15N Brassica napus L.: effects of residue composition and N content’, Soil Biology and Biochemistry, Vol. 32, 11–12, 2000b.
Tuomisto, H. L., Hodge, I. D., Riordan, P., and Macdonald, D. W., ‘Does organic farming reduce environmental impacts? – A meta-analysis of European research’, Journal of Environmental Management, Vol. 112, 2012.
Urbaniec, K., and Bakker, R. R., ‘Biomass residues as raw material for dark hydrogen fermentation – A review’, International Journal of Hydrogen Energy, Vol. 40, No. 9, 2015.
Vahdat, E., Nourbakhsh, F., and Basiri, M., ‘Lignin content of range plant residues controls N mineralization in soil’, European Journal of Soil Biology, Vol. 47, No. 4, 2011.
26
Valbuena, D., Erenstein, O., Homann-Kee Tui, S., Abdoulaye, T., Claessens, L., Duncan, A. J., Gérard, B., Rufino, M. C., Teufel, N., van Rooyen, A., and van Wijk, M. T., ‘Conservation Agriculture in mixed crop–livestock systems: Scoping crop residue trade-offs in Sub-Saharan Africa and South Asia’, Conservation Agriculture in Dry Areas, Vol. 132, 2012.
van S. J. Donk, D. L. M. S. I. S. R. M. J. L. P. D. R. D., ‘Crop Residue Cover Effects On Evaporation, Soil Water Content, And Yield Of Deficit‐Irrigated Corn In West‐Central Nebraska’, Transactions of the ASABE, Vol. 53, No. 6, 2010.
Ververis, C., Georghiou, K., Christodoulakis, N., Santas, P., and Santas, R., ‘Fiber dimensions, lignin and cellulose content of various plant materials and their suitability for paper production’, Industrial Crops and Products, Vol. 19, No. 3, 2004.
Whitbread, A. M., and Clem, R. L., ‘Graze to grain—measuring and modelling the effects of grazed pasture leys on soil nitrogen and sorghum yield on a Vertosol soil in the Australian subtropics’, Australian Journal of Agricultural Research, Vol. 57, No. 5, 2006.
Willke, T., and Vorlop, K.-D., ‘Industrial bioconversion of renewable resources as an alternative to conventional chemistry’, Applied Microbiology and Biotechnology, Vol. 66, No. 2, 2004.
27
Chapter 2. Evaluating the effect of residue quality on C and N mineralization in soils
under controlled conditions
2.1. Introduction
There can be no doubt that the use of residues as an alternative nutrient source is growing in
agricultural farming systems throughout the tropics and subtropics. The role of residues is
not only important for nutrient supply for plant growth in short-term (Whitbread et al., 2000a)
but also for soil organic matter (SOM) maintenance in long-term (Mary et al., 1996;
Whitbread et al., 2000b). The pattern of breakdown of residues can also affect the nutrient
transitions in soil and soil microbial activities (Powlson, 1996). Losses of SOM have
consequences for productivity, quality of agricultural produce and environmental quality
(Whitbread et al., 1998; Blanco-Canqui and Lal, 2009).
The mineralisation of crop residue in soils is complex and is controlled by several factors,
such as soil conditions and soil characteristics (Cookson et al., 2002; Aita et al., 1997; Khalil
et al., 2005; Hassink, 1992; Khalil et al., 2007; Muhammad et al., 2011), residue
characteristics and management (Angers and Recous, 1997; Coppens et al., 2007; Janzen
and Kucey, 1988; Muhammad et al., 2011; Trinsoutrot et al., 2000a; Trinsoutrot et al., 2000b;
Vanlauwe et al., 1996). Among the numerous factors affecting the decomposition of crop
residues under field conditions, chemical composition is widely mentioned as an important
factor (Trinsoutrot et al., 2000a; Tian et al., 1992). The C:N ratio has been mentioned as a
good predictor of plant residue decomposition and net mineralisation or immobilization when
applied to soils (Nicolardot et al., 2001; Qian and Schoenau, 2002). The N mineralized from
residues was significantly and negatively correlated with high C:N ratio of plant residues
(Muhammad et al., 2011; Trinsoutrot et al., 2000a). Crop residues with C:N ratio less than 24
are expected to result in net N mineralisation, while those with C:N ratios higher than 24
cause immobilization after times of application (Trinsoutrot et al., 2000a). The effect of the
chemical composition of added residues on the release of C and N has been documented in
several studies. The research of Powlson et al. (1996) showed that the different
decomposition rate of added plant residues could be related to initial polyphenol/N and

28
polyphenol+lignin:N ratios. The cumulative N release could be predicted with the
(polyphenol+lignin):N ratio of the initial substrate in the first 2 weeks of decomposition
processes (Powlson et al., 1996). The role of lignin as a regulator in the decomposition process
has been eluded to in studies by Tian et al. (1992), Müller et al. (2003), Palm and Sanchez
(1991). Tian et al. (1992) found negative correlations between decomposition rate of some
woody agroforestry plants and their C:N ratio, percent lignin and polyphenol content. According
to Palm and Sanchez (1991), the polyphenolic content played a more important role in
influencing net N mineralization pattern for leguminous leaves than %N or lignin –to- N ratio.
Furthermore, Vanlauwe et al. (1996) found the correlation between C mineralization of some
leaves and roots of 3 agroforestry plants and lignin content, C:N ratio and polyphenol-to-N
ratio. High lignin content of plant residues could also enhance nutrient immobilization,
especially nitrogen (Constantinides and Fownes, 1994).
Soil texture is mentioned as an indicator factor on nutrient cycling and decomposing of soil
organic matter in somewhere else. Gilmour and Gilmour (1985) found the positive
relationship between CO2-C evolution and clay content whereas the relationship between net
nitrification and clay content was negative. Similarly results were also mentioned in Li et
al.(1992), Pezeshki et al. (1997). However, in Hansen et al. (1991) study found an inversely
result in which N dynamics were little affected by soil clay and silt contents. Moreover,
Anderson and Domsch (1986) reported that the C mineralised and the net N mineralisation
was greatest for the sand and least for the silt in incubation condition. Regarding to evaluate
the effect of added residues application on the mineralisation and C and N, Porter et al.
(2010) reported that the cumulative C mineralization and cumulative mineral N was higher for
residues placed on the soil surface than for residues incorporated into the soils after 56 days
in constant condition. Nevertheless, in Chertov (1990) research, the results showed that the
net N mineralization of mucuna residue was greater when mixed with soil rather than placed
on the surface. Meanwhile, Li et al. (1992) reported that there was no significant difference of
maize straw decomposition either mixed into the soil or applied on the surface after one year

29
with the exception in soil fraction > 200μm, the organic matter decomposed faster in mixed
treatment.
For low input farming systems, for example under subsistence agriculture in developing
countries or in organic farming systems in Europe, research is needed on how to manage
nutrient release from organic inputs. The objectives of this study were to determine how
biochemical quality of a wide range of crop residues affects the decomposition pattern in
laboratory incubations using different soil types and residue application methods.
2.2. Materials and methods
2.2.1 Soil and residue characteristics
Two cultivated soils from South Australia were collected from the surface layer (0-10cm), air-
dried and sieved through a 2 mm mesh to remove roots and other debris. One soil from
Germany was collected from a subsoil (20-40 cm) and prepared the same way. For the
closed chamber incubation study, 500g of dry soil was weighed into 2 l glass jars, wetted to
50% water holding capacity and pre-incubated at 25oC from 2 to 4 days to stimulate the initial
flush of CO2 and N released as described by (Birch, 1964).
Eight crop residues were considered in this study. They differ either in the plant species, the
plant organs or the growth stage at which they were sampled. Residues # 1 to #4 (Table 2.2)
were grown in field condition under subtropical climate of South Australia, residues # 6 to # 8
were also grown in field condition but in temperate seasonal climate of Middle Germany.
Residue # 5 was grown in control condition in greenhouse. Most residues were harvested at
a maturity stage. Residue # 6 (lucerne) was sampled at flowering stage in summer. All
residues were dried at 40oC and chopped to 2-5cm lengths. Subsamples of residues were
dried, ground for chemical analysis as outlined in Table 2.2. The total C and N concentration
of residues were determined using a combustion technique (Elemental analyser). The Van
Soet method was used to determine the acid detergent fiber (ADF), neutral detergent fiber
(NDF) and acid detergent lignin (ADL) (van Soest, 1967; van Soest et al., 1991).

30
2.2.2 Treatments and laboratory incubation
Three laboratory incubation experiments were carried out in order to evaluate the impact of
varying factors (soil type, placement of residue, residue type) on CO2 and N mineralisation.
In experiment 1, 3.8 g residues 1-4 (Table 2.2) were mixed into a sand or a clay soil and
incubated for 63 days (4 residues x 2 soils x 4 replicates). Experiment 2 used 3.8 g residues
1-4 with the sand soil only, and the application of the residues were either as surface applied
(mulch) or mixed (incorporated) into the soil and incubated for 126 days (4 residues x 2
methods of application x 4 replicates). The third incubation used 2 g residues 5-8 mixed with
the subsoil and incubated for 126 days.
After pre-incubation, the soil water content was adjusted to and maintained at 75% for the
clay and sand and to 60% for the subsoil. The jars were sealed and incubated at 25oC in the
dark in the presence of a CO2 trap. A control treatment consisting of soil-only was included
with the 3 incubation experiments and in all cases treatments were replicated 4 times.
Table 2.1. Some chemical and textural properties of soils used in 3 incubation experiments.
Soils
code
Soil type pH
(CaCl2)
OC
(%)
N
(%)
N min
(mg kg-1
soil)
Clay
(%)
Silt
(%)
Sand
(%)
Clay Alfisol 7.13 2.3 0.19 29.9 43.0 22.0 35.0
Sand Calcaresol 7.91 0.6 0.02 7.0 7.0 2.0 91.0
Subsoil Podsol 6.6 0.22 0.012 6.6 3.3 9.5 87.2

31
Table 2.2. Chemical properties of residues used
Residues
Code
Residue
types
Total
C
(%)
Total
N
(%)
C:N
ratio
Carbohydratec
(%)
Cellulosea
(%)
Hemicelluloseb
(%)
Lignind
(%)
1 Mucuna 41.0 2.9 14.1 54.6 15.1 10.9 19.5
2 Pea 40.0 4.4 9.1 52.6 11.2 22.4 13.8
3 Wheat 43.0 1.6 26.9 25.8 24.7 36.6 12.9
4 Canola 43.0 1.0 43.0 34.4 35.7 6.9 23.0
5 Lablab 41.3 1.9 21.7 57.2 19.2 16.2 7.4
6 Lucerne 43.8 2.4 18.3 48.6 16.6 20.9 13.8
7 Maize 37.7 1.9 19.8 42.4 11.0 21.1 25.5
8 Wheat 42.7 0.6 71.2 28.3 36.6 24.8 10.3
aCalculated as: %Acid detergent fiber (ADF) – % Acid detergent lignin (ADL); bCalculated as:
%Neutral detergent fiber (NDF) – %ADF; dCalculated as %ADL; cCalculated as: 100 – d – a – b.
2.2.3 Analytical measurements
The evolution of CO2 in each incubation jar containing soil (control) or soil plus residues was
captured in a CO2 trap which was simply a small beaker containing 25ml of 0.4 M NaOH
placed in each glass jar. Two glass jars without soil containing only a CO2 trap were included
as blanks throughout each incubation experiment. For the 1st experiment, samples were
collected on days 1, 2, 4, 7 for the first week and on weekly basis thereafter for 9 weeks. In
the 2nd and 3rd experiments, samples were collected on day 1, 2, 3, 7, 10, 14, and on weekly
basis thereafter until the the emissions of CO2 became small after week 18th. The samples
were precipitated with BaCl2 and then titrated with hydrochloric acid (HCl) and the readings
were used to calculate the amount of cumulative C released as CO2-C.
Carbon mineralization (expressed in mg kg-1 soil) from added residues was calculated from
the different in cumulative amount of carbon release between amendment soil with residues
and a control at each sampling time.
Cumulative CO2-C (residue) = Cumulative CO2-C (treatment) - Cumulative CO2-C (control) (1a)

32
The quantity of C evolved was expressed as a (%) of added residues as follows:
net C release (% of total residue C added) = [∑ 𝐶𝑂2−C 𝑥 100
𝑟𝑒𝑠 𝑥 𝑂𝐶] (1b)
Where ∑ 𝐶𝑂2 − C is the cumulative amount of CO2-C (mg kg-1 soil) release at time t from only
added residue, res is the amount of applied residue (mg kg-1 soil), OC is the dry organic
matter of residue (%).
Mineral nitrogen was determined on soil samples collected at weeks 1, 2, 4, 7 and 9 for the
1st experiment and at weeks 1, 2, 4, 8, 14 and 18 for 2nd and 3rd experiments. Fresh soil
samples were prepared by removing any organic residue particles and extracting with
potassium chloride (KCl) solution by shaking for 1 hour, followed by filtering through a No. 42
Whatman filter paper. The extracts were analysed for NH+4 and NO-
3 using thermal
conductivity detection by Matejovic (1997) with mineral N being the addition of NH4+-N + NO3
-
-N.
Net N mineralization from added residues was calculated as follow:
Net N min (mg kg-1 soil) = mineral N in the treatment − mineral N in control (2)
2.3. Results
2.3.1 Biochemical quality of the residues
The overall C:N ratio of residues used in this study varied widely ranging from 9.1 (pea # 2)
to 71.2 (wheat # 8) (Table 2.2). The highest concentration of lignin (%) was found in maize
(25.5%) followed by canola (23.0%) and mucuna (19.5%) meanwhile the carbohydrate
content in this group was in intermediate (from 34.4 to 54.6 %). The highest carbohydrate
content resulted from lablab (57.2%) and the lowest was recognised in wheat (#3) (25.8%).
Among 4 different pools of C in residues as carbohydrate, cellulose, hemicelluloses and
lignin, statistical analysis found that the carbohydrate like pool was inversely related to
overall C:N ratio (R2 = 0.50) while cellulose-like pool was linearly related (R2 = 0.81) (Figure
2.1). The relationship between overall C:N ratio and hemicellulose and lignin was not clear,
R2 values was of 0.002 and 0.027, respectively.

33
Figure 2.1. Linear regression between C:N ratio of residue and some carbon distribution
pools of residue.
2.3.2 Carbon and nitrogen mineralisation of added residues from different soil types
a. Carbon mineralisation
Regardless of residue addition, the quantity of C mineralisation was linearly related to soil C
concentration (Figure 2.2a, b, c). In the absence of residue, the amount of cumulative CO2-C
release within 63 days of the incubation was 447.0, 175.6 and 47.3 mg CO2-C kg-1 soil for
clay, sand and subsoil, respectively and this was statistical difference at P value < 0.05. The
release of CO2-C of added residues increases profoundly in the beginning of incubation. For
example, in the first 7 days of incubation, CO2-C release from residues rapidly marked in all
treatments to around 50% of total C mineralised in subsoil and continued increasing
dramatically afterward (Figure 2.2c). The significant differences of the cumulative of CO2-C
emission were recognised in all treatments with the exception between lablab and lucerne at
P value < 0.05. The total amount of CO2-C emission from lablab and lucerne was much
higher than from maize and wheat, about 592.6, 570.7, 376.9 and 267.8 mg kg-1 soil,
respectively. After 4 weeks of incubation, the amount CO2-C lost increased slightly but the
significant differences were found in all added residues. Higher production of CO2-C
emission was found in lower C:N ratio and small lignin content of added residues. Even
though having similar C:N ratio, maize produced less CO2-C than lucerne during 126
incubation days and was significant difference at P value <0.05, about 1093.5 and 947.9 mg
kg-1 soil, respectively.
R² = 0.5058
R² = 0.8104
0
10
20
30
40
50
60
70
80
0 10 20 30 40 50 60 70
C:N
rat
ios
Percentage of some carbon distribution pools of residue (%)
Carbohydrate
Cellulose

34
When applying similar residues in different soils, the C mineralisation faster was recognised
in soil having higher OC content (Figure 2.2a, b). In the first day of incubation, the statistical
significant difference at P value < 0.05 of CO2-C release from difference soils was only found
in wheat and canola. Nevertheless, it was showed in all treatments after 1 week to the end of
trial in which cumulative of CO2-C emission from clay was always significant higher than that
in sand soil. For example, in the first 7 days of incubation, the largest amount of CO2-C
release was found in pea, about 735.3 mg kg-1 soil when added in clay and this number
decreased to 632.2 mg kg-1 soil when added in sand soil. Canola and wheat produced least
CO2-C in the same time. In this both soils, the CO2-C release increased rapidly in the first 4
weeks of incubation and reached around a half of total C mineralised. Afterward, the amount
of CO2-C produced improved gradually. After 63 days of incubation, mucuna produced least
significant of CO2-C comparison with other 3 residues, around 1152.1 mg kg-1 soil in sand
and 1758.9 mg kg-1 soil in clay soil, respectively. In clay soil, after 28 days of incubation,
there was no significant difference of cumulative CO2-C emission among wheat, canola and
pea (Figure 2.2a). Meanwhile, the cumulative CO2-C emission from pea in sand soil after 63
days was lower significant at P value < 0.05 compared with wheat, about 2095.0 and 2142.9
mg kg-1 soil, respectively. There was no significant difference between pea and canola.
0
500
1000
1500
2000
2500
0 10 20 30 40 50 60 70
Cu
mu
lati
ve C
O2-
C r
elea
se (
mg
kg-1
so
il)
Incubation days
Wheat
Mucuna
Canola
Pea
(a)

35
Figure 2.2. Cumulative CO2-C release from only residues in clay (a), sand (b) and subsoil (c).
The error bars represented the standard deviation of 4 different replications. The incubation
time from subsoil (2c) was actually for 126 days, however there was no change in the order
of the residues and the same low rate of increase and moreover, to make sense when
comparing to 2 others soils, the graph just presents in within 63 days of incubation.
0
500
1000
1500
2000
2500
0 10 20 30 40 50 60 70
Cu
mu
lati
ve C
O2-C
rel
ease
(m
g kg
-1 s
oil)
Incubation days
WheatMucunaPeaCanola
(b)
0
500
1000
1500
2000
2500
0 10 20 30 40 50 60 70
Cu
mu
lati
ve C
O2-C
rel
ease
(m
g kg
-1 s
oil)
Incubation days
lablablucernewheatmaize
(c)

36
Figure 2.3. The relationships between net C release as percentage of total C input from only
added residues (each point represented mean of 4 replications) and soil types after 7, 28
and 63 days of incubation.
The effect of added residues on net C releases was positively related to the concentration of
organic matter in soil or soil types at days 7, 28 and 63 of incubation (Figure 2.3), better R2
value being obtained with higher of soil organic matter. For subsoil, due to storing in a
greenhouse for years, the microbial communities were lesser than normal condition and the
organic carbon content much lower than other 2 soils, the overall coefficient of determination
(R2) of this soil was much lower than those in other 2 soils (Figure 2.3). Statistic found a
significant difference between clay and sand soil at day 28 and 63 at P value < 0.05 but not
at day 7 (P value = 0.105).
b. Nitrogen mineralisation
In the unamended soil only control treatments, there was continuous net N mineralisation
with soil type a significant effect on the quantity of N. Subsoil in which had the lowest amount
of mineral N (6.6 mg kg-1 soil, Table 2.1) produced lesser nitrogen mineralisation when
comparison with 2 other soils. At 56 days, the amount of N release from clay soil was much
significant higher than in sand and subsoil, about 88 mg N kg-1 soil compared with 16 mg N
kg-1 soil and 4 mg N kg-1 soil, respectively.
The net N mineralised from added residues profoundly affected by the concentration of
mineral N in soil. Sandy soil with low N concentration in soil (Table 2.1) resulted significant
larger amount of net N min of same added residue than in clay soil. In particular of pea, it
was about 122.5 mg kg-1 soil at 7 days in sandy soil and decreased to 65.9 mg kg-1 soil in
R² = 0.8452
R² = 0.9336
R² = 0.4851
0
10
20
30
40
50
60
70
80
0 10 20 30 40 50 60 70
Net
C r
elea
se (
% o
f to
tal r
esid
ue
C
add
ed)
Incubation days
sand
clay
subsoil

37
clay soil. In next following weeks, similar progress occurred with a statistical significant
difference (P value < 0.05).
In all 3 soil types, the low C:N ratio residues such as pea (9.1), mucuna (14.1), lucerne (18.3)
showed net N mineralisation during 56 days of incubation in clay and sand soil and in over
120 days in subsoil. In contrast, the addition of residues with C:N ratio > 26.9 resulted in net
immobilisation. For example wheat (C:N = 26.9) and canola (C:N = 43.0) in clay and sand
and wheat straw (C:N = 71.2) in subsoil (Figure 2.4a, b, c).
The highest amount of net N mineral was measured in the clay or sand with pea or mucuna
residue additions, (123 and 81 mg kg-1 soil, respectively). Moreover, the strong net
immobilisation showed in wheat and canola added to clay soil was a net mineralisation when
added to the sand soil (Figure 2.4a and 2.4b). The amount of net N
mineralisation/immobilisation in soil 3 varied from -6.6 mg kg-1 soil in wheat to 18.3 mg kg-1
soil in lucerne. The net N min from lablab and maize in this soil transferred from
immobilisation to mineralisation after 20 days of incubation.
-100
-50
0
50
100
150
200
250
300
0 10 20 30 40 50 60Net
N m
iner
alis
ed (
mg
kg-1
so
il)
Incubation days
wheatmucunapeacanola
(a)
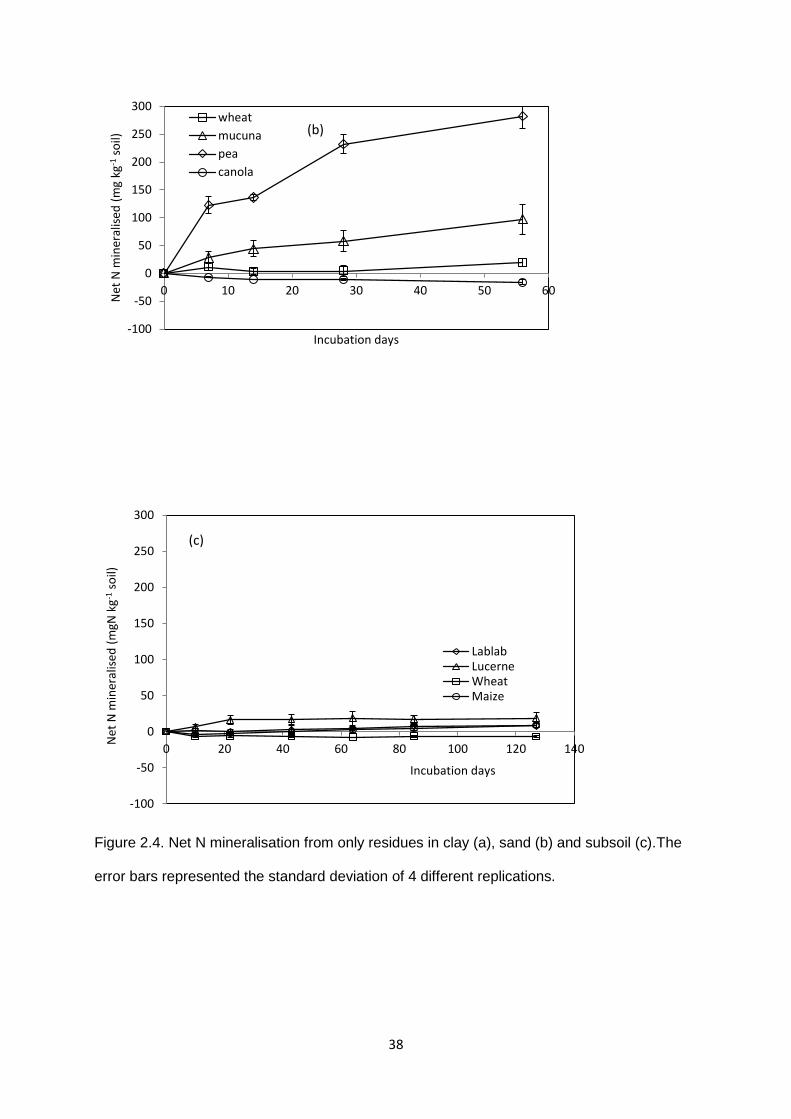
38
Figure 2.4. Net N mineralisation from only residues in clay (a), sand (b) and subsoil (c).The
error bars represented the standard deviation of 4 different replications.
-100
-50
0
50
100
150
200
250
300
0 10 20 30 40 50 60
Net
N m
iner
alis
ed (
mg
kg-1
so
il)
Incubation days
wheat
mucuna
pea
canola
(b)
-100
-50
0
50
100
150
200
250
300
0 20 40 60 80 100 120 140
Net
N m
iner
alis
ed (
mgN
kg-1
so
il)
Incubation days
LablabLucerneWheatMaize
(c)

39
Figure 2.5. The relationship between overall C:N ratio of residues and (a) net carbon
mineralised (% of total residue C added) and (b) net N mineralised (g N kg-1 added C) in clay
soil (fulfil symbols) and sand soil (no fill symbols) at 7 days (♦), 28 days (■) and 63 days (▲)
(for graph a and 56 days for graph b). Each point represented mean of 4 replications.
0
10
20
30
40
50
60
70
80
0 10 20 30 40 50
Ne
t C
rel
ease
(%
of
tota
l res
idu
e C
ad
ded
)
C:N ratio
(a)
-40
-20
0
20
40
60
80
100
Net
N m
iner
alis
ed (
g N
kg-1
ad
ded
C)
C:N ratio 10 20 30 40 50
(b)

40
2.3.3 Carbon and nitrogen mineralisation from different residue application methods
a. Carbon mineralisation
The effect of residue applications on carbon mineralisation was shown in Figure 2.6. In
general, the CO2-C release from added residues was initially more rapid when placed on the
surface rather than mixed with soil with exception of wheat. After 7 days, the amount of
cumulative CO2-C emission from wheat was 956 mg kg-1 soil (approximately 29% of total C
added) in incorporated treatment compared with 665 mg kg-1 soil (approximately 20% of total
C added) in mulched treatment which was a statistically significantly different (p<0.05). For
the residues mucuna and pea, cumulative CO2-C release was statistically higher at 14 and
21 days with surface application rather than with soil incorporation.
The effect of overall C:N ratio of added residues on the release of CO2-C when using
difference application was fluctuation. In particular, mucuna produced least CO2-C lost either
placed on surface or mixed with soil after 21 days whereas the CO2-C release from wheat in
mulched treatment was not significant difference compared with pea after 80 days to the end.
Furthermore, when incorporated to soil, this figure from wheat was even statistical significant
larger than from pea after 56 days of incubation. Before this time point, lower C:N ratio
released significant larger amount of CO2-C emission.
Figure 2.6. Cumulative CO2-C release from only residues in incorporated application
(continuous line), and mulched application (dotted line). The error bars represented the
standard deviation of 4 different replications.
0
500
1000
1500
2000
2500
0 20 40 60 80 100 120 140
Cu
mu
lati
ve C
O2-C
(m
g kg
-1 s
oil)
Incubation days
Mucuna
Pea
Wheat

41
b. Nitrogen mineralisation
The net N mineralisation ranged from 40.7 mg kg-1 soil (wheat) to 299.6 mg kg-1 soil (pea)
when incorporated to soil and ranged from 34.6 mg kg-1 soil (wheat) to 187.4 mg kg-1 soil
(pea) in mulch treatment (Figure 2.7). In both residue applications, the net N mineralisation
was the main trend for all residues from the first week of incubation.
In general, residue applications effected on the net N mineralisation depending on time of
application and residue C:N ratio. The net N mineralisation when placement on surface was
statistical significant higher than mixed with soil in the 2nd week in case of mucuna.
Afterward, there was no significant difference of net N mineralised in any case of application
in these residues. Nevertheless, it was inversion in pea in which no significant was found in
the first two weeks. In the next week to the end, the net N mineralisation from incorporated
treatment was much higher and statistical significant (P value < 0.05).
Figure 2.7. Net N mineralisation from only residues in incorporated application (continuous
line), and mulched application (dotted line). The error bars represented the standard
deviation of 4 different replications.
0.0
50.0
100.0
150.0
200.0
250.0
300.0
350.0
0 20 40 60 80 100 120 140
Ne
t N
min
era
lise
d (
mg
kg-1
so
il)
days
mucuna pea wheat

42
Figure 2.8. The relationship between overall C:N ratio of residues and (a) net C release (%
of total residue C added) and (b) net N mineralised (g N kg-1 added C) of different residue
materials at 7 days (◊), 28 days (□) and 63 days ()
0
10
20
30
40
50
60
70
80
0 20 40 60 80
Ne
t C
rel
ease
(%
of
tota
l res
idu
e C
ad
ded
)
C:N ratio
7days
28 days
63 days
(a)
R² = 0.7204
R² = 0.6359
R² = 0.7185
-40
-20
0
20
40
60
80
100
Ne
t N
min
era
lise
d (
g N
kg-1
ad
de
d C
)
C:N ratio
7 days
28 days
56 days
20 80 40 60
(b)

43
R² = 0.392
R² = 0.1277
R² = 0.0104
0
10
20
30
40
50
60
70
80
20 30 40 50 60
Net
C r
elea
se (
% o
f to
tal r
esid
ue
C a
dd
ed)
Carbohydrate (%)
7days 28 days 63 days(a)
R² = 0.4292
R² = 0.0736
R² = 0.0159
0
10
20
30
40
50
60
70
80
0 10 20 30 40
Net
C r
elea
se (
% o
f to
tal r
esid
ue
C a
dd
ed)
Hemicellulose (%)
7days 28 days 63 days(b)

44
R² = 0.2763
R² = 0.2058
R² = 0.0396
0
10
20
30
40
50
60
70
80
0 5 10 15 20 25 30
Net
C r
elea
se (
% o
f to
tal r
esid
ue
C a
dd
ed)
Lignin (%)
7days
28 days
63 days
(c)
R² = 0.3764
R² = 0.3446
R² = 0.3788
-40
-20
0
20
40
60
80
100
0 10 20 30 40 50 60 70
Net
N m
iner
aise
d (
gN/k
g C
ad
ded
)
Carbohydrate (%)
7 days
28 days
56 days
(d)

45
Figure 2.9. The relationship between different biochemical components and carbon
mineralised (%) (a, b, c) and net N mineralised (g N kg-1 added C) (d, e, f) of different residue
materials at 7 days (◊), 28 days (□) and 63 days ().
R² = 0.5158
R² = 0.4829
R² = 0.536
-40
-20
0
20
40
60
80
100
0 5 10 15 20 25 30 35 40
Ne
t N
min
era
ise
d (
gN/k
g C
ad
de
d)
Cellulose (%)
7 days
28 days
56 days
(e)
R² = 0.233
R² = 0.1647
R² = 0.2129
-40
-20
0
20
40
60
80
100
0 5 10 15 20 25 30
Ne
t N
min
era
ise
d (
gN/k
g C
ad
de
d)
Lignin (%)
7 days
28 days
56 days
(f)

46
2.4. Discussion
2.4.1. Biochemical quality of the residues
As it is known that growth conditions, plant age or plant part composition have a marked
impact on residue quality (Abiven et al., 2005; Parr and Papendick, 1978: Nicolardot et al.,
2001), therefore it should be taken into account when comparing the observed residue
quality with other reported values (Vanlauwe et al., 1996). In this research, the C:N ratio of
wheat grown in subtropical climate (no. 3) was much lower than that grown in temperate
seasonal climate (no.8) (Table 2.2). The reason led to this difference was the growth
conditions, residue #3 was grown and developed in glasshouse conditions whereas residue
#8 was grown and developed on field conditions. Huang et al. (2004) and Bending and
Turner (1999) also showed a high C:N ratio of wheat in same growth condition.
Lignin content of all residues are considered intermediate to high according to Palm et al.
(2001) and its value was almost higher than that usually observed in similar group
(Muhammad et al., 2011; Kumar and Goh, 2003; Ibewiro et al., 2000; Adapa et al., 2009;
Recous et al., 1995; Soon and Arshad, 2002). However, the N content did not show a similar
trend. In legume group, published data shown a higher content of N (Ibewiro et al., 2000;
Muhammad et al., 2011) with the exception of pea (Soon and Arshad, 2002; Kumar and Goh,
2003). Nevertheless, in cereal group like maize, wheat, canola, the N content was similar to
other publish data (Martens, 2000; Soon and Arshad, 2002).
2.4.2. Carbon and nitrogen mineralisation of added residues from different soil types
a. Carbon and nitrogen mineralisation from different soil types
The CO2 evolution and N release from plant residues in different soil types used in this study
varied depending on soil characteristics. In this study, the higher C mineralisation in clay soil
than in the sand or sub-soils could be attributed to its higher organic C content (Figure 5a).
This is in agreement with observations by Martens (2000), Harrison-Kirk et al. (2013),
Butterly et al. (2010). Martens (2000) found a simple regression between CO2 evolved from
the treatments with or without residue and soil carbohydrate content. When maintaining at
field capacity, the rate of C mineralisation in soil increased with increases in soil organic
carbon content (Harrison-Kirk et al., 2013).
Researching the effects of soil particle size on the dynamics of C, we found that sand soils
were reported to release less CO2 than clay soils under incubations. In our study for
example, the Alfisol had around 30% of sand particles but the amount of CO2 lost after 63
days of incubation was approximately 10 times higher than subsoil with mostly sand soil.
These results contrast with those of previous studies. According to Parfitt and Salt (2001),
the lowest proportion of C mineralised occurred in the silt fraction, and the greatest

47
proportion occurred in the sand fraction. Thomsen et al. (2003) reported that the rate
constants of C mineralisation for native and applied C were highest in the most sand soil.
However, Hassink (1994) found that soil texture was not always the dominant factor
determining the organic C content of soils and C mineralisation rates. A similar argument
was also found in Gregorich et al. (1991). As with the CO2-C release, the microbial biomass
C for clay soil was significantly higher that of the sand soil treatment (unpublished data).
Differences in C mineralisation rates between different soil types could satisfactorily be
explained by the differences in bacterial biomass (Hassink et al., 1994). Texture was
important in controlling the rate of decomposition and turnover of C through the microbial
biomass during short periods. Soils with high clay content had low amounts of microbial
products, suggesting that clay provides an environment for closer interaction between
microorganisms and products of their decay and promotes the transfer of nutrients to
succeeding generations of microorganisms (Gregorich et al., 1991). After 7 and 28 days of
incubation, there was a slight difference of net C mineralised in different soils but the
difference became bigger afterwards (Figure 5a). Bending et al. (2002) reported that soil
organic matter had little effect on mineralisation of N after 28 days, effects after 112 days
were large for several materials. However, there was no observation on the effect of soil
types on C mineralisation through time.
In the case of N mineralisation from different soil types, even though all soil types showed a
net N mineralisation through time, the amount of net N mineralised from clay soil was much
higher than in sand soil. This result was similar to the observation by Christensen and
Olesen (1998) where net N mineralisation in size separates decreased in order: clay > silt >
sand. Thomsen et al. (2003) also found that nitrification was lowest in the soil with most clay.
In the case of N mineralisation from crop residues, the effect of SOM content on this process
depended on the nature of the residue incorporated, and the time of analysis (Bending et al.,
2002). When applied residues, the results in our study were consistent with other studies
(Parfitt and Salt, 2001; Izaurralde et al., 2006; Hansen et al., 1991). The net N
mineralization/immobilization of added residues in sand soil was almost higher than in clay
soil (Figure 5b). Parfitt and Salt (2001) showed a contrasty order of net N mineralisation as
sand > clay > silt. Moreover, research on the N transformation from different 15N-labelled
crop residues Izaurralde et al. (2006) found that mineral N from sandy-loam was greater than
in clay soil. Most research agreed that microbial activities in different soil texture affects
significantly the mineralization/immobilization of nitrogen in soil-plant-atmosphere system
(van Lieshout and Stoica, 2003; Parton et al., 1988). Microbial access to the residues in the
sandy soil is usually higher than in clay soil because of binding by clay particles (Izaurralde
et al., 2006) and this can affect the respiration of microbial community (Kirschbaum and Paul,

48
2002) and therefore impact significantly on net N mineralization or denitrification (van
Lieshout and Stoica, 2003; Kirschbaum and Paul, 2002).
b. Carbon and nitrogen mineralisation from different residues types
Decomposition and N release from plant residues used in this study vary over a wide range
depending on their biochemical quality and the stage of decomposition. The greater increase
in CO2 release and higher amount of net N mineralized following the lower C:N ratio of plant
residues application (such as pea residue) than other treatments (for instant, wheat #8) is a
good example to emphasize the effect of C:N ratio on the breakdown of added residues. This
result is consistent with previous observations (Muhammad et al., 2011; Powlson et al.,
1996; Mueller et al., 1996; Trinsoutrot et al., 2000a; van Lieshout and Stoica, 2003). Even
though both C and N release from residues relate to overall C:N ratio, the relationship
between overall C:N ratio and net N mineralized was much higher than that with the amount
of CO2 release (Figure 2.8). In our study, the relationship between CO2 release and overall
C:N ratio became stronger in longer term (Figure 2.8a). This could be explained because of
high correlation between percentage of C mineralization and stable components of residue
such as cellulose and lignin (Figure 2.9b, c). Lignin is a constituent of crop residues that is
resistant to decomposition by microorganisms (Parr and Papendick, 1978). When carried out
the trials of 2 crop residues with contrasted biochemical and structural characteristics,
Gaillard et al. (2003) reported the same proportion of C mineralised due to having similar
lignin content. In our experiment, as a legume crop with high N content and low C:N ratio,
mucuna was expected to have similar CO2 release with pea but in reality, mucuna released
CO2 slower than pea. This could be attributed to higher lignin content of mucuna residues as
also demonstrated by Konboon et al. 1996.
The net effect of added residues on the dynamics of soil mineral N was related mainly to the
C:N ratios of residues. This is agreement with other observations (Trinsoutrot et al., 2000b;
Nicolardot et al., 2001). The net N mineralised from residues was significantly and negatively
correlated with CN ratio of the residues (Figure 2.8b) and this result confirmed the work of
Muhammad et al. (2011), Powlson et al. (1996), Mueller et al. (1996). In our study, all
residues with a C:N ratio lower than 26.9 caused a net N mineralisation (with the exception of
wheat #3 in very low N mineral in soil). Several authors reported that residues with a C:N
ratio below 25 showed a net N mineralisation (Trinsoutrot et al., 2000b; Kumar and Goh,
1999). In earlier research, Fox et al. (1990) mentioned the impact of N concentration in plant
on the dynamic of N, the immobilisation occurred much more than mineralisation when N
content less than 2% of total N. Net N mineralisation occurred in the incubation where N
content was higher than 1. 9%. Therefore, the C:N ratio and N content from added residues
could be a good predictor of nitrogen dynamic in soils.

49
In the early stages of decomposition, N release from the plant residues were correlated with
the initial quality parameters as total N content, cellulose and the C:N ratios. Unlike other
research in which reported that lignin content was the most important in control the N
mineralisation (Ibewiro et al., 2000; Fox et al., 1990; Vanlauwe et al., 1996), the lignin
content in our studies showed a weak relationship with the net N mineralised (Figure 2.9f).
Trinsoutrot et al. (2000a) also mentioned that some stable forms of residue C such as
hemicelluloses, celluloses and lignin resulted slow decomposition in the beginning of
application. The reason was that lignin was not the most important indicator of N
mineralisation and microbial utilised it only slowly over the experiment. This could have led to
the more readily degraded cellulose becoming the dominant residue derived C substrate
used by the microbial community during the period of N mineralisation from the residues
(Bending et al., 1998). This may explain why the relationship between celluloses content and
net N mineralised became stronger after time of incubation (Figure 2.9f).
c. Carbon and nitrogen mineralisation from different residues added methods
In our study, the difference in C mineralisation between incorporated and mulched treatment
depended on C:N ratio and time of application. The significantly different was recognised in
wheat residue after a week but it was delayed 1 week in mucuna and 2 weeks in pea. Cogle
et al. (1987) reported that when incorporated wheat straw decomposed slightly more rapidly
than surface straw during the first 5 months and this was consistent with our result in same
residue. The increase of CO2-C release when incorporated into soil could be attributed to the
closer contact with soil. This is in agreement with other observations (Powlson et al., 1996;
Bosatta and Ågren, 1994). Nevertheless, the CO2 emissions from pea and mucuna after 2
weeks of incubation was greater when placed on the surface than mixed into the soil,
especially in pea residue. Hasegawa et al. (1999) also reported similar result when testing
with wheat litter (C:N ratio = 19) or even though with higher C:N ratio (Porter et al., 2010).
Therefore, controlling condition in which moisture and temperature maintained as optimum,
C from incorporated and surface placed residues was very similar (Powlson et al., 1996).
Moreover, N content in plant always plays an important role either in different management
practices or in different soil types in term of determining the decomposition processes.
The non-significant difference in mineral N with the application of wheat and mucuna after 4
months of incubation between different management practices could be due to the optimum
moisture and temperature conditions of the environment. This was similar to the findings by
Powlson et al. (1996) who reported that immobilisation of N occurred in incorporated and
less change in mineral N with the surface placed of wheat, soybean and corn which had wide
C:N ratio. However Porter et al. (2010) reported that the cumulative mineral N for residues

50
placed on the soil surface was higher than for residues incorporated into the soils where
residues had C:N ratio higher than 25 and this totally contrasted with our result in pea (C:N
ratio =9.1). The increased significant difference in net N mineralized with the incorporated
than mulched in pea residue could be due to the direct contact of residues with the soil and N
volatilisation of surface placed. This was supported by the results obtained by Chertov (1990)
in which N increased more in incorporated than surface placed residues.
2.5. Conclusion
Decomposition processes of various added residues obtained from different climate
conditions were related to soil type and to their biochemical quality. Soil organic carbon
content and soil particle size play an important key in driving the dynamic of C and N of
added in soil. A positive relationship between C:N ratio and net N mineralization in this study
could be used as an indicator to predict the pattern of N mineralisation. Residues with C:N
ratio lower than 27 may be lead to net N mineralisation. From results in this study we found
that, placement residues on the surface of soil could enhance the decomposing processes,
especially in low C:N residues. Furthermore, high correlation of determination between net C
and N mineralization and stable components such as cellulose and lignin should take into
account of in determining nutrient release patterns in low input systems.

51
2.6. References
Abiven, S., Recous, S., Reyes, V., and Oliver, R., ‘Mineralisation of C and N from root, stem and leaf
residues in soil and role of their biochemical quality’, Biology and Fertility of Soils, Vol. 42, No. 2, 2005.
Adapa, P., Tabil, L., and Schoenau, G., ‘Compaction characteristics of barley, canola, oat and wheat straw’, Biosystems Engineering, Vol. 104, No. 3, 2009.
AITA, C., Recous, S., and ANGERS, D. A., ‘Short-term kinetics of residual wheat straw C and N under field conditions: characterization by 13C15N tracing and soil particle size fractionation’, European Journal of Soil Science, Vol. 48, No. 2, 1997.
Anderson, T.-H., and Domsch, K. H., ‘Carbon assimilation and microbial activity in soil’, Zeitschrift für Pflanzenernährung und Bodenkunde, Vol. 149, No. 4, 1986.
Angers, D., and Recous, S., ‘Decomposition of wheat straw and rye residues as affected by particle size’, Plant and Soil, Vol. 189, No. 2, 1997.
Bending, G. D., and Turner, M. K., ‘Interaction of biochemical quality and particle size of crop residues and its effect on the microbial biomass and nitrogen dynamics following incorporation into soil’, Biology and Fertility of Soils, Vol. 29, No. 3, 1999.
Bending, G. D., Turner, M. K., and Burns, I. G., ‘Fate of nitrogen from crop residues as affected by biochemical quality and the microbial biomass’, Soil Biology and Biochemistry, Vol. 30, No. 14, 1998.
Bending, G. D., Turner, M. K., and Jones, J. E., ‘Interactions between crop residue and soil organic matter quality and the functional diversity of soil microbial communities’, Soil Biology and Biochemistry, Vol. 34, No. 8, 2002.
Birch, H. F., ‘Mineralisation of plant nitrogen following alternate wet and dry conditions’, Plant and Soil, Vol. 20, No. 1, 1964.
Blanco-Canqui, H., and Lal, R., ‘Crop Residue Removal Impacts on Soil Productivity and Environmental Quality’, Critical Reviews in Plant Sciences, Vol. 28, No. 3, 2009.
Bosatta, E., and Ågren, G. I., ‘Theoretical analysis of microbial biomass dynamics in soils’, Soil Biology and Biochemistry, Vol. 26, No. 1, 1994.
Butterly, C., Marschner, P., McNeill, A., and Baldock, J., ‘Rewetting CO2 pulses in Australian agricultural soils and the influence of soil properties’, Biology and Fertility of Soils, Vol. 46, No. 7, 2010.
Chertov, O. G., ‘Specom - a single tree model of pine stand/raw humus soil ecosystem’, Ecological Modelling, Vol. 50, 1–3, 1990.
Christensen, B. T., and Olesen, J. E., ‘Nitrogen mineralization potential of organomineral size separates from soils with annual straw incorporation’, European Journal of Soil Science, Vol. 49, No. 1, 1998.
Cogle, A. L., Strong, W. M., Saffigna, P. G., Ladd, J. N., and Amato, M., ‘Wheat straw decomposition in subtropical Australia .II. Effect of straw placement on decomposition and recovery of added 15 N urea’, Australian Journal of Soil Research, Vol. 25, No. 4, 1987.
Constantinides, M., and Fownes, J. H., ‘Nitrogen mineralization from leaves and litter of tropical plants: Relationship to nitrogen, lignin and soluble polyphenol concentrations’, Soil Biology and Biochemistry, Vol. 26, No. 1, 1994.
Cookson, W. R., Cornforth, I. S., and Rowarth, J. S., ‘Winter soil temperature (2–15 °C) effects on nitrogen transformations in clover green manure amended or unamended soils; a laboratory and field study’, Soil Biology and Biochemistry, Vol. 34, No. 10, 2002.
Coppens, F., Garnier, P., Findeling, A., Merckx, R., and Recous, S., ‘Decomposition of mulched versus incorporated crop residues: Modelling with PASTIS clarifies interactions between residue quality and location’, Soil Biology and Biochemistry, Vol. 39, No. 9, 2007.

52
Fox, R. H., Myers, R. J. K., and Vallis, I., ‘The nitrogen mineralization rate of legume residues in soil as influenced by their polyphenol, lignin, and nitrogen contents’, Plant and Soil, Vol. 129, No. 2, 1990.
Gaillard, V., Chenu, C., and Recous, S., ‘Carbon mineralisation in soil adjacent to plant residues of contrasting biochemical quality’, Soil Biology and Biochemistry, Vol. 35, No. 1, 2003.
Gilmour, C. M., and Gilmour, J. T., ‘Assimilation of carbon by the soil biomass’, Plant and Soil, Vol. 86, No. 1, 1985.
Gregorich, E. G., Voroney, R. P., and Kachanoski, R. G., ‘Turnover of carbon through the microbial biomass in soils with different texture’, Soil Biology and Biochemistry, Vol. 23, No. 8, 1991.
Hansen, S., Jensen, H. E., Nielsen, N. E., and Svendsen, H., ‘Simulation of nitrogen dynamics and biomass production in winter wheat using the Danish simulation model DAISY’, Fertilizer Research, Vol. 27, 2-3, 1991.
Harrison-Kirk, T., Beare, M. H., Meenken, E. D., and Condron, L. M., ‘Soil organic matter and texture affect responses to dry/wet cycles: Effects on carbon dioxide and nitrous oxide emissions’, Soil Biology and Biochemistry, Vol. 57, No. 0, 2013.
Hasegawa, H., Labavitch, J. M., McGuire, A. M., Bryant, D. C., and Denison, R. F., ‘Testing CERES model predictions of N release from legume cover crop residue’, Field Crops Research, Vol. 63, No. 3, 1999.
Hassink, J., ‘Effects of soil texture and structure on carbon and nitrogen mineralization in grassland soils’, Biology and Fertility of Soils, Vol. 14, No. 2, 1992.
Hassink, J., ‘Effects of soil texture and grassland management on soil organic C and N and rates of C and N mineralization’, Soil Biology and Biochemistry, Vol. 26, No. 9, 1994.
Hassink, J., Neutel, A. M., and ruiter, P. C. de, ‘C and N mineralization in sandy and loamy grassland soils: The role of microbes and microfauna’, Soil Biology and Biochemistry, Vol. 26, No. 11, 1994.
Huang, Y., Zou, J., Zheng, X., Wang, Y., and Xu, X., ‘Nitrous oxide emissions as influenced by amendment of plant residues with different C:N ratios’, Soil Biology and Biochemistry, Vol. 36, No. 6, 2004.
Ibewiro, B., Sanginga, N., Vanlauwe, B., and Merckx, R., ‘Nitrogen contributions from decomposing cover crop residues to maize in a tropical derived savanna’, Nutrient Cycling in Agroecosystems, Vol. 57, No. 2, 2000.
Izaurralde, R. C., Williams, J. R., McGill, W. B., Rosenberg, N. J., and Jakas, M. C. Q., ‘Simulating soil C dynamics with EPIC: Model description and testing against long-term data’, Ecological Modelling, Vol. 192, 3–4, 2006.
Janzen, H. H., and Kucey, R. M. N., ‘C, N, and S mineralization of crop residues as influenced by crop species and nutrient regime’, Plant and Soil, Vol. 106, No. 1, 1988.
Khalil, M. I., Hossain, M. B., and Schmidhalter, U., ‘Carbon and nitrogen mineralization in different upland soils of the subtropics treated with organic materials’, Soil Biology and Biochemistry, Vol. 37, No. 8, 2005.
Khalil, M. I., Rahman, M. S., Schmidhalter, U., and Olfs, H.-W., ‘Nitrogen fertilizer–induced mineralization of soil organic C and N in six contrasting soils of Bangladesh’, Journal of Plant Nutrition and Soil Science, Vol. 170, No. 2, 2007.
Kirschbaum, M. U. F., and Paul, K. I., ‘Modelling C and N dynamics in forest soils with a modified version of the CENTURY model’, Soil Biology and Biochemistry, Vol. 34, No. 3, 2002.
Kumar, K., and Goh, K. M., ‘Crop Residues and Management Practices: Effects on Soil Quality, Soil Nitrogen Dynamics, Crop Yield, and Nitrogen Recovery’, in Donald L. Sparks (ed.), Advances in Agronomy, Academic Press, 1999.
Kumar, K., and Goh, K. M., ‘Nitrogen Release from Crop Residues and Organic Amendments as Affected by Biochemical Composition’, Communications in Soil Science and Plant Analysis, Vol. 34, 17-18, 2003.
Li, C., Frolking, S., and Frolking, T. A., ‘A model of nitrous oxide evolution from soil driven by rainfall events: 1. Model structure and sensitivity’, Journal of Geophysical Research: Atmospheres, Vol. 97, D9, 1992.
53
Martens, D. A., ‘Plant residue biochemistry regulates soil carbon cycling and carbon sequestration’, Soil Biology and Biochemistry, Vol. 32, No. 3, 2000.
Mary, B., Recous, S., Darwis, D., and Robin, D., ‘Interactions between decomposition of plant residues and nitrogen cycling in soil’, Plant and Soil, Vol. 181, No. 1, 1996.
Matejovic, I., ‘Determination of carbon and nitrogen in samples of various soils by the dry combustion’, Communications in Soil Science and Plant Analysis, Vol. 28, 17-18, 1997.
Mueller, T., Jensen, L. S., Hansen, S., and Nielsen, N. E., ‘Simulating soil carbon and nitrogen dynamics with the soil-plant-atmosphere system model DAISY’, in D. Powlson, P. Smith and J. Smith (eds.), Evaluation of Soil Organic Matter Models, Springer Berlin Heidelberg, 1996.
Muhammad, W., Vaughan, S., Dalal, R., and Menzies, N., ‘Crop residues and fertilizer nitrogen influence residue decomposition and nitrous oxide emission from a Vertisol’, Biology and Fertility of Soils, Vol. 47, No. 1, 2011.
Müller, T., Magid, J., Jensen, L. S., and Nielsen, N. E., ‘Decomposition of plant residues of different quality in soil—DAISY model calibration and simulation based on experimental data’, Ecological Modelling, Vol. 166, 1–2, 2003.
NICOLARDOT, B., Recous, S., and Mary, B., ‘Simulation of C and N mineralisation during crop residue decomposition: A simple dynamic model based on the C:N ratio of the residues’, Plant and Soil, Vol. 228, No. 1, 2001.
Palm, C. A., and Sanchez, P. A., ‘Nitrogen release from the leaves of some tropical legumes as affected by their lignin and polyphenolic contents’, Soil Biology and Biochemistry, Vol. 23, No. 1, 1991.
Palm, C. A., Gachengo, C. N., Delve, R. J., Cadisch, G., and Giller, K. E., ‘Organic inputs for soil fertility management in tropical agroecosystems: application of an organic resource database’, Agriculture, Ecosystems & Environment, Vol. 83, 1–2, 2001.
Parfitt, R. L., and Salt, G. J., ‘Carbon and nitrogen mineralisation in sand, silt, and clay fractions of soils under maize and pasture’, Australian Journal of Soil Research, Vol. 39, No. 2, 2001.
Parr, J. F., and Papendick, R. I., ‘Factors Affecting the Decomposition of Crop Residues by Microorganisms’, Crop Residue Management Systems, asaspecialpubli, cropresiduemana, 1978.
Parton, W. J., Stewart, J. W. B., and Cole, C. V., ‘Dynamics of C, N, P and S in grassland soils: a model’, Biogeochemistry, Vol. 5, No. 1, 1988.
Pezeshki, S. R., DeLaune, R. D., and Meeder, J. F., ‘Carbon assimilation and biomass partitioning in Avicennia germinans and Rhizophora mangle seedlings in response to soil redox conditions’, Environmental and Experimental Botany, Vol. 37, 2–3, 1997.
Porter, C., Jones, J. W., Adiku, S., Gijsman, A. J., Gargiulo, O., and Naab, J. B., ‘Modeling organic carbon and carbon-mediated soil processes in DSSAT v4.5’, Operational Research, Vol. 10, No. 3, 2010.
Powlson, D., ‘Why evaluate soil organic matter models?’, in D. Powlson, P. Smith and J. Smith (eds.), Evaluation of Soil Organic Matter Models, Springer Berlin Heidelberg, 1996.
Powlson, D., Smith, P., and Smith, J. (eds.), Evaluation of Soil Organic Matter Models, Springer Berlin Heidelberg, 1996.
Qian, P., and Schoenau, J. J., ‘Availability of nitrogen in solid manure amendments with different C:N ratios’, Can. J. Soil. Sci, Vol. 82, No. 2, 2002.
Recous, S., Robin, D., Darwis, D., and Mary, B., ‘Soil inorganic N availability: Effect on maize residue decomposition’, Soil Biology and Biochemistry, Vol. 27, No. 12, 1995.
Soon, Y., and Arshad, M., ‘Comparison of the decomposition and N and P mineralization of canola, pea and wheat residues’, Biology and Fertility of Soils, Vol. 36, No. 1, 2002.
Thomsen, I. K., Schjønning, P., Olesen, J. E., and Christensen, B. T., ‘C and N turnover in structurally intact soils of different texture’, Soil Biology and Biochemistry, Vol. 35, No. 6, 2003.
Tian, G., Kang, B. T., and Brussaard, L., ‘Biological effects of plant residues with contrasting chemical compositions under humid tropical conditions—Decomposition and nutrient release’, Soil Biology and Biochemistry, Vol. 24, No. 10, 1992.

54
Trinsoutrot, I., Recous, S., Bentz, B., Line`res, M., Che`neby, D., and NICOLARDOT, B., ‘Biochemical Quality of Crop Residues and Carbon and Nitrogen Mineralization Kinetics under Nonlimiting Nitrogen Conditions’, Soil Sci. Soc. Am. J, Vol. 64, No. 3, 2000a.
Trinsoutrot, I., Recous, S., Mary, B., and NICOLARDOT, B., ‘C and N fluxes of decomposing 13C and 15N Brassica napus L.: effects of residue composition and N content’, Soil Biology and Biochemistry, Vol. 32, 11–12, 2000b.
van Lieshout, M. N. M., and Stoica, R. S., ‘The Candy model: properties and inference’, Statistica Neerlandica, Vol. 57, No. 2, 2003.
van Soest, P. J., ‘Development of a Comprehensive System of Feed Analyses and its Application to Forages’, Journal of Animal Science, Vol. 26, No. 1, 1967.
van Soest, P. J., Robertson, J. B., and Lewis, B. A., ‘Methods for Dietary Fiber, Neutral Detergent Fiber, and Nonstarch Polysaccharides in Relation to Animal Nutrition’, Journal of Dairy Science, Vol. 74, No. 10, 1991.
Vanlauwe, B., Nwoke, O. C., Sanginga, N., and Merckx, R., ‘Impact of residue quality on the C and N mineralization of leaf and root residues of three agroforestry species’, Plant and Soil, Vol. 183, No. 2, 1996.
Whitbread, A. M., Blair, G. J., and Lefroy, R. D. B., ‘Managing legume leys, residues and fertilisers to enhance the sustainability of wheat cropping systems in Australia: 1. The effects on wheat yields and nutrient balances’, Soil and Tillage Research, Vol. 54, 1–2, 2000a.
Whitbread, A. M., Blair, G. J., and Lefroy, R. D. B., ‘Managing legume leys, residues and fertilisers to enhance the sustainability of wheat cropping systems in Australia: 2. Soil physical fertility and carbon’, Soil and Tillage Research, Vol. 54, 1–2, 2000b.
Whitbread, A. M., Lefroy, R. D. B., and Blair, G. J., ‘A survey of the impact of cropping on soil physical and chemical properties in north-western New South Wales’, Australian Journal of Soil Research, Vol. 36, No. 4, 1998.

55
Chapter 3. Modelling carbon and nitrogen mineralisation from diverse plant residues
in incubation studies
3.1. Introduction
In low input farming systems where inputs are often limited, it is difficult to explain the
interaction between the factors (e.g. temperature, soil moisture, litter quality) that drive
nutrient release without the help of a model (Stöckle et al., 2003; Jones et al., 2003; Brisson
et al., 2003; Hasegawa et al., 2000; Keating et al., 2003; Nendel et al., 2011). Such soil
processes play an important role in the supply of nutrients for plant growth as well as
influencing soil structural properties and soil biodiversity (Powlson et al., 1996b; Blanco-
Canqui and Lal, 2009). Using simulation models to predict the mineralisation of carbon and
nitrogen from various residue applications has been mentioned widely using models such as
APSIM (Mohanty et al., 2011; Probert et al., 2005; Whitbread et al., 2010; Whitbread and
Clem, 2006; Huth et al., 2010; Meier et al., 2006; Probert et al., 1998), CENTURY (Falloon
and Smith, 2002; Kirschbaum and Paul, 2002), STICS (Justes et al., 2009), DSSAT (Gijsman
et al., 2002), CERES (Hasegawa et al., 1999; Godwin, 1991), NCSOIL (Molina, 1996;
Nicolardot et al., 1994; Nicolardot and Molina, 1994), DNDC (Li, 1996; Li et al., 1992),
CANDY (van Ittersum et al., 2003; Franko, 1996), DAISY (Hansen et al., 1991), PASTIS
(Oorts et al., 2007; Garnier et al., 2003). Because some processes occur in soils over long
time periods (e.g. changes in organic carbon content or soil structure for example), soil
organic matter models are an essential tool and are the only possible way of extrapolating
from current knowledge in both time and space (Powlson, 1996). For low input farming
systems, the wide range of input materials (crop residues, leaf litters, manures) used as
nutrient sources bring new challenges for modelling (Probert and Dimes, 2004). Although
these models are able to adequately describe the release of carbon and nitrogen from
residues where decomposition pattern is closely related to C:N ratio, however there have
been limited attempts to model the decomposition pattern of diverse plant residues and
connection to plant growth modelling. Some outstanding soil organic matter (SOM) models

56
focus only on the transformations of C and N in soils such as NCSOIL (Molina, 1996; Molina
et al., 1983), QSOIL (Powlson et al., 1996a; Bosatta and Ågren, 1994), RothC (Falloon and
Smith, 2002) or CANDY (Franko et al., 1995). Others have been developed for specific
regions: DAISY is adapted to the wet temperate climate of North Western Europe (Hansen et
al., 1991;Mueller et al., 1996); CENTURY, DNDC were developed with data from temperate
regions and were not applicable for all cropping systems (Parton et al., 1988; Li et al., 1994)
or SOMM in SPECOM (Chertov, 1990) developed for forested ecosystems. The Agricultural
Production Systems Simulator (APSIM) (Keating et al., 2003; Holzworth et al. 2014) is a
modular modelling framework that has been developed by APSRU (Agricultural Production
Systems Research Unit) in Australia. APSIM is internationally recognised as an advanced
simulator of agricultural systems and has been widely applied in different regions and in
response of cropping systems to climate and different management strategies (Asseng et al.,
2000; Mohanty et al., 2012; Asseng et al., 2004; Robertson et al., 2005; Anwar et al., 2009;
Carberry et al., 2002; Probert and Dimes, 2004; Gaydon et al., 2012). APSIM version 7.5
(http://www.apsim.info/AboutUs.aspx) is now be able to simulate 27 different crops with
various management strategies from crop rotation, irrigation, fertilisation, organic application,
and climate variability. Model users can then edit in a wide range of scenarios based on their
purposes.
The SOILN module in APSIM simulates the decomposition processes of soil organic matter
and the N supply available to a crop from the soil and residues/roots added from previous
crops (Probert et al., 1998). The framework of SOILN model is generally similar to what is
found in other soil organic matter models – i.e. conceptual pools representing C fractions of
varying sizes and potential decomposition rates. This framework has been tested
successfully in different climate conditions of various organic materials and soil types. In the
semi-arid tropics, APSIM is well suited to simulate the soil N supply in legume based
rotational pasture crop system and perennial grass system (Whitbread and Clem, 2006). In a
study by Nascimento et al. (2011), after calibration in potential decomposition rate (k) in
SOILN, the model was able to estimate the decomposition and N mineralisation rates of

57
some plant organic residues over 1 year. When compared with the performance of the
established CENTURY model, Probert ME (1995) showed that APSIM was adequate for
simulating the mineralisation of N and the decline in soil organic matter through time during
individual fallows. Its performance also resulted accurately in long term of a diverse range of
farming systems (from different tillage managements, nitrogen applications) (Probert et al.,
1998) or in different soil types of aerobic incubations (Meier et al., 2006). By adjusting the
denitrification rate coefficient and CN ratios in soil organic matter pools, Huth et al. (2010)
found that APSIM adequately described the decline in soil C and N in the first 10 cm soil
layer after clearing of a forest and subsequent cropping. By using a default value of SOILN,
the performance of model worked well in some crop residue applications (tropical legumes,
Lablab purpureus) (Whitbread and Clem, 2006) or in different soil types (Meier et al., 2006)
or in farmers’ residue management practices with cereal crops, cowpea and groundnut
(MacCarthy et al., 2009).
In the majority of these studies, the decomposition process, as represented by soil organic C
and mineral N dynamics, has been well simulated by parameterizing residue inputs based on
C and N content (C:N ratio) and following the standard soil parameterization/initialization
routines (Nicolardot et al., 2001). However, in the case where plant residues or manures are
added and decomposition pattern is strongly influenced by factors in addition to C:N ratio
(e.g secondary metabolites, leaf structure/composition) decomposition pattern is not well
simulated. As suggested in several studies, the quantity and quality of crop residues will
clearly influence the build-up of soil organic matter and the subsequent availability and timing
of release of nutrients to following crops (Jarvis et al., 1996; Janzen and Kucey, 1988).
Trinsoutrot et al. (2000b) reported that the initial rate of C mineralisation was strongly
dependent upon the amounts of soluble C initially present in the residues. Moreover,
Constantinides and Fownes (1994) also mentioned that initial N concentration strongly
correlated with N accumulation at all time periods of 16 week incubation from different
tropical plants. Tian et al. (1992) and Palm and Sanchez (1991) showed that decomposition
rate constants of plant residues were correlated with C:N ratio, lignin and polyphenols

58
content. In order to evaluate model performance in such cases Probert et al. (2005) and
Mohanty et al. (2011) modified SOILN to allow the distribution of carbon and the C:N ratios of
three pools which constitute added organic matter to vary, the revised model was then better
able to represent the nitrogen mineralisation from various materials.
The main objective of this paper is therefore to measure and model the decomposition
process observed from the laboratory incubation of residues representing highly diverse
qualities and decomposition dynamics as represented by mineral N and the CO2 release.
The dataset of C and N mineralisation from residues was collected in various individual
incubation treatments having C:N ratios from 9.1 to 148.40 and was used to: (1) evaluate the
performance of original SOILN model (Probert et al., 1998); and (2) improve the model
parameterization and assess the comprehensive decomposition model of C and N
mineralisation in short term. A sensitivity analysis for driven model parameters was also
tested for evaluation the impact of those parameters on the residue decomposition.
3.2. Materials and Methods
3.2.1. Description of the APSIM SoilN module
Within the APSIM framework, SOILN is a core module which simulates the transformations
of carbon and nitrogen in soil organic matter (Probert et al., 1998; Keating et al., 2003)
(Figure 3.1). Its development from original Probert et al. (1998) to modified versions Probert
et al. (2005) reflects greater demands for application.
Similar to other soil organic matter models, SOILN is divided into pools based on potential
decomposition rate (Figure 3.1). In general, residues (including from crops, leaf litters, roots
or manures) added to the soil are designated as the fresh organic matter (FOM) pool.
Consistent with the original model (CERES-N), the FOM pool comprises of three sub-pools
(FPOOLS) in the proportions 0.2:0.7:0.1 with a potential decomposition rate constant of each
FPOOL reflecting its turnover. (FPOOL1) has the fastest turnover (r=0.02 day-1) and
represents the fraction of residue inputs that are the most labile and biochemically similar to
carbohydrate compounds. FPOOL2 component of cellulose/hemicellulose are in sub-pool2

59
(FPOOL2) and of lignin is in sub-pool3 (FPOOL3). Decomposition rate constant of the
FPOOL2 was of 0.05 day-1 and its value in FPOOL3 was 0.0095 day-1 and these values were
kept unchanged under non-limiting temperature and moisture condition. Decomposition of
FOM results in the formation of soil organic carbon comprising of pools representing soil
microbial biomass (BIOM) and humus (HUM). The BIOM pool is notionally the most labile
organic C pool representing soil microbial biomass, and thus has a higher rate of turnover
than the bulk of the soil organic matter even though it make up a relatively small part of the
total soil organic matter. The HUM pool consists of stable organic matter and it will transfer
into passive pool (INERT pool) after years of decomposing. The decomposition rate of BIOM
and HUM was 0.0081 and 0.00015 day-1 respectively. The dynamics of soil organic matter is
simulated by first order reaction kinetics in all soil layers, with each pool having a different
turnover time ranging from days to weeks for biomass to hundreds of years for passive
organic matter.
Decomposition of any soil organic matter pools represents in evolution of carbon dioxide to
the atmosphere and transfers of carbon to other pools (Probert et al., 1998). These flows are
defined as the efficiency coefficient (ef) which indicates the proportion of carbon retained in
the system and the fraction of the retained carbon synthesized into the biom pool (fr).
3.2.2. Process for initialising SOILN to simulate diverse residues
In the incubation studies where environmental conditions can be controlled, we assume that
soil water and soil temperature has no effect on residue decomposition and it was set up as
optimum condition. Using the modified model, we would like to improve prediction of carbon
and nitrogen release from different soil types of diverse crop residues during close-chamber
system, new parameterizations procedure was carried out as following steps:
(1) Using the tillage function as incorporated in the first day of simulation, all surface organic
matter (SurfaceOM) was directly transferred to FOM. The SOILN module in APSIM
version 7.5 (http://www.apsim.info/AboutUs.aspx) was used to simulate in this study.
Additionally, because these incubations were carried out in closed system, the effect of
leaching and denitrification was eliminated.

60
(2) For the unamended soil, a fitting procedure was used to minimize the difference between
predicted and measured values of individual control treatments. The proportion of C in
BIOM and the proportion of inert carbon in soil were based on common values used in
other simulations (Probert et al., 1998) (see. Appendix) and kept unchanged during the
simulation. The C:N ratio and root weight in soil was fixed in each soil and corresponds to
the usually measured in similar soil texture and OC (%) content. The parameters (fraction
of biomass C mineralized retained in system (ef_biom), fraction of humus C mineralized
retained in system (ef_hum), and fraction of retained biomass C returned to biomass
(fr_biom_biom) were optimized simultaneously. All parameters then were assumed as
constants during the incubation.
(3) For simulations where residues are applied, parameterisation of FOM was applied. The
fraction of FOM C mineralized retained in system (ef_fom) can be directly calculated by
equation (1) and (3) (see. Appendix). The fraction of retained FOM C transferred to
biomass (fr_fom_biom) could be verified after testing sensitivity analysis of available
dataset from residues in both C and N mineralisation. The pool size of FOM, consisting of
3 FPOOLs representing carbohydrate, cellulose/hemicellulose and lignin -like pools, can
be measured in laboratory by Van Soest method (van Soest et al., 1991) and maintain
during the processes. FPOOL1 based on measured C as water soluble components,
proportion of C in FPOOL3 based on measured ADL (Acid detergent lignin). FPOOL2
based on the different between neutral detergent fibre and ADL. Changing the pool sizes
alone could not alter whether a source exhibits initial net N mineralisation or
immobilization as it was determined by the C:N ratios of the substrate (Probert et al.
2005). Therefore the distribution of N in 3 FPOOLs need to be modified.. The
decomposition rates of the three FPOOLs were adopted from default version of APSIM
(0.2, 0.05 and 0.0095 day-1, respectively under non-limiting temperature and moisture
conditions).

61
Figure 3.1 The framework of SOILN in relationship with other essential modules in APSIM.
Double line box represents different modules in APSIM; fi is the function of factor i. Source:
redrawn based on diagrams in Probert et al. (1998)
Immobilisation
Mineralisation
Leaching
fTillage /decomposition
Plant uptake
ffr_biom_biom
ffr_fom_biom ffr_res_biom
Amonium NH4
-
Nitrate NO3
+
Roots
Denitrification
SOILN
CO2
CO2
CO2
CO2 CO2
CO2
CO2
FOM (fwt, %C, %N, %P, ef_fom)
Labile Medium Structure
Carb (frd) Cell (frd) Lign (frd)
BIOM (fCNr)
Labile (frd) Stable (fef_biom)
HUM (fCNr, rd, ef_hum)
CO2
Plant SurfaceOM (fwt, %C, %N, %P, ef_res)
INERT Passive pool
SoilTemp
SoilWat

62
(4) The performance of model was then evaluated by using an independent dataset from 3
individually different incubation trials. In this study we run the model in different scenarios
based on changing FPOOLs.
- Scenario 1: Represent the results from default model in which FPOOL size was set
as 0.2:0.7:0.1 and C:N ratio in each FPOOLs was similar to overall C:N ratio of
applied residues.
- Scenario 2: The distribution of carbon in FPOOLs was modified based on lab
measurement but C:N ratio in FPOOLs was equal to overall C:N ratio of applied
residues.
- Scenario 3: The FPOOLs size was set up as in scenario 2 but C:N ratio in each
FPOOLs were set to enable the best fit of simulated and measured decomposition
rate.
3.2.3. Experimental data used for model performance
To validate and evaluate the performance of the modified model in predicting changes of soil
organic carbon and soil nitrogen mineralisation/immobilization, three different datasets of
various residue biochemical quality (Table 3.1) and soil types from different incubation
treatments were used (Table 3.2). All these treatments were carried out at controlled
temperature and moisture conditions using aerobic soil.
Incubation 1 (unpublished data): Two laboratory incubation experiments were carried out in
order to evaluate the impact of varying factors on CO2 and N mineralisation. A cultivated soil
from South Australia were collected from the surface layer (0-10cm), air-dried and sieved
through a 2 mm mesh to remove roots and other debris. The other from Germany was
collected from a subsoil (20-40 cm) and prepared the same way. Eight crop residues were
considered in this study. They differ either in the plant species, the plant organs or the growth
stage at which they were sampled. They were all dried at 40oC and chopped to 2-5cm
lengths. After pre-incubation, the water holding capacity was brought to 60% to 75% and
carried out between 2 to 4 months of incubation.

63
Incubation 2 (BN2000): This incubation trial based on data obtained from Trinsoutrot et al.,
(2000a) was carried out under non-limiting N to evaluate the effects of biochemical
characteristics of residues on kinetics of C and N mineralisation in a wide range of soil types
and main arable crops of temperate regions (Trinsoutrot et al., 2000a). The residues were
dried at 80°C and then incorporated into soil at an equivalent of 2g residue kg-1 soil to 4 g
residue kg-1 soil depending on residue type. Nitrogen fertilizer was added from 30 to 60mg
NO3- -N kg-1 dry soil depending on the inorganic N concentration present in the soil and on
the amount of added C to ensure that decomposition would not be limited by N. The
incubation temperature was from 12°C to 15°C based on treatments over 150 days.
Incubation 3 (BV96): This incubation trial was carried out at Ibadan, Nigeria in 56 days with 3
plant residues labeled by 15N in order to find out the impact of residue quality on the C and N
mineralisation of leaf and root residues at 25°C by Vanlauwe et al. (1996). The residues were
dried at 65°C and mixed with the soil to equivalent 2.827g dry matter kg-1 dry soil. After 3, 7,
14, 28 and 56 days of incubation, soil samples were taken and analysed for C and N.

64
Table 3.1. Chemical properties of residues used in this study
Crop residue Code
Total
C
(%)
Total
N
(%)
Overall
C:N
Fraction of carbon in FPOOLs C:N of FPOOLs*
Pool 1a Pool 2
b Pool 3
c Pool 1 Pool 2 Pool 3
Lablab leaves 1 41.3 1.9 21.9 57.2 35.4 7.4 28.1 45.4 4.0
Lucerne 2 37.7 1.9 18.4 48.6 37.6 13.8 29.8 14.9 11.0
Maize leaves 3 42.7 0.6 20.1 42.4 32.1 25.5 37.6 20.1 11.4
Mucuna 4 41.0 2.9 14.1 54.6 26.0 19.4 9.5 19.3 45.9
Pea 5 40.0 4.4 9.1 52.6 33.6 13.8 14.5 5.9 9.1
Canola 6 43.0 1.0 43.0 34.4 42.6 23.0 43.0 42.9 43.1
Wheat08 7 43.0 1.6 26.9 25.8 61.3 12.9 42.2 26.4 15.0
Leucaena leaves 8 37.4 2.9 12.9 78.6 13.0 8.4 26.2 5.0 5.5
Leucaena roots 9 35.6 2.0 18.0 55.2 33.7 11.1 57.1 16.6 4.1
Dactyladenia leaves 10 41.7 1.4 29.8 76.1 6.4 17.5 23.5 19.8 108.3
Dactyladenia roots 11 42.9 1.0 41.7 49.9 19.5 30.6 20.8 51.1 333.1
Flemingia leaves 12 39.6 2.6 15.1 70.5 20.9 8.6 11.8 25.8 47.6
Flemingia roots 13 36.1 2.7 13.5 90.1 3.4 6.5 17.2 4.3 13.3
Rape seed stems 14 46.2 0.33 140.0 26.6 60.6 12.8 549.8 422.7 19.2
Rape seed wall pods 15 42.8 0.38 112.6 37.9 53.1 9.0 618.2 313.1 11.4
Rape seed leaves 16 35.3 1.97 17.9 79.1 18.9 2.0 29.1 9.0 37.2
Rape seed stems 17 43.7 0.39 112.4 31.3 59.1 9.6 141.1 84.5 97.6
Rape seed wall pods 18 43.5 0.29 148.4 43.3 51.9 4.8 180.7 97.5 104.4
Rape seed leaves 19 31.9 2.02 15.8 56.7 21.3 22.0 9.5 105.3 245.7
Rape seed 20 43.4 0.44 98.9 35.5 56.8 7.7 381.2 65.4 51.1
aCaculated as: 100 – b – c;
bCaculated as: %Neutral detergent fibre (NDF) – % Acid detergent lignin (ADL);
cCaculated as %ADL + % polyphenol. *: The C:N ratio of each FPOOLs was taken from the best scenarios in
which the model predicted best fit of decomposition as indicated by measured CO2-C release and nitrogen mineralisation (scenario 3). In scenario 1 and 2 in which the fraction of nitrogen was equal to fraction of carbon, the C:N ratio of each FPOOLs was similar to overall C:N ratio.

65
Table 3.2. Soil characteristics and soil organic matter (0-10 cm layer).
Soil
type
OC
(%)
C:N
ratio
N min
(mg kg-1
soil)
Fbiom
(0-1)
Finert
(0-1)
BiomC
(kg ha-1
)
HumC
(kg ha-1
)
InertC
(kg ha-1
) Source
1 0.22 18.9 6.6 0.02 0.8 8.6 431.3 1760 Unpublished
data (NTH12)
2 2.3 12.1 29.9 0.035 0.4 466.7 13333 9200 Unpublished
data (NTH12)
3 1.81 10.6 55.8 0.04 0.4 417.7 10442.3 7240
Trinsoutrot et
al., (2000a)
(BN2000)
4 1.54 11 85 0.04 0.4 355.4 8884.6 6160 Vanlauwe et al.,
(1996) (BV96)
3.2.4. Carbon and nitrogen analysis and calculated SOILN
The total C and N concentration of the crop residues were determined by using an elemental
analyser. The ADF, NDF, and NDL were then determined based on van Soest et al. (1991)
method. All experimental datasets determined CO2 release using a NaOH trap
(concentrations of 2N in BV96, 0.25M in BN2000, 0.4 M in NTH12) to capture the CO2 gas
released in the chamber and then titrated by HCl.
The amount of simulated C release was calculated as the sum of C release from the FOM,
BIOM and HUM pools. The decomposition speed of each pool depends on various
conditions from biochemical component (affected by decomposition rate), fraction of carbon
and nitrogen in each pool, and environment conditions (temperature and moisture) (see
Appendix).
The soil samples were extracted by KCl and then analysed for NH4+-N and NO3
- -N by using
methods (A Skalar continuous flow analyser (IITA, 1982) in BV96, centrifugation (20 min at
5800g) in BN2000, or using stretophometer in NTH12). Net N mineralisation during the
incubation processes was calculated as follows:
Mineral N (mg kg-1 soil)= NH4+-N + NO3
- -N (1)
Net N mineralization from organic residues (mg kg-1 soil) = mineral N in the treatment −
mineral N in control (2)

66
3.2.5. Model evaluation
The performance of APSIM simulation for prediction of C and N mineralisation from crop
residues was evaluated by using commonly statistical methods (Smith et al., 1996) as
follows:
Root mean square error (RMSE):
RMSE = √∑ ((𝑃𝑖−𝑂𝑖)2
𝑛)
𝑛
𝑖=1 (3)
Mean difference (MD):
MD =1
𝑛[∑ (𝑂𝑖 − 𝑃𝑖)𝑛
𝑖=1 ] (4)
Modelling efficiency (EF): EF = 1 − [∑ (𝑃𝑖−𝑂𝑖)2𝑛
𝑖=1
∑ (𝑂𝑖−𝑂)2𝑛𝑖=1
] (5)
Where Pi = predicted value, Oi = observed value, 𝑂 = mean of the observed values, n =
number of observation. The prediction of C and N release with EF ≥ 0.7 was consider to be a
good prediction, and prediction with 0 ≤ EF <0.7 was consider satisfactory, prediction with EF
<0 was consider unsatisfactory.
3.3. Result
3.3.1. Model parameterization
In previous studies, parameters related to the flows of carbon during the decomposition
(define can be found in Table 3.3a) in SOILN were assumed as a constant and used for
several simulations. However, in specific situation, each of these parameters needed to be
considered to get better simulation in realistic. In the absence of added residues where soil
organic matter dominants the decomposition processes in soil, the fitting procedure firstly
was applied in individual for 3 parameters (ef_biom, ef_hum and fr_biom_biom). A sensitivity
analysis was also carried out with these parameters by added/subtracted 10% by default
values to investigate which changes in the mode parameters affected the simulation results
the most. In general, the fraction of biomass C mineralized retained in the system (ef_biom)
profoundly affects the decomposition of soil organic matter and its value varied over a wide

67
range from 0.35 to 0.7 whereas ef_hum and fr_biom-biom only slightly affected these
processes. Therefore, to minimize the fitting procedure, both parameters remained at the
default values. Moreover, without surface residue, the parameter of the proportion of carbon
from residue in surface retained in the system (ef_res) and the fraction of the carbon retained
in residue transferred to biomass (fr_res_biom) was eliminated. The values of 3 parameters
obtained from fitting procedure were showed in Table 3.3a. The value of ef_biom was mainly
depended on C content. Figure 3.2 showed model performance of different soil types without
added residues with modified parameters. Statistical analysis showed that RMSE values of
cumulative CO2-C varied from 5.29 to 51.84 (mg kg-1 dry soil) and from 2.29 to 28.45 mg N
kg-1 dry soil from net N mineralisation. The model efficiency showed the goodness of fit in
both C and N mineralisation (from 0.83 to 0.96 in cumulative CO2-C and from -1.23 to 0.95 in
net N mineralised.
When residues were applied in the soil and became the dominant factor to fresh organic
matter (FOM), 2 other parameters must be modifed: the fraction of fresh organic matter
mineralized retained in the system (ef_fom) and the fraction of retained FOM transferred to
biomass (fr_fom_biom). Depending on the percentage of CO2-C release from each residue,
the ef_fom could be calculated by combining equation (1) and (3) in Appendix (see
Appendix). Its values vary from 0.12 (rape seed stem # 14) to 0.68 (dactyladenia root # 11).
A fitting procedure was then undertaken for fr_fom_biom to obtain the best agreement
between simulated and measured. Its value ranged from 0.5 to 0.9 based on biochemical
quality of applied residues.

68
Table 3.3a. Value of some modification parameters of SOILN
Parameter Description Default value Modified value
ef_biom Fraction of biomass C mineralized retained in system 0.4 0.5 ± 0.2
ef_fom Fraction of fresh organic matter C mineralized retained in system 0.4 Eq. (1) and (2)
in Apendix
ef_hum Fraction of humic C mineralized retained in system 0.4 Default
fr_fom_biom Fraction of retained FOM C transferred to biomass 0.9 0.7 ± 0.2
fr_biom_biom Fraction of retained biomass C returned to biomass 0.6 Default
Figure 3.2. Cumulative CO2-C release (a) and net N mineralised (b) from unamended soil by
individually fitting 3 parameters. Experimental data shown as symbols with bar representing
± standard deviations of mean from four replicates. The continuous line is the output from the
model. Soil types (#) follow in Table 3.2. For comparative purposes, the incubation time is
limited to 84 days.
0
100
200
300
400
500
0 20 40 60 80
Cu
mu
lati
ve C
O2-
C r
elea
se (
mg
kg-1
so
il)
days
# 2, OC = 2.3
# 4, OC = 1.54
# 3, OC = 1.81
# 1, OC = 0.22
(a)
0
20
40
60
80
100
0 20 40 60 80
Net
N m
iner
alis
ed (
mg
kg-1
so
il)
days
#2, OC = 2.3
#4, OC = 1.54
#3, OC = 1.81
#1, OC = 1.54
(b)

69
Table 3.3b. Statistical analysis of model performance from unamended soil
Soil
type
Cumulative CO2-C (mg kg-1
soil) Net N mineralised (mg kg-1
soil)
X RMSE EF* MD X RMSE EF* MD
1 41.11 5.29 0.90 -4.06 3.27 2.29 -1.23 1.44
2 221.51 51.84 0.89 -45.26 53.73 28.45 0.59 18.94
3 79.98 23.51 0.83 -18.14 8.46 2.69 0.87 1.14
4 128.15 44.46 0.85 -33.38 9.52 3.87 0.84 -2.42
5 101.67 19.02 0.96 -15.54 14.33 2.89 0.95 0.87
(X = mean of measurement; *: ununit)
3.3.2. Model performance in different scenarios
The effect of changing the input by modifying the proportion of the C in each of the FPOOLs
was mentioned in Probert et al. (2005). In this study, the three FPOOLs sizes (carbohydrate,
cellulose/hemicellulose and lignin -like pools) were modified based on observation analysis in
laboratory (Table 3.1). Then the model performance was tested in three different scenarios
as description in step (4). In terms of cumulative CO2-C release from residues, comparison
with scenario 1, the modified models were showed a good agreement between measured
data and predicted. In 3 different datasets, the model efficiency (EF) increased significantly.
For example, the EF value was from 0.27 to 0.46 in BV96 and from 0.23 to 0.53 in BN2000.
In 165 observations, the EF increased from 0.67 to 0.83 (Table 3.4a). Moreover, we found
that the prediction of CO2-C release did not change significantly whether adjusted the C:N
ratios in each different FPOOLs. The distribution of N in each FPOOL in this case did not
influence on the release of CO2 from residues.
Scatter plots were produced comparing predicted and measured of CO2-C cumulative of all
datasets in different scenarios (Figure 3.3 a and b). In the best performance, the overall R2
value of 0.86 with a low bias (α = 0.97, β= 59.17 mg kg-1 soil) provides strong evidence that
the modified SOILN model is able to simulate a wide range of biochemical quality of residues
for different soil types. The overall RMSE of 164.76 mg kg-1 soil, less than the overall
standard deviation of measurement data (402.10 mg kg-1 soil) together with high overall EF
value (0.73) suggests an acceptable model performance. Moreover, the Student’s paired T-

70
test (assuming non-equal variances) gave a significance of P(t) = 0.39 indicating that there is
no statistical difference between predicted and measured data at the 95% confidence level.
Figure 3.3. Scatter plots of the observation vs. measurement of cumulative CO2-C release
from 20 residues applied in scenario 1 (a) and scenario 2 and 3 (b).
y = 1.0442x - 69.229 R² = 0.85
0
200
400
600
800
1000
1200
1400
1600
1800
0 200 400 600 800 1000 1200 1400 1600 1800
Pre
dic
ted
CO
2-C
cu
mu
lati
ve (
mg
kg-1
so
il)
Measured CO2-C cumulative (mg kg-1 soil)
(a)
y = 0.8803x + 53.424 R² = 0.86
0
200
400
600
800
1000
1200
1400
1600
1800
0 200 400 600 800 1000 1200 1400 1600 1800
Pre
dic
ted
CO
2-C
cu
mu
lati
ve (
mg
kg-1
so
il)
Measured CO2-C cumulative (mg kg -1 soil)
(b)

71
Table 3.4a. Statistical analysis of cumulative CO2-C release from different dataset in the best
scenario performance
Dataset N
Xmea (SD) (mg kg
-1 soil)
Xsim (SD) (mg kg
-1 soil)
α ß (mg kg
-1 soil)
R²
RMSE (mg kg
-1 soil)
EF
MD (mg kg
-1 soil)
P(t)
BV96 30 239.7 (110.7) 279.1 (150.2) 1.22 -12.27 0.80 80.05 0.46 -39.46 0.25
BN 2000 28 673.6 (404.9) 596.7 (211.3) 0.42 312.67 0.65 271.55 0.53 76.92 0.38
NTH 12 107 890.3 (331.9) 960.0 (382.6) 1.09 -11.56 0.90 144.10 0.81 -69.65 0.16
Overall 165 735.2 (402.1) 774.5 (422.7) 0.97 59.17 0.86 164.76 0.83 -39.29 0.39 N: number of data pairs; Xmea: mean of measurement; Xsim: mean of simulation; SD: standard deviation; α: slope of linear regression between simulated and measured values; ß: intercept of linear regression between simulated and measured values; R²: square of linear correlation coefficient between simulated and measured values, P(t) significance of Student’s paired t-test assuming non-equal variances.
Concerning the net N mineralization from different residues, the model performance in 3
scenarios resulted in Figure 3.4 and Table 3.4b. Compared with scenario 1 and scenario 2,
the modified model in scenario 3 showed a good agreement between measured data and
predicted from the model. The model efficiency increased in all datasets. Within 112 dataset,
the EF values risen from 0.60 in scenario 1 to 0.77 in the scenario 3.
In contrast to CO2 release, the distribution of nitrogen in different Fpools significantly
influenced the dynamic of nitrogen within soil organic matter system. In the case where C:N
ratio in each FPOOLs differed from the overall C:N ratio (scenario 3) (Table 3.1), the model
performance was better compared to the default model settings (scenario 1) and modified
model in scenario 2. Probert et al. (2005) and Mohanty et al. (2011) also found similar results
in their study.
Scatter plots were also produced comparing predicted and measured net N mineralisation of
all datasets in different scenarios (Figure 3.4 a, b and c). Similarly to CO2-C cumulative, in
the best performance, the high value of R2 (0.79) with a low bias (α = 0.90, β= 1.98 mg kg-1
soil) and high EF value (0.77) convinced that SOILN in APSIM is able to capture the dynamic
of nitrogen of different added residues in various soil types. The Student’s paired T-test
(assuming non-equal variances) reported a significance of P(t) = 0.49 indicating that there is
no statistical difference between predicted and measured data at the 95% confidence level.

72
y = 0.8176x - 4.1467 R² = 0.6489
-100
-50
0
50
100
-100 -50 0 50 100
Pre
dic
ted
(m
g kg
-1 s
oil)
Measured (mg kg-1 soil)
(a)
y = 0.8677x + 3.7053 R² = 0.6734
-100
-50
0
50
100
-100 -50 0 50 100
Pre
dic
ted
(m
g kg
-1 s
oil)
Measured (mg kg-1 soil)
(b)

73
Figure 3.4. Scatter plots of the observation vs. measured of net N mineralised from 20
residues applied in scenario 1 (a) and scenario 2 (b) and scenario 3 (c).
Table 3.4b. Statistical analysis of net N mineralisation from different dataset in the best
scenario performance
Dataset
N
Xmea (SD)
(mg kg-1
soil)
Xsim (SD)
(mg kg-1
soil)
a
ß
(mg kg-1
soil)
R²
RMSE
(mg kg-1
soil)
EF
MD
(mg kg-1
soil)
P (t)
BV96 36 -7.3 (9.9) -10.9 (16.9) 1.21 -2.10 0.50 12.42 -0.62 3.62 0.27
BN 2000 35 -21.3 (22.0) -12.7 (16.1) 0.60 0.11 0.67 15.26 0.51 -8.64 0.07
NTH 12 41 6.1 (37.7) 9.2 (39.6) 0.99 3.15 0.89 13.33 0.87 -3.09 0.71
overall 112 -6.8 (28.6) -4.1 (28.9) 0.90 1.98 0.79 13.69 0.77 -2.67 0.49
N: number of data pairs; Xmea: mean of measurement; Xsim: mean of simulation; SD: standard deviation; a: slope of linear regression between simulated and measured values; ß: intercept of linear regression between simulated and measured values; R²: square of linear correlation coefficient between simulated and measured values. P(t) significance of Student’s paired t-test assuming non-equal variances.
y = 0.8811x - 3.1546 R² = 0.7924
-100
-50
0
50
100
-100 -50 0 50 100
Pre
dic
ted
(m
g kg
-1 s
oil)
Measured (mg kg-1 soil)
(c)

74
3.3.3. Simulation C and N dynamic from SOILN model by using modified parameters
Based on results from model in different scenarios, modified model was tested under varying
conditions using several soil types (Table 3.2) and residue types (Table 3.1). The output was
compared with cumulative CO2-C release and net N mineralization. Due to the amount of
mineral nitrogen in soil, we separated into 3 different groups: low mineral N soils (less than
10 ppm mineral N), medium mineral N soils (from 10 to 30 ppm mineral N) and high mineral
N soils (above 30 ppm mineral N).
a. In low mineral N soils:
This soil group had only 6.6 mg N min kg-1 soil. The model predicted well the CO2-C release
from different residues quality in poor soil nutrient (Figure 3.5a). Though the model
underestimated in case of maize, the higher value of EF in lablab and lucerne suggested a
better representation of the pattern of CO2-C cumulative by the model (Figure 3.5a). The
amount of CO2 release as predicted by the model from maize was much lower than that in
lablab and lucerne. All these residues had similar overall C:N ratio but the lignin content in
maize was much higher than in lablab and lucerne (Table 3.1). The high EF value (0.96) from
all datasets of these residues in this soil type was considered to be a good prediction of the
model in capturing the release of CO2 in low C:N ratio residue materials.
After 10 days of incubation, the pattern of net mineralisation predicted for the lablab and
maize changed from immobilization to mineralisation and maintained until the end of
incubation (Figure 3.5b). The model showed a goodness of fit when representing the
dynamic of nitrogen in maize with high EF value (0.60). Nevertheless, the EF value
decreased in lucerne and lablab (Figure 3.5b). Then we calculated the Student T-test (P(t))
(assuming unequal variances) to evaluate the significantly different between measured data
and predicted data. The high result of P(t) (0.85 and 0.96 respectively for lablab and lucerne)
with high value of correlation coefficient (respectively 0.84 and 0.62) suggests that there is
no significant different in the 95% confidence level between predicted and measured data.
Moreover, high value of EF (0.57) and correlation coefficient R2 (0.78) obtained from the

75
comparison between simulated and measured data of all residues suggested a satisfactory
goodness of fit by the model in poor soil nutrient in high biochemical quality of plant residues.
Figure 3.5. Cumulative CO2-C release (a) and Net N mineralized (b) from residues in soil
type 1 by using modified parameters. Experimental data shown as symbols with bar
representing ± standard deviations of mean from four replicates. The continuous line is the
output from the model.
b. In medium mineral N soil:
This soil group had 29.9 mg N min kg-1 soil. Within a wide range of added residues quality,
the model performance increased with the increase of overall C:N ratio of residue. The EF
0
200
400
600
800
1000
1200
1400
1600
1800
0 20 40 60 80 100 120 140
Cu
mu
lati
ve C
O2-
C (
mg
kg-1
so
il)
days
(a) ■ Lablab: EF = 0.97; RMSE = 37.24 ▲ Maize: EF = 0.93; RMSE = 58.28 ● Lucerne: EF = 0.97; RMSE = 37.60
-20
0
20
40
0 20 40 60 80 100 120 140
Net
N m
iner
alis
ed (
mg
kg-1
so
il)
days
(b) ■ Lablab: EF = -0.22; RMSE = 3.53 ▲ Maize: EF = 0.60; RMSE = 2.58 ● Lucerne: EF = -0.06; RMSE = 6.94

76
value was of around 0.50 in low C:N residues as pea and mucuna but rise significantly to
above 0.80 in higher group (wheat and canola) (Figure 3.6a). The amount of CO2 release
from the model after over 60 days of incubation was ordered as pea > wheat > canola >
mucuna. Mucuna with low C:N ratio (14.1) in this case predicted less CO2 than wheat and
canola in which has higher C:N ratio due to its high lignin content and high C:N ratio in POOL
3 (Table 3.1). In general, comparison between observed and predicted data of all residues
showed a high EF value (0.74) and R2 value (0.95) suggesting an acceptable performance of
the model when simulating the CO2 release from various added residues.
Over the 56 days of incubation, the model produced a immobilization for high C:N ratio
residues group (wheat (26.9) and canola (43.0)) and mineralisation for lower C:N ratio
(mucuna (14.1) and pea (9.1)) (Figure 3.6b). In the low quality of residue group, the small
bias of RMSE and high value of EF suggested a satisfactory simulation in this soil type when
comparing between predicted and observed data. For the high quality of residue group, the
model efficiency was acceptable, 0.01 for pea and 0.57 for mucuna. The model performed in
mucuna much better than in pea.
0
500
1000
1500
2000
2500
0 10 20 30 40 50 60 70
Cu
mu
lati
ve C
O2-
C (
mg
kg-1
so
il)
days
(a) ● Pea: EF = 0.51; RMSE = 278.34 ▲Mucuna: EF = 0.41; RMSE = 233.3 ■ Wheat: EF = 0. 82; RMSE = 209.3 ♦ Canola: EF = 0.93; RMSE = 120.3

77
Figure 3.6. Cumulative CO2-C release (a) and Net N mineralized (b) from residues in soil
type 2 by using modified parameters. Experimental data shown as symbols with bar
representing ± standard deviations of mean from four replicates. The continuous line is the
output from the model.
c. In high min N soil (above 30 ppm)
This soil group had 2 different soil types. 6 different residues (from #8 to # 13) were tested
with soil having 55.8 mg N kg-1 soil and 7 different residues (from #14 to #20) were tested
with soil having 85.0 mg N kg-1 soil (Table 3.2). The biochemical quality of each residue and
related parameters could be seen in Table 3.1.
Concerning simulation of CO2-C release from various residues, the model presented a
goodness of agreement between predicted and measured data with EF values from 0.01
(#11) to 0.88 (#19). Comparison between 2 different soil types, the model performance was
more satisfactory in soil having more N mineral even though the overall C:N ratio of residues
in this group much higher than the other (Figure 3.7a, 3.7c and Table 3.5a).
-100
-50
0
50
100
150
200
250
0 10 20 30 40 50 60Net
N m
iner
alis
ed (
mg/
kg s
oil)
days
(b) ● Pea: EF = 0.01; RMSE = 36.8 ▲Mucuna: EF = 0.57; RMSE = 15.5 ■ Wheat: EF = 0.53; RMSE = 12.0 ♦ Canola: EF = 0.62; RMSE = 13.1

78
Regarding to net N mineralized, the model produced the immobilization in almost applied
residues with the exception of # 13 and #19. The residue # 8 became mineralisation after 5
days of simulation and residue # 16 switched from immobilization to mineralisation after 20
days of simulation (Figure 3.7b and 3.7d). Overall the simulation of both soil types, the model
showed an acceptable performance via its statistical analysis (Table 3.5b), except residue #
11. The model performed poorly in this residue with very low EF value (-12.44)
0.00
100.00
200.00
300.00
400.00
500.00
600.00
0 10 20 30 40 50 60
cum
ula
tive
CO
2-C
(m
g kg
-1 s
oil)
days
#8
#9
#10
#11
#13
#12
♦ #8 ◊#9 ■#10 □#11 ▲#12 Δ#13 (a)
-70
-60
-50
-40
-30
-20
-10
0
10
20
0 10 20 30 40 50 60
Net
N m
iner
alis
ed (
mg
kg-1
so
il)
days
#13
#8
#12
#9
#10
#11
(b) ♦#8 ◊#9 ■#10 □#11 ▲#12 Δ#13
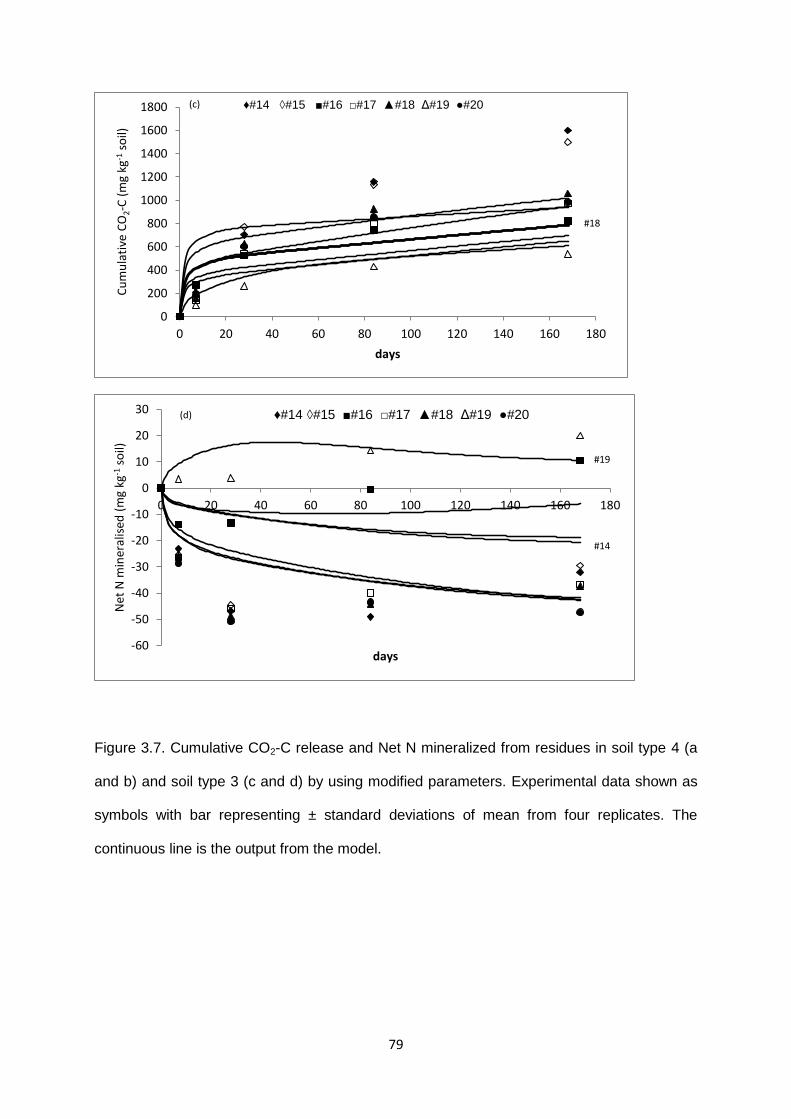
79
Figure 3.7. Cumulative CO2-C release and Net N mineralized from residues in soil type 4 (a
and b) and soil type 3 (c and d) by using modified parameters. Experimental data shown as
symbols with bar representing ± standard deviations of mean from four replicates. The
continuous line is the output from the model.
0
200
400
600
800
1000
1200
1400
1600
1800
0 20 40 60 80 100 120 140 160 180
Cu
mu
lati
ve C
O2-C
(m
g kg
-1 s
oil)
days
#18
(c) ♦#14 ◊#15 ■#16 □#17 ▲#18 Δ#19 ●#20
-60
-50
-40
-30
-20
-10
0
10
20
30
0 20 40 60 80 100 120 140 160 180
Net
N m
iner
alis
ed (
mg
kg-1
so
il)
days
#19
(d) ♦#14 ◊#15 ■#16 □#17 ▲#18 Δ#19 ●#20
#14
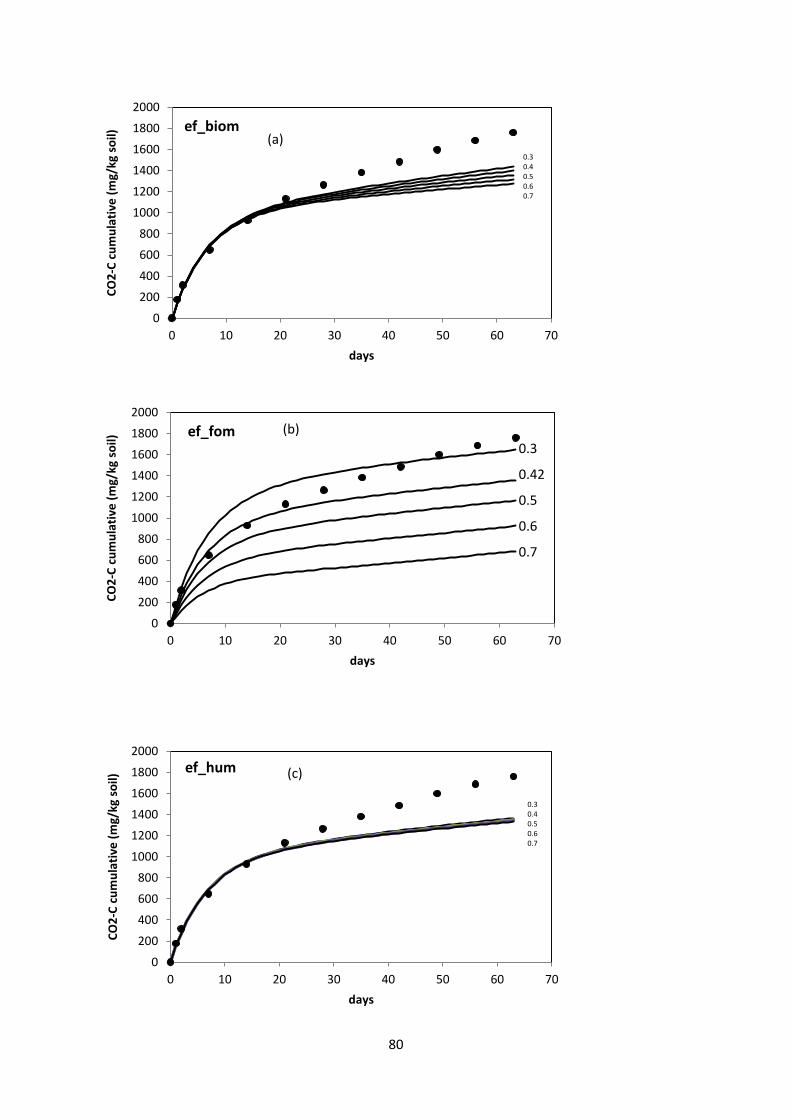
80
0
200
400
600
800
1000
1200
1400
1600
1800
2000
0 10 20 30 40 50 60 70
CO
2-C
cu
mu
lati
ve (
mg/
kg s
oil)
days
ef_biom
0.3 0.4 0.5 0.6 0.7
(a)
0
200
400
600
800
1000
1200
1400
1600
1800
2000
0 10 20 30 40 50 60 70
CO
2-C
cu
mu
lati
ve (
mg/
kg s
oil)
days
ef_fom 0.3
0.42
0.5
0.6
0.7
(b)
0
200
400
600
800
1000
1200
1400
1600
1800
2000
0 10 20 30 40 50 60 70
CO
2-C
cu
mu
lati
ve (
mg/
kg s
oil)
days
ef_hum
0.3 0.4 0.5 0.6 0.7
(c)

81
-40
-20
0
20
40
60
80
100
0 10 20 30 40 50 60
Ne
t N
min
era
lise
d (
mg
kg-1
so
il)
days
ef_fom
0.3
0.42
0.5
0.6
0.7
(e)
0
10
20
30
40
50
60
70
80
90
100
0 10 20 30 40 50 60
Ne
t N
min
era
lise
d (
mg
kg-1
so
il)
days
ef_biom
0.3 0.4 0.5 0.6 0.7
(d)

82
Figure 3.8. Sensitivity analysis to the variation of ef_biom, ef_fom and ef_hum parameters
applied to mucuna residue (#4) in soil type 2. The value of other parameters were maintained
constant as in Table 3.1. The continuous line is the output from the model. Experimental data
shown as symbols.
3.4. Discussion
According to Gilmour and Gilmour (1985) and Anderson et al. (1986), the fraction of C
assimilated depends on soil quality and residue applied characteristics. Therefore, using the
default values of each parameters of carbon flows (eg. ef_fom, fr_fom_biom) was unable to
represent the dynamic of C and N release in a wide range of residues, especially in residues
having high secondary metabolites. Sensitivity analysis with mucuna (#4) which had high
lignin content (Figure 3.8) indicated that using the default values of these parameters was
inadequate to simulate both C and N dynamics.
In the absence of applied residues, the majority of soil organic matter decomposing exists in
the inert and humic pools whereas the microbial biomass aggregate a small part of total soil
organic carbon (Sparling, 1992; Schnürer et al., 1985; MacCarthy et al., 2009). Therefore,
the breakdown of BIOM and HUM pools in soil significantly influence on the dynamic of C
and N in soil. In other words, the pool size and the assimilation yield of microorganisms
0
10
20
30
40
50
60
70
80
90
100
0 10 20 30 40 50 60
Ne
t N
min
era
lise
d (
mg
kg-1
so
il)
days
ef_hum
0.3 0.4 0.5 0.6 0.7
(f)

83
determine these processes. The pool size of BIOM and HUM was assumed from organic
carbon content of different added soils and it differed from various soil types. The value of
ef_biom modified in this study was always higher than default means and the assimilation
yield of microorganisms was always higher than 0.6. This result is consistent with other
authors who used the model to represent the C and N mineraisation of different crop
residues. Justes et al. (2009) and Nicolardot et al. (2001) used similar value at 0.62 in
different model approaches.
The next parameter correlated to the C and N dynamics in SOILN is the fraction of fresh
organic matter C mineralized retained in the system (ef_fom). This is also a very sensitive
parameter for the model (Figure 3.8b, e). Its values varied in a wide range and a higher value
resulted smaller amount of CO2 release as well as the net N mineralized became
immobilization. Statistic found a linear regression between overall C:N ratio and ef_fom with
the exception of residue # 14, 15, 17, 18 and #20. These residues had extremely high C: N
ratio but they also produced high amount of CO2. The similar results also were found in in
Trinsoutrot et al. (2000a) in which showed a weak relation between the C:N ratio of the
residues and the decomposition of added residues. The possibility of N limitation in those
studies was eliminated by the initial addition to soil of a sufficient amount of mineral N. In our
study, those residues were carried out in rich soil with high content of mineral N. Other
residues show a good agreement with literatures.
In a previous study, Probert et al. (2005) mentioned that it is important to conceptualise the
organic residues added as comprising discrete fractions to represent the complex patterns of
mineralization/immobilization in soil in response to residue additions. By conceptually
representing the added materials in terms of pools, the model can be parameterized to
simulate the dynamics of C and N that are observed in a wide range of residues. When
default values of FPOOLs (scenario 1) were applied for all residues, the model worked
acceptably to capture the release of CO2 in all cases with the EF values varies from 0.02 to
0.94, except for residue # 11 (Table 3.5a). The lignin content in this residue was extremely
higher than others (over 30%). Nevertheless, model performance was worse when

84
simulating the N mineralization (Table 5b). Then the measurement fraction of carbon in
FPOOLs was used to increase the capacity of the model. The distribution of C in pool 1 and
pool 3 fluctuated widely, from 25.8 to 90.1 in pool 1and from 2.0 to 30.6 in pool 3 whereas
the amount of C in pool 2 much lower than default, range from 3.4 to 61.3 (Table 3.1). In this
case, the model predicted more accurately net N mineralisation (Table 3.5a, 3.5b). In an
attempt to improve the predictive performance of the model for net N mineralization, a series
of simulations were carried out in which the CN ratios of each FPOOLs were changed by
adding/subtracting 10% of original to obtain satisfactory fit with the observed data (Figure
3.5b, 6b, 7b, 7d; Table 3.5b). The output of C:N ratios in each FPOOLs were shown in Table
3.1. Surprisingly, the prediction of CO2 release did not differ from previous scenario where
C:N ratios in FPOOLs were equal to overall CN ratios. Therefore, decomposition of CO2
from the model is mainly driven by the distribution of C in each of the pools of fresh organic
matter rather than the distribution of N in each FPOOLs whereas the prediction of N
mineralization depends strongly on CN ratio in each FPOOLs. One issue that emerges, is
how appropriate parameters should be selected for given source and how accurately the
model could applied in a truly predictive way for anther residues. For the amount of CO2
release over time, the model performed satisfactorily when parameterized with laboratory
defined pools for various residue application in same conditions. Probert et al. (2005)
showed that by using values of C:N ratios in FPOOLs which were estimated from measured
data for N associated with ADF and NDF, the model performed unsatisfactorily than using
optimization values.
Focusing on the impact of N on model performance, we found that the N mineral content in
soil affects considerably on the ability of the mode to illustrate the dynamics of C and N in
soil. Take residue # 6 (canola, CN = 43.0) as an example, in low N mineral soil (7.0 mg N
mineral kg-1 soil), the model was not able to capture the decomposition process of this
residue in any scenario. At higher soil N (N min = 29.9 mg kg-1 soil), the mode performance
was acceptable in both C and N release. Janzen and Kucey (1988) found a high correlation
between initial N concentration and amount of CO2 evolved. Knapp et al. (1983) reported that
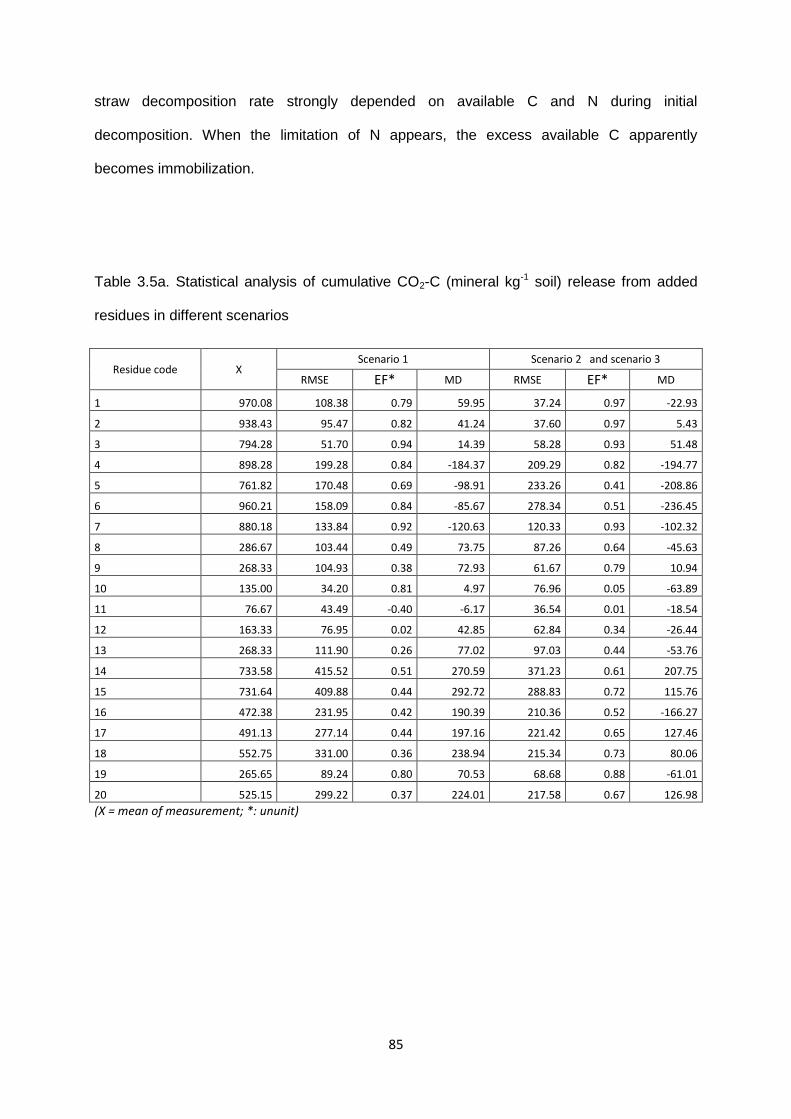
85
straw decomposition rate strongly depended on available C and N during initial
decomposition. When the limitation of N appears, the excess available C apparently
becomes immobilization.
Table 3.5a. Statistical analysis of cumulative CO2-C (mineral kg-1 soil) release from added
residues in different scenarios
Residue code X Scenario 1 Scenario 2 and scenario 3
RMSE EF* MD RMSE EF* MD
1 970.08 108.38 0.79 59.95 37.24 0.97 -22.93
2 938.43 95.47 0.82 41.24 37.60 0.97 5.43
3 794.28 51.70 0.94 14.39 58.28 0.93 51.48
4 898.28 199.28 0.84 -184.37 209.29 0.82 -194.77
5 761.82 170.48 0.69 -98.91 233.26 0.41 -208.86
6 960.21 158.09 0.84 -85.67 278.34 0.51 -236.45
7 880.18 133.84 0.92 -120.63 120.33 0.93 -102.32
8 286.67 103.44 0.49 73.75 87.26 0.64 -45.63
9 268.33 104.93 0.38 72.93 61.67 0.79 10.94
10 135.00 34.20 0.81 4.97 76.96 0.05 -63.89
11 76.67 43.49 -0.40 -6.17 36.54 0.01 -18.54
12 163.33 76.95 0.02 42.85 62.84 0.34 -26.44
13 268.33 111.90 0.26 77.02 97.03 0.44 -53.76
14 733.58 415.52 0.51 270.59 371.23 0.61 207.75
15 731.64 409.88 0.44 292.72 288.83 0.72 115.76
16 472.38 231.95 0.42 190.39 210.36 0.52 -166.27
17 491.13 277.14 0.44 197.16 221.42 0.65 127.46
18 552.75 331.00 0.36 238.94 215.34 0.73 80.06
19 265.65 89.24 0.80 70.53 68.68 0.88 -61.01
20 525.15 299.22 0.37 224.01 217.58 0.67 126.98
(X = mean of measurement; *: ununit)

86
Table 3.5b. Statistical analysis of net N mineralized (mineral kg-1 soil) from added residues in
different scenarios
Residue code X Scenario 1 Scenario 2 Scenario 3
RMSE EF* MD RMSE EF* MD RMSE EF* MD
1 3.57 10.30 -9.43 -8.97 11.57 -12.17 -10.35 3.53 -0.22 -0.55
2 13.52 6.99 -0.07 -4.07 6.99 -0.07 -4.88 6.94 -0.06 -0.24
3 1.48 8.68 -3.50 -7.95 8.12 -2.94 -7.49 2.58 0.60 -0.61
4 -56.36 19.38 -0.04 -17.11 -34.38 -0.09 -16.15 11.99 0.53 -10.44
5 80.56 33.26 -0.65 28.73 41.28 -0.37 20.96 15.51 0.57 3.50
6 -28.73 12.09 0.73 -1.86 -42.07 0.62 1.72 13.13 0.62 1.72
7 50.64 29.86 0.44 -16.96 58.97 -1.51 -42.33 53.92 -1.21 -32.48
8 -4.50 10.60 -0.84 -8.16 15.00 -2.69 -12.61 7.15 0.16 -2.61
9 -15.33 13.70 -2.22 -12.05 14.88 -2.80 -13.19 7.19 0.11 -3.49
10 -14.33 10.71 -0.08 7.69 12.79 -0.55 10.39 9.86 0.08 7.73
11 -9.00 32.16 -19.15 25.03 31.23 -18.00 25.47 26.26 -12.44 20.80
12 -4.50 7.27 -5.68 4.87 6.66 -4.60 4.50 4.18 -1.20 0.52
13 3.83 4.60 0.32 0.85 5.90 -0.12 -4.08 4.31 0.40 -1.24
14 -30.24 25.70 -1.06 -23.42 25.37 -1.01 -23.09 23.98 -0.80 -21.79
15 -28.63 24.89 -1.36 -22.97 24.36 -1.26 -22.43 22.15 -0.87 -20.39
16 -3.42 11.21 -0.50 -4.85 12.24 -0.78 -9.35 9.30 -0.03 -0.75
17 -29.82 14.74 0.17 -13.05 12.09 0.44 -10.31 11.59 0.49 -9.74
18 -31.21 17.11 0.03 -15.57 11.80 0.54 -10.15 11.29 0.58 -9.57
19 8.39 18.38 -4.93 9.60 16.19 -3.60 8.45 7.44 0.03 -4.78
20 -34.08 18.25 0.04 -16.25 14.66 0.38 -12.75 12.68 0.54 -10.82
(X = mean of measurement; *: ununit)
3.5 Conclusion
The results from this study showed that using the default values, the SOILN model was not
able to represent the kinetics of C and N in soil – plant systems, especial in low residue
quality. When residues were applied into soil, several parameters such as the fraction of
each substrate pools mineralized, retained or transferred to the other pools, the distribution
of C and N in each substrate need to be modified to get better simulation. The performance
of SOIN model then showed a satisfactory in capturing the dynamics of C and N from
different applied residues with C:N ratio from 9 to 148. In case of high residue quality (in term
of C:N ratio lower than 27), the model predicted well in both low and high soil N
concentrations. Discover the essential role of initial parameter (eg ef_fom, ef_biom) need to
be taken into consideration due to its effect on the decomposition of different residues which

87
are very popular in low farming systems. Moreover, because of carrying out in close system
in constant conditions, the model needs to be further evaluated for its ability to predict C and
N dynamics in various climate and management.

88
3.6. References
Anderson, T.-H., and Domsch, K. H., ‘Carbon assimilation and microbial activity in soil’, Zeitschrift für Pflanzenernährung und Bodenkunde, Vol. 149, No. 4, 1986.
Anwar, M. R., O'Leary, G. J., Rab, M. A., Fisher, P. D., and Armstrong, R. D., ‘Advances in precision agriculture in south-eastern Australia. V. Effect of seasonal conditions on wheat and barley yield response to applied nitrogen across management zones’, Crop and Pasture Science, Vol. 60, No. 9, 2009.
Asseng, S., Jamieson, P., Kimball, B., Pinter, P., Sayre, K., Bowden, J., and Howden, S., ‘Simulated wheat growth affected by rising temperature, increased water deficit and elevated atmospheric CO2’, Field Crops Research, Vol. 85, 2-3, 2004.
Asseng, S., van Keulen, H., and Stol, W., ‘Performance and application of the APSIM Nwheat model in the Netherlands’, European Journal of Agronomy, Vol. 12, No. 1, 2000.
Blanco-Canqui, H., and Lal, R., ‘Crop Residue Removal Impacts on Soil Productivity and Environmental Quality’, Critical Reviews in Plant Sciences, Vol. 28, No. 3, 2009.
Bosatta, E., and Ågren, G. I., ‘Theoretical analysis of microbial biomass dynamics in soils’, Soil Biology and Biochemistry, Vol. 26, No. 1, 1994.
Brisson, N., Gary, C., Justes, E., Roche, R., Mary, B., Ripoche, D., Zimmer, D., Sierra, J., Bertuzzi, P., Burger, P., Bussière, F., Cabidoche, Y. M., Cellier, P., Debaeke, P., Gaudillère, J. P., Hénault, C., Maraux, F., Seguin, B., and Sinoquet, H., ‘An overview of the crop model stics. Modelling Cropping Systems: Science, Software and Applications’, European Journal of Agronomy, Vol. 18, 3–4, 2003.
Carberry, P., Probert, M., Dimes, J., Keating, B., and McCown, R., ‘Role of modelling in improving nutrient efficiency in cropping systems’, Plant and Soil, Vol. 245, No. 1, 2002.
Chertov, O. G., ‘Specom - a single tree model of pine stand/raw humus soil ecosystem’, Ecological Modelling, Vol. 50, 1–3, 1990.
Constantinides, M., and Fownes, J. H., ‘Nitrogen mineralization from leaves and litter of tropical plants: Relationship to nitrogen, lignin and soluble polyphenol concentrations’, Soil Biology and Biochemistry, Vol. 26, No. 1, 1994.
Falloon, P., and Smith, P., ‘Simulating SOC changes in long-term experiments with RothC and CENTURY: model evaluation for a regional scale application’, Soil Use and Management, Vol. 18, No. 2, 2002.
Franko, U., ‘Modelling approaches of soil organic matter turnover within the CANDY system’, in D. Powlson, P. Smith and J. Smith (eds.), Evaluation of Soil Organic Matter Models, Springer Berlin Heidelberg, 1996.
Franko, U., Oelschlägel, B., and Schenk, S., ‘Simulation of temperature-, water- and nitrogen dynamics using the model CANDY’, Modelling of Geo-Biosphere Processes, Vol. 81, 1–3, 1995.
Garnier, P., Néel, C., AITA, C., Recous, S., Lafolie, F., and Mary, B., ‘Modelling carbon and nitrogen dynamics in a bare soil with and without straw incorporation’, European Journal of Soil Science, Vol. 54, No. 3, 2003.
Gaydon, D., Probert, M., Buresh, R., Meinke, H., and Timsina, J., ‘Modelling the role of algae in rice crop nutrition and soil organic carbon maintenance’, European Journal of Agronomy, Vol. 39, 2012.
Gijsman, A. J., Hoogenboom, G., Parton, W. J., and Kerridge, P. C., ‘Modifying DSSAT Crop Models for Low-Input Agricultural Systems Using a Soil Organic Matter–Residue Module from CENTURY’, Agron. J, Vol. 94, No. 3, 2002.
Gilmour, C. M., and Gilmour, J. T., ‘Assimilation of carbon by the soil biomass’, Plant and Soil, Vol. 86, No. 1, 1985.
Godwin, D. A. J. C., Nitrogen Dynamics in Soil-Plant Systems. In: Hanks, R. J; Ritchie, J. T.: Modeling plant and soil systems, American Society of Agronomy; Crop Science Society of America; Soil Science Society of America, 1991.

89
Hansen, S., Jensen, H. E., Nielsen, N. E., and Svendsen, H., ‘Simulation of nitrogen dynamics and biomass production in winter wheat using the Danish simulation model DAISY’, Fertilizer Research, Vol. 27, 2-3, 1991.
Hasegawa, H., Bryant, D. C., and Denison, R. F., ‘Testing CERES model predictions of crop growth and N dynamics, in cropping systems with leguminous green manures in a Mediterranean climate’, Field Crops Research, Vol. 67, No. 3, 2000.
Hasegawa, H., Labavitch, J. M., McGuire, A. M., Bryant, D. C., and Denison, R. F., ‘Testing CERES model predictions of N release from legume cover crop residue’, Field Crops Research, Vol. 63, No. 3, 1999.
Holzworth, D. P., Huth, N. I., deVoil, P. G., Zurcher, E. J., Herrmann, N. I., McLean, G., Chenu, K., van Oosterom, E. J., Snow, V., Murphy, C., Moore, A. D., Brown, H., Whish, J. P. M., Verrall, S., Fainges, J., Bell, L. W., Peake, A. S., Poulton, P. L., Hochman, Z., Thorburn, P. J., Gaydon, D. S., Dalgliesh, N. P., Rodriguez, D., Cox, H., Chapman, S., Doherty, A., Teixeira, E., Sharp, J., Cichota, R., Vogeler, I., Li, F. Y., Wang, E., Hammer, G. L., Robertson, M. J., Dimes, J. P., Whitbread, A. M., Hunt, J., van Rees, H., McClelland, T., Carberry, P. S., Hargreaves, J. N. G., MacLeod, N., McDonald, C., Harsdorf, J., Wedgwood, S., and Keating, B. A., ‘APSIM – Evolution towards a new generation of agricultural systems simulation’, Environmental Modelling & Software, Vol. 62, 2014.
Huth, N., Thorburn, P., Radford, B., and Thornton, C., ‘Impacts of fertilisers and legumes on N2O and CO2 emissions from soils in subtropical agricultural systems: A simulation study’, Agriculture, Ecosystems & Environment, Vol. 136, 3-4, 2010.
Janzen, H. H., and Kucey, R. M. N., ‘C, N, and S mineralization of crop residues as influenced by crop species and nutrient regime’, Plant and Soil, Vol. 106, No. 1, 1988.
Jarvis, S. C., Stockdale, E. A., Shepherd, M. A., and Powlson, D. S., ‘Nitrogen Mineralization in Temperate Agricultural Soils: Processes and Measurement’, in Donald L. Sparks (ed.), Advances in Agronomy, Academic Press, 1996.
Jones, J. W., Hoogenboom, G., Porter, C. H., Boote, K. J., Batchelor, W. D., Hunt, L. A., Wilkens, P. W., Singh, U., Gijsman, A. J., and Ritchie, J. T., ‘The DSSAT cropping system model. Modelling Cropping Systems: Science, Software and Applications’, European Journal of Agronomy, Vol. 18, 3–4, 2003.
Justes, E., Mary, B., and NICOLARDOT, B., ‘Quantifying and modelling C and N mineralization kinetics of catch crop residues in soil: parameterization of the residue decomposition module of STICS model for mature and non mature residues’, Plant and Soil, Vol. 325, 1-2, 2009.
Keating, B. A., Carberry, P. S., Hammer, G. L., Probert, M. E., Robertson, M. J., Holzworth, D., Huth, N. I., Hargreaves, J. N. G., Meinke, H., Hochman, Z., McLean, G., Verburg, K., Snow, V., Dimes, J. P., Silburn, M., Wang, E., Brown, S., Bristow, K. L., Asseng, S., Chapman, S., McCown, R. L., Freebairn, D. M., and Smith, C. J., ‘An overview of APSIM, a model designed for farming systems simulation. Modelling Cropping Systems: Science, Software and Applications’, European Journal of Agronomy, Vol. 18, 3–4, 2003.
Kirschbaum, M. U. F., and Paul, K. I., ‘Modelling C and N dynamics in forest soils with a modified version of the CENTURY model’, Soil Biology and Biochemistry, Vol. 34, No. 3, 2002.
Knapp, E. B., Elliott, L. F., and Campbell, G. S., ‘Carbon, nitrogen and microbial biomass interrelationships during the decomposition of wheat straw: A mechanistic simulation model’, Soil Biology and Biochemistry, Vol. 15, No. 4, 1983.
Li, C., ‘The DNDC Model’, in D. Powlson, P. Smith and J. Smith (eds.), Evaluation of Soil Organic Matter Models, Springer Berlin Heidelberg, 1996.
Li, C., Frolking, S., and Frolking, T. A., ‘A model of nitrous oxide evolution from soil driven by rainfall events: 1. Model structure and sensitivity’, Journal of Geophysical Research: Atmospheres, Vol. 97, D9, 1992.
Li, C., Frolking, S., and Harriss, R., ‘Modeling carbon biogeochemistry in agricultural soils’, Global Biogeochemical Cycles, Vol. 8, No. 3, 1994.
90
MacCarthy, D. S., Sommer, R., and Vlek, P. L. G., ‘Modeling the impacts of contrasting nutrient and residue management practices on grain yield of sorghum (Sorghum bicolor (L.) Moench) in a semi-arid region of Ghana using APSIM’, Field Crops Research, Vol. 113, No. 2, 2009.
Meier, E. A., Thorburn, P. J., and Probert, M. E., ‘Occurrence and simulation of nitrification in two contrasting sugarcane soils from the Australian wet tropics’, Australian Journal of Soil Research, Vol. 44, No. 1, 2006.
Mohanty, M., Probert, M., Reddy, K. S., Dalal, R., Mishra, A., Subba Rao, A., Singh, M., and Menzies, N., ‘Simulating soybean–wheat cropping system: APSIM model parameterization and validation’, Agriculture, Ecosystems & Environment, Vol. 152, 2012.
Mohanty, M., Reddy, K. S., Probert, M., Dalal, R., Rao, A. S., and Menzies, N., ‘Modelling N mineralization from green manure and farmyard manure from a laboratory incubation study’, Ecological Modelling, Vol. 222, No. 3, 2011.
Molina, J. A. E., ‘Description of the model NCSOIL’, in D. Powlson, P. Smith and J. Smith (eds.), Evaluation of Soil Organic Matter Models, Springer Berlin Heidelberg, 1996.
Molina, J. A. E., Clapp, C. E., Shaffer, M. J., Chichester, F. W., and Larson, W. E., NCSOIL, A Model of Nitrogen and Carbon Transformations in Soil: Description, Calibration, and Behavior1, 1983.
Mueller, T., Jensen, L. S., Hansen, S., and Nielsen, N. E., ‘Simulating soil carbon and nitrogen dynamics with the soil-plant-atmosphere system model DAISY’, in D. Powlson, P. Smith and J. Smith (eds.), Evaluation of Soil Organic Matter Models, Springer Berlin Heidelberg, 1996.
Nascimento, A. F. d., Mendonca, E. S. de, Leite, L. F. C., and Neves, J. C. L., ‘Calibration of the century, apsim and ndicea models of decomposition and n mineralization of plant residues in the humid tropics’, Revista Brasileira de Ciencia do Solo, 35 (3), 2011.
Nendel, C., Berg, M., Kersebaum, K. C., Mirschel, W., Specka, X., Wegehenkel, M., Wenkel, K. O., and Wieland, R., ‘The MONICA model: Testing predictability for crop growth, soil moisture and nitrogen dynamics’, Ecological Modelling, Vol. 222, No. 9, 2011.
Nicolardot, B., Molina, J. A. E., and Allard, M. R., ‘C and N fluxes between pools of soil organic matter: Model calibration with long-term incubation data’, Soil Biology and Biochemistry, Vol. 26, No. 2, 1994.
Nicolardot, B., Recous, S., and Mary, B., ‘Simulation of C and N mineralisation during crop residue decomposition: A simple dynamic model based on the C:N ratio of the residues’, Plant and Soil, Vol. 228, No. 1, 2001.
Oorts, K., Garnier, P., Findeling, A., Mary, B., Richard, G., and NICOLARDOT, B., ‘Modeling Soil Carbon and Nitrogen Dynamics in No-till and Conventional Tillage Using PASTIS Model’, Soil Sci. Soc. Am. J, Vol. 71, No. 2, 2007.
Palm, C. A., and Sanchez, P. A., ‘Nitrogen release from the leaves of some tropical legumes as affected by their lignin and polyphenolic contents’, Soil Biology and Biochemistry, Vol. 23, No. 1, 1991.
Parton, W. J., Stewart, J. W. B., and Cole, C. V., ‘Dynamics of C, N, P and S in grassland soils: a model’, Biogeochemistry, Vol. 5, No. 1, 1988.
Powlson, D., ‘Why evaluate soil organic matter models?’, in D. Powlson, P. Smith and J. Smith (eds.), Evaluation of Soil Organic Matter Models, Springer Berlin Heidelberg, 1996.
Powlson, D., Smith, P., and Smith, J. (eds.), Evaluation of Soil Organic Matter Models, Springer Berlin Heidelberg, 1996a.
——, Evaluation of Soil Organic Matter Models, Springer Berlin Heidelberg, 1996b. Probert ME, K. B. T. J. P. W., ‘Modelling water, nitrogen, and crop yield for a long-term fallow
management experiment’, Australian Journal of Experimental Agriculture, Vol. 35, 1995. Probert, M. E., Dimes, J. P., Keating, B. A., Dalal, R. C., and Strong, W. M., ‘APSIM's water and
nitrogen modules and simulation of the dynamics of water and nitrogen in fallow systems’, Agricultural Systems, Vol. 56, No. 1, 1998.
Probert, M., and Dimes, J. P., Modelling Release of Nutrients from Organic Resources Using APSIM. In: Delve, R.J; Probert, M.E (eds): Modelling nutrient management in tropical cropping systems, Australian Centre for International Agricultural Research (ACIAR), 2004.

91
Probert, M., Delve, R., Kimani, S., and Dimes, J., ‘Modelling nitrogen mineralization from manures: representing quality aspects by varying C:N ratio of sub-pools’, Soil Biology and Biochemistry, Vol. 37, No. 2, 2005.
Robertson, M., Sakala, W., Benson, T., and Shamudzarira, Z., ‘Simulating response of maize to previous velvet bean (Mucuna pruriens) crop and nitrogen fertiliser in Malawi’, Field Crops Research, Vol. 91, No. 1, 2005.
Schnürer, J., Clarholm, M., and Rosswall, T., ‘Microbial biomass and activity in an agricultural soil with different organic matter contents’, Soil Biology and Biochemistry, Vol. 17, No. 5, 1985.
Smith, J., Smith, P., and Addiscott, T., ‘Quantitative methods to evaluate and compare Soil Organic Matter (SOM) Models’, in D. Powlson, P. Smith and J. Smith (eds.), Evaluation of Soil Organic Matter Models, Springer Berlin Heidelberg, 1996.
Sparling, G. P., ‘Ratio of microbial biomass carbon to soil organic carbon as a sensitive indicator of changes in soil organic matter’, Australian Journal of Soil Research, Vol. 30, No. 2, 1992.
Stöckle, C. O., Donatelli, M., and Nelson, R., ‘CropSyst, a cropping systems simulation model’, Modelling Cropping Systems: Science, Software and Applications, Vol. 18, 3–4, 2003.
Tian, G., Kang, B. T., and Brussaard, L., ‘Biological effects of plant residues with contrasting chemical compositions under humid tropical conditions—Decomposition and nutrient release’, Soil Biology and Biochemistry, Vol. 24, No. 10, 1992.
Trinsoutrot, I., Recous, S., Bentz, B., Line`res, M., Che`neby, D., and NICOLARDOT, B., ‘Biochemical Quality of Crop Residues and Carbon and Nitrogen Mineralization Kinetics under Nonlimiting Nitrogen Conditions’, Soil Sci. Soc. Am. J, Vol. 64, No. 3, 2000a.
Trinsoutrot, I., Recous, S., Mary, B., and NICOLARDOT, B., ‘C and N fluxes of decomposing 13C and 15N Brassica napus L.: effects of residue composition and N content’, Soil Biology and Biochemistry, Vol. 32, 11–12, 2000b.
van Ittersum, M. K., Leffelaar, P. A., van Keulen, H., Kropff, M. J., Bastiaans, L., and Goudriaan, J., ‘On approaches and applications of the Wageningen crop models’, Modelling Cropping Systems: Science, Software and Applications, Vol. 18, 3–4, 2003.
van Soest, P. J., Robertson, J. B., and Lewis, B. A., ‘Methods for Dietary Fiber, Neutral Detergent Fiber, and Nonstarch Polysaccharides in Relation to Animal Nutrition’, Journal of Dairy Science, Vol. 74, No. 10, 1991.
Vanlauwe, B., Nwoke, O. C., Sanginga, N., and Merckx, R., ‘Impact of residue quality on the C and N mineralization of leaf and root residues of three agroforestry species’, Plant and Soil, Vol. 183, No. 2, 1996.
Whitbread, A. M., and Clem, R. L., ‘Graze to grain—measuring and modelling the effects of grazed pasture leys on soil nitrogen and sorghum yield on a Vertosol soil in the Australian subtropics’, Australian Journal of Agricultural Research, Vol. 57, No. 5, 2006.
Whitbread, A. M., Robertson, M. J., Carberry, P. S., and Dimes, J. P., ‘How farming systems simulation can aid the development of more sustainable smallholder farming systems in southern Africa’, Cropping Systems Design: new methods for new challenges, Vol. 32, No. 1, 2010.

92
APPENDIX
1. Parameterisation
If we call the “assimilation yield constant by microbial biomass” of soil organic matter pools is
γ (range from 0 -1), then the proportion of carbon retained when each soil organic matter
pools decomposing is given as below:
efi = 1 – γ (1)
In fresh organic matter (FOM) pool, the value of γ can be calculated by follow equation:
γ = [𝑑𝐶𝐶𝑂2
𝑑𝑡] (2)
Where: CCO2 is the amount of CO2 release from FOM pool during time t. The value of γ varies
from 0 to 1. The value of γ in FOM of any added residue is calculated as follow:
γFOM = [∑ 𝐶𝑂2 𝑥 100
𝑟𝑒𝑠 𝑥 𝑑𝑚] (3)
Where ∑ 𝐶𝑂2 is the amount of CO2-C release during time t (mg kg-1 soil), res is the amount of
applied residue (mg kg-1 soil), dm is the dry matter of residue (%).
2. Distribution of carbon in different pools soil
At initialisation, total carbon content (TOC) is calculated as:
TOC = FOM + OC = FOM + BIOM + HUM (4)
Where: OC is the organic carbon of soil (kg/ha), BIOM is the microbial biomass carbon
(kg/ha), HUM is the humic carbon (kg/ha).
In SOILN, a passive pool of soil organic carbon is considered as the inert part of HUM and is
calculated as:
INERT = Finert x OC (5)
Where: Finert is the proportion of soil carbon that is inert, it is usually assumed depending on
soil layer and total organic carbon content.
The BIOM in SOILN is defined in term of the HUM carbon as follow:
BIOM = Fbiom x (HUM - INERT) (6)
Fbiom specifies the BIOM pool carbon as a fraction of the hum carbon that is subject to
decomposition. Its values range from 0.06 ± 0.04 which are mainly depended on soil organic
matter. Then,
BIOM = (Fbiom x (OC - INERT)) / (1 + Fbiom) (7)
The decomposition of each pools soil follows equations from 8 – 12
3. Decomposition of soil organic matter pools

93
The rate of residue decomposition can be calculated as the following equation:
dR/dt = -kR (8)
where: R is the organic matter added per unit (kg ha-1) in time t and k is the decomposition
coefficient given by:
k = rdmax FC:N Ftemp Fmoisture (9)
where: rdmax is potential decomposition rate; FC:N, Ftemp, Fmoisture, are factors on a scale from 0
to 1 representing the degree of limitation on decomposition imposed by residue CN ratio,
temperature, moisture. The definitions of the factors are expressed mathematically as below:
FC:N = exp (0.277 (1 – CN / CNopt)) CN > CNopt (10)
Ftemp = T / Topt T ≤ Topt (11)
Fmoist = 1 – (∑Eos / Eos,max) ∑Eos < Eos,max (12)
Where: T is the average daily air temperature, Eos is the potential daily soil evaporation, and
the subscripts “opt” and “max” refer to the optimum and maximum parameter values,
respectively. In SOIL N, the CNopt was set to 25 and Topt to 32 as default values that
represent values in literature

94
Chapter 4. Carbon and nitrogen mineralisation and N recovery from 15N labelled plant
residues under controlled conditions
4.1. Introduction
Nutrient cycling in the soil – plant ecosystem is an essential component of sustainable
productive agricultural activities. Although during the last 20 years inorganic fertilizer has
played a dominant role of nutrient supply source for plant growth, plant residues also play an
important role, especially in low agricultural farming systems in developing countries.
Understanding of the decomposition processes occurring in soil, in particular of C and N
mineralization patterns therefore will help farmers saving their budget for inputs.
The release of C and N from organic residues depends mainly on their chemical and physical
properties, the environmental conditions and the decomposer communities. Several authors
noted negative effects of high lignin and active polyphenol concentrations on the
decomposing ability and N release from residues (Constantinides and Fownes, 1994, Palm
and Sanchez, 1991, Fox et al., 1990, Handayanto et al., 1994, Trinsoutrot et al., 2000,
Vahdat et al., 2011). When studying the effects of chemical composition of some tropical
legumes on N release patterns, Palm and Sanchez (1991) showed that polyphenolic content
could control the short term N release and availability from legumes. Vahdat et al. (2011)
found a negative correlation between N release from two major plant families (Gramineae
and Leguminoseae) and lignin, lignin:N contents or C:N ratio of the plant residues.
Nitrogen recovery from plant residues varies widely depending on their characteristics and
environmental conditions. Thomsen (2004) indicated that N recovery significantly depended
on the season, for example the barley 15N recovery was 15% for winter-applied manure
whereas this figure increased to 38% when applying in spring. Through years, the amount of
N recovery decreased significantly. Thomsen (2004) found that ryegrass recoveries of 15N
from manure and fertiliser were 4 to 6% in the second year and only 1 to 2% in the third year.
Similar results were also found in Sisworo et al. (1990), Cadisch et al. (1998), Kumar and
Goh (2002), Thomsen and Jensen (1994) which showed that the mean N recoveries from

95
residues decreased with increasing time of subsequent crop without any added of residues.
The effect of residue quality on the N recovery was reported in Cadisch et al. (1998) where
cumulative N recovery by maize from 4 different legume prunings ranged from 9% to 44%
under the same conditions. These materials differed significantly in their content of lignin,
polyphenol and protein-binding capacity.
Long term N release may be of considerable practical interest. Holbeck et al. (2013) found
that the recovery of fertiliser 15N was not significantly influenced by soil texture and soil
organic matter content and suggested that management practices and biological recycling
played a major role in nutrient recovery. When studying the recovery of nitrogen
mineralisation from 15N labelled straw and ryegrass residues by spring barley over 3 years on
field conditions, Thomsen and Jensen (1994) found that recovery of N derived from straw
was not significantly different whether incorporated alone or in combination with ryegrass
residue and the mean recovery of straw N was decrease in long term (4.5% in the first barley
crop and 2.7% and 1.1% in the second and third crop). When researching the effect of tillage
method on fertilizer N dynamics in the soil, Giacomini et al. (2010) found a little effect
between minimum tillage and conventional tillage. Plant 15N recovery accounted for 59-63%
at flowering and harvest. Similar results were also recognized in Thomsen and Christensen
(2007).
The use of nitrogen 15 isotopic techniques to evaluate the N recovery from added sources
has been applied in many studies. In this study, by using 15N labelled plant residues, we
focus mainly on: 1) the dynamic of carbon and nitrogen under incubation condition of several
labelled plant residues and 2) to discover the effect of biochemical quality of added residues,
the methods of application and season on the N recovery in a long term experiment in pot
trial in greenhouse condition.

96
4.2. Materials and Methods
4.2.1. Soil
The soil (Podsols) was collected from the North of Germany (Lüneburg 53° 15′ 9″ N,
10° 24′ 52″ E) from the surface layer (0-20 cm) of an annually cultivated field. Previously, the
field was planned to annual crops such as carrots, potatoes and wheat. Soil was air-dried
and sieved through a 2 mm mesh to remove roots and other debris and stored at room
temperature. Some properties of the soil were: pH = 6.6, Clay = 6.2%, Silt = 5.2%, Sand =
88.60%; OC =1.44%, N = 0.06 %, 5.10 NH4+ -N (mg kg-1 soil), 2.40 NO3-N (mg kg-1 soil).
4.2.2. Labelled plant residues
Depending on the plant type 2 methods of application were used to enrich 15N in the plant
residues used in this study. Foliar brushing was applied for the perennial cacao (Theobroma
cacao) in some branches, the others including mucuna (Mucuna pruriens), lablab
(Lablab purpureus), maize (Zea mays), and flemingia (Flemingia macrophylla) were sprayed
in whole plant. All plants were grown and developed under controlled conditions in the
glasshouse. The number of plants per pot was adjusted to allow normal development. In the
beginning, 3-5 seeds of maize, lablab or mucuna were sown and thinned to 1-2 plants in
each pot. The plants were continuously labelled with 15N either from 5mM of 98 atom%
15NH415NO3 or from 5mM of 98 atom% 15N2 urea (applied only in maize). Labelling was
applied for 12 weeks to allow each pot receiving about 200 -300ml 15N 5mM solution in total.
The wetting agent Proagro was added at 2.5 mL L-1 to ensure the contact between solution
and leaves surface. After labelling, all above biomass were harvested and oven-dried at
40oC, a subsample was ground at 0.8 mm for characteristic analysis (Table 4.1). The total C
and N concentration of residues were determined using a combustion technique (Elemental
analyser). The Van Soet method was used to determine the acid detergent fiber (ADF),
neutral detergent fiber (NDF) and acid detergent lignin (ADL) (van Soest, 1967, van Soest et
al., 1991). A soluable fertiliser containing essential macro and micro –nutrients, excluding N

97
was also applied at the start of planting and weekly afterward in each pot experiment in order
to satisfy plant nutrient requirements.
Table 4.1. Some biochemical quality of using plant residues (mean ± standard deviation)
Treatment 15N
(APE) N
(%) C
(%) C:N
Carbohydratec (%)
Cellulosea (%)
Hemicelluloseb (%)
Lignind (%)
Cacao 1.22 ±
0.07
2.88 ±
0.23
44.03 ±
1.47
15.40 ±
1.74 38.6 ± 2.4 27.4 ± 0.6 11.9 ± 3.0
22.1 ±
1.5
Flemingia 1.26 ±
0.08
3.02 ±
0.17
43.05 ±
0.39
14.28 ±
0.68 41.4 ± 0.5 22.0 ± 1.0 16.0 ± 0.6
20.6 ±
0.7
Lablab
2.22 ±
0.10
3.16 ±
0.14
41.57 ±
0.59
13.16 ±
0.37 59.4 ± 1.5 24.3 ± 0.7 7.9 ± 1.9
8.3 ±
0.4
Maize 4.05 ±
0.12
2.38 ±
0.16
37.73 ±
1.52
15.86 ±
1.18 32.8 ± 0.6 28.3 ± 0.5 34.7 ± 0.8
4.1 ±
0.1
Mucuna 2.94 ±
0.05
3.45 ±
0.13
40.20 ±
0.77
11.67 ±
0.47 59.1 ± 0.7 23.2 ± 0.4 8.4 ± 1.1
9.2 ±
0.2
aCalculated as: %Acid detergent fiber (ADF) – % Acid detergent lignin (ADL); bCalculated as:
%Neutral detergent fiber (NDF) – %ADF; dCalculated as %ADL; cCalculated as: 100 – d – a – b.
4.2.3. Trials
Pot trial:
This trial was carried out in the Greenhouse of Crop Production System in the Tropics,
Göttingen University from July 2014 to February 2015. Five 15N labeled residue types
(including leaves and stems) mentioned in part 2b were used in this trial. Pots (height 17cm,
diameter 14cm) were fulfilled with around 1.5kg of 2mm soil and mixed with 2g of 15N residue
throughout pot. The residues were cut at length 1-3 cm and were applied to soil with 2
different ways: incorporated (IN) or mulched (MU). In the IN treatment, the residues were
completely and manually mixed into soil to ensure that no visible part of added residues
remained on the surface. In the latter treatment (MU), applied residues were maintained on
the soil surface with no disturbance. In the same day of residues application, the pots were
wet and kept running in 4 weeks. Alora, a variety of winter wheat (Triticum aestivum) from
Schweiger Seed Production Company in Moosburg, Germany was used in this trial. Wheat

98
seeds were germinated in the chamber for 5 days before transplanting seedlings into pots.
Five plants per pot were maintained until harvesting. The experiment was a completely
randomized design, replicated 3 times with 2 duplications. A control treatment without added
residues was also run in the same time. The first duplication was harvested after 6 weeks of
planting and the second one was harvested after 12 weeks of planting. After harvesting in
each of duplication, new seedlings were immediately sown in same pots without re-mixing
the soil and surface or mixed residues remained in the pots. Each of duplication was then
grown and harvested at 6 weeks and 12 weeks of planting respectively for 3 continuous
seasons and in totally of almost 7 months. In the harvesting time of each of duplication, all
above biomass of 5 wheat plants was completely collected, weighted for biomass and oven-
dried at 40oC for dry matter. Plants samples then were prepared for further analyses. The
light was ensured for normal development in greenhouse in winter time by artificial lighting
system which was activated daily from 7 am to 5 pm.
Incubation trial
This trial used the same soil and residues type as in pot trial. An amount of 2 g residue was
mixed with 500g soil in 3L closed-pot and incubated for 119 days (approximately equivalent
to 3 tons per ha). In the beginning, the water holding capacity was adjusted to 50%, the
cover of the pots was opened and system was run as pre-incubation for 7 days at a constant
temperature of 25°C. In day 8 (day 0), water holding capacity was brought to 75% and kept
unchanged during the treatment by controlling pot weight plus soil and water in every week.
The pots were completely sealed, closed and incubated at 25°C in chamber. A control
treatment consisting of soil-only was included in all incubations and in all cases 3 replicates
of each treatment were used.
4.2.4. Analytical measurement
Gas sampling and measurement
Gas sampling was carried out only for incubation trial. It was collected every second day in
the first 2 weeks, and then on a weekly basis over the next 8 weeks until completion (week
17th). At each sampling time, pots were opened for 1 hour, closed and 20 ml of gas was

99
sequentially sampled through a septum at 0, 45 and 90 min and transferred to an evacuated
vial for gas analysis. This gas sample was marked at time “zero”. After 45 and 90 minutes
thereafter, this process was replicated without opening the pot. The gas samples then were
analysed for all CH4, CO2 and N2O by the automated gas chromatographic system equipped
with a flame ionization and an electron capture detectors (WILLIAMS, 1946). Gas fluxes then
were calculated from the linear increase of gas concentration as follow:
Φ=𝑑𝑐
𝑑𝑡Iv (
P.V.f
R.T) M
Where Φ is the flux of either N2O-N, CO2-C or CH4-C (mg h-1), dc/dt is the rate of gas
concentration change within the incubation pot (µL L-1 h-1), Iv is the incubation pot volume
(L), P is the measured atmospheric pressure (N m-2), f is the factor to convert measured gas
volume from µL to m3, R is ideal gas constant (8.314 N.m mol-1 K-1), T is measured air
temperature (K) and M is molar mass of each gas fluxes (mg mol-1).
Gas flux then was expressed on soil mass basis per day (µg kg-1 soil day-1).
Carbon mineralization (expressed in µg kg-1 soil) from added residues was calculated from
the different in cumulative amount of carbon release between amendment soil with residues
and a control at each sampling time.
Cumulative CO2-C (residue) = Cumulative CO2-C (treatment) - Cumulative CO2-C (control)
Soil sampling and nitrogen measurement
Mineral nitrogen was measured on soil samples collected at week 0, 3, 6, 9, 12, 15, 18, 22,
25, 28 and 30 in the pot experiment and at week 0, 1, 2, 3, 5, 7, 10, 13 and 17 in the
incubation experiment. The samples were extracted with potassium chloride (KCl) solution by
shaking for 1 hour and filtered through the No. 42 Whatman filter paper. The extracts were
analysed for NH+4 and NO-
3 using thermal conductivity detection by Matejovic (1997). Net N
mineralisation during the incubation processes was calculated as follows:
Mineral N (mg kg-1 soil)= NH4+-N + NO3
- -N
Net N mineralization from added residues was calculated as follows:
Net N min (mg kg-1 soil) = mineral N in the treatment − mineral N in control

100
Isotopic analysis
About 2mg of ground plant samples were weighed into tin capsules. Samples then were
analyzed by isotope ratio mass spectrometry (IRMS), using an elemental analyzer (NA1108,
Fisons-Instruments, Rodano,Milano, Italy) coupled to a gas isotope ratio mass spectrometer
(Delta C, Finnigan MAT, Bremen, Germany). An Acetanilid was used as a standard for 15N
(R= 0.00367). Enrichment of plants in term of atom percent excess (APE) was calculated as
follows:
APE = ((15N
15N + 14N)
labeled
− (15N
15N + 14N)
standard
) x 100
N derived from residues in percent (%NdfR) to plant samples was then estimated by using
the equation:
%NdfR =atom%15N excess (sample) − 0.3663
atom%15N excess (residue) − 0.3663x 100
4.2.5. Statistics
The data on gas flux, net N mineralisation, dry matter and N derived from residues were
analysed using analysis of variance (ANOVA) and tests of significance at 5% level of
probability. Statistical analysis was performed by using R program and Excel program.
4.3. Results
4.3.1. Residue quality and the recovery of 15N isotopic of plants
Biochemical components of added residues were presented in Table 4.1. In general, there
was no significant difference in overall C:N ratio and cellulose content of the residues
whereas the hemicellulose and lignin content varied in a wide range and was significantly
different. The lowest lignin content was measured in maize (4.1%) followed by lablab (8.3%)
and mucuna (9.2%). Meanwhile the hemicellulose content of maize was the highest (34.7)
and significant difference with the others. As a result of growth conditions, all residues had a
low overall C:N ratio even in cacao and maize residue.

101
Table 4.2. The recovery of 15N isotopic in atom percent excess (APE) of wheat plant from
different 15N labelled residues in 3 consecutive seasons at 6 and 12 weeks after planting of 2
different residue applications (mean ± standard deviation).
Residue
Incorporated Mulched
1 2 3 1 2 3
Cacao
6 weeks 0.42 ± 0.007 0.39 ± 0.002 0.39 ± 0.004 0.42 ± 0.009 0.38 ± 0.000 0.39 ± 0.001
12 weeks 0.42 ±0.012 0.40 ±0.004 0.39 ±0.005 0.40 ±0.009 0.39 ±0.001 0.39 ± 0.003
Flemingia
6 weeks 0.46 ±0.009 0.42 ±0.008 0.43 ±0.004 0.44 ±0.007 0.41 ±0.007 0.41 ± 0.009
12 weeks 0.45 ±0.005 0.46 ±0.012 0.42 ±0.001 0.45 ±0.01 0.45 ±0.008 0.41 ± 0.002
Lablab
6 weeks 0.72 ±0.07 0.48 ±0.014 0.48 ±0.016 0.60 ±0.027 0.53 ±0.111 0.47 ±0.026
12 weeks 0.66 ±0.008 0.60 ±0.011 0.48 ±0.026 0.58 ±0.036 0.60 ±0.044 0.46 ± 0.011
Maize
6 weeks 0.86 ±0.037 0.56 ±0.053 0.54 ±0.05 0.96 ±0.133 0.58 ±0.021 0.53 ±0.005
12 weeks 0.84 ±0.078 0.73 ±0.077 0.53 ±0.017 0.92 ±0.061 0.69 ±0.02 0.57 ±0.013
Mucuna
6 weeks 0.71 ±0.031 0.49 ±0.034 0.47 ±0.013 0.57 ±0.012 0.49 ±0.024 0.48 ±0.011
12 weeks 0.70 ±0.049 0.59 ±0.008 0.48 ±0.019 0.64 ±0.034 0.61 ±0.016 0.48 ±0.015
Through the seasons, recovery of 15N in wheat plants from the various residues decreased in
both residue application treatments. In the first season, 15N recovery was similar for 6 and 12
week harvests (with exception of mucuna when placed on surface). Nevertheless, in the
following season the amount of 15N recovery when harvesting at 12 weeks after planting
(WAP) was significant higher than at 6 WAP in all treatments (except in lablab treatment
when placed on surface). In the last season, the significances higher of 15N recovery in plant
were on found in cacao and maize treatments (12 WAP > 6 WAP) when mulched in surface
and in flemingia treatment (6 WAP > 12 WAP) when mixed with soil (Table 4.2).

102
4.3.2. Gas fluxes and net N mineralisation from incubation trial
Over 17 weeks of the incubation, cumulative CO2-C from the flemingia treatment was much
higher than from other treatments, totalling 14325 μg CO2-C kg-1 soil, significantly higher than
the mucuna treatment which produced the lowest the amount (9654 μg CO2-C kg-1 soil).
During the first 4 weeks of incubation, there was a rapid increase of CO2-C flux release from
lablab, maize and mucuna accounting for 69.1%, 73.7 % and 68.2 %, respectively compared
with the total amount of CO2-C flux during treatment. Meanwhile this proportion in cacao and
flemingia was much lower, about 41.7 % and 42.6 %, respectively. After 28 days, the CO2-C
flux cumulative from latter group increased gradually till the end of the trial whereas in the
former group, it kept almost unchanged after 56 days (Figure 4.1).
Figure 4.1. Cummulative CO2-C emissions from added residues in incubation trial. The error
bars represented the least significant difference at p < 0.05 between each treatment of 3
different replications.
When considering the relationship between biochemical characteristics of the residues
(carbohydrate, cellulose, hemicellulose, lignin) and CO2 release, the linear regression was
only found between lignin content and the CO2 release (Figure 4.2). A negative correlation
0
5000
10000
15000
20000
25000
0 20 40 60 80 100 120 140
Cu
mu
lati
ve e
mss
ion
(µ
gCO
2-C
kg-1
so
il)
Day
Cacao Flemingia Lablab Maize Mucuna

103
was observed after 7 days of incubation whereas the positive relationship was found in the
later of the decomposition.
Figure 4.2. The relationship between lignin content and cumulative CO2 emission of different
plant residues at 7 days ( ), 28 days ( ), 56 days ( ) and 119 days ( ).
The net N mineralization was recognised from lablab and mucuna in the beginning of the
incubation. Meanwhile this process was occurred after a short immobilisation (the first week
of trial) in other residues (Figure 4.3). After the first week, the net N mineral from lablab was
the largest, approximately 2.08 mg N kg-1 soil and this was significant difference at P value
<0.05 compared to the net immobilisation following maize (-4.15 mg N kg-1 soil), flemingia (-
6.07 mg N kg-1 soil) and cacao (-4.94 mg N kg-1 soil). Later on, the net N mineralised was
increased in all treatments to the end of trial in which mucuna and lablab was significant
difference to the others (Figure 4.3). Cacao was recognised as the residue having the
slowest mineralisation rate throughout the trial. In general, the percentage of N mineralised
from added residues was increased with increase of biochemical quality based on the lignin
content factor (Table 4.1). After 17 weeks of incubation, it was only about 5.5 % in cacao to
21.2 % in lablab. Mucuna, flemingia and maize was accounted for 18.3, 12.3 and 17.9 %,
respectively.
R² = 0.5384
R² = 0.2873
R² = 0.5115
R² = 0.2759
-100
-50
0
50
100
150
200
250
300
350
400
0 5 10 15 20 25
CO
2-C
flu
x em
issi
on
(u
g/kg
so
il d
ay)
Lignin (%)
7
28
56
119

104
Figure 4.3. Net N mineralisation from added residues in incubation trial. The error bars
represented the least significant difference at p < 0.05 between each treatment of 3 different
replications.
Statistical analysis only found a negative correlation between net N mineralisation and lignin
content and overall C:N ratio of added residues at 7, 21, 70 and 119 days of incubation.
However this relationship was not strong as the R2 values were much lower than 0.5and
better value of determination correlation (R2) was being general observed in the later stages
of decomposition.
4.3.3. Dry matter of wheat plant from different applications and residues quality
In order to evaluate the effect of residue application on dry matter in different of wheat
stages, we found that: the dry matter of wheat plant in different residues application depends
significantly on the characteristics of used residues. It was divided into 2 groups: maize and
cacao group (with slightly higher C:N ratio) and lablab, mucuna and flemingia group (with
slightly lower C:N ratio). In the latter group, when added residues in surface of soil, dry
matter of wheat at 6 WAP was much higher than when incorporated into soil in the first two
seasons. Meanwhile, this number in the third season was higher when mixed residues with
-10
0
10
20
30
40
50
0 20 40 60 80 100 120 140
Net
N m
iner
alis
ed (
mg
N k
g-1 s
oil)
Day
Cacao Flemingia Lablab Maize Mucuna

105
soil than mulched them on the surface. At 12 WAP, the dry matter in treatments incorporated
residues into soil was much lower than that in which residues were laid on the surface in all 3
seasons with exception of mucuna in last season. Nevertheless, this trend was the opposite
of the former group. The dry matter of plant when incorporated residues with soil was much
higher than that when added them on the surface at 6 WAP in first season, but this number
in latter application was higher in next consecutive seasons. This trend at 12 WAP was
almost similar compared with what occurring to the other group with the exception of maize
in first season. In particular, the dry matter of wheat at 6 WAP was about 58.2 g/m2 and 22.3
g/m2 when mixed lablab residue into soil in first two seasons but this number increased to
70.8 g/m2 and 31.2 g/m2 respectively when added this residue on the surface. However, this
figure in latter application in third season was about 16.7 g/m2 compared with 19.9 g/m2 in the
first application. At 12 WAP, the dry matter in mulch application of the same residue type
(lablab) was about 93.5 g/m2, 58.5 g/m2, 45.5 g/m2, statistical significant difference at P value
< 0.05 compared with incorporation application which was about 84.2 g/m2, 57.2 g/m2, 34.9
g/m2, respectively.
In the first season, statistic found a significant difference of dry matter at 6 WAP at level 95%
between treatments two groups. However, this difference was only recognised when
residues were applied in the surface. When mixing residues into, in particular of flemingia
and mucuna, the dry matter of wheat was even lower than maize and this difference was
significant at P value < 0.05 (Figure 4.4b). It occurred similarly when residue was
incorporated into soil (Figure 4.4b). In general, residue application time effected significantly
on plant dry matter either added in the surface or mixed into the soil (Figure 4.4a, 4.4b). In 3
consecutive seasons, the dry matter of wheat plant decreased profoundly as a result of no
further added of residues in following seasons.

106
Figure 4.4. Dry matter of wheat at 6 WAP (▪) and at 12 WAP (□) in g m2-1 of different
treatments from mulched (a) and incorporated (b) application in 3 consecutive seasons. The
error bars represented the standard deviation of 3 different replications of each treatments.
0
20
40
60
80
100
120
140
Cac
ao
Fle
min
gia
Lab
lab
Mai
ze
Mu
cun
a
Cac
ao
Fle
min
gia
Lab
lab
Mai
ze
Mu
cun
a
Cac
ao
Fle
min
gia
Lab
lab
Mai
ze
Mu
cun
a
1 2 3
mulched
g p
er m
2
Season
6 weeks
12 weeks
0
20
40
60
80
100
120
140
Cac
ao
Fle
min
gia
Lab
lab
Mai
ze
Mu
cun
a
Cac
ao
Fle
min
gia
Lab
lab
Mai
ze
Mu
cun
a
Cac
ao
Fle
min
gia
Lab
lab
Mai
ze
Mu
cun
a
1 2 3
incorporated
g p
er m
2
Season
6 weeks
12 weeks
(a)
(b)

107
4.3.4. N recovery from added labelled residues to plant
In general, 15N recovery from added residues was significantly influenced by the harvested
time and the season rather than by residue application when comparing in the same residue.
The amount of 15N recovery in wheat plants at 6 WAP was higher significant than at 12 WAP
either placed residues on the surface or mixed with soil. For instance, in the first season,
over 18% of 15N isotope from labelled lablab was recovered to plant after 6 WAP but this
figure was dropped to 12.9% after 12 WAP when incorporated to the soil. This number when
placed them on the surface was 12.2 % and 9.3 %, respectively. The smallest amount of 15N
recovery was found in cacao residue, about 6.4 % when mixed with soil and 5.8 % when
mulched on surface after 6 WAP. After 12 WAP this figure was about 4.4 % and 2.9%
respectively (Figure 4.5a, 4.5b).
With each crop, 15N measured in the wheat plants decreased. The largest amount of N
recovery from plant residues was recognized in the first season whether applied on the
surface or incorporated into the soil. For example, after 6 WAP in the first season, the total
amount of 15N recovery in almost treatments was almost 50% higher and was significant
difference compared with this amount in following seasons. Meanwhile, the total of N derived
from residues in second season and in third season was almost the same, varied from 2 % to
5.0%. The residues application in general has not influenced on the N recovery, especially in
the last season (Figure 4.5a, 4.5b).
After 3 seasons, we found that the total 15N recovery mainly depended on the residue types
rather than the residue application and harvesting time (Figure 4.6). The highest amount of
total 15N recovery came from lablab residue, approximately 28% when mixed with soil and
about 24% when placed on surface. There was no significant difference when harvesting at 6
WAP or at 12 WAP. The amount of 15N from cacao recovered to plant was the least and was
significant difference compared with other residues types in both residue applications (Figure
4.6). Among numeric of biochemical indicators of added residues such as carbohydrate,
cellulose, hemicellulose and lignin, the total 15N derived from residues was influenced

108
strongly by the lignin content. Statistical analysis found a negative relation between total 15N
recovery and lignin content either at 6 WAP or at 12 WAP (Figure 4.7a, 4.7b).
Figure 4.5. 15N recovery from different added residues to plant in various harvesting time and
residues application in the first season ( ), second season ( ) and third season ( ). The
error bars represented the standard deviation of 3 different replications of each treatment.
0
5
10
15
20
25C
acao
Fle
min
gia
Lab
lab
Mai
ze
Mu
cun
a
Cac
ao
Fle
min
gia
Lab
lab
Mai
ze
Mu
cun
a
6 weeks 12 weeks
mulched
%1
5 Nd
fR
1 2 3
0
5
10
15
20
25
Cac
ao
Fle
min
gia
Lab
lab
Mai
ze
Mu
cun
a
Cac
ao
Fle
min
gia
Lab
lab
Mai
ze
Mu
cun
a
6 weeks 12 weeks
incorporated
%1
5 Nd
fR
1 2 3

109
Figure 4.6. Total 15N recovery from different added residues to plant in different residues
applications at 6 WAP (▪) and at 12 WAP (□).The error bars represented the standard
deviation of 3 different replications of each treatment.
0
5
10
15
20
25
30
35
Cac
ao
Fle
min
gia
Lab
lab
Mai
ze
Mu
cun
a
Cac
ao
Fle
min
gia
Lab
lab
Mai
ze
Mu
cun
a
incorporated mulched
%1
5N
dfR
6 weeks
12 weeks
R² = 0.4967
R² = 0.6623
0
5
10
15
20
25
30
35
0 5 10 15 20 25
Tota
l Nd
rfR
(%
)
Lignin (%)
(a)
6w
12w

110
Figure 4.7. Relationship between total 15N derived from residue and lignin content from
incorporated (a) and mulched (b) application at 6 WAP (◊) and at 12 WAP (□)
4.3.5. Net N mineralisation from different residue types and application
All residue-amended treatments resulted in similar immobilisation of N for the first 6 weeks
either placed them on the surface or mixed with soil (Figure 4.8a, 4.8b). The amount of N
immobilised varied and was significant difference between residues types. The lowest net N
immobilised was found in maize (about 8.1 mg N kg-1 soil) when incorporated with soil and in
cacao (about 9.5 mg N kg-1 soil) when mulched on the surface. The highest amount of net N
immobilised came from mucuna residue when incorporated with soil and from lablab when
placed on the surface, about 1.9 and 0.7 mg N kg-1 soil, respectively. There was almost no
initially significant in other 3 applied residues in two treatments, even though there was a
slightly larger amount of N immobilisation when mixed with soil. It was varied from 3.9 mg N
kg-1 soil in flemingia to 6 mg N kg-1 soil in lablab for incorporation treatment and from 2.4 mg
N kg-1 soil in mucuna to 4.9 mg N kg-1 soil in maize for mulch treatment. After 6 weeks,
following by a short mineralisation of N, the net N immobilisation was mainly dominant in all
added residues when mixed them with soil (Figure 4.8a). In contrast, there was a slightly net
N mineralisation when applied residues on the surface after 12 weeks and this process
maintained till the end of treatment (Figure 4.8b).
R² = 0.601
R² = 0.7607
0
5
10
15
20
25
30
35
0 5 10 15 20 25
Tota
l Nd
rfR
(%
)
Lignin (%)
(b)
6w
12w
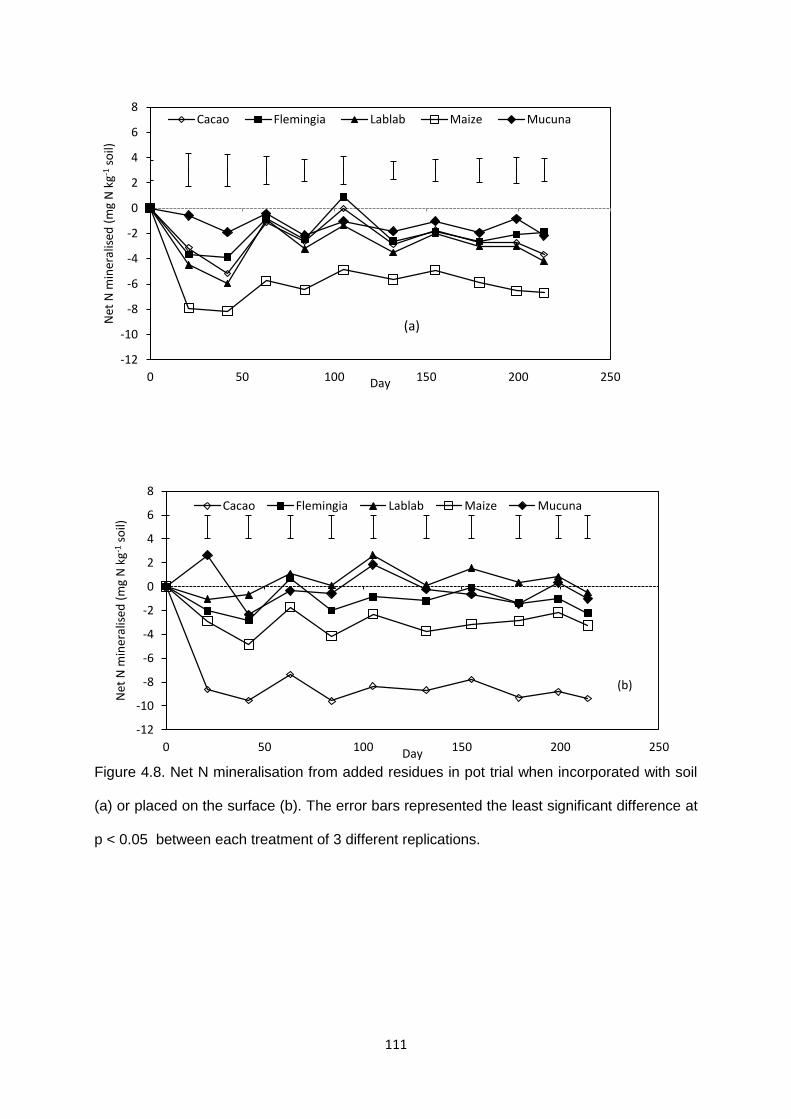
111
Figure 4.8. Net N mineralisation from added residues in pot trial when incorporated with soil
(a) or placed on the surface (b). The error bars represented the least significant difference at
p < 0.05 between each treatment of 3 different replications.
-12
-10
-8
-6
-4
-2
0
2
4
6
8
0 50 100 150 200 250
Net
N m
iner
alis
ed (
mg
N k
g-1 s
oil)
Day
Cacao Flemingia Lablab Maize Mucuna
(a)
-12
-10
-8
-6
-4
-2
0
2
4
6
8
0 50 100 150 200 250
Net
N m
iner
alis
ed (
mg
N k
g-1 s
oil)
Day
(b)
Cacao Flemingia Lablab Maize Mucuna

112
4.4. Discussion
4.4.1. The effect of residue quality on CO2-C emission
The differences in CO2-C emission between five plant residues in this study were largely as
expected according to their quality parameters. Although the residues had similar C:N ratios,
carbohydrate, hemicellulose and lignin concentration varied widely (Table 4.1). The least
CO2 – C emission release was found in higher lignin content group, in this case was in cacao
(lignin content of 22.1%) and in flemingia (lignin content of 20.6%). The group with the lowest
lignin content (lablab, maize and mucuna) resulted in immediate release of CO2–C and
produced almost two thirds of total released quantity of C after 4 weeks of incubation. This
result was consistent with other research which indicated that lignin was one a key
determinant of decomposition rate. Trinsoutrot et al. (2000) found that the kinetics of
decomposition depended closely on the soluble compounds, cellulose and lignin content
rather than the N content of the residue and similarly, Vanlauwe et al. (1996) found a
significantly higher correlation between C mineralisation and both lignin content and C:N
ratio.
4.4.2. N mineralisation/immobilisation in the different conditions
Under incubated conditions, net N mineralisation occurred in all residues after a short time of
immobilisation (the first week) except cacao. In this treatment, net immobilisation persisted to
70 days of the trial (Figure 4.3). Conversely for the pot experiment, , the net N immobilisation
was mainly dominant through the time either placed residues on top or mixed with soil
(Figure 4.8a and 4.8b). The reason led to this could be difference in temperature and
moisture content. These conditions were well controlled as a constant in incubation trial
whereas these conditions were much more difficult to maintain in greenhouse condition. The
effect of temperature and moisture on the plant residue decomposition and soil organic
matter was also mentioned in Tian et al. (2007), Plante et al. (2010), Cookson et al. (2002),
Davidson and Janssens (2006), Leirós et al. (1999). Under laboratory conditions, Cookson et
al. (2002) found a significantly increase of mineral N concentration with increasing

113
temperature in amended soil. Similarly, Leirós et al. (1999) also found the combined effects
of soil moisture and temperature on the mineralisation of organic matter and they could be
estimated by multiple regression. Moreover, Tian et al. (2007) reported that the direct
correlation between decomposition rate of plant residues and moisture availability was only
valid for residues with high quality.
Regarding the effect of residues quality on the N dynamic, the results in this study were
agreement with other authors. Bending et al. (1998) found that the quality components
controlling net N mineralisation changed during decomposition, with water soluble phenolic
and lignin content significantly correlated at early stages, and water soluble N, followed by
cellulose at later stages when carrying out a 6 months trials under controlled condition.
Similar results were also mentioned in Palm and Sanchez (1991), Kumar and Goh (2003),
Chaves et al. (2004), Abiven et al. (2005), Constantinides and Fownes (1994), and Vahdat
et al. (2011). In our study, the amount of net N mineralisation from high quality residues
(indicated by low lignin content in Table 4.1) was always higher than the other groups (Figure
4.3). However, in case of maize residue, even though its lignin content was quite low (4.1%),
the amount of net N mineralisation from this residue was not significantly difference with
flemingia (lignin content about 20.6%). It could be explained due to its high hemicellulose
content. Among 5 different added residues, the hemicellulose of maize was the highest
(34.7%, Table 4.1). Similarly, the biochemical quality of residues also influenced significantly
on the amount of net N immobilisation when mixed or placed on the surface in greenhouse
condition (Figure 4.8a, 4.8b).
Concerning the effect of residue application on the release of N, we found that: the amount of
N decomposition when placed on the surface was slightly higher than that when incorporated
them with soil. Li et al. (2013) suggested that crop residue with low C:N ratio could be
incorporated into soils to immobilise N in comparison with crop residue placed on the soil
surface. Similarly, when discover the effects of 3 different crop residues as wheat, barley and
lupin management on crop residue decomposition, Cookson et al. (1998) found that wheat
from the incorporated treatment had a greatest net N immobilisation in the early stages of

114
decay (0-14 days) and the greatest net N mineralisation in the later stages. Whereas, there
was no significant effects of prior residue management on decomposition of barley and lupin
residues. This residue-specific response to management may be explained by a prior
conditioning of the soil microbial community to wheat straw which has a more recalcitrant
chemical composition such as high lignin content.
4.4.3. Total 15N recovery
Similarly to inorganic N fertilisers, the recovery of N from organic residues varies widely.
Recovery of N from added residues by cereal crops depends significantly on biochemical
characteristics and environment. When examining the recovery of nitrogen by spring barley
following incorporation of 15N labelled straw and catch crop residues in 3 years on field
condition, Thomsen and Jensen (1994) found that the C:N ratio and the lignin content affected
significantly on N recovered. In particular, the first barley crop recovered more ryegrass N than
straw N. The C:N ratio of the former residues in this study was 4 times lesser than the latter
one. The C:N ratio of residues using in our study was not much different but the lignin content
was significantly difference (Table 4.1). This could be the reason to explain why the total 15N
recovery from added residues (Figure 4.6) was much significantly difference between high
lignin content residues (eg. Cacao) and low lignin content residues (eg. lablab and maize). In
Cadisch et al. (1998) study, the authors found a good relationship between legume prunings
quality (especially of protein binding capacity of polyphenol, %N and C:N ratio) and the 15N
labelled recovery in three crop cycles of maize (7 weeks for each cycle). Lignin content in this
case just influenced on N recovery in the second and third crop cycles. The total 15N recovery
by wheat in our study (varied from 10 to 30%) was agreement with Cadisch et al. (1998),
Thomsen (2004), Haynes (1997), Rees et al. (1993) but was relatively higher than report from
Kumar and Goh (2002) and Thomsen (2001). It could be explained due to high quality of plant
residues used in this study and the growth condition. All plant residues used in this study were
grown in greenhouse condition and were harvest at young age. Moreover, this trial was carried
out in pots in greenhouse and then it could provide a more favourable environment for residue
decomposition than in the field. Furthermore, in the pot experiment, root growth was restricted

115
to the volume of soil in which the residues had been applied, and then favouring efficient
recovery of mineral N. Keeping the temperature varied in a small range was also an important
factor to get high N recovery in this study. For instance, the percentage of nitrogen recovery
from manure by barley increased double to triple when applied in spring compared with in
winter (Thomsen, 2004). Similar result was also found in Collins et al. (2007) in which showed
that a warmer growing season led to higher N uptake.
The decrease of N recovery by plant through time was mentioned in several researches.
Kumar and Goh (2002) found a small amount of the residual fertiliser was taken up by wheat
and ryegrass in the first year and was decreased significantly in following years. Similarly
results were also showed in Thomsen and Jensen (1994), Thomsen (2004), Thomsen (2001)
when discovered the N uptake by barley on field condition. This was agreement with our result
in this study in which the N recovery decreased profoundly in the second and the third season
(Figure 4.5a, 4.5b). When carried out trials in pot condition, Cadisch et al. (1998) found a
decrease of cumulative 15N recovery by maize from labelled pruning over three cropping
cycles.
Moreover, in Kumar and Goh (2002) study, the authors did not find any significant influence
between crop residue management practices (ploughed, rotary hoed, mulched or burned) and
the N recovery. It is similar to our study in which no significant difference of total N recovery
after 3 seasons was recognized in different residue application. This could be due to the
experiment condition as it was carried out in close-system, water leaching from the pots was
collected by plates and the re-water and thus the nitrogen lost from residue decomposition was
elimination.
4.5. Conclusion
Finding the primary effect of biochemical quality, especially in the role of lignin content on the
decomposition of various plant residues and nitrogen recovery in this study confirms the

116
hypothesis that different plant residues will lead the dynamic of C and N in soil plant systems
in several ways. Such high quality of residues (in term of low lignin content) decomposes
faster and contributes large amount of initially nutrient in the beginning of plant growth and
the N recovery from these plant residues was much higher than the others. Moreover, the net
N mineralisation/immobilisation was profoundly influenced by the climate condition. In case
of temperature and moisture was kept unchanged (in incubation condition), the net N
mineralisation was main dominant but net immobilisation became main process when these
characteristics could not maintain as a constant in greenhouse condition. In a longer term
where no further plant residues application, the total N recovery decreased significantly
through seasons, most of the total N was recovered in the first season. Furthermore, plant
residues application did not effect on the total N recovery but it impact on N release.
Incorporation plant residues with soil could decrease the loss of N through the mineralisation
processes rather than placement them on the surface.

117
4.6. References
Abiven, S., Recous, S., Reyes, V., and Oliver, R., ‘Mineralisation of C and N from root, stem and leaf
residues in soil and role of their biochemical quality’, Biology and Fertility of Soils, Vol. 42, No. 2, 2005.
Bending, G. D., Turner, M. K., and Burns, I. G., ‘Fate of nitrogen from crop residues as affected by biochemical quality and the microbial biomass’, Soil Biology and Biochemistry, Vol. 30, No. 14, 1998.
Cadisch, G., Handayanto, E., Malama, C., Seyni, F., and Giller, K. E., ‘N recovery from legume prunings and priming effects are governed by the residue quality’, Plant and Soil, Vol. 205, No. 2, 1998.
Chaves, B., Neve, S. de, Hofman, G., Boeckx, P., and van Cleemput, O., ‘Nitrogen mineralization of vegetable root residues and green manures as related to their (bio)chemical composition’, European Journal of Agronomy, Vol. 21, No. 2, 2004.
Collins, H. P., Delgado, J. A., Alva, A. K., and Follett, R. F., ‘Use of Nitrogen-15 Isotopic Techniques to Estimate Nitrogen Cycling from a Mustard Cover Crop to Potatoes’, Agronomy Journal, Vol. 99, No. 1, 2007.
Constantinides, M., and Fownes, J. H., ‘Nitrogen mineralization from leaves and litter of tropical plants: Relationship to nitrogen, lignin and soluble polyphenol concentrations’, Soil Biology and Biochemistry, Vol. 26, No. 1, 1994.
Cookson, W. R., Beare, M. H., and Wilson, P. E., ‘Effects of prior crop residue management on microbial properties and crop residue decomposition’, Applied Soil Ecology, Vol. 7, No. 2, 1998.
Cookson, W. R., Cornforth, I. S., and Rowarth, J. S., ‘Winter soil temperature (2–15 °C) effects on nitrogen transformations in clover green manure amended or unamended soils; a laboratory and field study’, Soil Biology and Biochemistry, Vol. 34, No. 10, 2002.
Davidson, E. A., and Janssens, I. A., ‘Temperature sensitivity of soil carbon decomposition and feedbacks to climate change’, Nature, Vol. 440, No. 7081, 2006.
Fox, R. H., Myers, R. J. K., and Vallis, I., ‘The nitrogen mineralization rate of legume residues in soil as influenced by their polyphenol, lignin, and nitrogen contents’, Plant and Soil, Vol. 129, No. 2, 1990.
Giacomini, S., Machet, J., Boizard, H., and Recous, S., ‘Dynamics and recovery of fertilizer 15N in soil and winter wheat crop under minimum versus conventional tillage’, Soil and Tillage Research, Vol. 108, 1-2, 2010.
Handayanto, E., Cadisch, G., and Giller, K. E., ‘Nitrogen release from prunings of legume hedgerow trees in relation to quality of the prunings and incubation method’, Plant and Soil, Vol. 160, No. 2, 1994.
Haynes, R. J., ‘Fate and recovery of 15N derived from grass/clover residues when incorporated into a soil and cropped with spring or winter wheat for two succeeding seasons’, Biology and Fertility of Soils, Vol. 25, No. 2, 1997.
Holbeck, B., Amelung, W., Wolf, A., Südekum, K.-H., Schloter, M., and Welp, G., ‘Recoveries of 15N-labelled fertilizers (chicken manure, mushroom compost and potassium nitrate) in arable topsoil after autumn application to winter cover crops’, Soil and Tillage Research, Vol. 130, 2013.
Kumar, K., and Goh, K., ‘Recovery of 15N-labelled fertilizer applied to winter wheat and perennial ryegrass crops and residual 15N recovery by succeeding wheat crops under different crop residue management practices’, Nutrient Cycling in Agroecosystems, Vol. 62, No. 2, 2002.
Kumar, K., and Goh, K. M., ‘Nitrogen Release from Crop Residues and Organic Amendments as Affected by Biochemical Composition’, Communications in Soil Science and Plant Analysis, Vol. 34, 17-18, 2003.
Leirós, M. C., Trasar-Cepeda, C., Seoane, S., and Gil-Sotres, F., ‘Dependence of mineralization of soil organic matter on temperature and moisture’, Soil Biology and Biochemistry, Vol. 31, No. 3, 1999.

118
Li, L.-J., Han, X.-Z., You, M.-Y., Yuan, Y.-R., Ding, X.-L., and Qiao, Y.-F., ‘Carbon and nitrogen mineralization patterns of two contrasting crop residues in a Mollisol: Effects of residue type and placement in soils’, European Journal of Soil Biology, Vol. 54, 2013.
Matejovic, I., ‘Determination of carbon and nitrogen in samples of various soils by the dry combustion’, Communications in Soil Science and Plant Analysis, Vol. 28, 17-18, 1997.
Palm, C. A., and Sanchez, P. A., ‘Nitrogen release from the leaves of some tropical legumes as affected by their lignin and polyphenolic contents’, Soil Biology and Biochemistry, Vol. 23, No. 1, 1991.
Plante, A. F., Conant, R. T., Carlson, J., Greenwood, R., Shulman, J. M., Haddix, M. L., and Paul, E. A., ‘Decomposition temperature sensitivity of isolated soil organic matter fractions’, Soil Biology and Biochemistry, Vol. 42, No. 11, 2010.
Rees, R. M., Yan, L., and Ferguson, M., ‘The release and plant uptake of nitrogen from some plant and animal manures’, Biology and Fertility of Soils, Vol. 15, No. 4, 1993
Sisworo, W., Mitrosuhardjo, M. M., Rasjid, H., and Myers, R. J. K., ‘The relative roles of N fixation, fertilizer, crop residues and soil in supplying N in multiple cropping systems in a humid, tropical upland cropping system’, Plant and Soil, Vol. 121, No. 1, 1990.
Thomsen, I. K., ‘Recovery of nitrogen from composted and anaerobically stored manure labelled with 15N’, European Journal of Agronomy, Vol. 15, No. 1, 2001.
Thomsen, I. K., ‘Nitrogen Use Efficiency of N-labeled Poultry Manure’, Soil Science Society of America Journal, Vol. 68, No. 2, 2004.
Thomsen, I. K., and Christensen, B. T., ‘Fertilizer 15N recovery in cereal crops and soil under shallow tillage’, Soil and Tillage Research, Vol. 97, No. 1, 2007.
Thomsen, I. K., and Jensen, E. S., ‘Recovery of nitrogen by spring barley following incorporation of 15N-labelled straw and catch crop material’, Agriculture, Ecosystems & Environment, Vol. 49, No. 2, 1994.
Tian, G., Badejo, M. A., Okoh, A. I., Ishida, F., Kolawole, G. O., Hayashi, Y., and Salako, F. K., ‘Effects of residue quality and climate on plant residue decomposition and nutrient release along the transect from humid forest to Sahel of West Africa’, Biogeochemistry, Vol. 86, No. 2, 2007.
Trinsoutrot, I., Recous, S., Mary, B., and NICOLARDOT, B., ‘C and N fluxes of decomposing 13C and 15N Brassica napus L.: effects of residue composition and N content’, Soil Biology and Biochemistry, Vol. 32, 11–12, 2000.
Vahdat, E., Nourbakhsh, F., and Basiri, M., ‘Lignin content of range plant residues controls N mineralization in soil’, European Journal of Soil Biology, Vol. 47, No. 4, 2011.
Vanlauwe, B., Nwoke, O. C., Sanginga, N., and Merckx, R., ‘Impact of residue quality on the C and N mineralization of leaf and root residues of three agroforestry species’, Plant and Soil, Vol. 183, No. 2, 1996.
WILLIAMS, R. F., ‘The Physiology of Plant Growth with Special Reference to the Concept of Net Assimilation Rate’, Annals of Botany, Vol. 10, No. 1, 1946.

119
Chapter 5. General discussion and conclusion
5.1. General discussion
The overall goal of this study was to explore the decomposition processes of various plant
residues from cereal crops, legumes crops to perennial crops under controlled conditions.
The research work was focused mainly on measuring and modelling C and N release from
added residues in different experimental conditions.
5.1.1. Residue quality and decomposition
Application of organic matter plays a critical role in the productivity of most small farming
systems in the tropics by providing nutrients availability in short term and substrates for the
maintenance and synthesis of soil organic matter in long term. In the last two decades,
research on plant residues decomposition and the relationship between plant litter quality
and decomposition has been carried out and published widely either in laboratory scale or on
field scale. From these studies, at least two general paradigms have emerged. First, the C:N
ratio or the N concentration of the plant residue is accepted as a general index of quality
(Seneviratne, 2000, Trinsoutrot et al., 2000a): mineralisation rates tend to decrease with
increasing C:N ratio. Second, lignin is considered as a natural recalcitrant which exerts a
control on the overall biodegradability of plant residue in soil (Vahdat et al., 2011) and
contributes to the recalcitrance of plant litter to decomposition by occluding more easily
decomposable polysaccharides. Furthermore, Tian et al. (1995) developed an equation to
calculate a plant residue quality index (PRQI) in the sub and humid tropics by using the C:N
ratio and lignin and polyphenol concentration of plant residues. After testing with 18 different
plant species, authors suggested that the PRQI could be used as a tool for projecting rates of
plant residue decomposition. Physical components of litter quality have received somewhat
less attention in research on litter quality. Recent research has shown that particle size and
surface area to mass characteristics can markedly affect decomposition rates (Angers and
Recous, 1997, Li et al., 2013).

120
As presented in chapter 2, decomposition processes of various added residues were related
to soil type and to their biochemical quality. The C mineralisation faster was recognised in
soil having higher OC content. The rapidly evolution of C from residues (about 50% in the
first 7 days of incubation from the clay soils) could be taken into consideration of residue
practice management on the field. For example, high decomposition rate from lower C:N
ratio and low lignin content suggests an option of using residue for nutrient supply or for
enrichment soil quality. Another important finding was that the at C:N ratio lower than 27, N
mineralisation was mainly dominance. Residue management practice also plays an
important role in decomposing of residues. Mulching practice could enhance the amount of
CO2 procedure than incorporation management. Moreover, residue quality also plays a
dominant role in the recovery of nitrogen to plant, especially the lignin content (chapter 4). A
statistical analysis showed a negative correlation between total nitrogen recovery and lignin
content with relatively high of R2 (varied from 0.5 to 0.75). Without addition of residue, the N
derived from residues significantly decline through seasons after 7 months of experiment.
The Organic Resource Database (ORD) which contains information on organic resource
quality parameters including macronutrient, lignin and polyphenol contents of fresh leaves,
litter, stems and/or roots from almost 300 species found in tropical ecosystems has been
established by Palm et al. (2001a). Through comparative review of the data, an attempt to
quantitatively define high and low quality organic matter materials as they impact to nitrogen
release has been proposed. Based on these critical values, a simple decision tree for
biomass transfer of plant residues for soil fertility management has been suggested (Figure
5.1). It could be used for testing the contribution of different organic materials categories
(Table 5.1) on nutrient availability in soil in short term or the effect of organic resource quality
on soil organic matter maintenance and composition. The findings in our study once again
convinced the possibility of application of results representing in Figure 5.1 and Table 5.1
into the realistic, especially in low input farming systems. The residues with N content lower
than 2.5 and C:N ratio higher than 27 in almost cases decomposed slowly and therefore their
role in nutrient contribution to plant was not so important in short term. However, if their lignin

121
content was low (for example in lablab residues in chapter 2, lignin content was about 7%)
could be taken into consideration as a nutrient supply in short term as it decomposed fast.
Figure 5.1. Decision tree of plant residues application as determined by their litter quality
(adapted from Palm et al., 2001a)
Table 5.1. Different categories of organic materials based on biochemical quality and their
effects on nitrogen supply and soil organic matter (adapted from Palm et al., 2001b)
Categories Parameters (g kg-1) Nitrogen availability Soil organic matter formation
High quality N>25, lignin<150, polyphenol < 40
High and immediate Little or negative effect on total SOM, increased active pool (soil microbial biomass
Intermediate-High quality
N>25, lignin > 150, polyphenol > 40
Delayed, short or long term
Increased particulate and passive pools in SOM
Intermediate-Low quality
N<25, lignin <150, polyphenol < 40
Low and short term immobilization
Little effect on total SOM
Low quality N<25, lignin > 150, polyphenol > 40
Very low and possible long term immobilization
Increased particulate and passive pools.
5.1.2. Potential application of soil organic matter models
Integration of plant litter decomposition into soil – plant ecosystem models has been used
widely elsewhere. The model has been successfully applied to representing the nitrogen
mineralization from common crop residues (cereals and legumes) based on the overall C:N
No
Yes
Lignin < 15%
Lignin < 15% Phenol < 4%
Yes
No
Yes
No
Input of plant residues
%N > 2.5
Decision
use
Decision
use
Decision
use
Decision
use
Incorporate directly with
annual crops
Mix with fertiliser of add
to compost
Surface apply for control soil erosion and water conservation
Mix with fertilizer or
high quality materials

122
ratio (Trinsoutrot et al., 2000b). However they could not be able to represent the more
complex pattern of mineralisation/immobilization when residues decompose slower than
what their C:N suggests. In order to capture these patterns, the organic matter input needs to
be divided as comprising discrete fractions that differ not only their decomposition rates but
also in their biochemical component (such as carbohydrate, cellulose and lignin contents).
In almost soil organic matter (SOM) models, plant residues incorporated to soil is usually
represented by two or more pools depending on its decomposition rate. Kinetically defined
pools are conceptual substrate fractions that are determined by fitting the decomposition
model to experimental data on substrate. However, most of the conceptual pools in all
current SOM models do not correspond directly with experimentally measurable fractions of
SOM. For example in Probert et al. (2005), even though the authors achieved some success
in simulating the different patterns of N mineralization from various organic manures and
feeds by using SOILN model, it remained a challenge to know how appropriate parameters
should be selected and how to derive these values from literature. Within 3 different fresh
organic matter (FOM) pools, an individual fitting procedure was applied for at least 2
parameters to give a goodness of fit between simulated N mineralisation and measured data.
In chapter 3, the pools´ size of FOM could be measured in laboratory by Van Soest method
and this fraction was maintained during processes. However, the distribution of N in 3
FPOOLs (the C:N ratio in each FPOOLs) (Table 3.1) needed to be adjusted to get better
represent of model. The obtained values of these parameters used in chapter 3 were in good
agreement with those in Probert et al. (2005), except those in the residues dactyladenia
roots (#11), rape seed stems (#14) and rape seed wall pods (#15) (Table 3.1). Moreover, in
order to get better fit, using default values for some essential parameters was not
appropriate. Therefore, sensitivity analysis was tested under available dataset from residues
of C and N mineralisation in some parameters such as fraction of biomass C mineralized
retained in system (ef_biom), fraction of humus C mineralized retained in system (ef_hum),
fraction of retained biomass C returned to biomass (fr_biom_biom), and fraction of retained
FOM C transferred to biomass (fr_fom_biom). The performance of SOILN using modified

123
parameters simulated well the kinetics of C and N from various residue types (C:N ratio from
9 to 150). The model could be also predicted well for high residues quality (in term of C:N
ratio lower than 27) even in very poor soil nutrient.
A new approach to replace the conceptual pools in order to reduce uncertainty related to
model initialization was presented in Luo et al. (2014). In this study, the conceptual SOM
pools were transformation to measured SOM pools. Instead of dividing FOM pool into 3
different pools, a new framework model divided FOM into 2 different pools: particulate
organic matter (POM) and difference between FOM and POM (DPM). However, changes in
SOM pools require new calibration of the potential decomposition rates for each new pool.
Under the measured SOM pools model, decomposition rate of POM (dPOM) and HOM (humic
SOM) (dHOM) was allowed to vary depended on the research site (for example, the coefficient
of variation of dPOM and dHOM was about 18 and 69%, respectively) and they were much lower
than default values in the original model (which were used in chapter 3). With these
modifications, the model got some success in prediction the variation in observed total soil
organic carbon and the dynamics of the measured soil organic carbon at the three sites in
Australia. However, soil nitrogen in this model was overestimated. Therefore, in order to
increase the accuracy of simulation carbon and nitrogen dynamics by SOILN either in the
original model Probert et al. (1998) or in new approach Luo et al. (2014), the understanding
the different patterns of SOM pools, particularly their C:N ratio and the distribution of C and N
in different sub-pools, the mechanisms controlling their decomposition and transformation
among different pools are needed to be considered.
5.2. Conclusions and recommendations
5.2.1. Conclusions
Finding the primary effect of residue quality, especially of lignin content on the
decomposition of various plant residues and nitrogen recovery in this study confirms

124
the hypothesis that such quality indicators can be used to understand C and N
dynamics in soil plant systems.
Mulching practice could promote the processes of residue breakdown in soil. In a
longer term, incorporation plant residues with soil could decrease the loss of N
through the mineralisation processes rather than placement them on the surface.
Decomposition processes of diverse plant residues also depended significantly on
soil organic carbon content, soil texture. Faster C and N mineralisation was
recognised in soil having higher OC content. Moreover, soil that consists of more
sandy particles releases less CO2 and nitrogen than high clay content soil.
When evaluating the performance of SOILN module by using 4 independent datasets,
we found that: the distribution of nitrogen in different FPOOLs of fresh organic matter
profoundly influenced on the prediction of nitrogen release from the model. Therefore,
it is very important to modified fraction of nitrogen in each FPOOLs to get better
goodness of fit from the model. Whereas this modification did not effect on release of
CO2. The model could also capture well the C mineralisation from residue when only
modified the distribution of C in each FPOOLs.
Available nitrogen content in soil influenced significantly on the performance of the
model. For low residues quality, the modified model did not perform well in very poor
nutrient in soil.
5.2.2. Suggestions for future research related to the findings of this thesis.
Learning from the research limitation, some corresponding suggestions are recommended
for future work on the topic as follows:
As far as the decomposition processes of plant residues are strongly influenced by
the environmental conditions such as temperature and soil moisture, soil organisms’
activities…. further examinations on kinetics of decomposition from several of plant

125
species need to be carried out on field conditions under different climate regions to
get better understand of these processes.
The sensitivity of some initial parameters used in this study also takes into
consideration when evaluating the model performance under various environmental
conditions and residue practice management.
The N availability in soil need to be taken into consideration when testing the effect of
soil types on the dynamics of C and N from plant residues.
We did not analyzed the N derived from plant residues to soil and the amount of N
denitrification from the systems to the air, therefore these processes also need to be
examined in order to get better understand of N cycle in soil – plant systems.

126
5.3. References
Angers, D., and Recous, S., ‘Decomposition of wheat straw and rye residues as affected by
particle size’, Plant and Soil, Vol. 189, No. 2, 1997. Kögel-Knabner, I., ‘13C and 15N NMR spectroscopy as a tool in soil organic matter studies’,
NMR in Soil Science, Vol. 80, 3–4, 1997. Li, L.-J., Han, X.-Z., You, M.-Y., Yuan, Y.-R., Ding, X.-L., and Qiao, Y.-F., ‘Carbon and
nitrogen mineralization patterns of two contrasting crop residues in a Mollisol: Effects of residue type and placement in soils’, European Journal of Soil Biology, Vol. 54, 2013.
Luo, Z., Wang, E., Fillery, I. R., Macdonald, L. M., Huth, N., and Baldock, J., ‘Modelling soil carbon and nitrogen dynamics using measurable and conceptual soil organic matter pools in APSIM’, Agriculture, Ecosystems & Environment, Vol. 186, 2014.
Palm, C. A., Gachengo, C. N., Delve, R. J., Cadisch, G., and Giller, K. E., ‘Organic inputs for soil fertility management in tropical agroecosystems: application of an organic resource database’, Agriculture, Ecosystems & Environment, Vol. 83, 1–2, 2001a.
Palm, C. A., Giller, K. E., Mafongoya, P. L., and Swift, M. J., ‘Management of organic matter in the tropics: translating theory into practice’, in C. Martius, H. Tiessen and P. L. G. Vlek (eds.), Managing Organic Matter in Tropical Soils: Scope and Limitations: Proceedings of a Workshop organized by the Center for Development Research at the University of Bonn (ZEF Bonn) — Germany, 7–10 June, 1999, Springer Netherlands, 2001b.
Probert, M. E., Dimes, J. P., Keating, B. A., Dalal, R. C., and Strong, W. M., ‘APSIM's water and nitrogen modules and simulation of the dynamics of water and nitrogen in fallow systems’, Agricultural Systems, Vol. 56, No. 1, 1998.
Probert, M., Delve, R., Kimani, S., and Dimes, J., ‘Modelling nitrogen mineralization from manures: representing quality aspects by varying C:N ratio of sub-pools’, Soil Biology and Biochemistry, Vol. 37, No. 2, 2005.
Seneviratne, G., ‘Litter quality and nitrogen release in tropical agriculture: a synthesis’, Biology and Fertility of Soils, Vol. 31, No. 1.
Tian, G., Brussaard, L., and Kang, B. T., ‘An index for assessing the quality of plant residues and evaluating their effects on soil and crop in the (sub-) humid tropics’, Applied Soil Ecology, Vol. 2, No. 1, 1995.
Trinsoutrot, I., Recous, S., Bentz, B., Line`res, M., Che`neby, D., and NICOLARDOT, B., ‘Biochemical Quality of Crop Residues and Carbon and Nitrogen Mineralization Kinetics under Nonlimiting Nitrogen Conditions’, Soil Sci. Soc. Am. J, Vol. 64, No. 3, 2000a.
Trinsoutrot, I., Recous, S., Mary, B., and NICOLARDOT, B., ‘C and N fluxes of decomposing 13C and 15N Brassica napus L.: effects of residue composition and N content’, Soil Biology and Biochemistry, Vol. 32, 11–12, 2000b.
Vahdat, E., Nourbakhsh, F., and Basiri, M., ‘Lignin content of range plant residues controls N mineralization in soil’, European Journal of Soil Biology, Vol. 47, No. 4, 2011.

127
Summary
Nutrient cycling in the soil – plant ecosystem is an essential component of sustainable
productive agricultural activities. Although during the last 20 years inorganic fertilizer have
played a dominant role of nutrient supply source for plant growth, plant residues also play an
important role, especially in low agricultural farming systems in developing countries.
Understanding the dynamics of soil organic matter which is mainly added from plant residues
plays an important role to face with several issues of both environmental and agricultural
aspects. The aim of this dissertation is to explore the kinetics of carbon and nitrogen
mineralization from diverse plant residues and to evaluate the performance of soil organic
matter model in capturing these processes. Several plant residue species such as cereal
crops, legumes crops to perennial crops were used under short-term experiments in closed
chambers incubation in laboratory and pots in greenhouse. Furthermore, integration of plant
litter decomposition into soil – plant ecosystem models has been used widely and applied
successfully in some common crop residues (cereals and legumes). One of the most
applicable models has been the SOILN in APSIM (Agricultural Production Systems
Simulator) framework, which has been tested successfully in diverse plant residue to
represent the decomposition of organic input, and the influence of residues quality on
nitrogen release in different climate conditions of various organic materials and soil types.
In order to evaluate the effect of residue quality on C and N dynamics in soils under
controlled conditions, eight different plan residues with overall C:N ratio varied from 9 to 70
was tested on 3 different soil types (chapter 2). Plant residues using in this study differed in
species (legumes crop like mucuna, pea, lablab, lucerne; cereal crops like wheat and maize;
energy crop like canola), plant organs, and growth condition. These materials were used in 3
different incubation trials at 25°C in 60-75% of water holding capacity from 63 days to 126
days. Decomposition processes of various plant residues in this study were driven mainly by
their quality and soil types rather than by residues practice management. Higher production of
CO2 release was recognized in low C:N ratio, small lignin content in high soil organic carbon

128
content. Moreover, the CO2 release increased rapidly in the first 4 weeks of incubation and
reached around 40% to three fourths of total C mineralized, especial in very poor nutrient soil
(Podsol, N% = 0.012) it reached up to 50% only in the first weeks. In all 3 soil types, a
positively related was found between the net C release from added residues and the
concentration of organic matter in soil. The net N mineralized from plant residues profoundly
influenced by the concentration of mineral N in soil and the residue quality. When applying the
same residue type, the larger amount of net N min was found in sandy soil with low N
concentration (7 mg N kg-1 soil) compared with clay soil (30 mg N kg-1 soil). Furthermore,
residues with overall C:N ratio lower than 27 resulted a net mineralisation and the net
immobilization occurred in residues having overall C:N ratio higher than this value.
In chapter 3, the APSIM’s SOILN model (version 7.5, http://www.apsim.info/) was used to
predict the kinetics of C and N mineralisation of plant residues from 3 independent dataset.
New parameters used for model performance were obtained as following steps: (1) changing
FPOOLs size based on measured data from default values as 0.2 : 0.7 : 0.1; (2) allowing the
C:N ratios in each FPOOL vary, depending on N content which was determined by
optimization; (3) the proportion of the C decomposed from FOM pool that could be retained
in the system based on biochemical quality of residues; (4) the proportion of the C
decomposed from BIOM and HUM pools retained in the system based on soil characteristics;
(5) re-formulation the fraction of retained biomass returned to biomass; (6) re-formulation the
fraction of retained FOM transferred to biomass. With these modifications, the model was
able to provide reasonable estimates of both C and N release from a wide range of plant
residues (C:N ratio varied from 9 to 148). Moreover, the available nitrogen content in soil
influenced significantly on the performance of the model. However, for low residues quality,
the modified model could not perform well in very poor nutrient in soil.
In the last chapter, five different 15N labelled plant residues from legumes crops (lablab,
flemingia and mucuna), cereal crop (maize) and perennial crop (cacao) were used discover
the effect of biochemical quality of added residues, the methods of application and season
on the N recovery in a long term experiment in pot trial in greenhouse condition and

129
examined the decomposition processes of those residues in incubation condition. In
greenhouse condition, the net N immobilization was mainly dominant during 7 months of
experiment either placed residues on the surface or mixed them with soil. Conversely for the
incubation trial, net N mineralisation occurred in all residues after a short time of immobilization
(1 week) except cacao in which net immobilization persisted until 70 days. The differences in
CO2-C emission between five plant residues in incubation study were largely as expected
according to their quality parameters. For example, the cumulative CO2-C emission from
cacao and flemingia (lignin content over 20%) accounted for over 40% during 4 weeks of
incubation but this figure increased to around 70% in lablab, maize and mucuna (lignin content
less than 10%) eventhough these residues had similar C:N ratios. The residue quality also
strongly influenced on the total N recovery to plant. Statistical analysis found a negative
relationship between total 15N recovery and lignin content after 7 months under greenhouse
condition with relatively high of coefficient determination (R2 > 0.5). Furthermore, 15N recovery
from added residues was significantly influenced by the harvested time and the season
rather than by residue application when comparing in the same residue. The amount of 15N
recovery in wheat plants at 6 WAP was higher significant than at 12 WAP either placed
residues on the surface or mixed with soil. The largest amount of N recovery from plan
residues was recognised in the first season and drop suddenly in next following seasons.
The residues application in general has not influenced on the N recovery, especially in
controlled conditions.

130
Acknowledgements
I would like to express my sincere gratitude to my supervisor Prof. Dr. Anthony Whitbread,
formerly head of division “Crop Production Systems in the Tropics”, now with ICRISAT in
India, for his patient guidance and enthusiastic encouragement. I have particularly
appreciated his willingness to give his time so generously to support me, from the planning to
the development and accomplishment of this work. I am deeply thankful for his
understanding and encouragement when I got married and had a baby in the last two years
of the study and sometimes I did not follow his trace on time. Without my priceless mentor, I
would never have finished my dissertation.
I would also like to thank Prof. Dr. Klaus Dittert (Institute of Applied Plant Nutrient) and Dr.
Marife Corre (Soil Science of Tropical and Subtropical Ecosystems) for being the second and
third examiner of my oral examination, respectively. Special thanks to Dr. John Hargreaves
(CRISO) for his training and supporting me in understanding of APSIM modelling, Prof. Dr.
Jürgen Hummel and Dr. Tobias Gorniak from Ruminant Nutrition Group for their help in fibre
analysis and Dr. Norman Loftfield from Soil Science of Temperate and Boreal Ecosystems
for his help in gases measurement. Many thanks also to Dr. Sara Hueso Martos and
Seshuhla Rebinah Sasa for their help in arrangement incubation trial, collecting data and
samples analyzing.
I wish to thank the staff of the Crop Production Systems in the Tropics (Dr. Ronald Kühne,
Dr. Martin Worbes, Dr. Esther Fichtler, Heike Francoli, Birgitt Bode, Ute Fürchtenicht,
Thomas Österreich) for their valuable assistance in technical issues, lab, and greenhouse
as well as their sharing and supporting during the approximately four years. Also thanks to
my PhD colleagues: Munir, Anne, Ami, Gabriel, William.
I am very thankful to the Vietnamese International Education Development (VIED) – Ministry
of Education and Training of Vietnam for the funding granted for my Ph.D. Program in
Göttingen, Germany.
I wish to acknowledge the forward-looking support and my many colleagues at the Hue
University of Agriculture and Forestry, Vietnam, and also my dear friends in Göttingen and in
Vietnam for their support and encouragement throughout my Ph.D. journey.
I am also incredibly grateful to my family: my parents, my brothers and sisters, my father-
in-law, and my wife’s family. My deepest thanks are given to my wife, Nguyen Thi Hong
Trinh, who has travelled countless times up and down from Hamburg to Göttingen and her
help and care not only for our little daughter but for me as well.
131
Publications
I. Paper
1. Nguyen Trung Hai et al. (2010). Development of Viet Nam coffee industry in recent
years. Ecological Economic Journal, vol 36, 2010, p90 – 96.
2. Nguyen Trung Hai et al. (2010). Study on Chemical characteristics of Alluvial soil
growing leaf vegetables at Huong Tra district, Thua Thien Hue province. Journal of
Agriculture and Rural Development, vol 153, 2010, p27 – 31.
3. Nguyen Trung Hai (2010). Effect of various ferrous components on rice growth
and soil characteristics on sandy soil at Thua Thien Hue. Summary record of scientific
research, vol 1, Hue university of Agriculture and Forestry.
II. Proceeding and poster presentation
1. Nguyen Trung Hai, M.E. Probert, A.M. Whitbread (2014). Modeling carbon and
nitrogen mineralisation from diverse crop residues measured from incubation. Poster
presentation at 20th World Congress of Soil Science, ‘’Soils Embrace life and Universe’’, Jeju,
Korea 2014
2. Nguyen Trung Hai, Rebina S. Sasa, Vadakattu V.S.R Gupta, A.M. Whitbread
(2012). Measuring and Modelling the Decomposition Dynamics of Diverse Crop. Poster
presentation at Tropentag conference in Goettingen University from 19-21 Sep 2012
“Resilience of agricultural systems against crises”.

132
Curriculum Vitae
Personal information:
Name: NGUYEN TRUNG HAI
Day of birth: 17.10.1984
Place of birth: Thua Thien Hue, Viet Nam
Nationality: Vietnamese
Educational background:
December 2011 – May 2016: Georg – August – Universität Göttingen
PhD student at Crop Production Systems in the Tropics, Faculty of Agricultural
Sciences.
Topic: Measuring and modelling the dynamics of carbon and nitrogen mineralization from diverse plant residues in soil – plant systems
Degree: Doctor scientiarum agrariarum (Dr. sc. agr.)
Funding: MOET scholarship
September 2006 - September 2008: Hue University of Agriculture and Forestry
Master student at Agronomy Faculty.
Topic: The correlation between Iron and Phosphorus on coastal sandy soils at Thua
Thien Hue province, Vietnam
Degree: Master of Applied Science in Agriculture
September 2002 - June 2006: Hue University of Agriculture and Forestry
Undergraduate student at Agronomy Faculty
Topic: Study on growth and development characteristics of high quality rice groups on
Alluvial soil at Thua Thien Hue province in winter-spring season.
Degree: Bachelor
September 1999 to June 2002: Aluoi High school, Thua Thien Hue province.
Degree: High school Diploma
Job experience:
2008-2011: Lecturer at Faculty of Land Resources and Agricultural Environment, Hue
University of Agriculture and Forestry
2007- 2008: Teaching assistant at Faculty of Land Resources and Agricultural Environment,
Hue University of Agriculture and Forestry

133
Declarations
1. I, hereby, declare that this Ph.D. dissertation has not been presented to any other
examining body either in its present or a similar form. Furthermore, I also affirm that I have
not applied for a Ph.D. at any other higher school of education.
Göttingen, ...............................
................................................................................................................. (Signature) ................................................................................................................. (Name in block capitals)
2. I, hereby, solemnly declare that this dissertation was undertaken independently and
without any unauthorised aid.
Göttingen,..........................................
................................................................................................................. (Signature) ................................................................................................................. (Name in block capitals)