Embed Size (px)
Citation preview
G44
1PROCEEDINGS ICAS VII Seventh International Conference on Agricultural Statistics I Rome 24-26 October 2016
Measuring Area, Yield and Production of Vegetable Crops
Naman KEITA, Senior Statistician, Food and Agriculture Organisation of the United Nations
Viale delle Terme di Caracalla
00153 Rome, Italy
E-mail: [email protected];
Eloi OUEDRAOGO, Senior Statistician, Food and Agriculture Organisation of the United Nations
2, Gamal Abdul Nasser Road
Accra, Ghana
E-mail: [email protected];
Ulrich E. NYAMSI. Statistician Consultant, Food and Agriculture Organisation of the United
Nations
2, Gamal Abdul Nasser Road
Accra, Ghana
E-mail: [email protected].
DOI: 10.1481/icasVII.2016.g44d
ABSTRACT
The horticulture subsector is among the fastest growing agricultural sub-sectors in most Sub-
Saharan African countries. Compared to traditional field crops, horticultural crops (or vegetable
crops) exhibit several advantages that make them attractive to farmers, both commercial and
subsistence. Vegetable crops contribute significantly to food security and income generation for a
large segment of the population, particularly women. The growth of this sector can also contribute
to the reduction of rising unemployment levels in both urban and rural sectors. In recent years, the
horticulture industry has become a noticeable earner of foreign exchange; in fact, some of the
horticultural crops provide a viable option for diversification hence widening a country's export
base.
However, despite this importance, vegetable crop cultivation has been one of the least
statistically explored sectors in many African countries. The quantity of vegetable crops produced
each year is largely unknown in most countries. There are a number of country experiences or
G44
2PROCEEDINGS ICAS VII Seventh International Conference on Agricultural Statistics I Rome 24-26 October 2016
isolated studies and surveys on the estimation of vegetables and fruits, but since vegetable crops are
often outside of the traditional scope of agricultural surveys and censuses, there is no consolidated
and internationally validated estimation methodology.
The survey approach for the estimation of area and production is a challenge due to the large
variety of vegetable crops. Issues to be taken into account in horticulture crop production
estimate methodologies include (iii) Plant phenology, cultivation and harvesting techniques, (iv)
implying crop area and yield measurement issues (i) no normalised concepts and definitions for
horticulture crops; (ii) Sampling frame and sampling design.
Therefore, there is a need to develop adequate methodologies to estimate vegetables crops
areas, yields and production. The purpose of this paper is to propose a consolidated
methodology for estimating vegetable crops area, yield and production addressing the main
methodological issues and taking into account lessons learnt from past experiences, from country
practices and analysis of data from case studies in pilot countries in the context of African
countries. The paper will build on a technical paper prepared in the framework of the Research
Programme of the Global Strategy to Improve Agricultural and Rural Statistics.
Keywords: Vegetables, Production, Estimates.
1. Background
Accurate statistics on vegetable crop area and yield and production regularly released
and communicated to the public must play an important role in planning and allocating resources
for the development of the agriculture sector and food security in Africa. Reliable and timely
information on vegetable cultivation is of vital importance to planners and policy makers including
governments for planning the development of the sector, private companies for important
decision-making related to products purchase, storage, distribution, import, export and other related
issues.
The challenges for getting accurate estimates on vegetable crop production are not the same for
different regions and countries around the world. In developed countries where vegetable holdings
are keeping management records and area planted, production, yield, input are registered, the
survey or census for estimating vegetable production remain sampling issues, the variable to be
recorded are easy to get from the holders. In countries where value chain is well organized and the
bulk of vegetable crop production are commercialised through a well-known limited number of
markets, the estimates can be obtained through administrative sources related to market data. Expert
assessment is also used for vegetable crop production estimates in some countries. The experiences
of some countries below illustrate the different methods:
Some countries like Malta and Mexico are collecting vegetable crop data using administrative
records and sources of vegetable crop estimates.
The Mexican agricultural statistics program uses administrative registers to obtain vegetable crop
data. In particular, the agriculture information includes the sown area, harvested area, damaged
area, observed and estimated harvests, etc. The Ministry of Agriculture (SAGARPA) state offices
combine advanced reports on sown and harvested areas during the first ten days of each month and

G44
3PROCEEDINGS ICAS VII Seventh International Conference on Agricultural Statistics I Rome 24-26 October 2016
continue to capture this information in order to include the cumulated data in the next month‟s
report. The central office of Ministry of Agriculture provides the rules and the information
system for processing the data.
In Malta, to do away with expert advice the Agriculture and Fisheries Unit decided to embark, with
the support of European Union, on a survey project using scientific methods in order to provide
solid foundations for present and future vegetable crop production estimates (TAPAS project).
Interviewing was carried out during a twelve-week period extending from March to May 2005 and
the information collected referred to harvested crop production for the calendar year 2004.
The households in the sample were informed individually by mail explaining the scope of the
survey and the information it was about to collect. Each farmer was asked to prepare area and
production figures for the year 2004.
The final results from the TAPAS Project gave a total crop production of 106,922 tonnes in
2004, with a percentage error of 4.3 given a 68 per cent level of confidence. This
production was significantly higher than the volume which passed through organized markets
which stood at 44,513 tonnes during the same period. The primary aim of the survey was to
establish the level of production which by-passes the market. Table 4.1 shows the percentage
comparison between the total production from the survey, and the volume of produce that can
be collected directly from administrative sources. It can safely be concluded that there are no direct
sales for tomatoes, carrots and vegetable marrows and also administrative sources are very
reliable. As for beans and onions this is absolutely the opposite as only a small percentage pass
through the official markets. On the other hand, the production of beans and onions are mainly
grown by part time farmers and are either consumed on the holding or sold directly. A
substantial volume of certain crops, namely sugar melons, water melons, cabbages and
cauliflowers are sold directly by the holding and by-pass the official market (TAPAS, 2005).
Table 4.1 Comparison between estimated total crop production (t) and crop production (t) from
administrative sources
(t) Production TAPAS survey
Total production (t) fromadministrativesources
%
Tomatoes 15,047 15,051 100 Onions 5,276 2,254 42,7 Beans 1,990 467 23,5 Vegetables Marrow 3,083 3,046 98,8 Water melons 5,148 4,400 85,5 Sugar melons 4,172 2,871 68,8 Cauliflowers 5,065 3,186 62,9 Cabbages 3,482 2,634 75,6 Lettuce 2,720 2,237 82,2 Carrots 1,612 1,648 102,2 Sources: Fruit and vegetable production/Final report (TAPAS, 2005).
Some countries do not implement a specific sample survey or census for vegetable crops.
Accordingly, vegetable crop data are collected together within the framework of an existing
agricultural survey or census. Therefore, data on vegetable crops are collected together with other
crops like cereals, fruits, etc. In many Europeans countries, the Survey on Agricultural Production
G44
4PROCEEDINGS ICAS VII Seventh International Conference on Agricultural Statistics I Rome 24-26 October 2016
Methods, abbreviated as SAPM, was a survey carried out in 2010 to collect data at farm level on
agri-environmental measures in the EU. European Union (EU) Member States could choose
whether to carry out the SAPM as a sample survey or as a census survey. The SAPM covered all
agricultural holdings (including vegetable crops holdings).
In the case of Africa and Asia, due to the diversity situations of vegetable crops cultivation, it is
difficult to collect vegetable data production together with traditional crops.
Some vegetable holdings are usually located in specific areas. In developing countries, they
are located in the neighbouring of cities, where it is easy to access markets to sell produce
due to perishability of these types of crops. In many countries, most of the vegetable crop plots are
located in specific sites, generally near water points in rural areas where water is available for
irrigation (AFRISTAT & DNSI, 2004). Therefore, a sample used to estimate the production of a set
of crops (including traditional and vegetable crops) is not able to capture in an efficient
manner the production of the latter. Sampling bias error could be large considering vegetable crops
holdings are not spread enough and could be considered as rare crops. Specific surveys with
specific sample designs are necessary for the vegetable crop estimate survey.
The specific case of Africa
The practice of growing vegetable crops is prevalent in almost all African counties.
Horticultural crops, especially vegetable crops, serve a dual function as both cash and food crops.
The methods and techniques employed by producers for growing and harvesting these crops vary
from region to region, according to peculiarities of vegetable crops. Furthermore, the specificity of
vegetable crops such as continuous harvesting, successive harvesting, staggered harvesting, the
different methods of cultivation and marketing strategies adopted by holders including timing and
frequency of harvest for staggered crops pose certain statistical challenges (area and yield
measurement) that are not present in traditional crops (cereal and root crops).
One particular challenge is that the growing cycle is often short for vegetable crops compared
to traditional ones and vary considerably from one vegetable crop to another. This allows
several planning and harvesting occurrences for the same vegetable during a single growing
season and different crops rotation during the same growing season. As a result, different crops are
often sown and harvested on the same piece of land during the agricultural year. This practice
is the main characteristic of vegetable growing. In developing countries, another
characteristic is that the farmers are typically small holders and are located near wet zones
and big cities due to the perishability of these crops and the lack of storage facilities, and close
proximity to major markets.
Another challenge is the application of technology such as fertilizers and irrigation to vegetable
crops that affects yield and the number of harvests.
Due to heterogeneity among cultivation techniques, and frequency of harvest, choosing the
appropriate observational method for a particular crop can be difficult. The observational method
should be chosen based on the crop and cultivation technique including necessity for periodical
monitoring. For the purposes of this study, vegetable crops are divided into 5 types with regard to
the nature of crop (leaf, root, fruit) and the methods of harvest (single, staggered) requiring a
specific method for yield estimation:
1) Leafy vegetables with staggered crop harvest;
2) Leafy vegetables with single harvest;
3) Root vegetables with single harvest;
4) Fruit vegetables with single harvest;
G44
5PROCEEDINGS ICAS VII Seventh International Conference on Agricultural Statistics I Rome 24-26 October 2016
5) Fruit vegetables with staggered harvest.
In these cases, staggered harvest crops refer to crops for which fruits or products do not mature
at the same time and for which multiple harvests are required and spread over a period of
time. Examples include tomatoes, okra etc. On the other hand, single crop harvest refers to crops
that are completely harvested upon maturity and destroyed thereafter. These include pumpkins,
cabbage, lettuce, carrot, etc.
2. Objectives
Considering the issues of having a sound methodology for vegetable crops production estimate, the
Global strategy to improve agricultural and rural statistics added this domain to the list of research
topics to be explored in the research plan. A literature review has been prepared to review the
methods used in different countries and regions to produce vegetable crop production estimates and
to prepare and implement Field Test Protocol (FTP) and a guideline to support countries. The FTP
targeted development countries where technical issues are more acute. Among all existing sources
(administrative, expert assessment, census, survey) the FTP targeted to conceive and implement
survey methodology in order to assess the technical choices and the results and gather elements
to prepare a methodological guideline. The FTP has tried to explore all aspects to have a good
survey providing accurate estimating of interested parameters including:
- Necessary adaptation of concepts and definitions for vegetable crop survey
- Appropriate sample frame for vegetable crop holdings:
- Appropriate sample design for effective sample selection for the survey aiming at having
accurate harvested area and yield estimates for all significant crops including rare and cash
crops
- Appropriate methods for harvested area and yield data collection considering the challenges
identified for this kind of crop (continuous planting/harvesting, staggered harvest crop)
The FTP has been applied in Ghana and this paper will try to summarize the methodology adopted
for measuring vegetable crop area, yield and production based on a sample survey. The paper will
address the primary challenges associated with measuring vegetable crop production. More
specifically the pilot has addressed the issue of sample frame and sample design and the issues of
having easy and accurate measurement methods for production parameters estimates (area
harvested, yield). The FTP puts emphasis on:
The method for choosing or developing an appropriate frame of vegetable crop holdings,
and specific variables to be collected during PSUs constitution and listing of vegetable crop
holding as a final sampling unit;
Considering different measurement methods including farmer inquiry and objective
measurement for harvested area and yield estimation for various vegetables;
Considering yield variability over time for staggered harvested crops and the feasibility for
using monitoring method and farmer recall to collect data for yield estimate;
The use of beds for vegetable cultivation allows to pilot other methods for harvested area
and yield data collection in addition to the crop-cutting method;

G44
6PROCEEDINGS ICAS VII Seventh International Conference on Agricultural Statistics I Rome 24-26 October 2016
3. Methodological Approach
3.1. The Scope of the Pilot Survey
The administrative sub-division of Ghana is at first level 10 Regions and at second level 216
districts. The scope of the field test is limited to two districs in two close regions. The scope a the
pilot survey is two districts. The district target should be the ones where vegetables growing
constitutes an important activity and convenient for testing various aspects of the methodology. The
Ada West District in the Greater Accra Region and Keta Municipal District in the Volta Region
were chosen. by Statistics Research and Information Directorate (SRID) of the Ministry of Food
and Agriculture (MOFA) and are known to be sheltering a large number of diverse types of
vegetable holders growing a large number of vegetable crops.
3.2. Methodology of Data Collection
Data could be collected through a sample survey. The absence of a sampling frame for vegetable crops (list of vegetable crop holdings) requires a prior listing operation to constitute an exhaustive list of gardeners. Once this has happened, a sample of vegetable holders will be drawn. The survey will be implemented in several steps:
- Step 1: Listing of vegetable crop growing areas.
The first step is to list all the horticultural sites. Each site will be enumerated with important variables like geographic position, number of vegetable holders, types of vegetable crops grown. This listing will allow establishing a sampling frame for vegetable sites as PSU. The sample of PSU will be drawn from this frame.
- Step 2: Listing of vegetable holdings and the identification of holders.
A full listing of vegetable holdings will be obtained for each sample of vegetable crop areas. This list will be the Secondary Sampling Unit (SSU) frame. During the listing, information will be collected on farmer name, crops on each parcel and specific date of harvest. The latter is very important: the enumerator will record the exact date of the harvest. A return visit will be done on that date in order to collect information on yield.
- Step 3: First visit
In the second step, the main part of the questionnaire is filled. Data are collected on socio-demographic characteristics of farmers, economic characteristics of the farm including labour, land (size and number of plots, number of beds under cultivation, average size of beds by crop, equipment, production costs, etc.). During this visit, we will identify the beds by crop type and a few beds by crops will be measured to get an idea of their average size.
- Step 4: The Yield Survey
The production of a selected sample of plot will be collected and weighed. In some cases, the enumerator will collect and weigh the total production of a bed or count the number of its plants, calculate the average weight of a plant from a few harvested plants and compute the weight of the production of a bed. In other cases, (for staggered harvest crops), he/she will estimate the production

G44
7PROCEEDINGS ICAS VII Seventh International Conference on Agricultural Statistics I Rome 24-26 October 2016
of a bed in a number of measurement units and weigh the contents in order to compute the weight of the bed.
In the large majority of countries (developed and developing countries), a proper system to collect
area data on vegetable crops does not exist. Some countries, mostly developing countries, rely on
Census of Agriculture to collect these data. Some developed countries use administrative data or
expert assessment. Very few countries conduct surveys or censuses for collecting vegetable
crops area. It is important to examine which method applies to which country and under which
conditions. For instance, in Africa, the vegetable plot has often the form of the bed and since some
vegetables are staggered harvest crops, one option is to rely on the statement of the holder to
have area and production estimates and that requires a significant effort of memory recall from
holders.
If the collection of data on vegetable crops is done within a more comprehensive survey/census, it is
possible that the questionnaire design and the general techniques of measurement of area and
production for “traditional” could not fit the peculiarities of vegetable crops.
The use of administrative data from different sources, that is to say data which were not collect
primarily for statistical purposes, can be difficult when reconciling them to obtain statistical data.
This can be more difficult for countries where administrative data are outdated. Global Strategy is
elaborating a guideline on how to improve and integrate administrative data in the agricultural
statistical system (Global Strategy, 2015).
Due to the large species of vegetable crops, the measurement of yield depends on the type of
vegetables. Onetime enumeration is not meaningful for some vegetable crops, since they have
several growing seasons within a year. It is important to evaluate the best option between: 1)
Providing necessary tools and capacity building to the holder and relying on his statement or 2)
Follow-up by several visits, with the physical presence of enumerators. In this last case, it is
important to determine with the holder, the exact date for crop harvesting. Some crops are left in
the field by the holders and harvested when needed.
The yield depends also to the seed varieties. Only information collected from the field could give
clear indication on the yield. Administrative data should be extremely detailed to give all these
information, for each crop. Therefore, the use of administrative data to identify yield rate could be a
daunting task. However, administrative files could be used to assess the production.
The use of a specific seed can be different within a year; the yield rate also can vary considerably
during this period of time. For crops which are grown several times during a year period, if the yield
estimates for one growing season is used for another one, the results could be inaccurate.
The main challenge for this kind of survey on horticulture crop is to find the best observation
methods giving right and accurate measurements of the key parameter for production estimate (area
harvested, yield). It is how to find the easiest, the simplest and most user-friendly method for
respondents and enumerators, which are fast to implement and are cost-effective that is a challenge.
The vegetables grown in the region (lettuce, carrot, spinach, mint, celery, etc.) are characterised by
short growing cycles (1-3 months) and generally non rain-fed crops allowing the practice of
continuous planting/harvesting over the year. Certain vegetables like mint, parsley‟s main
characteristic is that they are successive harvest crops and others like okra and tomatoes for which
harvest is staggered can last 1 month or more. Hence measuring the harvest area and yield using
objective measurement methods needs to monitor each planting/harvesting occurrence and also
each harvest occurrence by the sampled holder for okra and tomatoes.
G44
8PROCEEDINGS ICAS VII Seventh International Conference on Agricultural Statistics I Rome 24-26 October 2016
For the exercise, there was not enough budget and probably no national institution would accept to
participate in a pilot survey covering one year in the field. The strategy used in this field test is
to reduce the number of visits by the enumerators to the farmers at a minimum possible
considering the short time allocated to data collection phase in the field (one month). For the
recording of area harvested, the combination of objective measurement during the field visits and
the farmer recalls allow to calculate estimates covering the reference period (one year).
Considering the general cultivation practice of the vegetable growers using the bed as the
principal technique for soil preparation and plant sowing, the bed is an area unit that can be used
for harvest area measurement.
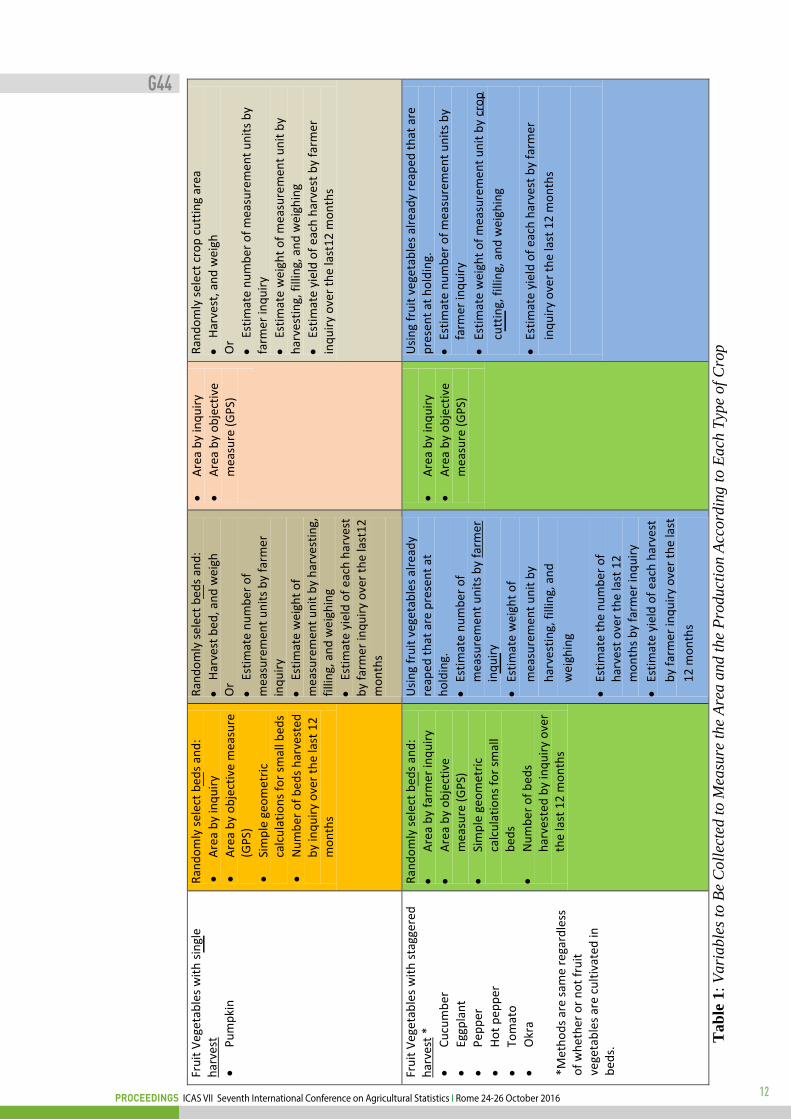
The questionnaire is designed to allow recording of a suite of variables needed in order to estimate
the area and yield of each type of vegetable crops. The variables to be measured and the appropriate
methods of measurement vary according to the type of crop, the mode of harvest (i.e. single harvest,
staggered harvests, successive harvests), and cultivation techniques (on bed, full field). For yield
measurement, two methods are tested, the random selection of a sample of beds to be harvested and
the production weighted in the case the plot is sown using the beds and the use of traditional crop
cutting method in case the plot is sown using full field. Table 1 below illustrates the proposed
variables to be collected during this pilot by type of crop according to the mode of harvest, and
cultivation technique.
Note that for root vegetables and fruit vegetables, the determination of the measurement unit is
central to estimating production.
3.3. Sampling Frame
A sampling frame can be built using agricultural or population census frame. Some variables
collected during these statistical operations allow to identify the vegetable growers. The use of
administrative files of producers registered in official government agricultural support programs. It
is an important storage of administrative records that allows, through in-office activities, to obtain
enormous quantity of information about the vegetable growers.
The experience and knowledge of the field enumerators or technicians about the producers and plots
land located in their work areas could make it easier to identify producers and their agricultural
holdings.
Sometimes it is necessary to build a proper sampling frame. For instance, during the pilot test in
Ghana, this option was used. In the absence of appropriate registers of vegetable holdings in Ghana,
the better sample design is the two staged sample. The use of Enumeration Area (EA) of the
Population and Housing Census 2010 was an option but due to the time-lag between the two
operations (5-6 years), the risk of having obsolete and inappropriate information about vegetable
growers of the EAs for drawing a sample of PSU was very high. In addition to that the need for
having more information on the PSU for an effective sample selection required to have a step for
the first stage sample frame preparation by the identification and listing of PSUs allowing the
collection of important variables to support the sampling selection.
The first stage sampling frame was built by a complete listing of vegetable growing areas (sites) in
each district. Variables such number of holdings operating in the site, the types of vegetables grown
in the site were collected to be used for the sample selection.
Once the site is selected, then a complete listing of vegetable holdings is done. This list was the
Secondary Sampling Unit (SSU) frame. For sample selection purposes, variables were collected on
holder name and sex, type of vegetable grown and specific date of the next harvest, number of
G44
9PROCEEDINGS ICAS VII Seventh International Conference on Agricultural Statistics I Rome 24-26 October 2016
employees, total acreage under cultivation. This additional information is used to perform effective
holdings sample selection and also for operational use to ensure that the area and
yield questionnaires are implemented at the right time particularly that yield data collection are
planned during the right harvest time minimizing the survey personnel workload and costs of
logistics.
During the listing of the PSUs, the following variables could be collected: a) Area Code b) Area
Name c) Geographic Location-GPS Coordinates; e) Estimated Number of Vegetable Holders; f)
Main water source; f) Types of vegetable crops grown.
The latter variable allows to build a sample, covering all the different crops. The estimated number
of vegetable holders allow to calculate the probability of inclusion for the PSUs.
During the listing of SSUs, the following variables could be collected: a) Name of the Holder; b)
Gender; c) the Total acreage under cultivation (acres); c) the number of beds (if applicable) d) The
crop grown; e) the beginning of the period of harvest.
3.4. Sample Selection
The sample design could be the 2 stages sampling. At the first stage, the vegetable growing areas
are selected with probability proportional to size (pps). The variable to be used for the pps sampling
could be the number of vegetable growers in the area.
In the pilot test held in Ghana, 102 vegetable growing sites were identified and listed in the two
districts (53 for Keta and 49 for Ada). 32 sample sites (PSU) were selected using PPS (16 for each
district). The sample rate at first stage is 1/3. In the Ada District, one site was automatically
selected since it was the only site where a specific crop, Zucchini, was recorded. The listing of
vegetable crop holders in these 32 sites gave a total of 1814 holders. 10 sample holders were
selected randomly in each of the 32 sites. The sample size for the field test was 320 holders. The
workload of the enumerators and the budget limitation was taken into account in deciding on the
sample size. A total of 16 enumerators were available for the field test.
4. Field Implementation and Innovation
The field implementation has allowed to identify several area of innovation:
For staggered harvest crop, the enumerator can visit the field 3 times during the harvest
period. Ideally, at the beginning, at the peak and at the end of the harvest. A harvest diary
could be given to the farmer in order to record the production of the farm during the absence
of the enumerator. The variables to be collected could be: a) the production on the bed/crop-
cutting area in terms of number of measurement unit; b) Number of Harvested Beds; c) The
date of the harvest. These variable should be kept simple as possible and well
understandable by the farmer. Such collected would be useful to access the variability of the
production within a single harvest period and to obtain better estimates of the production.
The pilot test in Ghana has shown that, the growing of vegetable crops is not fairly
distributed in various PSUs. For instance, zucchini was only cultivated in one PSU. During
the sample selection, this PSU was automatically included in the sample. The estimation of
the vegetable crop production grown in such production is done separately and then add to
G44
10PROCEEDINGS ICAS VII Seventh International Conference on Agricultural Statistics I Rome 24-26 October 2016
the estimation on the remaining sample. This procedure allows avoiding the overestimation
of the production for such “rare” crop.
In order to assess the yield, a number of beds are randomly selected in the case the field is
divided in beds. The enumerator will confine the field, whatever is its form, in a rectangle
with sizes a and b. He will assign the four corners of the rectangle numbers from1 to 4.
Using a calculator, he will select a number between 1 and 4. This number will correspond to
a selected corner, which will be considered as an “origin point‟‟. Then, he will select a
random number between „0 and a‟ and between „0 and b‟, using a calculator. These selected
numbers will be the coordinates (a, b) of a point in the field. When the point falls in a bed,
this bed is selected. The operation is repeated until 3 beds are selected from this field. The
sizes of the three beds will be recorded.
Due to their correlation with the production, socio-economic variables, like availability of
water supply, the demand, the equipment, etc. could be collected in other to assess the
production. In the case of the pilot test, stratification was not necessary, since the listing of
the SSU present a quite homogenous population. However, when stratifying the whole
population of the farms the more recent information for each farm is used. It is therefore
necessary, to keep update as possible all the information related to the farms. The listing is
highly useful in this case.
5. Concluding remarks
Methodologies for measuring area and production for vegetable crop are under development. For
instance, Remote Sensing Data are also used to estimate agricultural production; but their use is still
at an early stage. Even in developed countries the use of remote sensing data in horticulture is
scarce. However, some studies have been done on its implementation in horticultural census/survey
(Avtar & Kamlesh, 2012 and Trout et al., 2008). Apart to the fact that it can be used to assess the
area, it could be used to identify the harvest period and provide information on the growth status of
crop. This information will facilitate the data collection work (Lee et al., 2014).
The pilot test survey in Ghana is currently under implementation, the result will allow to assess the
various methodologies to measure area and production (farmer inquiry vs. objective measurement).
It will also allow to access the variability of the production for staggered harvest crop.
However, the field implementation in Ghana done so far has allow to confirm what identified in the
literature review about the use of bed for vegetable crop production and the use of a measurement
unit for the measurement of the production by the farmer.
An adequate sample design has been also developed in order to estimate in an accurate manner the
production. The data collected in the Keta district, will be compare with existing data on the
vegetable production in order to assess the methodology.

G44
11PROCEEDINGS ICAS VII Seventh International Conference on Agricultural Statistics I Rome 24-26 October 2016
CR
OP
D
ivid
ed in
Bed
s N
OT
Div
ided
in
Bed
s A
rea
Pro
du
ctio
n
Are
a P
rod
uct
ion
Leaf
y w
ith
sin
gle
har
vest
Le
ttu
ce
C
abb
age
C
aulif
low
er
Ran
do
mly
sel
ect
bed
s an
d:
A
rea
by
inq
uir
y
A
rea
by
ob
ject
ive
mea
sure
(G
PS)
Si
mp
le g
eom
etri
c ca
lcu
lati
on
s fo
r sm
all b
eds
N
um
ber
of
bed
s h
arve
sted
b
y in
qu
iry
ove
r th
e la
st 1
2
mo
nth
s
Ran
do
mly
sel
ect
bed
s an
d:
H
arve
st b
ed, a
nd
wei
ghO
r
C
ou
nt
pla
nts
R
and
om
ly s
elec
t p
lan
ts,
har
vest
an
d w
eigh
P
rod
uct
ion
by
farm
er in
qu
iry
Es
tim
ate
yiel
d o
f ea
ch h
arve
st
by
farm
er in
qu
iry
ove
r th
e la
st1
2
mo
nth
s
A
rea
by
inq
uir
y
A
rea
by
ob
ject
ive
mea
sure
(G
PS)
Ran
do
mly
sel
ect
cro
p c
utt
ing
area
H
arve
st a
nd
wei
gh
P
rod
uct
ion
by
farm
er in
qu
iry
Es
tim
ate
yiel
d o
f ea
ch h
arve
st b
y fa
rmer
in
qu
iry
ove
r th
e la
st 1
2 m
on
ths
Leaf
y w
ith
sta
gger
ed h
arve
st
Sp
inac
h
M
int
P
arsl
ey
C
eler
y
P
ota
to le
aves
Ran
do
mly
sel
ect
bed
s an
d:
A
rea
by
farm
er in
qu
iry
A
rea
by
ob
ject
ive
mea
sure
(G
PS)
Si
mp
le g
eom
etri
c ca
lcu
lati
on
s fo
r sm
all b
eds
N
um
ber
of
bed
s h
arve
sted
b
y in
qu
iry
ove
r th
e la
st 1
2
mo
nth
s
Ran
do
mly
sel
ect
bed
s an
d:
H
arve
st b
ed, a
nd
wei
gh
P
rod
uct
ion
by
farm
er in
qu
iry
Es
tim
ate
the
nu
mb
er o
f h
arve
st o
ver
the
last
12
m
on
ths
by
farm
er in
qu
iry
Es
tim
ate
yiel
d o
f ea
ch h
arve
st
by
farm
er in
qu
iry
ove
r th
e la
st1
2 m
on
ths
A
rea
by
inq
uir
y
A
rea
by
ob
ject
ive
mea
sure
(G
PS)
Ran
do
mly
sel
ect
cro
p c
utt
ing
area
H
arve
st a
nd
wei
gh
P
rod
uct
ion
by
farm
er in
qu
iry
Es
tim
ate
yiel
d o
f ea
ch h
arve
st b
y fa
rmer
inq
uir
y o
ver
the
last
12
mo
nth
s
Ro
ot
vege
tab
les
wit
h s
ingl
e h
arve
st
C
arro
t
B
eet
Tu
rnip
B
ulb
on
ion
Sh
allo
t
Le
ek
Ran
do
mly
sel
ect
bed
s an
d:
A
rea
by
inq
uir
y
A
rea
by
ob
ject
ive
mea
sure
(G
PS)
Si
mp
le g
eom
etri
c ca
lcu
lati
on
s fo
r sm
all b
eds
N
um
ber
of
bed
s h
arve
sted
b
y in
qu
iry
ove
r th
e la
st 1
2
mo
nth
s
Ran
do
mly
sel
ect
bed
s an
d:
H
arve
st b
ed, a
nd
wei
ghO
r
Es
tim
ate
nu
mb
er o
f m
easu
rem
ent
un
its
H
arve
st r
and
om
ly s
elec
ted
p
lan
ts, w
eigh
t m
easu
rem
ent u
nit
P
rod
uct
ion
by
farm
er in
qu
iry
in m
easu
rem
ent
un
its
Es
tim
ate
yiel
d o
f ea
ch h
arve
st
by
farm
er in
qu
iry
ove
r th
e la
st1
2
mo
nth
s
A
rea
by
inq
uir
y
A
rea
by
ob
ject
ive
mea
sure
(G
PS)
Ran
do
mly
sel
ect
cro
p c
utt
ing
area
H
arve
st a
nd
wei
ghO
R
Es
tim
ate
pro
du
ctio
n b
y fa
rmer
inq
uir
y in
m
easu
rem
ent
un
its
Es
tim
ate
wei
ght
of
mea
sure
men
t u
nit
s b
y fa
rmer
inq
uir
y
G44
12PROCEEDINGS ICAS VII Seventh International Conference on Agricultural Statistics I Rome 24-26 October 2016
Fru
it V
eget
able
s w
ith
sin
gle
har
vest
P
um
pki
n
Ran
do
mly
sel
ect
bed
s an
d:
A
rea
by
inq
uir
y
A
rea
by
ob
ject
ive
mea
sure
(G
PS)
Si
mp
le g
eom
etri
c ca
lcu
lati
on
s fo
r sm
all b
eds
N
um
ber
of
bed
s h
arve
sted
b
y in
qu
iry
ove
r th
e la
st 1
2
mo
nth
s
Ran
do
mly
sel
ect
bed
s an
d:
H
arve
st b
ed, a
nd
wei
ghO
r
Es
tim
ate
nu
mb
er o
f m
easu
rem
ent
un
its
by
farm
er
inq
uir
y
Es
tim
ate
wei
ght
of
mea
sure
men
t u
nit
by
har
vest
ing,
fi
llin
g, a
nd
wei
ghin
g
Es
tim
ate
yiel
d o
f ea
ch h
arve
st
by
farm
er in
qu
iry
ove
r th
e la
st1
2
mo
nth
s
A
rea
by
inq
uir
y
A
rea
by
ob
ject
ive
mea
sure
(G
PS)
Ran
do
mly
sel
ect
cro
p c
utt
ing
area
H
arve
st, a
nd
wei
ghO
r
Es
tim
ate
nu
mb
er o
f m
easu
rem
ent
un
its
by
farm
er in
qu
iry
Es
tim
ate
wei
ght
of
mea
sure
men
t u
nit
by
har
vest
ing,
fill
ing,
an
d w
eigh
ing
Es
tim
ate
yiel
d o
f ea
ch h
arve
st b
y fa
rmer
in
qu
iry
ove
r th
e la
st1
2 m
on
ths
Fru
it V
eget
able
s w
ith
sta
gger
ed
har
vest
*
C
ucu
mb
er
Eg
gpla
nt
P
epp
er
H
ot
pep
per
To
mat
o
O
kra
*Met
ho
ds
are
sam
e re
gard
less
o
f w
het
her
or
no
t fr
uit
ve
geta
ble
s ar
e cu
ltiv
ated
in
bed
s.
Ran
do
mly
sel
ect
bed
s an
d:
A
rea
by
farm
er in
qu
iry
A
rea
by
ob
ject
ive
mea
sure
(G
PS)
Si
mp
le g
eom
etri
c ca
lcu
lati
on
s fo
r sm
all
bed
s
N
um
ber
of
bed
s h
arve
sted
by
inq
uir
y o
ver
the
last
12
mo
nth
s
Usi
ng
fru
it v
eget
able
s al
read
y re
aped
th
at a
re p
rese
nt
at
ho
ldin
g.
Es
tim
ate
nu
mb
er o
f m
easu
rem
ent
un
its
by
farm
er
inq
uir
y
Es
tim
ate
wei
ght
of
mea
sure
men
t u
nit
by
har
vest
ing,
fill
ing,
an
d
wei
ghin
g
Es
tim
ate
the
nu
mb
er o
f h
arve
st o
ver
the
last
12
m
on
ths
by
farm
er in
qu
iry
Es
tim
ate
yiel
d o
f ea
ch h
arve
st
by
farm
er in
qu
iry
ove
r th
e la
st
12
mo
nth
s
A
rea
by
inq
uir
y
A
rea
by
ob
ject
ive
mea
sure
(G
PS)
Usi
ng
fru
it v
eget
able
s al
read
y re
aped
th
at a
re
pre
sen
t at
ho
ldin
g.
Es
tim
ate
nu
mb
er o
f m
easu
rem
ent
un
its
by
farm
er in
qu
iry
Es
tim
ate
wei
ght
of
mea
sure
men
t u
nit
by
cro
p
cutt
ing,
fill
ing,
an
d w
eigh
ing
Es
tim
ate
yiel
d o
f ea
ch h
arve
st b
y fa
rmer
in
qu
iry
ove
r th
e la
st 1
2 m
on
ths
Tab
le 1
: V
ari
able
s to
Be
Coll
ecte
d t
o M
easu
re t
he
Are
a a
nd t
he
Pro
duct
ion A
ccord
ing t
o E
ach
Typ
e of
Cro
p

G44
13PROCEEDINGS ICAS VII Seventh International Conference on Agricultural Statistics I Rome 24-26 October 2016
REFERENCES
Avtar S. & Kamlesh K. 2012. Estimation of Area under Winter Vegetables in Punjab Districts:
through Remote Sensing & GIS Technology.
Global Strategy. 2015a. Reviewing the Relevant Literature and Studies on the Quality and Use of
Administrative Sources for Agricultural Data.
LEE, I., KANG, J., LEE K. J., LEE, M. K. & LEE, Y-J. 2014. Applicability of Rotary UAV for
Vegetable Crop Investigation.
TAPAS. 2005. Fruit and Vegetables Production. Survey on Direct Sales. TAPAS Project. Final
Report. Agriculture and Fisheries Unit National Statistics Office, Malta.
Trout, T.J., Johnson, L. F. & Gartung, J. 2008. Remote Sensing of Canopy Cover in
Horticultural Crops.