Embed Size (px)
Citation preview
Nutrition Assistance Program Report Series The Office of Analysis, Nutrition and Evaluation
Special Nutrition Programs Report No. CN-04-CFMPR
Measuring Competitive Foods in Schools: A Point of Sales Approach
United States Food and Department of Nutrition Agriculture Service
May 2004
“The U.S. Department of Agriculture (USDA) prohibits discrimination in all its programs and activities on the basis of race, color, national origin, gender, religion, age, disability, political beliefs, sexual orientation, or marital or family status. (Not all prohibited bases apply to all programs) Persons with disabilities who require alternative means for communication of program information (Braille, large print, audiotape, etc.) should contact USDA’s TARGET Center at (202) 720-2600 (voice and TDD)” To file a complaint of discrimination, write USDA, Director, Office of Civil Rights, Room 326-W, Whitten Building, 14th and Independence Avenue, SW, Washington, DC 20250-9410 or call (202) 720-5964 (voice and TDD). USDA is an equal opportunity provider and employer.
Measuring Competitive Foods in Schools: A Point of Sales
Approach
Authors: Rhoda Cohen Angelina KewalRamani Renee Nogales James Ohls Michael Sinclair Submitted by: Submitted to: Mathematica Policy Research, Inc. Office of Analysis, Nutrition and Evaluation P.O. Box 2393 USDA, Food and Nutrition Service Princeton, NJ 08543-2393 3101 Park Center Drive Bethesda, MD 20814-5341 10th Floor Alexandria, VA 22302-1500 Project Director: Rhoda Cohen Project Officer: Patricia McKinney This study was conducted under Contract number 53-3198-2-022/43-3198-3-3706 with the Food and Nutrition Service. This report is available on the Food and Nutrition Service web site: http://www.fns.usda.gov/oane. Suggested Citation: U.S. Department of Agriculture, Food and Nutrition Service, Office of Analysis, Nutrition and Evaluation, Measuring Competitive Foods in Schools: A Point of Sales Approach. Rhoda Cohen, Angelina KewalRamani, Renee Nogales, James Ohls, Michael Sinclair. Project Officer, Patricia McKinney. Alexandria, VA: 2004.
United States Food and Department of Nutrition Agriculture Service
May 2004Special Nutrition ProgramsReport No. CN-04-CFMPR
iii
ACKNOWLEDGEMENTS
We would like to thank the many people who contributed to this report. Frank Potter and Dan Kasprzyk provided critical insight that shaped the study’s sampling plan. Ronette Briefel helped improve the content and interpretation of the findings, and John Homrighausen also offered constructive feedback during the final analytical stages. Amang Sukasih provided useful comments on sampling procedures. Barbara Schiff made valuable contributions to designing data collection procedures and editing the data collection instruments. Judy Johns and Paul Myatovich helped conduct on-site data collection. Patricia McKinney, the project officer for the study, along with Jay Hirschman and John Endahl from the USDA Food and Nutrition Service, provided advice and guidance throughout various stages of our research.
We would also like to give special acknowledgement to numerous district and school
officials. In particular, we would like to thank the food service staff at the schools that we visited for primary data collection. They graciously welcomed the research field teams to observe food service procedures and also supplied us with recipes, portion sizes, ingredients, food package labels, information on competitive food policies, and details on various aspects of their operations (e.g. location, hours of operation) that enabled us to sample the cafeteria lines and vending machines for data collection purposes.
Also from Mathematica, Lucy Lu, Kate Gilstad, Mary Grider, and Holly Gerhart provided
expert programming assistance and coding of nutrient data. Walter Brower and Patricia Ciaccio provided valuable editorial assistance. Lynne Beres superbly formatted the data collection instruments, Bill Garrett skillfully designed the food and beverage inventory tables, and Jane Nelson did an excellent job of producing the report, with help from Jennifer Chiaramonti, Monica Capizzi and Darlene Hrbek.
v
CONTENTS Chapter Page
EXECUTIVE SUMMARY.................................................................................... ix
I INTRODUCTION ...................................................................................................1
A. POLICY CONTEXT ..........................................................................................2
B. OUTLINE OF THE REPORT............................................................................3
II DATA COLLECTION METHODOLOGY ............................................................5
A. OVERALL STRATEGY....................................................................................5
1. Relative Advantages and Disadvantages.....................................................6 2. Strategy Selected .........................................................................................8
B. SAMPLING.......................................................................................................8
C. DATA COLLECTION ....................................................................................12
1. Instrumentation..........................................................................................13 2. Recruitment and Training of Observers ....................................................15 3. Interactions with Sites Prior to On-Site Data Collection ..........................16 4. On-Site Data Collection ............................................................................18
III DATA FILE DEVELOPMENT.............................................................................27
A. FIAS SYSTEM AND DATA ENTRY............................................................27
1. Initial Data Review....................................................................................28 2. Coding Guidelines.....................................................................................28 3. Quality Assurance Procedures for Coding Work......................................29
B. WEIGHTING THE DATA .............................................................................29
C. ANALYSIS FILES..........................................................................................31
vi
CONTENTS (continued) Chapter Page
IV ILLUSTRATIVE STATISTICAL RESULTS.......................................................33
A. DESCRIPTION OF SCHOOLS......................................................................33
B. PATTERNS OF COMPETITIVE FOOD PURCHASES IN THE THREE SCHOOLS ........................................................................................37
C. TYPES OF FOOD USED................................................................................41
D. OVERALL AVERAGE NUTRIENT CONTENT OF FOODS AND
BEVERAGES..................................................................................................44
1. Comparing Energy and Nutrient Results to a Nationally Representative Sample ..............................................................................44
2. Average Energy and Nutrient Contents at the Item Level ........................48 3. Content at the Transaction Level: Selected Nutrients..............................55
E. USE OF VENDING MACHINES AT THE THREE SCHOOLS ..................63
1. Policy Issues Surrounding the Use of Vending Machines ........................64 2. How Revenues From Vending Machines Are Used .................................73
V OTHER FINDINGS FROM THE STUDY ...........................................................75
A. THE POSSIBILITY OF OBTAINING DATA FROM POS SYSTEMS IN SCHOOLS..................................................................................................75
1. Findings from the Informal Visits.............................................................75 2. Summary ...................................................................................................78
B. THE POSSIBILITY OF OBTAINING VENDING MACHINE DATA
FROM VENDORS ..........................................................................................78
1. Sales Records ............................................................................................79 2. Issues Related to Access to Vending Machines ........................................86 3. Recommendations .....................................................................................87
vii
CONTENTS (continued) Chapter Page
VI CONCLUSIONS....................................................................................................89
A. IS IT FEASIBLE TO USE THE POINT OF SALE OBSERVATION APPROACH TO COLLECT COMPETITIVE FOOD DATA? .....................89
B. WHAT ARE SOME KEY LESSONS LEARNED ABOUT HOW TO
COLLECT THESE DATA?............................................................................90
C. SUBSTANTIVE FINDINGS THAT COULD AFFECT DATA COLLECTION STRATEGIES .......................................................................91
D. COULD SCHOOLS APPLY THESE POS OBSERVATION
TECHNIQUES THEMSELVES TO MONITOR THEIR OWN USE OF COMPETITIVE FOODS?...............................................................................92
REFERENCES.......................................................................................................93
APPENDIX A: DATA COLLECTION INSTRUMENTS................................A.1
APPENDIX B: DETAILS OF SAMPLING METHODS..................................B.1
APPENDIX C: SELECTION OF FOOD AND BEVERAGE ITEMS OFFERED IN VENDING MACHINES...................................C.1
APPENDIX D: À LA CARTE FOOD AND BEVERAGE ITEMS OFFERED IN CAFETERIA LINES.........................................D.1
ix
EXECUTIVE SUMMARY
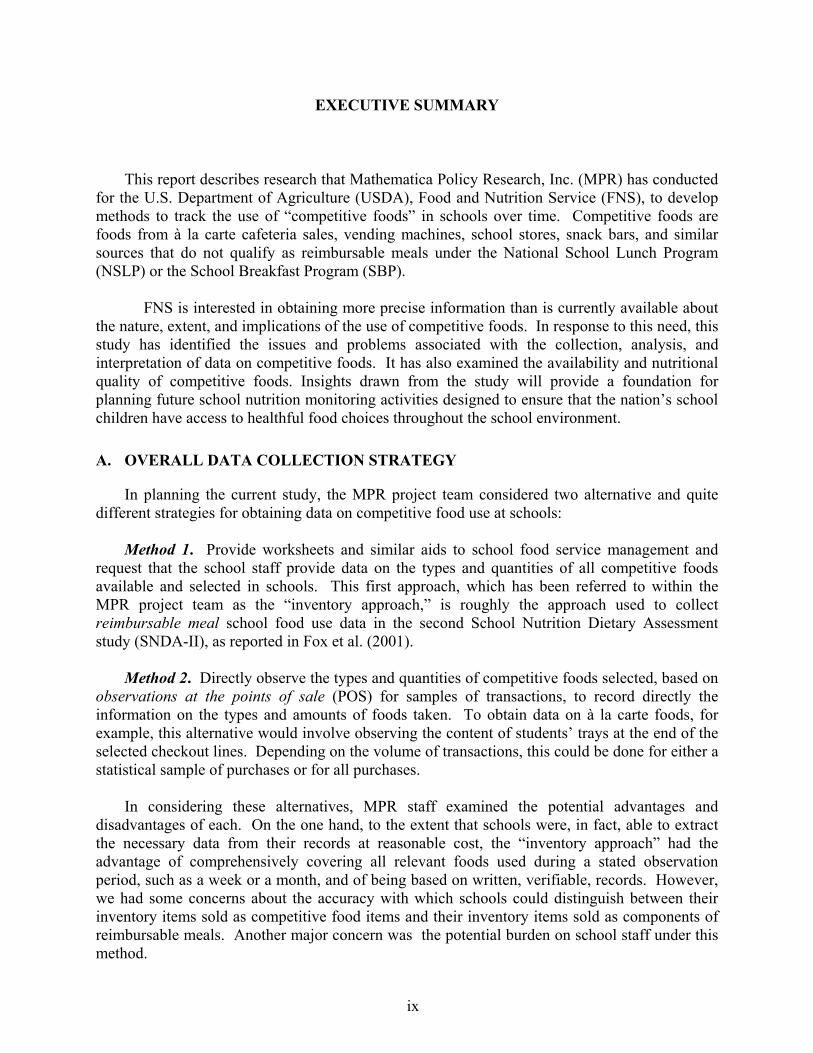
This report describes research that Mathematica Policy Research, Inc. (MPR) has conducted for the U.S. Department of Agriculture (USDA), Food and Nutrition Service (FNS), to develop methods to track the use of “competitive foods” in schools over time. Competitive foods are foods from à la carte cafeteria sales, vending machines, school stores, snack bars, and similar sources that do not qualify as reimbursable meals under the National School Lunch Program (NSLP) or the School Breakfast Program (SBP).
FNS is interested in obtaining more precise information than is currently available about
the nature, extent, and implications of the use of competitive foods. In response to this need, this study has identified the issues and problems associated with the collection, analysis, and interpretation of data on competitive foods. It has also examined the availability and nutritional quality of competitive foods. Insights drawn from the study will provide a foundation for planning future school nutrition monitoring activities designed to ensure that the nation’s school children have access to healthful food choices throughout the school environment.
A. OVERALL DATA COLLECTION STRATEGY
In planning the current study, the MPR project team considered two alternative and quite different strategies for obtaining data on competitive food use at schools:
Method 1. Provide worksheets and similar aids to school food service management and
request that the school staff provide data on the types and quantities of all competitive foods available and selected in schools. This first approach, which has been referred to within the MPR project team as the “inventory approach,” is roughly the approach used to collect reimbursable meal school food use data in the second School Nutrition Dietary Assessment study (SNDA-II), as reported in Fox et al. (2001).
Method 2. Directly observe the types and quantities of competitive foods selected, based on
observations at the points of sale (POS) for samples of transactions, to record directly the information on the types and amounts of foods taken. To obtain data on à la carte foods, for example, this alternative would involve observing the content of students’ trays at the end of the selected checkout lines. Depending on the volume of transactions, this could be done for either a statistical sample of purchases or for all purchases.
In considering these alternatives, MPR staff examined the potential advantages and disadvantages of each. On the one hand, to the extent that schools were, in fact, able to extract the necessary data from their records at reasonable cost, the “inventory approach” had the advantage of comprehensively covering all relevant foods used during a stated observation period, such as a week or a month, and of being based on written, verifiable, records. However, we had some concerns about the accuracy with which schools could distinguish between their inventory items sold as competitive food items and their inventory items sold as components of reimbursable meals. Another major concern was the potential burden on school staff under this method.
x
A key advantage of the second method, the “POS observation approach,” was its straightforwardness and simplicity. Since this method focuses directly on the transactions of interest, it has considerable face validity, and it can be readily monitored in terms of the accuracy of the information being obtained. However, a potential disadvantage of this second method was that it seemed likely that resource constraints would limit the data collection to observing only samples of the transactions, rather than obtaining complete data on all food use during a given observation period, as is potentially possible with the “inventory method.”
Ideally, we would have tested both approaches; however the available resources for the
project made it necessary to choose one. To inform this choice, MPR staff made informal visits to twelve schools around the country, to observe their food service operations, including the availability of competitive foods, how those foods were distributed, and the administrative data that were available regarding competitive food use.
On the basis of this information, and in consultation with FNS, we decided to test the POS-
based methodology in the prototype data collection work.
B. DATA COLLECTION METHODOLOGY
FNS is interested in comparing the competitive foods obtained by students at school with meals obtained under the National School Lunch Program. Therefore, procedures were developed for obtaining information on all of the foods sold to students during the school day. The planning for the data collection involved developing and pretesting a series of data collection instruments, designed (1) to obtain preliminary data on a school’s food service operations, (2) to facilitate the drawing of samples of POS/time slots for the observation work, and (3) to actually record the foods selected by samples of students, using forms that were precoded with the food and beverage items available at each POS. In light of resource constraints, the FNS specifications for the project indicated that three schools should be studied. These three schools were chosen judgmentally and include a middle school in Pennsylvania, a high school in New Jersey, and a high school in Maryland. Food service staff at each of these schools were initially contacted by MPR to enlist their cooperation in the study and to obtain information about how their food service operations were organized. Schedules for the data collection work were then made, and for each school, a two-person MPR research team spent three days on-site recording the foods selected at the pre-sampled POS. These data collectors also obtained detailed information on the foods themselves, as to how they were prepared, portion sizes, and related information. After the data collection at each school was completed, the information on foods selected, together with the data on ingredients and food preparation methods, was used to code the food data, item by item, into the FIAS software system. This software was then used to calculate the nutrient contents of the foods.
The objectives of the study were largely methodological in nature, and three schools is clearly too small a sample to attempt to make generalizations about competitive food use in the United States. However, we performed tabulations of the data, with two objectives in mind: (1)
xi
to assess whether the POS-based methodology appeared to lead to reasonable estimates of nutrient availability, as compared to other available information about which children are eating in school; and (2) to illustrate the types of analysis which could potentially be done with such data, if they were collected on a larger scale.
C. KEY FINDINGS
Our basic objectives in this study were (1) to determine whether it was feasible to collect detailed information about competitive foods in schools, and (2) to develop and test procedures for doing so. We believe that these objectives have largely been accomplished through the three-school data collection. Our conclusions from this work follow:
1. It is feasible to use the Point of Sale Observation Approach to Collect Reasonably
Accurate Competitive Food Data
Based on our formal data collection at three sites, supplemented with information from reconnaissance visits to 12 schools in an early stage of the study, we conclude that it is feasible to use a POS-based observational approach to collect data on competitive foods. In particular, using this direct observation approach, we obtained data that appear to be reasonably accurate and substantively interesting, as discussed further below.
2. The POS Data Collection Approach Imposes Minimal Burden on the Schools
There is strong evidence that the data collection was not burdensome to district and school-level staff. During the on-site data collection, the observers were generally unobtrusive, and their presence did not appear to affect food service operations during food preparation and food service. Overall, the time of school staff required to facilitate the data collection was very low, ranging from approximately 2.5 hours to 6 hours at any one site. School staff explicitly indicated that they did not view our data collection as having been a problem for them.
3. The Data Collected Appear to be Reasonable and Roughly Consistent with Other Data on Foods Eaten at School
We compared estimates of nutrient contents derived from the data we collected on reimbursable school meals with comparable data published findings from the School Nutrition Dietary Assessment Study—II. (This “SNDA-II” study did not obtain detailed data on competitive foods selected by students, so only the reimbursable meals were comparable.) Since there is considerable cross-school variation in patterns of food use, and since we only had three schools in our sample, there was no reason to expect anything approaching an exact correspondence in the two data sets. However, in our judgment, and as discussed in some detail in Chapter IV, the nutrient totals were sufficiently similar as to support the apparent validity of the POS approach.
xii
4. The Importance of Focusing on Both Vending Machines and A La Carte Competitive Food Sales
Much of the policy concern about competitive foods has focused on vending machine sales. However, based on our observations at all three of the sites, we strongly suggest that to address the underlying policy issues, it is important to collect data on both vending machines and a la carte sales in cafeteria lines. Frequently, the same foods (fruit drinks, salty snacks, baked goods) are sold simultaneously by the lunch lines and the vending machines. Any data collection strategy that focused only on vending machines would omit substantial quantities of the specific foods those machines sell.
D. OTHER FINDINGS FROM THE STUDY
The preliminary reconnaissance work at 12 schools which we undertook prior to conducting our formal three-school data collection yielded at least two important insights which are useful to consider in designed strategies for obtaining data on the use of competitive foods.
1. Possible Use of Electronic Cash Register Data
Data from POS cash register equipment is seldom—if ever—detailed enough to permit transaction-level nutrient coding of reimbursable versus competitive food items. Some schools simply use a cash box and have no systematic recording system to track individual transactions at all. Even those schools with fairly sophisticated electronic equipment to record their sales do not record items with enough detail to allow full nutrient coding. By contrast, the POS-based approach can be applied universally to all POS regardless of the degree of sophistication of the cash receipt system.
2. The Possibility of Obtaining Vending Machine Data from Vendors
We examined the possibility of obtaining data on vending machine sales, to avoid the expense of POS observation for this segment of competitive foods. While we feel there is room for additional research on this issue, our preliminary assessment is that this approach, while tempting, does not have a high probability of obtaining consistent data in most schools. In particular we found that obtaining vending machine use data from the vending companies is problematic, because of problems (1) accessing the vending companies through the schools, (2) getting their cooperation to provide sales data, and (3) obtaining sufficient detail for nutrient coding. Furtheremore, even if vending machine sales data are obtained, there are often difficulties knowing the degree to which they reflects sales to students rather than adults and whether they reflect sales during school hours (the interest of the current study) or at other times of the day and week.
xiii
E. WHETHER SCHOOLS COULD APPLY POS OBSERVATION TECHNIQUES THEMSELVES TO MONITOR THEIR OWN USE OF COMPETITIVE FOODS
There is interest at FNS in identifying ways to enable schools to monitor their use of competitive foods by themselves. Accordingly, we have assessed whether the POS data collection procedures that we used at the three schools could be effectively implemented by schools themselves. Our judgment is that most of the data collection work which we conducted could be performed by school staff. However, the schools would probably need some technical assistance from an external agency for certain components of the work. Assembling the up-front “setup” information (most importantly, descriptions of all the POS) could be done by the schools. Food service staff could also observe and record the POS transactions, as well as provide recipes, package labels, and portion information for nutrient coding of the relevant food items. There are, however, three salient research activities, which require technical expertise not usually available within school districts: sampling POS to observe, data coding, and statistical computer analysis of the data,. While these steps could probably not be done by most schools direction, with volume, they could be sufficiently be streamlined that an outside agency could perform them for a reasonable unit cost.
1
I. INTRODUCTION
This report describes research that Mathematica Policy Research, Inc. (MPR) has conducted
for the U.S. Department of Agriculture (USDA), Food and Nutrition Service (FNS), to develop
methods to track the use of “competitive foods” in schools over time. Competitive foods are
foods from a la carte cafeteria sales, vending machines, school stores, snack bars, and similar
sources that are not components of reimbursable meals under the National School Lunch
Program (NSLP) or the School Breakfast Program (SBP). This chapter provides an overview of
the study design and research objectives.
FNS is interested in obtaining more precise information than is currently available about the
nature, extent, and implications of the use of competitive foods. In response to this need, this
study has identified the issues and problems associated with the collection, analysis, and
interpretation of data on competitive foods, including foods and beverages sold to students in the
cafeteria and through vending machines, school stores, and other venues. It has also examined
the availability and nutritional quality of competitive foods, as well as related school policies and
financial arrangements. Insights drawn from the study will provide a foundation for planning
future school nutrition monitoring activities designed to ensure that the nation’s schoolchildren
have access to healthful food choices throughout the school environment.
Relatively little research has been done in obtaining detailed data on competitive food sales
in schools. Therefore, FNS established separate contracts with two different research
organizations, MPR and Abt Associates, to develop and test two different approaches to
obtaining data on competitive food sales. FNS asked each organization to develop
instrumentation and procedures for collecting this type of data and to test the data collection
plans that they developed by performing the data collection in three different schools.
2
MPR’s approach to the data collection focuses on observing student purchase transactions at
samples of “points of sale,” where competitive and reimbursable foods are sold. These points of
sale include cafeteria serving line checkout locations (which may sell both reimbursable meals
and a la carte items), vending machines, school stores, and similar venues.
FNS wished to be able to examine the nutrient content of the competitive foods that are sold,
both for individual food items and for all sales in a school, taken collectively. Also, the FNS
specification’s called for comparing the nutrient content of the competitive foods with the
content of meals that are reimbursable under the NSLP, so data on both reimbursable and
competitive food items were collected.
A. POLICY CONTEXT
Since the beginning of the NSLP and the SBP, emphasis has been placed on ensuring that
the school meals served under the programs are nutritious. This work included the development
of detailed regulations about what components and portion sizes were needed to constitute a
reimbursable meal. Later, in the 1990s, several projects, including the School Meals Initiative
and FNS’s Team Nutrition work, shifted the focus to development of meal-planning approaches
based directly on assessing nutrient content.
There has long been concern that the availability of competitive foods in schools can
significantly undermine the objective of ensuring nutritious school meals. Recent public health
evidence of increasing levels of overweight and obesity among school-age children has further
deepened the concerns about competitive foods, which may add extensive food energy to
children’s diets but supply only limited amounts of other nutrients.
Both the policy and research communities have given extensive attention to competitive
foods. Much of the relevant work is summarized in a report to Congress by FNS (2001), which
was prepared at a time when serious attention focused on developing legislation on the issue. In
3
addition, the American School Food Service Association (ASFSA) has been highly interested in
competitive foods; the ASFSA recently conducted research (as yet unreleased) in partnership
with the Kellogg Company to assess the use of competitive foods in schools. Both of the School
Nutrition Dietary Assessment studies conducted for FNS (SNDA-I and SNDA-II) obtained
extensive information on the kinds of competitive foods offered in schools. However, because of
concerns about data collection burden and costs, the studies did not obtain detailed data on the
nutrient content or quantities of competitive foods available or selected.
B. OUTLINE OF THE REPORT
Chapter II describes our data collection methodology for obtaining data during a three-day
period in each school. Chapter III outlines the data file creation using the Food Intake Analysis
System© 3.99 (FIAS). Chapter IV describes the finding from the data collection. Chapter V
presents certain other findings derived during the work involved in planning the current study.
Chapter VI draws a number of conclusions from the study.
5
II. DATA COLLECTION METHODOLOGY
This chapter describes the methodology MPR used to obtain data on competitive food
purchases at the three study schools. We begin in Section A by highlighting two alternative
overall data collection strategies that we considered when planning the study. We then discuss
the choice we made between them. Sections B and C, respectively, describe the sampling and
data collection methodologies we used in implementing our overall strategy.
A. OVERALL STRATEGY
In planning the current study, the MPR project team considered two alternative and quite
different strategies for obtaining data on competitive food use in schools:
• Method 1. Provide worksheets and similar aids to school food service management and request that the school staff provide data on the types and quantities of all competitive foods available and selected in schools.
• Method 2. Directly observe the types and quantities of competitive foods selected, based on observations at the points of sale (POS) for samples of transactions.
Method 1. The first approach, which has been referred to within the MPR project team as
the “inventory approach,” is similar to the approach used to collect reimbursable meal school
food use data in the second School Nutrition Dietary Assessment study (SNDA-II), as reported
in Fox et al. (2001). The SNDA-II researchers developed an extensive packet of materials to
collect detailed information from cafeteria managers on breakfasts and lunches served during a
five-day period. Using a self-administered mail survey, which included various materials and
response aids to help facilitate completion of the forms, managers recorded all foods and
beverages that students received during a selected target week. Researchers provided the
6
managers with a toll-free technical assistance number and made several monitoring phone calls
before, during, and after the target week.
The work that school food authorities had to do to comply with this type of request varied
considerably, depending on how they conducted and documented their food service operations.
In some cases (but not many, in percentage terms), schools may have had POS checkout
equipment sophisticated enough to extract much of the data from their records. More commonly,
schools had to rely on production and inventory records, together with specially developed food
sale logs on additional foods, to comply with this type of request. (The possibilities for
extracting data from POS checkout equipment, such as electronic cash registers, is discussed
more fully in Chapter V below.)
Method 2. The alternative that we considered to asking school staff to supply the data was
to station research observers at the POS for each type of competitive food, and to record directly
the information on the types and amounts of foods taken. To obtain data on à la carte foods, for
example, the alternative we considered was to observe the content of students’ trays at the end of
the selected checkout lines. Depending on the volume of transactions, this could be done for
either a statistical sample of purchases or for all purchases.
1. Relative Advantages and Disadvantages
In considering these alternatives, MPR staff examined the potential advantages and
disadvantages of each. On the one hand, to the extent that schools were, in fact, able to extract
the necessary data from their records at reasonable cost, the “inventory approach” had the
advantage of comprehensively covering all relevant foods used during a stated observation
period, such as a week or a month, and of being based on written, verifiable records. However,
we had some concerns about the accuracy with which schools could distinguish between their
inventory items sold as competitive food items and their inventory items sold as components of
7
reimbursable meals.1 Another major concern was burden on school staff. Based on the SNDA-
II experience, it appeared that the inventory method could place considerable burden on school
staff, and that this, in turn, could have problematic implications both for the accuracy of the data
supplied and for rates of cooperation. We were also concerned that obtaining the relevant data
could often be difficult in instances where vending machines in schools were operated by outside
contractors. (This issue of obtaining data from vending machine companies is discussed at more
length in Chapter V below.)
A key advantage of the second method, the “POS observation approach,” was its
straightforwardness and simplicity. Since this method focuses directly on the transactions of
interest, it has considerable face validity, and it can be readily monitored in terms of the accuracy
of the information being obtained. The “POS observation approach” can also be clearly
extended to observing vending machine sales. However, a perceived disadvantage of this second
method was that it seemed likely that resource constraints would limit the data collection to
observing only samples of the transactions, rather than obtaining complete data on all food use
during a given observation period, as is potentially possible with the “inventory method.” Also,
without having tried it, we were not sure at the outset how intrusive this approach might be to the
school food operations we were observing.
1As an example of the type of concern noted in the text, in some schools french fries from a
school freezer inventory are sold on the same food line both as an à la carte item, if they are taken separately by a student, or as a component of a reimbursable meal, if they are selected along with a sandwich. The same issue could apply to a Little Debbie pre-wrapped cake, which could be sold as a separate snack or could help make up the grain component of a reimbursable meal. We concluded that the ability of existing school food service records to maintain distinctions as fine as these might be quite limited.
8
2. Strategy Selected
As discussed above, each of the approaches we considered has both potential advantages
and potential risks. If sufficient time and resources had been available, a reasonable strategy for
the project might well have been to try them both out to determine which one (or which
combination of the two) best achieved the objectives of the study. However, the MPR project
lacked the resources to try both alternatives.
In the end, and in consultation with FNS, we decided to focus on the direct POS observation
approach.2 The rest of this chapter describes how this was implemented.
B. SAMPLING
In light of the exploratory nature of the current research, FNS decided at the outset of the
study to limit the number of locations at which data collection would be tested to three schools.
Since this was obviously too small a number to attempt to make the sample representative of any
interesting population universe, and since the time available to enlist schools was quite limited,
we decided to select the schools judgmentally. However, we paid attention to ensuring
substantial variation among the schools in terms of food service characteristics and locations. If
FNS had wanted to conduct a larger study aimed at characterizing the use of competitive foods in
U.S. schools in general, we would have wanted to draw a random sample of schools.
Based on resource availability and preliminary assessments of desired sample sizes, we
decided to conduct three days of on-site observation per school, with two observers present on
each of those days. The logistics of scheduling the observation work at the schools prior to their
2Interestingly, while this did not enter our decision process at the time, it appears that MPR
selecting the POS observation approach may have had the effect of creating a more complete test of both approaches. In particular, while we do not have direct information on the parallel study being conducted for FNS by Abt Associates, our impression is that they have focused more on what we have called the “inventory approach.”
9
closing for the summer meant that the choice of which three days to cover was highly
constrained. In general, we chose the observation week judgmentally, based on access and
logistical considerations, and chose the three-day period within that week randomly.
Presumably, in a broader study both the weeks and the days would be chosen randomly.
Because of these decisions, the essence of the analytical sampling work that had to be done
was to develop a sampling approach to choose observation points, defined on three dimensions:
1. Days
2. Time periods within the day
3. POS, defined in terms of specific cafeteria lines or vending machines
Once we selected the observation points, we took random samples of food transactions taking
place within these observation points. (A transaction is defined as the set of foods bought by a
student at a given point in time.)
Within this context, we attempted to meet several key objectives:
• Ensuring that the sample met the criteria for being random. This required that each potential day/time/POS observation point had a known, non-zero probability of selection (or, more generally, that each POS transaction during the relevant period had a known, non-zero probability of selection).
• Making sure that each type of cafeteria line and each type of vending machine was included in the sample. Because there was interest in various subsets of the competitive food operations, this was important.
• Achieving high levels of statistical efficiency for the sample by selecting observation points with probabilities proportional to size, when measures of size were available.
• Utilizing the available observer time as fully as possible, while taking into account the constraint that, with two observers, not more that two POS could be observed at the same time on a given day.
Developing a sampling plan consistent with these objectives turned out to be considerably
more difficult than we had anticipated. Based on standard approaches to household
10
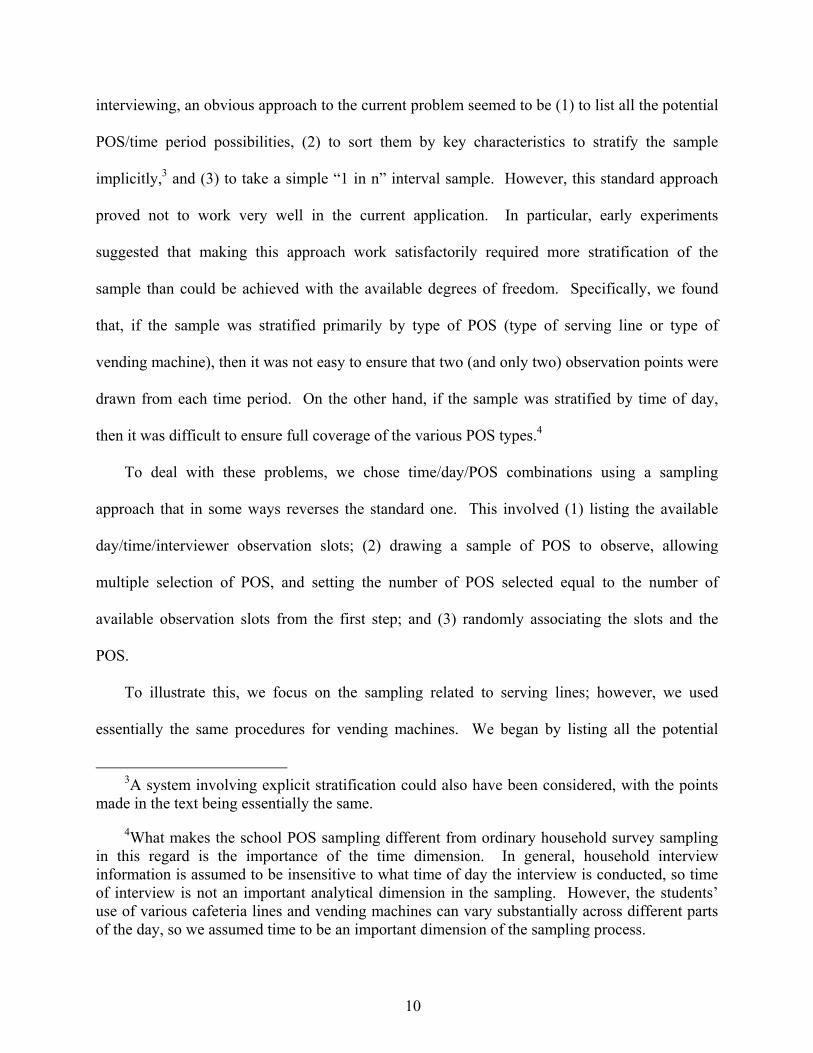
interviewing, an obvious approach to the current problem seemed to be (1) to list all the potential
POS/time period possibilities, (2) to sort them by key characteristics to stratify the sample
implicitly,3 and (3) to take a simple “1 in n” interval sample. However, this standard approach
proved not to work very well in the current application. In particular, early experiments
suggested that making this approach work satisfactorily required more stratification of the
sample than could be achieved with the available degrees of freedom. Specifically, we found
that, if the sample was stratified primarily by type of POS (type of serving line or type of
vending machine), then it was not easy to ensure that two (and only two) observation points were
drawn from each time period. On the other hand, if the sample was stratified by time of day,
then it was difficult to ensure full coverage of the various POS types.4
To deal with these problems, we chose time/day/POS combinations using a sampling
approach that in some ways reverses the standard one. This involved (1) listing the available
day/time/interviewer observation slots; (2) drawing a sample of POS to observe, allowing
multiple selection of POS, and setting the number of POS selected equal to the number of
available observation slots from the first step; and (3) randomly associating the slots and the
POS.
To illustrate this, we focus on the sampling related to serving lines; however, we used
essentially the same procedures for vending machines. We began by listing all the potential
3A system involving explicit stratification could also have been considered, with the points
made in the text being essentially the same.
4What makes the school POS sampling different from ordinary household survey sampling in this regard is the importance of the time dimension. In general, household interview information is assumed to be insensitive to what time of day the interview is conducted, so time of interview is not an important analytical dimension in the sampling. However, the students’ use of various cafeteria lines and vending machines can vary substantially across different parts of the day, so we assumed time to be an important dimension of the sampling process.
11
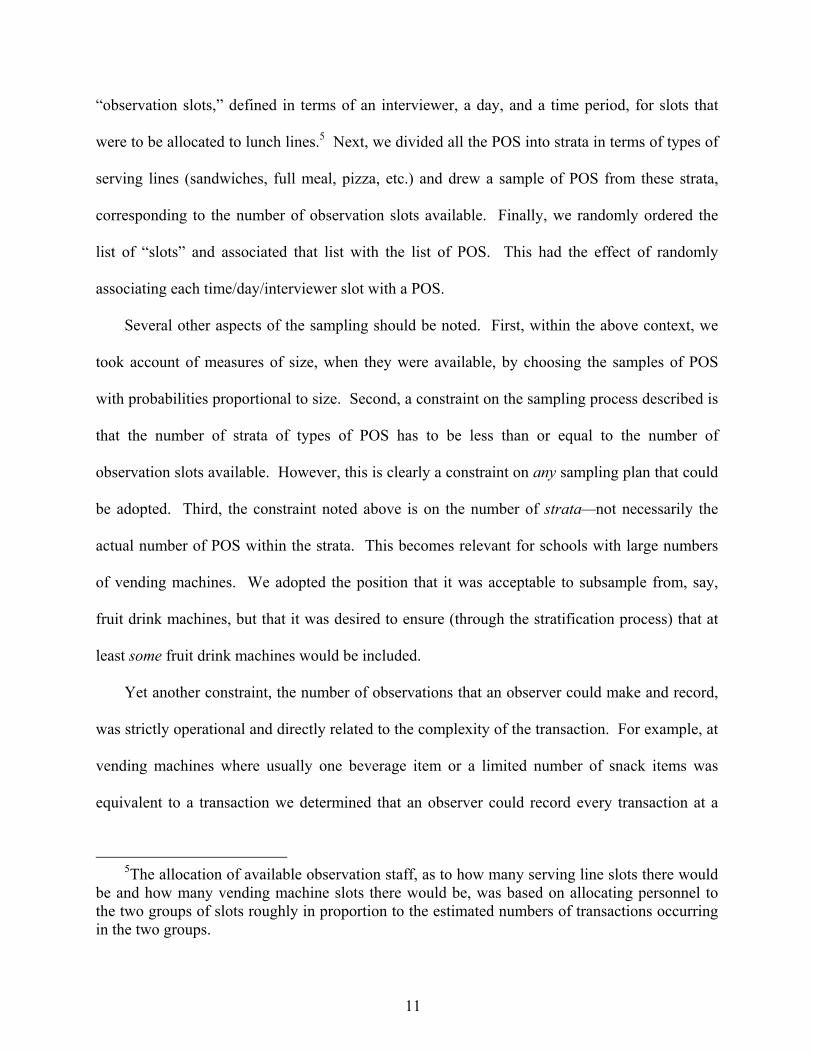
“observation slots,” defined in terms of an interviewer, a day, and a time period, for slots that
were to be allocated to lunch lines.5 Next, we divided all the POS into strata in terms of types of
serving lines (sandwiches, full meal, pizza, etc.) and drew a sample of POS from these strata,
corresponding to the number of observation slots available. Finally, we randomly ordered the
list of “slots” and associated that list with the list of POS. This had the effect of randomly
associating each time/day/interviewer slot with a POS.
Several other aspects of the sampling should be noted. First, within the above context, we
took account of measures of size, when they were available, by choosing the samples of POS
with probabilities proportional to size. Second, a constraint on the sampling process described is
that the number of strata of types of POS has to be less than or equal to the number of
observation slots available. However, this is clearly a constraint on any sampling plan that could
be adopted. Third, the constraint noted above is on the number of strata—not necessarily the
actual number of POS within the strata. This becomes relevant for schools with large numbers
of vending machines. We adopted the position that it was acceptable to subsample from, say,
fruit drink machines, but that it was desired to ensure (through the stratification process) that at
least some fruit drink machines would be included.
Yet another constraint, the number of observations that an observer could make and record,
was strictly operational and directly related to the complexity of the transaction. For example, at
vending machines where usually one beverage item or a limited number of snack items was
equivalent to a transaction we determined that an observer could record every transaction at a
5The allocation of available observation staff, as to how many serving line slots there would
be and how many vending machine slots there would be, was based on allocating personnel to the two groups of slots roughly in proportion to the estimated numbers of transactions occurring in the two groups.
12
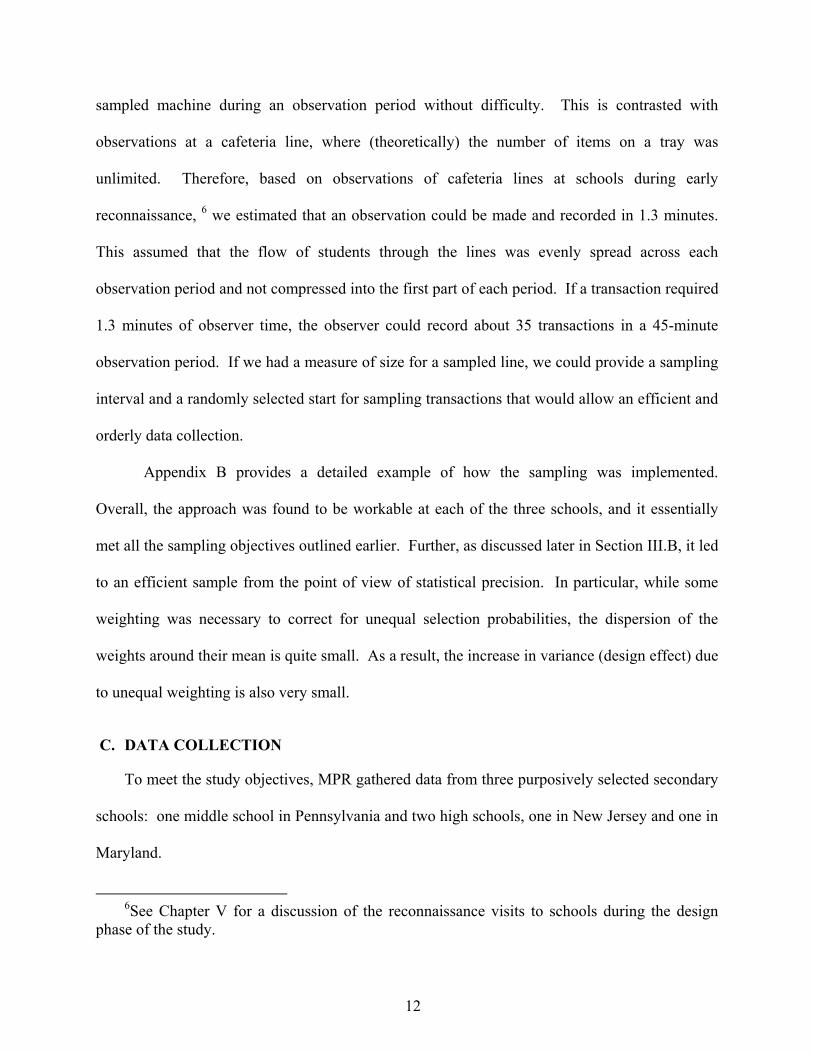
sampled machine during an observation period without difficulty. This is contrasted with
observations at a cafeteria line, where (theoretically) the number of items on a tray was
unlimited. Therefore, based on observations of cafeteria lines at schools during early
reconnaissance, 6 we estimated that an observation could be made and recorded in 1.3 minutes.
This assumed that the flow of students through the lines was evenly spread across each
observation period and not compressed into the first part of each period. If a transaction required
1.3 minutes of observer time, the observer could record about 35 transactions in a 45-minute
observation period. If we had a measure of size for a sampled line, we could provide a sampling
interval and a randomly selected start for sampling transactions that would allow an efficient and
orderly data collection.
Appendix B provides a detailed example of how the sampling was implemented.
Overall, the approach was found to be workable at each of the three schools, and it essentially
met all the sampling objectives outlined earlier. Further, as discussed later in Section III.B, it led
to an efficient sample from the point of view of statistical precision. In particular, while some
weighting was necessary to correct for unequal selection probabilities, the dispersion of the
weights around their mean is quite small. As a result, the increase in variance (design effect) due
to unequal weighting is also very small.
C. DATA COLLECTION
To meet the study objectives, MPR gathered data from three purposively selected secondary
schools: one middle school in Pennsylvania and two high schools, one in New Jersey and one in
Maryland.
6See Chapter V for a discussion of the reconnaissance visits to schools during the design
phase of the study.
13
For each school, two-person observation teams consisting of an MPR researcher and a field
observer collected data at each school for three consecutive days in May or June 2003. The main
purpose of these visits was to record food selections for transactions made by samples of
students at cafeteria lines and vending machines. MPR staff also gathered information on
ingredients, portion sizes, and methods of preparation to permit nutrient analysis of foods
selected. A detailed discussion of the data collection activities follows.
1. Instrumentation
Project staff developed and refined two sets of forms and instruments for the study—one set
for collecting information to inform planning on-site data collection and another set for
collecting data on site. To minimize the burden on school food service staff, MPR analysts and
data collectors completed all forms and instruments. The on-site instruments were designed to
ensure uniformity in data collection while allowing flexibility to accommodate differences
among the schools in terms of foods available on cafeteria lines or in vending machines. In the
following sections, we provide further descriptions of the two sets of forms and instruments (see
Appendix A).
a. Pre-visit Forms and Protocols. We developed six different forms and protocols to collect
information for planning for and organization of on-site data collection.
• Background Information Form. The Background Information Form provided contact information for the district food service director and the school food service manager, hours of operation for the school’s food service, and general information about the school. We obtained some of this information from the National Center for Education Statistics (NCES) Common Core of Data (CCD).
• Pre-visit Protocol. Researchers used this structured protocol to collect information on the school’s policy on competitive foods, the availability of such foods, the schedule for regular meal service, the overall class schedule, and other information for planning the on-site data collection.
• Sampling Information Form. We used this form to record data about the weeks available for on-site data collection, days when regular food service was not
14
available, types of lines in the cafeteria, numbers of POS, and a measure of size for each type of line. The information was used to select (a) a week for the visit, (b) a group of days for on-site data collection, and (c) the lines to be observed during the visit.
• Vending Machine Listing Form. During the pre-visit telephone call, we used this form to create systematically a list of vending machines by type of food, location of the machine relative to the cafeteria, and hours of operation.
• Sampling Information Summary Form (Vending Machines).The information from the Vending Machine Listing Form was summarized providing a count of machines by type and hours of operation to permit sampling of vending machines for on-site data collection.
• Sampling Implementation Form. This form, completed before the site visits, summarized the POS that were sampled for on-site data collection. It provided the framework for the on-site activities by specifying the observation times, vending machines, cafeteria lines, checkout stations, estimated number of observations, sampling intervals, and random start points for observing transactions.
b. On-Site Data Collection. Four types of forms were designed to meet the three objectives
for on-site data collection: (1) to collect information on food items selected for sampled
transactions at sampled POS; (2) to collect descriptions, recipes, and portion sizes for food items
to facilitate nutrient coding; and (3) to create an inventory of all items in sampled vending
machines.
• Transaction Observation Form. This observation form provided a context for site observers to record information about food items selected for each transaction. In addition to a generic form, we designed versions of this form for regular meal lines, à la carte lines, and snack lines to include food categories and items specific to the line type. For each observation period, the design of the form required listing food items only once, organized by food categories that were in the same order on each version of the form. The categories ensured that researchers would include all available food items. All forms included a space to record the number of each item purchased and whether it was à la carte or part of a reimbursable meal. Another section was used to record notes on condiments added at the time of sale or details about the product, specific product names or brands, or whether the salty snack foods were regular or baked. The form was constructed of split pages and bound to enable the observer to record quickly the specific items selected for each transaction. Data collectors were instructed to record all items a student presented at the time of checkout as a single transaction. Up to 75 transactions could be recorded on one form.
• Food Item and Description Form. Site observers used this form to record portion sizes and complete descriptions of each food served on sampled days. For foods
15
prepared at the school or at a central commissary, observers obtained a recipe from the food service manager or recorded a complete description of the ingredients and method of preparation. If items were pre-prepared, observers recorded brand names, addresses of the food vendor or manufacturer, and a list of all ingredients. Observers noted whether anything was added to the pre-prepared item at the school. Whenever possible, observers obtained package labels of pre-prepared items.
• Vending Machine Inventory Form. Observers inventoried the items available in each sampled machine. This form is set up as a matrix, with one cell on the form used to record each item visible in the display window or indicated by a button on the order panel.
• Transaction Observation Form for Beverage Vending Machine. This form is similar in format to the Transaction Observation Form for regular meal lines described above and was used by observers to record purchases at sampled beverage vending machines. Observers were instructed to record each set of purchases at a machine as a single transaction whether the purchase was one item or three different items. Up to 150 transactions could be recorded on one form.
2. Recruitment and Training of Observers
a. Staffing needs
The on-site data collection was designed to be conducted by two observers, who had to be
skillful at collecting information about transactions at various POS without interfering with the
flow of students through the checkout lines or burdening the school food service program staff.
For this exploratory study, each team contained one senior staff member who had had previous
contact with the school’s food service manager. The second member of the team was a highly
experienced field data collector. While both collected data through observation, the senior
member was also responsible for interacting with the food service staff to obtain detailed food
descriptions, recipes, and package labels to assist in nutrient coding.
b. Required Skills and Training for Observers
In an ongoing data collection effort, we anticipate that teams would consist of two
experienced field data collectors. Of the two used in this study, one had experience working on
MPR’s Summer Food Study, the other on an earlier MPR study of the NSLP.
16
c. Training of Observers
Both field data collectors received a package of materials for home study prior to
training. The package contained all forms and instruments, along with background
information downloaded from the FNS Child Nutrition Web site. These materials included
USDA school lunch program fact sheets, as well as selected sections from A Menu Planner
for Healthy School Meals (Publication Number FNS-303). Both field data collectors then
participated in a four-hour telephone training session conducted by the project director. The
training reviewed background information about the school lunch program, the composition
of reimbursable meals, the use of the data collection forms and instruments, sampling
protocols, and the schedule for on-site activities. The field data collectors were encouraged
to ask questions to clarify any information encountered during home study or presented
during the training. To simulate the observation experience, observers were encouraged to
visit a local cafeteria or fast food restaurant and conduct a mock observation of transactions.
3. Interactions with Sites Prior to On-Site Data Collection
a. Ensuring Cooperation
After the three schools were selected for the on-site data collection, the USDA project
officer sent a letter notifying each state’s child nutrition director about the planned data
collection. If state child nutrition directors did not send a copy of the letter to the school district,
MPR forwarded a copy that described the data collection procedures, the approximate time
frame, and contact information.7 After the letters were sent, the MPR project director and a
7Some prior contact had been established with the districts during a preliminary
“reconnaissance” of competitive food practices conducted with 12 schools very early in the study. See Chapter V for more details.
17
research analyst requested (and readily obtained) permission from each of the three school
districts to conduct on-site data collection.
b. Administration of Pre-visit Instruments
MPR project staff administered the pre-visit instruments by telephone to food service
managers at each school. In addition, school administrators provided information about the
vending machines and pouring rights contracts in schools where vending machine operations
were not controlled by the food service department. The pre-visit information was collected a
week to 10 days before the scheduled visit to allow adequate time for sampling POS and making
staffing and travel arrangements. Contact with each of the schools is described next.
Pennsylvania Middle School. The project director initially contacted the district food
service director for the Pennsylvania district, who immediately agreed to the on-site data
collection at the middle school and provided contact information for that school’s food service
manager. The manager was able to answer most of the questions on the pre-visit protocol but did
not have information about the vending machine contract arrangements, which were the school
principal’s responsibility. The principal provided the information necessary to complete the
questions about arrangements with vendors for the pre-visit protocol. She also provided
information for the vending machine listing form. The visit was scheduled for May 19 to 21.
New Jersey High School. Before contacting the manager of child nutrition at the New
Jersey high school, the project director requested permission from the school district’s director of
child nutrition to conduct data collection at the school. The director granted permission in less
than an hour. The manager of child nutrition at the high school welcomed the visit and willingly
responded to all questions in the pre-visit protocol. He was also able to provide information to
complete the vending machine listing form, since he and his staff were responsible for stocking
the machines. The visit was scheduled for May 27 to 29.
18
Maryland High School. An MPR research analyst contacted the district food service
supervisor responsible for the Maryland high school. She granted permission for the on-site data
collection and provided information for the pre-visit protocol and the vending machine listing
form. The on-site data collection was scheduled for June 4 to 6.
4. On-Site Data Collection
At each school, the plan for on-site activities for the three-day data collection was guided by
the pre-specified schedule of observations listed on the Sampling Implementation Form
described above. The primary duties of the team included briefing the on-site food service
manager about the team’s activities, completing the listing of food items for the Transaction
Observation Forms, obtaining and recording descriptions of food items for the Food Item and
Description Form, observing transactions at the vending machines, and performing the work of
the field observer. The field observer was responsible for all observations of foods selected on
the cafeteria lines.
To prepare for each day’s activities, the observation team arrived at the school 60 to 90
minutes before the first period that was to be observed. As part of that preparation, the team
generally met with the food service manager to develop lists of food items for each of the
transaction forms and determined the best location from which the MPR staff could observe
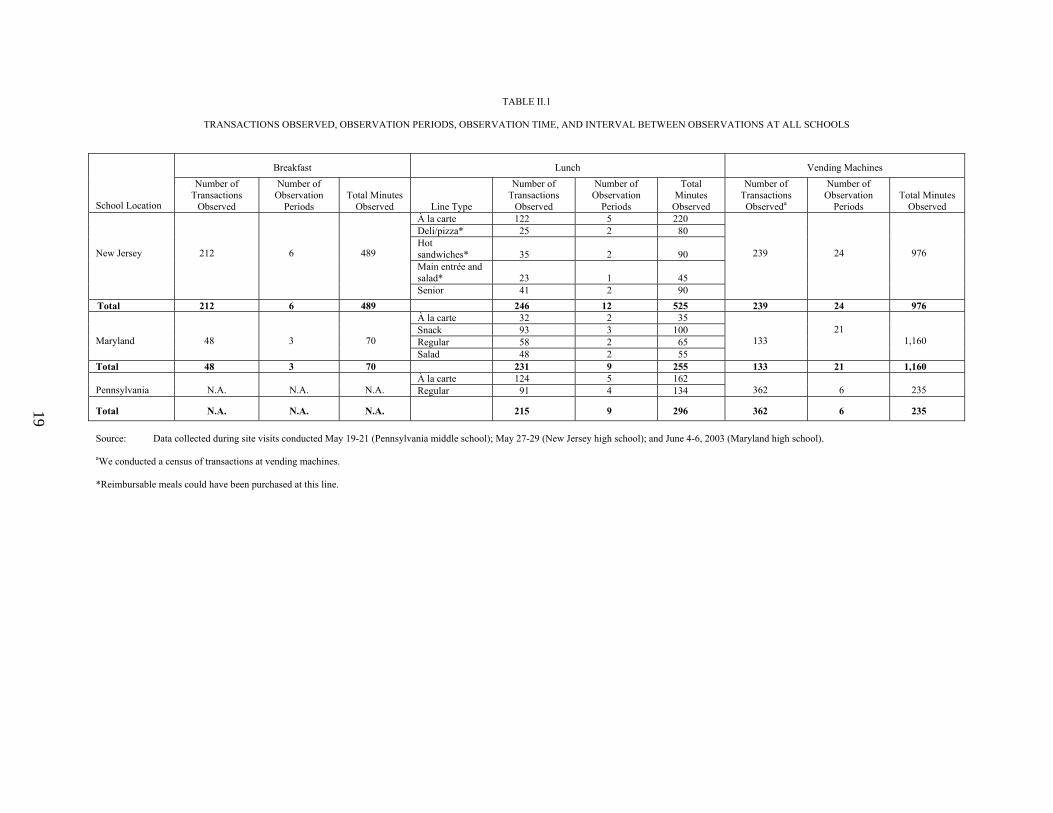
transactions at each of the sampled POS. Table II.1 provides the number of observations, the
observation time, and productivity for the three schools. The details of activities for each school
are described below.
19
TABLE II.1
TRANSACTIONS OBSERVED, OBSERVATION PERIODS, OBSERVATION TIME, AND INTERVAL BETWEEN OBSERVATIONS AT ALL SCHOOLS
Breakfast Lunch Vending Machines
School Location
Number of Transactions
Observed
Number of Observation
Periods
Total Minutes
Observed
Line Type
Number of Transactions
Observed
Number of Observation
Periods
Total Minutes
Observed
Number of Transactions Observeda
Number of Observation
Periods
Total Minutes
Observed À la carte 122 5 220 Deli/pizza* 25 2 80 Hot sandwiches*
35
2
90
Main entrée and salad*
23
1
45
New Jersey
212
6
489
Senior 41 2 90
239
24
976
Total 212 6 489 246 12 525 239 24 976 À la carte 32 2 35 Snack 93 3 100 Regular 58 2 65
Maryland
48
3
70 Salad 48 2 55
133
21
1,160
Total 48 3 70 231 9 255 133 21 1,160 À la carte 124 5 162
Pennsylvania
N.A.
N.A.
N.A. Regular 91 4 134
362
6
235
Total N.A. N.A. N.A. 215 9 296 362 6 235 Source: Data collected during site visits conducted May 19-21 (Pennsylvania middle school); May 27-29 (New Jersey high school); and June 4-6, 2003 (Maryland high school).
aWe conducted a census of transactions at vending machines.
*Reimbursable meals could have been purchased at this line.
20
Pennsylvania Middle School. For the first two days of the visit to the Pennsylvania
middle school, the observer team consisted of the project director and one experienced field
data collector. On the third day, a research analyst assumed the role of senior member of the
observer team.
On Monday, May 19, the first day of the planned three-day visit, the observers initially
met with the food service manager to review the planned on-site activities. The project director
asked the manager about the food items that would be available on the regular and à la carte
lines, while the second member of the team recorded the information in the observation
instruments.
The manager introduced key members of the kitchen staff who were responsible for
preparing sandwiches, salads, and hot food items. Some of this staff also served lunches at
other schools and had limited availability at the middle school. It was important to establish a
rapport quickly with those workers, who needed to provide information to complete the Food
Item and Description Form and also worked at other schools or served as cashiers on the
various lines. The MPR project director arranged to speak with these staff to obtain details of
the ingredients, recipes, methods of preparation, and portion sizes. In addition, the project
director obtained package labels for the food items that were partially or fully prepared.
The manager also showed the team the location of the vending machines, the layout of the
meal service lines, the cashier stations, and the food items available. As observers toured the
lunch lines, they had an opportunity to verify the completeness of the lists of food items
recorded earlier and to revise the lists as necessary.
The food service on the à la carte lines differed from that of the regular lunch line. On the
à la carte line, the same staff member served the snack items and took the cash for each
transaction, while on the regular line, students were served and then lined up at the cashier
21
station. In conjunction with the food service staff, we determined where the observer would
stand for each type of line to be able to efficiently observe both the items on the trays and the
condiment dispensers while not impeding the flow of students. For the regular line, the
observer was stationed on one the side of the cashier; for the snack lines, the observer stood
behind the serving counter next to the kitchen staff member.
Once the first lunch period started, the vending machines were automatically unlocked and
observations began at the lunch lines and vending machines simultaneously. The lunch lines
moved very quickly, and most of the students were usually served in the first 15 minutes of the
39-minute period. After all waiting students were served, the kitchen staff quickly shut down
access to the lines to restock the food items for the next lunch period.
Although vending machines were located in the hall outside the lunchroom, they were
available only to students assigned to lunch and could not be used by other students during the
four minutes between periods. A teacher or member of the security staff monitored access to
the machines and would not permit the students to consume food or beverages in the hallway.
There was almost continual usage of the vending machines during the lunch periods, and a few
machines ran out of products or change and were subsequently turned off by the custodial staff.
Students were not deterred in making selections from the remaining machines.
During the three-day data collection period, a total of nine lunch observation periods, the
observation team observed a total of 91 transactions for reimbursable meals, 124 transactions
for à la carte purchases, and 362 transactions at vending machines.8 For transactions at the
8On the first day of on-site data collection, vending machines were observed for only one
lunch period to allow the senior member of the observation team to monitor the data collection activities of the field observer.
22
lunch lines, the observer recorded a transaction every 1.5 minutes for reimbursable meals, an à
la carte transaction every 1.3 minutes, and a vending machine transaction every 36 seconds.
New Jersey High School. For the first day of data collection at the New Jersey high school,
the observer team consisted of the principal investigator and an experienced field data collector.
They were joined in the afternoon by a research analyst, who then assumed the role of senior
member of the observer team for the last two days of the site visit.
When they arrived on Tuesday, May 27, the principal investigator and field data collector
first talked with the food service staff person responsible for overseeing breakfast, as the food
service manager did not arrive until later that morning. While preparing the morning hot meal
entrée, the breakfast supervisor described the serving arrangements for breakfast, along with the
breakfast food and beverage options. There is one serving line for breakfast, which later serves
as the à la carte line for lunch. The field data collector then recorded an inventory of breakfast
items into an observation booklet.
Upon arrival, the food service manager greeted the MPR staff and briefly discussed plans for
the data collection. He also offered to answer any questions and encouraged them to ask
questions of his cafeteria staff as well. During a series of short conversations, various members
of the food service staff answered questions about the organization of the kitchen facilities, as
well as the location of the vending machines (most of which were situated in an alcove off the
main cafeteria room) and the senior à la carte serving line (located at the far end of the
cafeteria). The food service staff also explained the flow of students as they move through the
various lines during lunch, including the à la carte line, the deli sandwich and pizza line, the hot
sandwich line, and the primary hot reimbursable meal and salad bar line (four total lines in the
main cafeteria area). Next, the observation team familiarized themselves with the lunch items
by reviewing the printed daily menu, observing the food service staff preparing and arranging
23
the items in the service lines, and speaking briefly with the food service manager and relevant
staff. The field data collector recorded primary food items in the observation booklets for the
various line types.
The principal investigator recorded all vending machine items onto inventory forms and
sampled which machines would be observed during the multiple breakfast and lunch periods.
The food service manager informed the MPR team that the Gatorade machine was broken (it
remained so during the entire site visit), along with the ice cream machine (which reopened on
the third observation day). Vending machines were available to students during all meal service
times—including breakfast—and until after school. For the most part, items offered in the
vending machines were also available for purchase in the à la carte line and the senior line, with
the exception of soda and ice cream.
After the final observation period, the principal investigator reviewed cafeteria procedures
with the research analyst and also discussed a vending machine sampling plan for the remaining
part of the site visit. Over the next two days, the research analyst, with the help of the food
service manager and selected kitchen staff, collected recipes and labels, as well as information
on ingredients, cooking methods, and portion sizes.
During the three-day data collection period, a total of 6 observation periods during breakfast
yielded 212 transactions. For the 15 observation periods during lunch, the team observed a total
of 88 transactions for reimbursable meals and 199 transactions for à la carte purchases. For the
transactions during breakfast, assuming 25 or 45 minutes of service for each breakfast period,9
the team observed one transaction every 56.4 seconds for the primary breakfast period and one
9The primary breakfast period lasts from 7 to 7:25 A.M. However, breakfast is also available
to students who have study hall in the cafeteria during the first three periods of the regular school day; each period lasts 45 minutes.
24
transaction every 4.35 minutes during study halls. For the transactions at the lunch lines,
assuming 45 minutes of service for each lunch period, the team observed one transaction every
2.6 minutes. However, purchases tended to be clustered mostly in the first halves of the lunch
periods, so the productivity rate was considerably higher during the early parts of those periods.
(Please note that all time figures represent averages.) There was a total of 239 observations at
the vending machines. The team observed one transaction every 8.1 minutes.
Maryland High School. Data collection was conducted at the Maryland high school over a
three-day period (June 4–6, 2003). The observer team consisted of a research analyst, who
conducted the vending machine observations and data collection, and one experienced field data
collector, who observed transactions on the cafeteria lines.
On Wednesday, June 4, the first day of the planned three-day visit, the observers met with
the school food service manager and district level food service supervisor to review the planned
on-site activities. The research analyst asked the manager and supervisor to provide the
breakfast and lunch menus for the regular lunch and a la carte lines for the three-day field period.
The field observer recorded this information in the observation instruments.
The district food service supervisor and the food service manager provided detailed recipes
for several of the items on the breakfast and lunch menus, including ingredients, methods of
preparation, and portion sizes. In addition, the research analyst and field observer gathered
package labels for the food items that were partially or fully prepared. Before the breakfast and
lunch periods, the observer had the opportunity to tour the lunch lines and verify the
completeness of the lists of food items recorded earlier.
The food service on all four lines (regular, a la carte, snack, and salad bar) had a very similar
setup. On each, students would line up and then come through and select the food items that
they wanted. Each line had one cashier at the end. In conjunction with food service staff, we
25
determined that the observer would stand at the end of the line to be able to observe the food
items on student trays and not interfere with the flow of students.
The field observer collected information during the cafeteria breakfast and lunch periods.
During the 20-minute breakfast period, there was only one serving line, because of the small
number of students. The breakfast line did move fairly quickly for the first 10-minute period.
Once the first lunch period started, students lined up immediately outside the four serving lines.
The regular and a la carte serving lines were the busiest, while the snack and salad bar lines were
slower. The regular and a la carte lines moved very quickly, and usually most of the students
were served in the first 20 minutes of the lunch period. However, students would keep coming
up to the snack and salad bar lines during the course of the lunch periods to purchase single items
like french fries and fruit smoothies.
The research analyst conducted observations of 15 vending machines located on the second
level of the school and the cafeteria. (Only two vending machines were in the cafeteria.) The
vending machines were busiest during the lunch periods and the breaks between classes. All the
vending machines except two soda machines were available to students all day. The soda
machines turned on at the end of the final lunch period (12:30).
During the three-day data collection period, with 6 observation periods for breakfast, 12 for
lunch, and 24 for vending machines, the team observed a total of 212 transactions for breakfast,
244 transactions across the various types of lunch lines, and 169 transactions at vending
machines. At breakfast the observer recorded a transaction every 1.4 minutes, a transaction at
lunch every 1.1 minutes, and a vending machine transaction every 8.7 minutes.
5. Degree of Intrusiveness
In designing the data collection procedures, project staff made every effort to minimize the
burden on district and school staff at all levels while collecting complete and accurate data. This
26
goal was effectively achieved during the data collection at each of the three sites. We asked the
sites to estimate the amount of time they spent on the data collection. Before the visits, during
the set-up phase, the school food service managers spent about an hour responding to questions,
gathering information, and making arrangements with the district and school administrations. In
addition, the food service managers briefed their kitchen staffs on the purpose of the project.
During the on-site data collection, the food service manager in New Jersey spent 15 or 20
minutes a day with the observers. The managers in Maryland and Pennsylvania each spent
between one and three hours a day. However, the Pennsylvania manager perceived the data
collection to be no burden: “We worked well together.” At each school, food preparation staff
were involved in about 30 minutes of discussion each data collection day to collect details about
ingredients and portion sizes. School administrators, responding to questions about contracting
arrangements for vending machines, spent 30 minutes or less providing information prior to the
visit. Other school personnel were not involved in either preparations or data collection and
were not burdened or even affected by the study.
At the district level, the supervisor for the Maryland high school commented that “overall,
the visit went smoothly and was not burdensome,” and the director of food service in the New
Jersey district reported she spent a total of 45 minutes on matters related to the data collection.
27
III. DATA FILE DEVELOPMENT
Once the data on foods bought at the three schools had been collected, the next step was to
process this information and develop data files suitable for analysis. This chapter describes this
work. Section A summarizes the procedures used to estimate the nutrient content of the foods
bought. Section B describes the construction of the weights which were placed on the file and
used in the analysis, and Section C describes the actual analysis file development process.
A. FIAS SYSTEM AND DATA ENTRY
Data on foods purchased were converted to nutrient content data with the Food Intake
Analysis System© 3.99 (FIAS). FIAS, developed by The University of Texas-Houston Health
Science Center and the U.S. Department of Agriculture (USDA), Agricultural Research Service
(ARS), is a DOS-based application designed to facilitate nutrient analysis of dietary data. It is
widely used in nutrient coding of food-related survey data.
Trained coders entered the data from the Transaction Observation Forms into the FIAS
software. A total of 2,905 food items were entered across the three schools—1,027 items were
entered for the middle school in Pennsylvania, 1,093 for the high school in New Jersey, and 785
for the high school in Maryland. The program then used the information on foods and portion
sizes to calculate the nutrient content of each food selected. After the nutrient analysis was
completed, FIAS produced ASCII files containing food codes and nutrients for each food
selected during each transaction or on each tray. Steps in this process are outlined below.
28
1. Initial Data Review
The observation forms were sent to MPR’s Washington, DC, office for nutrient coding. The
forms were logged in and reviewed for completeness by project staff under the guidance of
Dr. Ronette Briefel, the senior project nutritionist.
2. Coding Guidelines
The coders used guidelines adapted from the recently-completed Summer Food Service
Program study conducted by MPR for USDA (Gordon et al. 2003). Essentially, FIAS’s menu-
driven procedures were used to assign a food code and determine a serving weight for each food
item in each transaction. To make decisions about which FIAS codes to assign to individual
foods, the coders relied on information from recipes and package labels sent in by field
observers, the coding guidelines, and consultations with the project’s nutritionist. The coding
used the standard FIAS coding conventions, as outlined in the FIAS manual and as embodied in
its interactive software.
Some food items commonly used in school lunches are not in the FIAS database. In order to
accommodate these foods, “recipes” were constructed within the FIAS software. To illustrate
how this worked, consider an example. FIAS does not include 1 percent chocolate milk in the
database. However, this food item is commonly used at schools. Therefore, the project staff
coded 1 percent chocolate milk as the recipe, “chocolate syrup, low-fat milk added.” An
alternative would be to use FIAS’s “Not Further Specified” (NFS) option, which was used when
the information on a particular food was extremely limited. However, this option would result in
the loss of important data, and the recipe approach provided a sufficiently accurate nutrient
profile.
29
3. Quality Assurance Procedures for Coding Work
Several steps were taken to ensure the quality of the food and nutrient coding. All forms
were reviewed for content and completeness by the coders and/or by one of the project’s analysts
under the direction of the project nutritionist. Coders were instructed to flag and attach notes to
items that raised questions. The project nutritionist reviewed the notes, resolved problems,
answered questions, and reviewed the FIAS data for the first site, representing over one-third of
the foods entered. She also reviewed a random selection of data from the remaining two sites.
After all data were entered and reviewed, errors flagged by FIAS were reviewed and corrected,
as appropriate.
Finally, to capture any errors that escaped FIAS’s flagging procedure, the project analyst
and nutritionist checked the output and reviewed outliers in the distributions of energy, Vitamin
A, Vitamin C, calcium, and iron. The records with the highest percentages of total fat were also
checked manually. Corrections were made as warranted, based on the available information.
B. WEIGHTING THE DATA
To support the data analysis, we prepared a set of survey weights to account for (1) the
differential probabilities of selection associated with selecting POS locations for each of the
observer slots,1 and (2) the interval sampling used in selecting specific transactions from various
POS. (The sampling methods used are discussed in Section II.B.) This section describes how
the analysis weights were computed. Based on the two sampling steps noted above, the
probability of observing a transaction for a given day and time period can be approximated by
the expression given in (1).
1Please see section II.B for a discussion of the ‘observer slot’ concept.
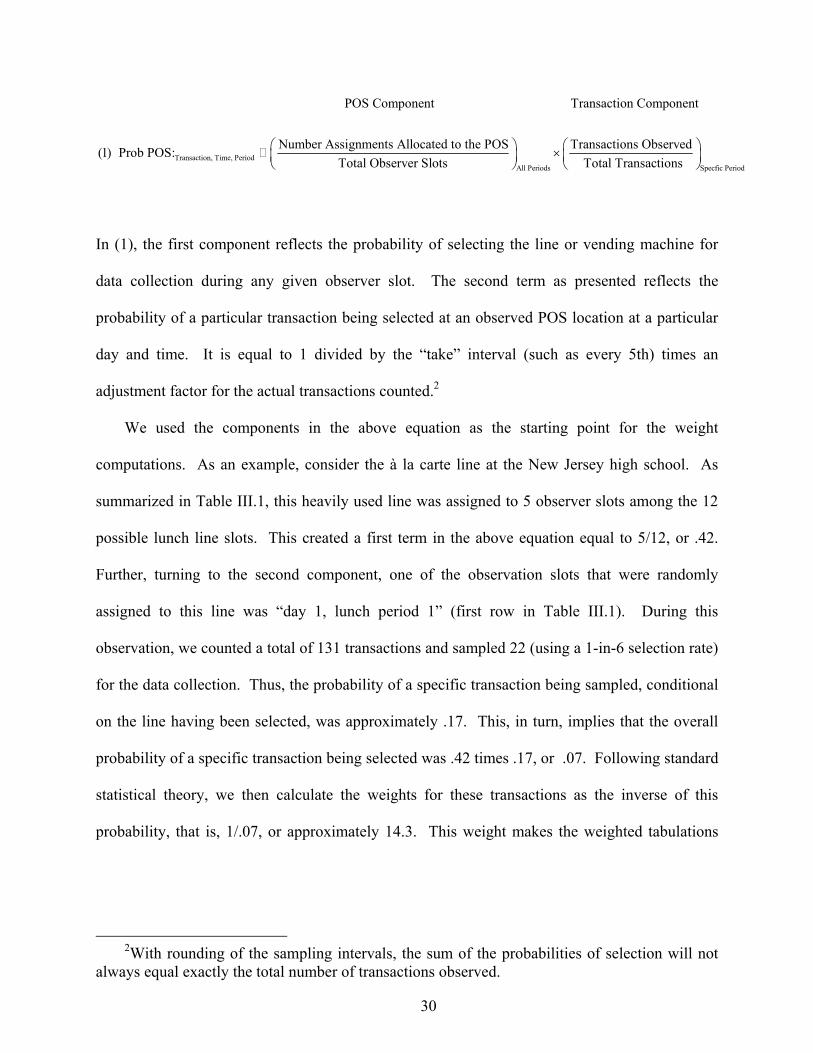
30
Transaction, Time, Period
POS Component Transaction Component
Number Assi(1) Prob POS:All Periods Specfic Period
gnments Allocated to the POS Transactions ObservedTotal Observer Slots Total Transactions
×
In (1), the first component reflects the probability of selecting the line or vending machine for
data collection during any given observer slot. The second term as presented reflects the
probability of a particular transaction being selected at an observed POS location at a particular
day and time. It is equal to 1 divided by the “take” interval (such as every 5th) times an
adjustment factor for the actual transactions counted.2
We used the components in the above equation as the starting point for the weight
computations. As an example, consider the à la carte line at the New Jersey high school. As
summarized in Table III.1, this heavily used line was assigned to 5 observer slots among the 12
possible lunch line slots. This created a first term in the above equation equal to 5/12, or .42.
Further, turning to the second component, one of the observation slots that were randomly
assigned to this line was “day 1, lunch period 1” (first row in Table III.1). During this
observation, we counted a total of 131 transactions and sampled 22 (using a 1-in-6 selection rate)
for the data collection. Thus, the probability of a specific transaction being sampled, conditional
on the line having been selected, was approximately .17. This, in turn, implies that the overall
probability of a specific transaction being selected was .42 times .17, or .07. Following standard
statistical theory, we then calculate the weights for these transactions as the inverse of this
probability, that is, 1/.07, or approximately 14.3. This weight makes the weighted tabulations
2With rounding of the sampling intervals, the sum of the probabilities of selection will not
always equal exactly the total number of transactions observed.
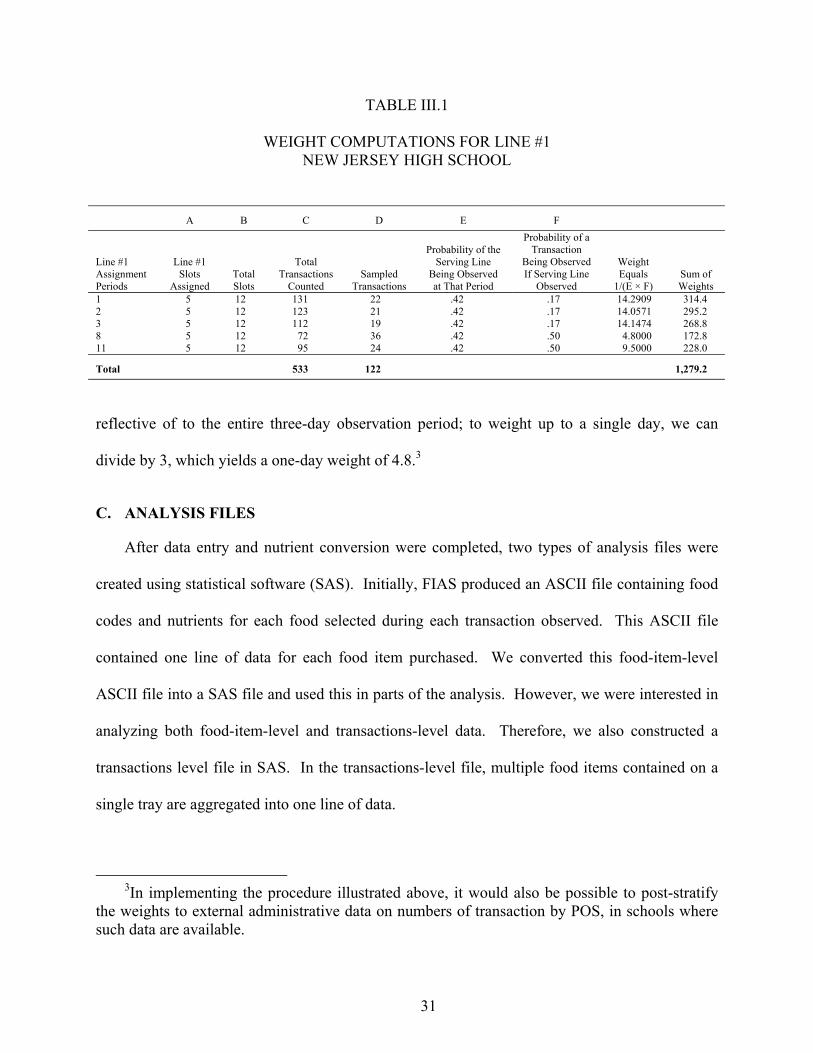
31
TABLE III.1
WEIGHT COMPUTATIONS FOR LINE #1 NEW JERSEY HIGH SCHOOL
A B C D E F
Line #1 Assignment Periods
Line #1 Slots
Assigned Total Slots
Total Transactions
Counted Sampled
Transactions
Probability of the Serving Line
Being Observed at That Period
Probability of a Transaction
Being Observed If Serving Line
Observed
Weight Equals
1/(E × F) Sum of Weights
1 5 12 131 22 .42 .17 14.2909 314.4 2 5 12 123 21 .42 .17 14.0571 295.2 3 5 12 112 19 .42 .17 14.1474 268.8 8 5 12 72 36 .42 .50 4.8000 172.8 11 5 12 95 24 .42 .50 9.5000 228.0
Total 533 122 1,279.2
reflective of to the entire three-day observation period; to weight up to a single day, we can
divide by 3, which yields a one-day weight of 4.8.3
C. ANALYSIS FILES
After data entry and nutrient conversion were completed, two types of analysis files were
created using statistical software (SAS). Initially, FIAS produced an ASCII file containing food
codes and nutrients for each food selected during each transaction observed. This ASCII file
contained one line of data for each food item purchased. We converted this food-item-level
ASCII file into a SAS file and used this in parts of the analysis. However, we were interested in
analyzing both food-item-level and transactions-level data. Therefore, we also constructed a
transactions level file in SAS. In the transactions-level file, multiple food items contained on a
single tray are aggregated into one line of data.
3In implementing the procedure illustrated above, it would also be possible to post-stratify
the weights to external administrative data on numbers of transaction by POS, in schools where such data are available.
33
IV. ILLUSTRATIVE STATISTICAL RESULTS
Tabulations of the data collected at the three schools included in this feasibility study
provide a way of examining the reasonableness of data collected using the point of sale (POS)
methodology. Analysis of these data can also illustrate the types of analysis that could be done
in the context of a larger study. In this chapter, we examine the data collected at the three sites.
Before presenting the data, we must note some limitations that stem largely from the nature
of the current research. In particular, because this was meant as a prototype study, we have
collected detailed data only in three schools. As a result, the findings cannot reasonably be
generalized to the population of all school food service operations or to any other population of
interest. Indeed, in our analysis we present the results separately by school, rather than in
aggregate, to emphasize this point about lack of generalizability. Furthermore, even within each
school, the findings reflect food use only during three consecutive days and at a specific point of
the school year.
Despite these limitations, we believe that our tabulations provide useful insights both into
the quality of the data collected and into the types of analysis that could be conducted if the POS
methodology were applied to a more representative sample of schools. Section A describes the
sites themselves. Section B provides a description of the place of competitive foods within the
overall context of all foods sold at the school. Section C discusses the types of competitive foods
sold, while Section D summarizes their nutrient content. The chapter concludes in Section E
with an examination of some particular issues involving the use of vending machines.
A. DESCRIPTION OF SCHOOLS
The study gathered data from three purposively selected secondary schools, all of which
were large enough to provide adequate samples of transactions: a high school in Maryland, a
34
high school in New Jersey, and a middle school in Pennsylvania. Descriptive characteristics of
these three schools are presented in Table IV.1. Each of the two high schools served over 2,000
students. In the high schools, 2 percent or fewer of enrolled students were eligible for free or
reduced-price meals. The middle school served a little over 1,300 students, of which 25 percent
were eligible for free or reduced-price meals.
All three schools were in urban or suburban locations, but all had closed campuses.
Therefore, students could not leave school grounds during lunch periods and were limited either
to bringing their lunch or to purchasing food or snack items from the cafeteria or vending
machines. The two high schools offered breakfast, while the middle school offered only lunch.
Based on the size of the schools, it is not surprising that they all offered multiple lunch periods—
two schools had three lunch periods and one had four. The food service operations at all three
schools were managed at the district level rather than by an outside vendor.
The three schools offered a variety of sources of competitive foods, including cafeteria à la
carte items and vending machine snacks and beverages. Table IV.2 outlines the availability of
competitive foods at the three schools. All three offered a variety of à la carte items in the
cafeteria. For instance, the high school in Maryland sold juice drinks, french fries (separately
from reimbursable meals), a variety of chips and baked goods, ice cream products, and other
items in the cafeteria during lunch periods. The other schools offered all or most of these items
as well.
Students could also purchase competitive food items from vending machines in the schools.
The two high schools offered beverages and snacks in their vending machines, while the middle
school machines offered only beverages. The number of vending machines in each school varied
from 3 in the middle school to 15 in the high school in Maryland. (Section E contains a detailed
discussion of the vending machines.)
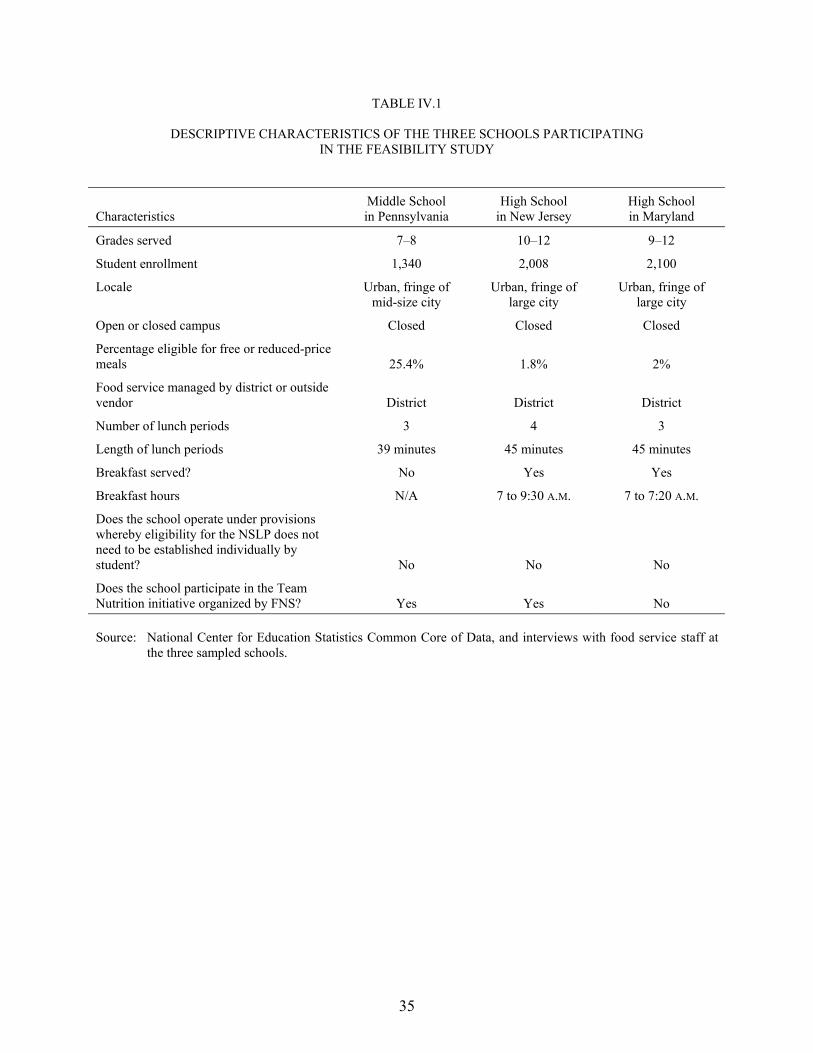
35
TABLE IV.1
DESCRIPTIVE CHARACTERISTICS OF THE THREE SCHOOLS PARTICIPATING IN THE FEASIBILITY STUDY
Characteristics Middle School in Pennsylvania
High School in New Jersey
High School in Maryland
Grades served 7–8 10–12 9–12
Student enrollment 1,340 2,008 2,100
Locale Urban, fringe of mid-size city
Urban, fringe of large city
Urban, fringe of large city
Open or closed campus Closed Closed Closed
Percentage eligible for free or reduced-price meals 25.4% 1.8% 2%
Food service managed by district or outside vendor District District District
Number of lunch periods 3 4 3
Length of lunch periods 39 minutes 45 minutes 45 minutes
Breakfast served? No Yes Yes
Breakfast hours N/A 7 to 9:30 A.M. 7 to 7:20 A.M.
Does the school operate under provisions whereby eligibility for the NSLP does not need to be established individually by student? No No No
Does the school participate in the Team Nutrition initiative organized by FNS? Yes Yes No
Source: National Center for Education Statistics Common Core of Data, and interviews with food service staff at
the three sampled schools.
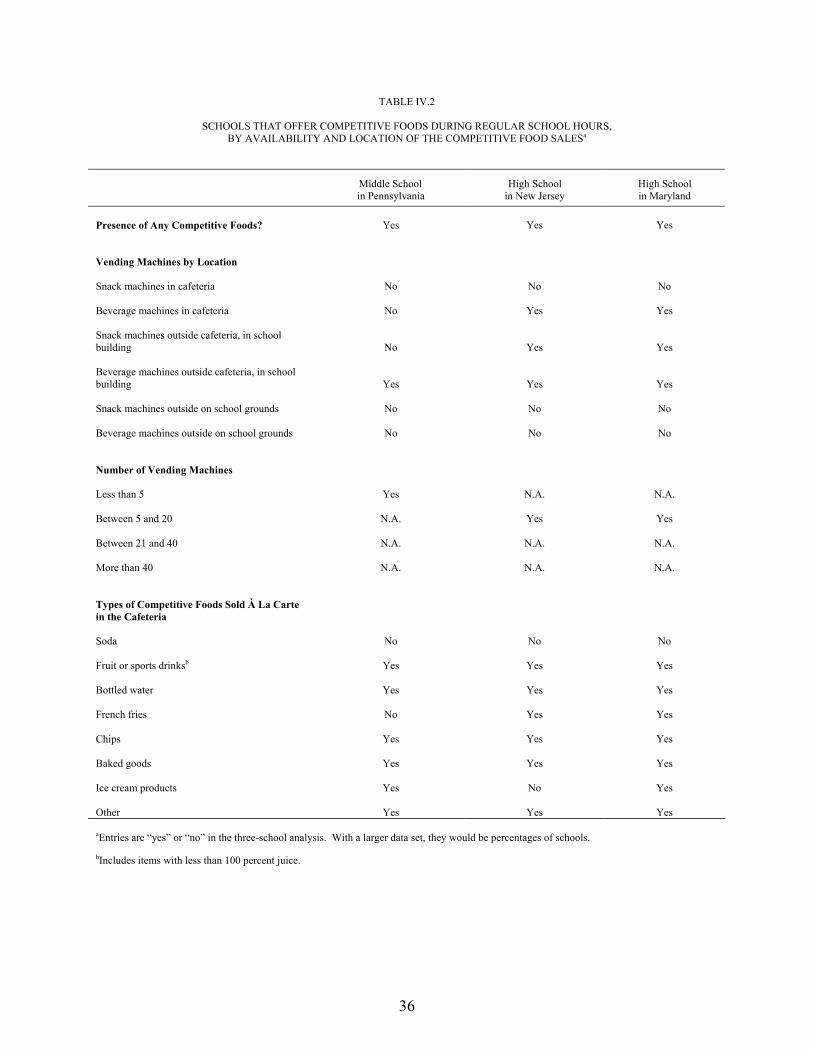
36
TABLE IV.2
SCHOOLS THAT OFFER COMPETITIVE FOODS DURING REGULAR SCHOOL HOURS, BY AVAILABILITY AND LOCATION OF THE COMPETITIVE FOOD SALESa
Middle School in Pennsylvania
High School in New Jersey
High School in Maryland
Presence of Any Competitive Foods? Yes
Yes
Yes
Vending Machines by Location Snack machines in cafeteria No No No Beverage machines in cafeteria No Yes Yes Snack machines outside cafeteria, in school building
No
Yes
Yes
Beverage machines outside cafeteria, in school building
Yes
Yes Yes
Snack machines outside on school grounds No No No Beverage machines outside on school grounds No No No Number of Vending Machines Less than 5
Yes
N.A.
N.A.
Between 5 and 20 N.A.
Yes
Yes
Between 21 and 40
N.A.
N.A.
N.A.
More than 40
N.A.
N.A.
N.A.
Types of Competitive Foods Sold À La Carte in the Cafeteria Soda
No
No
No
Fruit or sports drinksb
Yes
Yes
Yes
Bottled water
Yes
Yes
Yes
French fries
No
Yes
Yes
Chips
Yes
Yes
Yes
Baked goods
Yes
Yes
Yes
Ice cream products
Yes
No
Yes
Other
Yes
Yes
Yes
aEntries are “yes” or “no” in the three-school analysis. With a larger data set, they would be percentages of schools.
bIncludes items with less than 100 percent juice.
37
B. PATTERNS OF COMPETITIVE FOOD PURCHASES IN THE THREE SCHOOLS
This section examines the extent to which students at the three schools were selecting
competitive foods, as compared to reimbursable meals. Parts of the analysis are based on
transactions, which are defined as the set of foods and beverages that a student bought at the
same time (intuitively, all the foods and beverages on the lunch tray). Other parts focus on food
items, which are the individual foods and beverages bought.
Table IV.3 examines the proportion of cafeteria line transactions that include reimbursable
meals versus à la carte items selected during lunchtime. Approximately 19 percent of the
cafeteria line transactions in Maryland included reimbursable meals (and sometimes à la carte
items as well), while more than 80 percent involved only à la carte items. (About 9 percent
involved both reimbursable and competitive foods.) In New Jersey and Pennsylvania, where all
observed transactions were either exclusively reimbursable items or exclusively à la carte food
items, 50.9 percent of transactions in Pennsylvania and 72.2 percent in New Jersey were à la
carte foods.
The lower percentage of à la carte transactions in the Pennsylvania middle school compared
to the other schools may reflect both economic factors and the age of the students. In particular,
students in the Pennsylvania school may not have as much disposable income with which to
purchase these items as do students in the other schools. In the Pennsylvania school, about one-
fourth of students receive free or reduced-price lunch as compared to 2 percent or less of students
in Maryland and New Jersey (see Table IV.1). Also, middle school students are less likely to
have part-time jobs and, as a result, may have less disposable income than high school students.
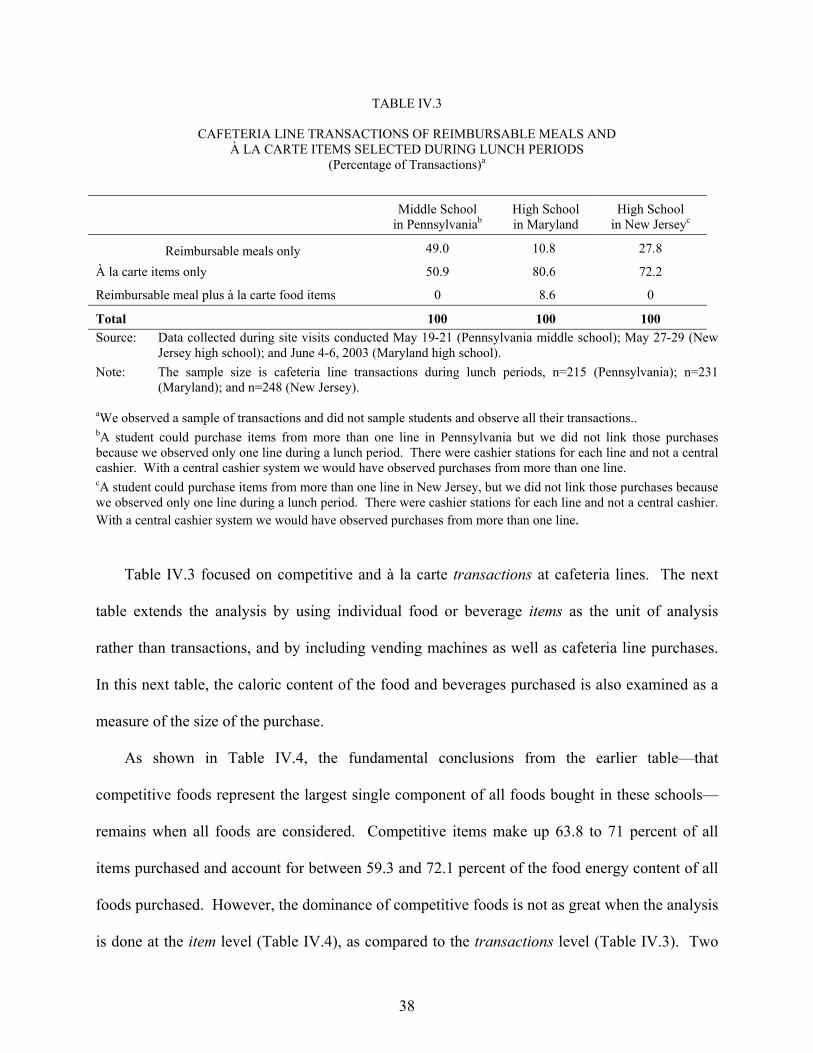
38
TABLE IV.3
CAFETERIA LINE TRANSACTIONS OF REIMBURSABLE MEALS AND À LA CARTE ITEMS SELECTED DURING LUNCH PERIODS
(Percentage of Transactions)a
Middle School
in Pennsylvaniab High School in Maryland
High School in New Jerseyc
Reimbursable meals only 49.0 10.8 27.8
À la carte items only 50.9 80.6 72.2
Reimbursable meal plus à la carte food items 0 8.6 0
Total 100 100 100 Source: Data collected during site visits conducted May 19-21 (Pennsylvania middle school); May 27-29 (New
Jersey high school); and June 4-6, 2003 (Maryland high school). Note: The sample size is cafeteria line transactions during lunch periods, n=215 (Pennsylvania); n=231
(Maryland); and n=248 (New Jersey). aWe observed a sample of transactions and did not sample students and observe all their transactions.. bA student could purchase items from more than one line in Pennsylvania but we did not link those purchases because we observed only one line during a lunch period. There were cashier stations for each line and not a central cashier. With a central cashier system we would have observed purchases from more than one line. cA student could purchase items from more than one line in New Jersey, but we did not link those purchases because we observed only one line during a lunch period. There were cashier stations for each line and not a central cashier. With a central cashier system we would have observed purchases from more than one line.
Table IV.3 focused on competitive and à la carte transactions at cafeteria lines. The next
table extends the analysis by using individual food or beverage items as the unit of analysis
rather than transactions, and by including vending machines as well as cafeteria line purchases.
In this next table, the caloric content of the food and beverages purchased is also examined as a
measure of the size of the purchase.
As shown in Table IV.4, the fundamental conclusions from the earlier table—that
competitive foods represent the largest single component of all foods bought in these schools—
remains when all foods are considered. Competitive items make up 63.8 to 71 percent of all
items purchased and account for between 59.3 and 72.1 percent of the food energy content of all
foods purchased. However, the dominance of competitive foods is not as great when the analysis
is done at the item level (Table IV.4), as compared to the transactions level (Table IV.3). Two
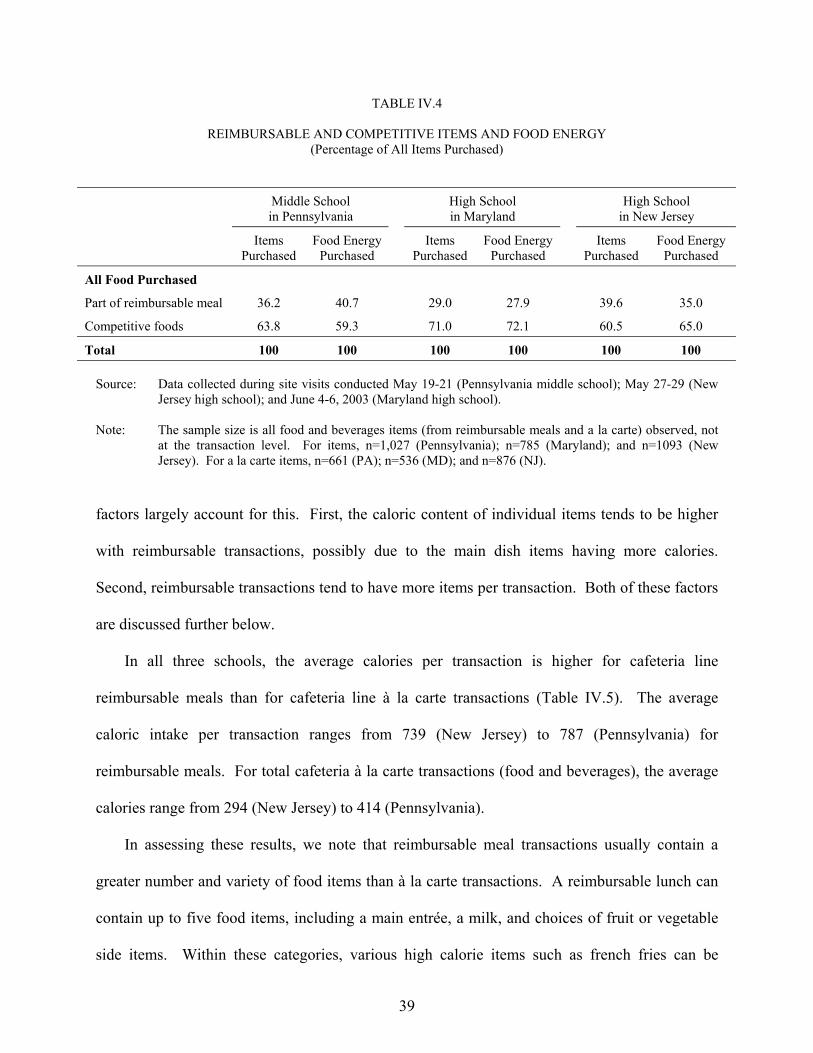
39
TABLE IV.4
REIMBURSABLE AND COMPETITIVE ITEMS AND FOOD ENERGY (Percentage of All Items Purchased)
Middle School in Pennsylvania
High School in Maryland
High School in New Jersey
Items Purchased
Food Energy Purchased
Items Purchased
Food Energy Purchased
Items Purchased
Food Energy Purchased
All Food Purchased
Part of reimbursable meal 36.2 40.7 29.0 27.9 39.6 35.0
Competitive foods 63.8 59.3 71.0 72.1 60.5 65.0
Total 100 100 100 100 100 100 Source: Data collected during site visits conducted May 19-21 (Pennsylvania middle school); May 27-29 (New
Jersey high school); and June 4-6, 2003 (Maryland high school). Note: The sample size is all food and beverages items (from reimbursable meals and a la carte) observed, not
at the transaction level. For items, n=1,027 (Pennsylvania); n=785 (Maryland); and n=1093 (New Jersey). For a la carte items, n=661 (PA); n=536 (MD); and n=876 (NJ).
factors largely account for this. First, the caloric content of individual items tends to be higher
with reimbursable transactions, possibly due to the main dish items having more calories.
Second, reimbursable transactions tend to have more items per transaction. Both of these factors
are discussed further below.
In all three schools, the average calories per transaction is higher for cafeteria line
reimbursable meals than for cafeteria line à la carte transactions (Table IV.5). The average
caloric intake per transaction ranges from 739 (New Jersey) to 787 (Pennsylvania) for
reimbursable meals. For total cafeteria à la carte transactions (food and beverages), the average
calories range from 294 (New Jersey) to 414 (Pennsylvania).
In assessing these results, we note that reimbursable meal transactions usually contain a
greater number and variety of food items than à la carte transactions. A reimbursable lunch can
contain up to five food items, including a main entrée, a milk, and choices of fruit or vegetable
side items. Within these categories, various high calorie items such as french fries can be
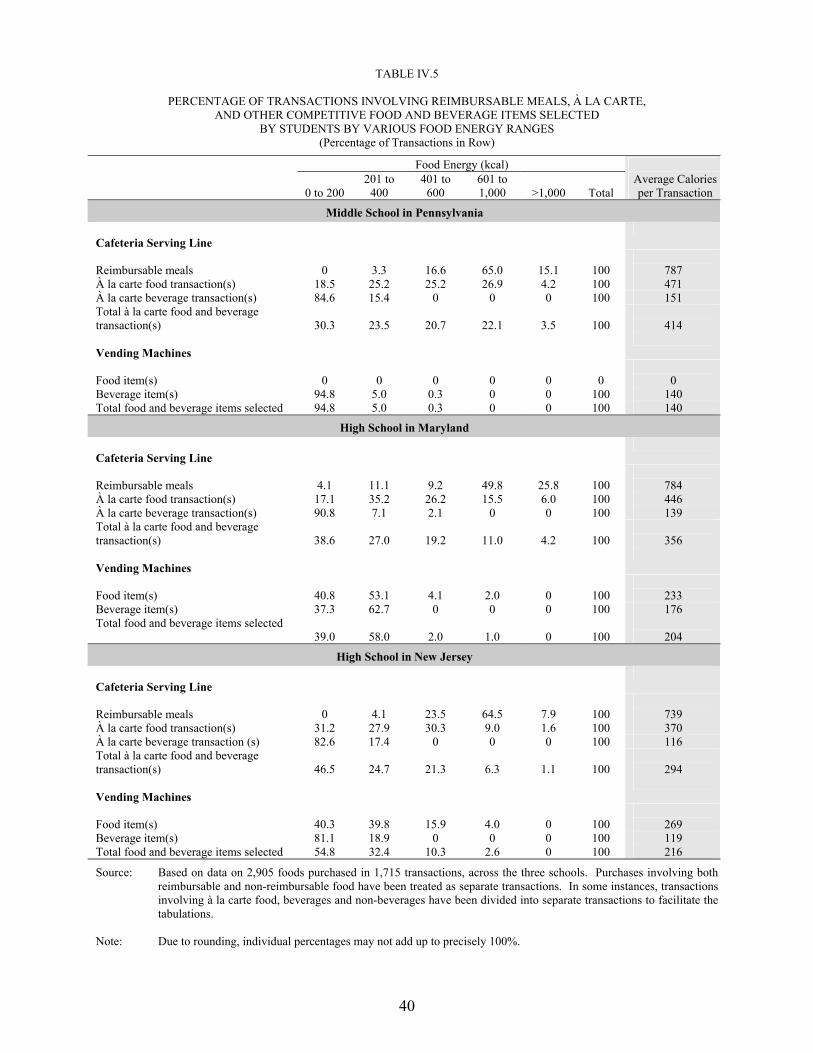
40
TABLE IV.5
PERCENTAGE OF TRANSACTIONS INVOLVING REIMBURSABLE MEALS, À LA CARTE, AND OTHER COMPETITIVE FOOD AND BEVERAGE ITEMS SELECTED
BY STUDENTS BY VARIOUS FOOD ENERGY RANGES (Percentage of Transactions in Row)
Food Energy (kcal)
0 to 200 201 to
400 401 to
600 601 to 1,000 >1,000 Total
Average Caloriesper Transaction
Middle School in Pennsylvania Cafeteria Serving Line
Reimbursable meals 0 3.3 16.6 65.0 15.1 100
787
À la carte food transaction(s) 18.5 25.2 25.2 26.9 4.2 100 471 À la carte beverage transaction(s) 84.6 15.4 0 0 0 100 151 Total à la carte food and beverage transaction(s) 30.3 23.5 20.7 22.1 3.5 100
414
Vending Machines
Food item(s) 0 0 0 0 0 0
0
Beverage item(s) 94.8 5.0 0.3 0 0 100 140 Total food and beverage items selected 94.8 5.0 0.3 0 0 100 140
High School in Maryland Cafeteria Serving Line
Reimbursable meals 4.1 11.1 9.2 49.8 25.8 100
784
À la carte food transaction(s) 17.1 35.2 26.2 15.5 6.0 100 446 À la carte beverage transaction(s) 90.8 7.1 2.1 0 0 100 139 Total à la carte food and beverage transaction(s) 38.6 27.0 19.2 11.0 4.2 100
356
Vending Machines
Food item(s) 40.8 53.1 4.1 2.0 0 100
233
Beverage item(s) 37.3 62.7 0 0 0 100 176 Total food and beverage items selected
39.0 58.0 2.0 1.0 0 100
204
High School in New Jersey Cafeteria Serving Line
Reimbursable meals 0 4.1 23.5 64.5 7.9 100
739
À la carte food transaction(s) 31.2 27.9 30.3 9.0 1.6 100 370 À la carte beverage transaction (s) 82.6 17.4 0 0 0 100 116 Total à la carte food and beverage transaction(s) 46.5 24.7 21.3 6.3 1.1 100
294
Vending Machines
Food item(s) 40.3 39.8 15.9 4.0 0 100
269
Beverage item(s) 81.1 18.9 0 0 0 100 119 Total food and beverage items selected 54.8 32.4 10.3 2.6 0 100 216
Source: Based on data on 2,905 foods purchased in 1,715 transactions, across the three schools. Purchases involving both reimbursable and non-reimbursable food have been treated as separate transactions. In some instances, transactions involving à la carte food, beverages and non-beverages have been divided into separate transactions to facilitate the tabulations.
Note: Due to rounding, individual percentages may not add up to precisely 100%.
41
included. Across the three schools, a reimbursable lunch included an average of 4.0 to 4.3 items,
while an à la carte transaction included 1.6 to 2.3 items (not shown in the table).
Table IV.5 also indicates that, among competitive food sales, students are generally deriving
lower average amounts of calories from vending machine transactions than cafeteria line à la
carte transactions. The average calories per vending machine transaction ranged from 140
(Pennsylvania) to 216 (New Jersey).
New Jersey students are receiving approximately twice as many average calories from
vending machine food items than beverage items. In Maryland, however, vending machine
beverage items contained more calories on average than vending machine food items. One
potential explanation is that the vending machines selling beverages in the Maryland school
include predominantly 20-ounce containers of soda and fruit drinks, while the other two schools
at least offered some 12-ounce drinks.
C. TYPES OF FOOD USED
Table IV.6 illustrates the quantities and kinds of competitive foods items students select
during lunchtime. The most popular item during lunchtime in the Pennsylvania school was soda
(69.4), compared to breads and grains in New Jersey (19.8) and fruit drinks Maryland (21.8).1 In
the Pennsylvania school, vending machines2 containing soda and iced tea were available to
students only during lunchtime. In the Maryland school, students frequently selected fruit drinks
such as Gatorade and Fruitopia. French fries were also a popular choice in the Maryland (18.3)
and New Jersey (12.1) schools. Other competitive food items selected frequently during
1Percentages in the table total to more than 100, because food items within a transaction
could fall into multiple categories. 2Vending machines were located outside the cafeteria.
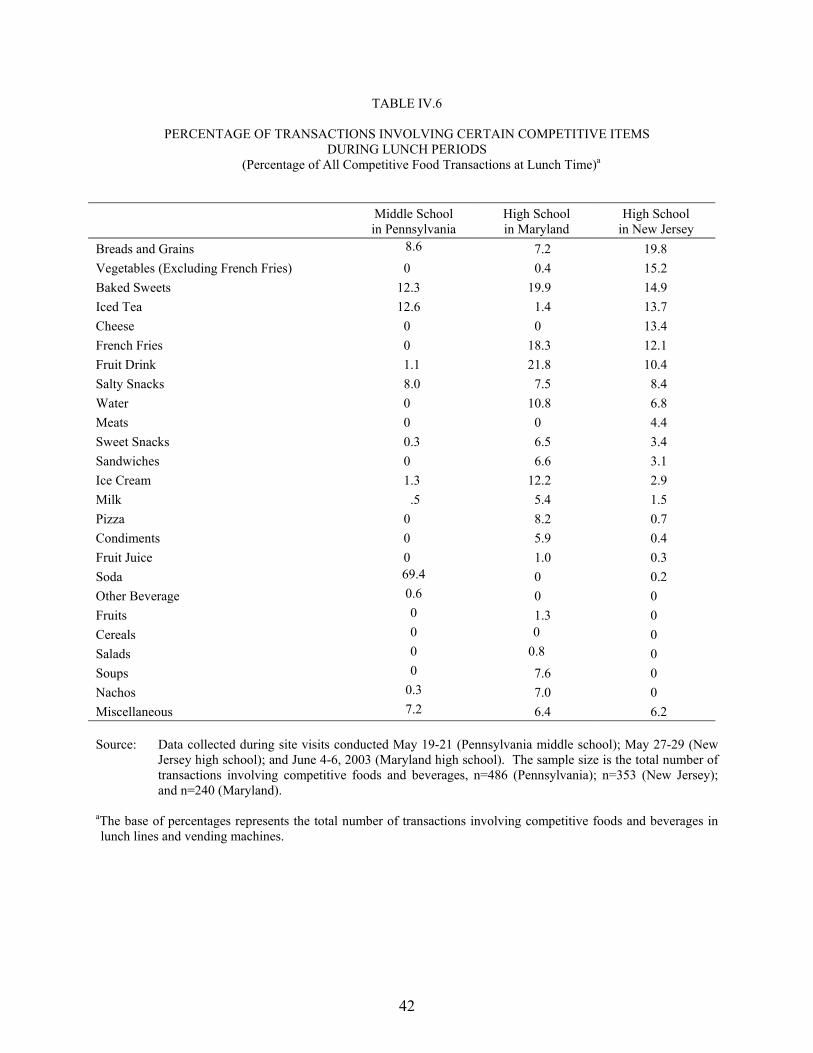
42
TABLE IV.6
PERCENTAGE OF TRANSACTIONS INVOLVING CERTAIN COMPETITIVE ITEMS DURING LUNCH PERIODS
(Percentage of All Competitive Food Transactions at Lunch Time)a
Middle School in Pennsylvania
High School in Maryland
High School in New Jersey
Breads and Grains 8.6 7.2 19.8 Vegetables (Excluding French Fries) 0 0.4 15.2 Baked Sweets 12.3 19.9 14.9 Iced Tea 12.6 1.4 13.7 Cheese 0 0 13.4 French Fries 0 18.3 12.1 Fruit Drink 1.1 21.8 10.4 Salty Snacks 8.0 7.5 8.4 Water 0 10.8 6.8 Meats 0 0 4.4 Sweet Snacks 0.3 6.5 3.4 Sandwiches 0 6.6 3.1 Ice Cream 1.3 12.2 2.9 Milk .5 5.4 1.5 Pizza 0 8.2 0.7 Condiments 0 5.9 0.4 Fruit Juice 0 1.0 0.3 Soda 69.4 0 0.2 Other Beverage 0.6 0 0 Fruits 0 1.3 0 Cereals 0 0 0 Salads 0 0.8 0 Soups 0 7.6 0 Nachos 0.3 7.0 0 Miscellaneous 7.2 6.4 6.2 Source: Data collected during site visits conducted May 19-21 (Pennsylvania middle school); May 27-29 (New
Jersey high school); and June 4-6, 2003 (Maryland high school). The sample size is the total number of transactions involving competitive foods and beverages, n=486 (Pennsylvania); n=353 (New Jersey); and n=240 (Maryland).
aThe base of percentages represents the total number of transactions involving competitive foods and beverages in lunch lines and vending machines.
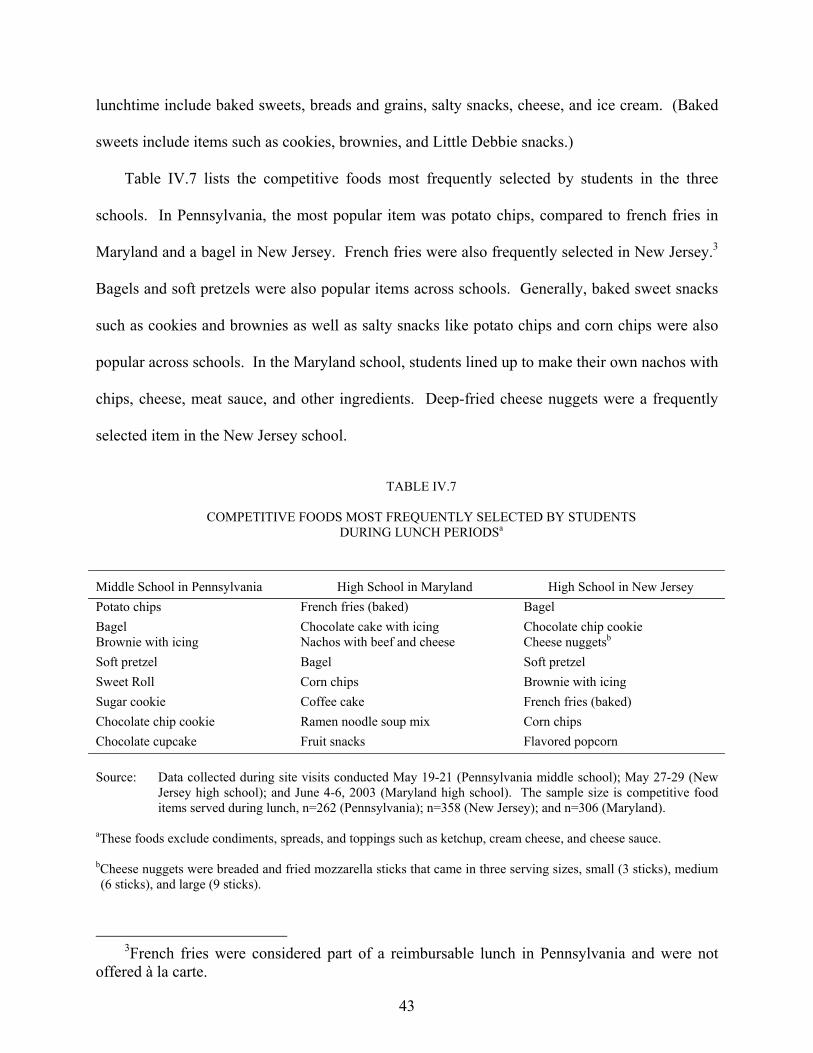
43
lunchtime include baked sweets, breads and grains, salty snacks, cheese, and ice cream. (Baked
sweets include items such as cookies, brownies, and Little Debbie snacks.)
Table IV.7 lists the competitive foods most frequently selected by students in the three
schools. In Pennsylvania, the most popular item was potato chips, compared to french fries in
Maryland and a bagel in New Jersey. French fries were also frequently selected in New Jersey.3
Bagels and soft pretzels were also popular items across schools. Generally, baked sweet snacks
such as cookies and brownies as well as salty snacks like potato chips and corn chips were also
popular across schools. In the Maryland school, students lined up to make their own nachos with
chips, cheese, meat sauce, and other ingredients. Deep-fried cheese nuggets were a frequently
selected item in the New Jersey school.
TABLE IV.7
COMPETITIVE FOODS MOST FREQUENTLY SELECTED BY STUDENTS DURING LUNCH PERIODSa
Middle School in Pennsylvania High School in Maryland High School in New Jersey Potato chips French fries (baked) Bagel Bagel Chocolate cake with icing Chocolate chip cookie Brownie with icing Nachos with beef and cheese Cheese nuggetsb Soft pretzel Bagel Soft pretzel Sweet Roll Corn chips Brownie with icing Sugar cookie Coffee cake French fries (baked) Chocolate chip cookie Ramen noodle soup mix Corn chips Chocolate cupcake Fruit snacks Flavored popcorn Source: Data collected during site visits conducted May 19-21 (Pennsylvania middle school); May 27-29 (New
Jersey high school); and June 4-6, 2003 (Maryland high school). The sample size is competitive food items served during lunch, n=262 (Pennsylvania); n=358 (New Jersey); and n=306 (Maryland).
aThese foods exclude condiments, spreads, and toppings such as ketchup, cream cheese, and cheese sauce. bCheese nuggets were breaded and fried mozzarella sticks that came in three serving sizes, small (3 sticks), medium (6 sticks), and large (9 sticks).
3French fries were considered part of a reimbursable lunch in Pennsylvania and were not
offered à la carte.
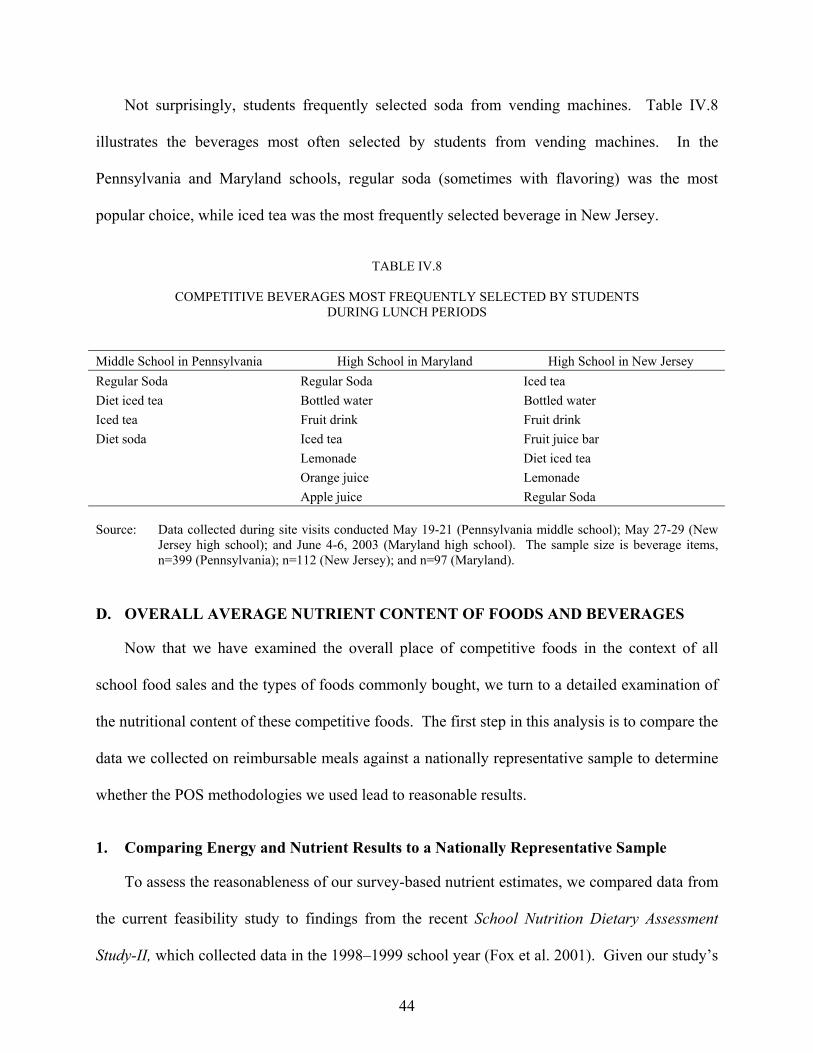
44
Not surprisingly, students frequently selected soda from vending machines. Table IV.8
illustrates the beverages most often selected by students from vending machines. In the
Pennsylvania and Maryland schools, regular soda (sometimes with flavoring) was the most
popular choice, while iced tea was the most frequently selected beverage in New Jersey.
TABLE IV.8
COMPETITIVE BEVERAGES MOST FREQUENTLY SELECTED BY STUDENTS DURING LUNCH PERIODS
Middle School in Pennsylvania High School in Maryland High School in New Jersey Regular Soda Regular Soda Iced tea Diet iced tea Bottled water Bottled water Iced tea Fruit drink Fruit drink Diet soda Iced tea Fruit juice bar Lemonade Diet iced tea Orange juice Lemonade Apple juice Regular Soda Source: Data collected during site visits conducted May 19-21 (Pennsylvania middle school); May 27-29 (New
Jersey high school); and June 4-6, 2003 (Maryland high school). The sample size is beverage items, n=399 (Pennsylvania); n=112 (New Jersey); and n=97 (Maryland).
D. OVERALL AVERAGE NUTRIENT CONTENT OF FOODS AND BEVERAGES
Now that we have examined the overall place of competitive foods in the context of all
school food sales and the types of foods commonly bought, we turn to a detailed examination of
the nutritional content of these competitive foods. The first step in this analysis is to compare the
data we collected on reimbursable meals against a nationally representative sample to determine
whether the POS methodologies we used lead to reasonable results.
1. Comparing Energy and Nutrient Results to a Nationally Representative Sample
To assess the reasonableness of our survey-based nutrient estimates, we compared data from
the current feasibility study to findings from the recent School Nutrition Dietary Assessment
Study-II, which collected data in the 1998–1999 school year (Fox et al. 2001). Given our study’s
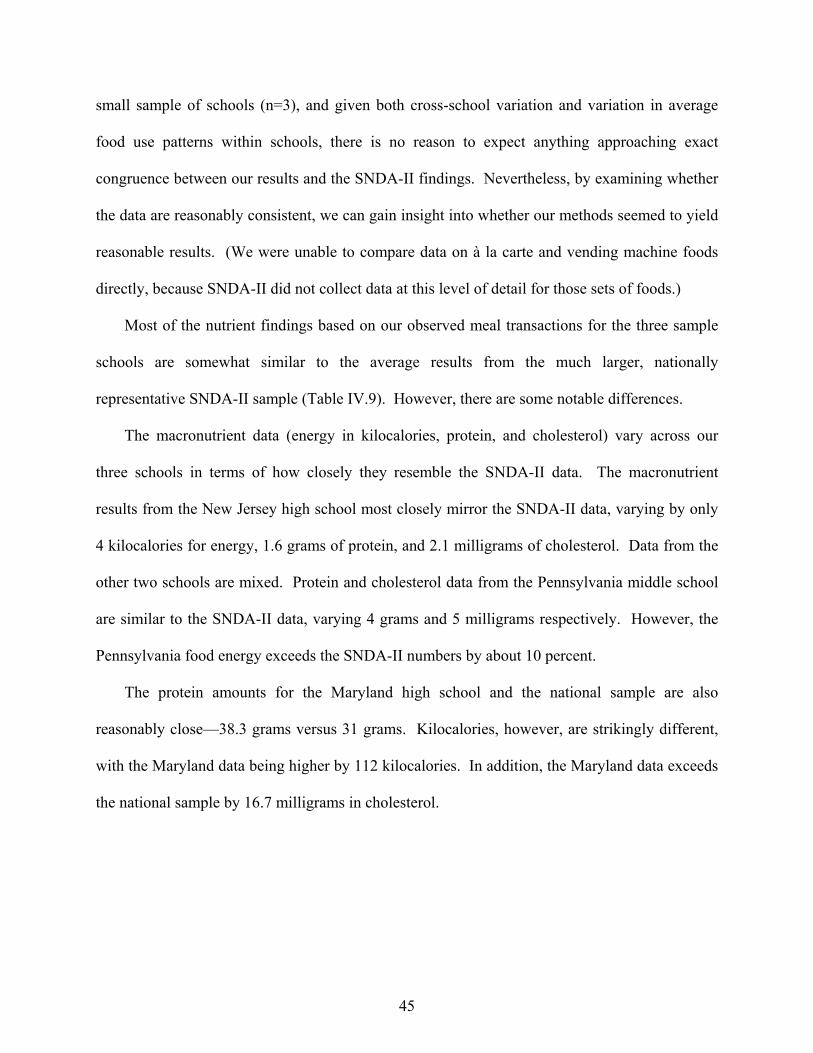
45
small sample of schools (n=3), and given both cross-school variation and variation in average
food use patterns within schools, there is no reason to expect anything approaching exact
congruence between our results and the SNDA-II findings. Nevertheless, by examining whether
the data are reasonably consistent, we can gain insight into whether our methods seemed to yield
reasonable results. (We were unable to compare data on à la carte and vending machine foods
directly, because SNDA-II did not collect data at this level of detail for those sets of foods.)
Most of the nutrient findings based on our observed meal transactions for the three sample
schools are somewhat similar to the average results from the much larger, nationally
representative SNDA-II sample (Table IV.9). However, there are some notable differences.
The macronutrient data (energy in kilocalories, protein, and cholesterol) vary across our
three schools in terms of how closely they resemble the SNDA-II data. The macronutrient
results from the New Jersey high school most closely mirror the SNDA-II data, varying by only
4 kilocalories for energy, 1.6 grams of protein, and 2.1 milligrams of cholesterol. Data from the
other two schools are mixed. Protein and cholesterol data from the Pennsylvania middle school
are similar to the SNDA-II data, varying 4 grams and 5 milligrams respectively. However, the
Pennsylvania food energy exceeds the SNDA-II numbers by about 10 percent.
The protein amounts for the Maryland high school and the national sample are also
reasonably close—38.3 grams versus 31 grams. Kilocalories, however, are strikingly different,
with the Maryland data being higher by 112 kilocalories. In addition, the Maryland data exceeds
the national sample by 16.7 milligrams in cholesterol.
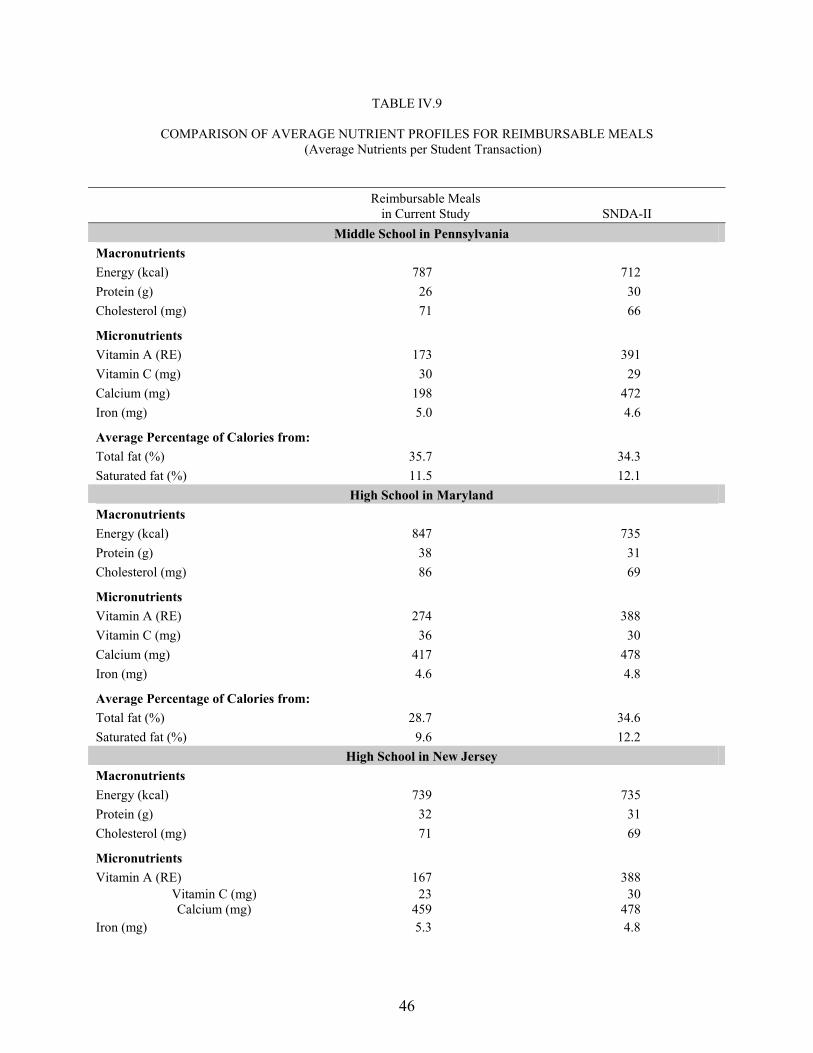
46
TABLE IV.9
COMPARISON OF AVERAGE NUTRIENT PROFILES FOR REIMBURSABLE MEALS (Average Nutrients per Student Transaction)
Reimbursable Meals
in Current Study SNDA-II
Middle School in Pennsylvania Macronutrients Energy (kcal) 787 712 Protein (g) 26 30 Cholesterol (mg) 71 66
Micronutrients
Vitamin A (RE) 173 391 Vitamin C (mg) 30 29 Calcium (mg) 198 472 Iron (mg) 5.0 4.6
Average Percentage of Calories from:
Total fat (%) 35.7 34.3 Saturated fat (%) 11.5 12.1
High School in Maryland Macronutrients Energy (kcal) 847 735 Protein (g) 38 31 Cholesterol (mg) 86 69
Micronutrients
Vitamin A (RE) 274 388 Vitamin C (mg) 36 30 Calcium (mg) 417 478 Iron (mg) 4.6 4.8
Average Percentage of Calories from:
Total fat (%) 28.7 34.6 Saturated fat (%) 9.6 12.2
High School in New Jersey Macronutrients Energy (kcal) 739 735 Protein (g) 32 31 Cholesterol (mg) 71 69
Micronutrients
Vitamin A (RE) 167 388 Vitamin C (mg) 23 30 Calcium (mg) 459 478
Iron (mg) 5.3 4.8
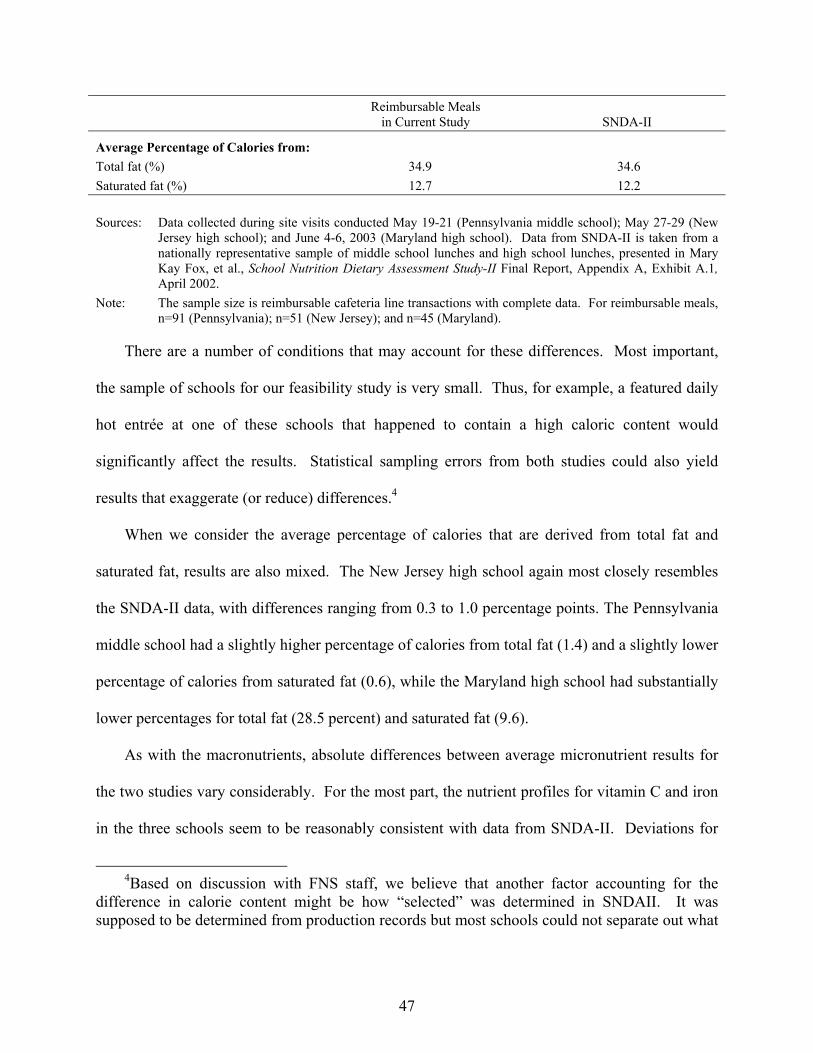
47
Reimbursable Meals
in Current Study SNDA-II
Average Percentage of Calories from:
Total fat (%) 34.9 34.6 Saturated fat (%) 12.7 12.2 Sources: Data collected during site visits conducted May 19-21 (Pennsylvania middle school); May 27-29 (New
Jersey high school); and June 4-6, 2003 (Maryland high school). Data from SNDA-II is taken from a nationally representative sample of middle school lunches and high school lunches, presented in Mary Kay Fox, et al., School Nutrition Dietary Assessment Study-II Final Report, Appendix A, Exhibit A.1, April 2002.
Note: The sample size is reimbursable cafeteria line transactions with complete data. For reimbursable meals, n=91 (Pennsylvania); n=51 (New Jersey); and n=45 (Maryland).
There are a number of conditions that may account for these differences. Most important,
the sample of schools for our feasibility study is very small. Thus, for example, a featured daily
hot entrée at one of these schools that happened to contain a high caloric content would
significantly affect the results. Statistical sampling errors from both studies could also yield
results that exaggerate (or reduce) differences.4
When we consider the average percentage of calories that are derived from total fat and
saturated fat, results are also mixed. The New Jersey high school again most closely resembles
the SNDA-II data, with differences ranging from 0.3 to 1.0 percentage points. The Pennsylvania
middle school had a slightly higher percentage of calories from total fat (1.4) and a slightly lower
percentage of calories from saturated fat (0.6), while the Maryland high school had substantially
lower percentages for total fat (28.5 percent) and saturated fat (9.6).
As with the macronutrients, absolute differences between average micronutrient results for
the two studies vary considerably. For the most part, the nutrient profiles for vitamin C and iron
in the three schools seem to be reasonably consistent with data from SNDA-II. Deviations for
4Based on discussion with FNS staff, we believe that another factor accounting for the
difference in calorie content might be how “selected” was determined in SNDAII. It was supposed to be determined from production records but most schools could not separate out what
48
average vitamin C include 30 versus 29 milligrams (Pennsylvania); 36 versus 30 milligrams
(Maryland); and 23 versus 30 milligrams (New Jersey). Similarly, deviations for iron include
5.0 to 4.6 milligrams; 4.6 versus 4.8 milligrams; and 5.3 versus 4.8.
Results for calcium and vitamin A reveal larger discrepancies, particularly for vitamin A,
across all three schools. For vitamin A, differences between the two studies include 218 RE
(PA), 114 RE (MD), and 221 RE (NJ). Absolute differences in calcium are less pronounced in
the high schools (61.5 milligrams in Maryland and 18.7 for New Jersey), but the average amount
of calcium in reimbursable meals selected at the Pennsylvania middle school is 274.5 milligrams
lower than the average calcium level in SNDA-II (197.5 versus 472 milligrams).
The difference for calcium in the Pennsylvania middle school could be attributable, at least
in part, to the widespread availability and use of soda at that school, which may lead to less milk
consumption. Also, vitamin A tends to be highly concentrated in a few foods, so it is quite
variable across meals. Therefore, the substantial variation for this nutrient is perhaps not
surprising.
Overall, despite some noteworthy differences between the average energy and nutrient
profiles that could be explained primarily by our small sample size, we believe that the majority
of findings from the two studies are comparable enough to suggest that our methodological
approach was reasonably sound. This is consistent with our judgment, discussed in Chapter III,
that the operational processes involved in the data collection went very smoothly and that
observing the school food purchases is no harder—and indeed probably easier—than obtaining
traditional 24-hour dietary intake data.
(continued) was sold a la carte and what was served on reimbursable meals (if the same item was sold in both places).
49
2. Average Energy and Nutrient Contents at the Item Level
The next series of tables present data at the food item level on the average food energy and
key nutrients in items selected by students in the three sampled schools during lunchtime. Table
IV.10 breaks down the data from cafeteria lines according to food and beverage items that were
purchased as components of reimbursable meals and those that were purchased à la carte.
Most of the nutrients in items from reimbursable meals exceed the quantities found in à la
carte items that students selected. At the middle school, almost all macronutrient and all
micronutrient contents in the reimbursable meal items were substantially higher than the amounts
found in à la carte items. At that school, carbohydrates was the only macronutrient that students
derived in greater amounts through the à la carte items.
The distribution of macronutrients between reimbursable and competition food is somewhat
different for the high school observations. Only protein and cholesterol are found in higher
quantities in reimbursable meal items. À la carte items contain slightly higher average quantities
of food energy, total and saturated fats, and carbohydrates (Table IV.10). However, as with the
middle school, reimbursable meal items from the two high schools generally contain higher
average levels of vitamins and minerals than the à la carte items; one exception is that iron at the
New Jersey high school is slightly higher in à la carte items (1.3 milligrams versus 1.2
milligrams).
Turning to the average percentage of calories from total and saturated fat, reimbursable meal
items selected in the Pennsylvania middle school and New Jersey contained a higher proportion
of calories derived from fat than did à la carte transactions. In the Pennsylvania middle school,
reimbursable meal items have 30 percent of calories from total fat and 9.8 percent of calories
from saturated fat, whereas the à la carte items have 13.8 percent of calories from total fat and
5.3 percent of calories from saturated fat. Similarly, in New Jersey, reimbursable meal items
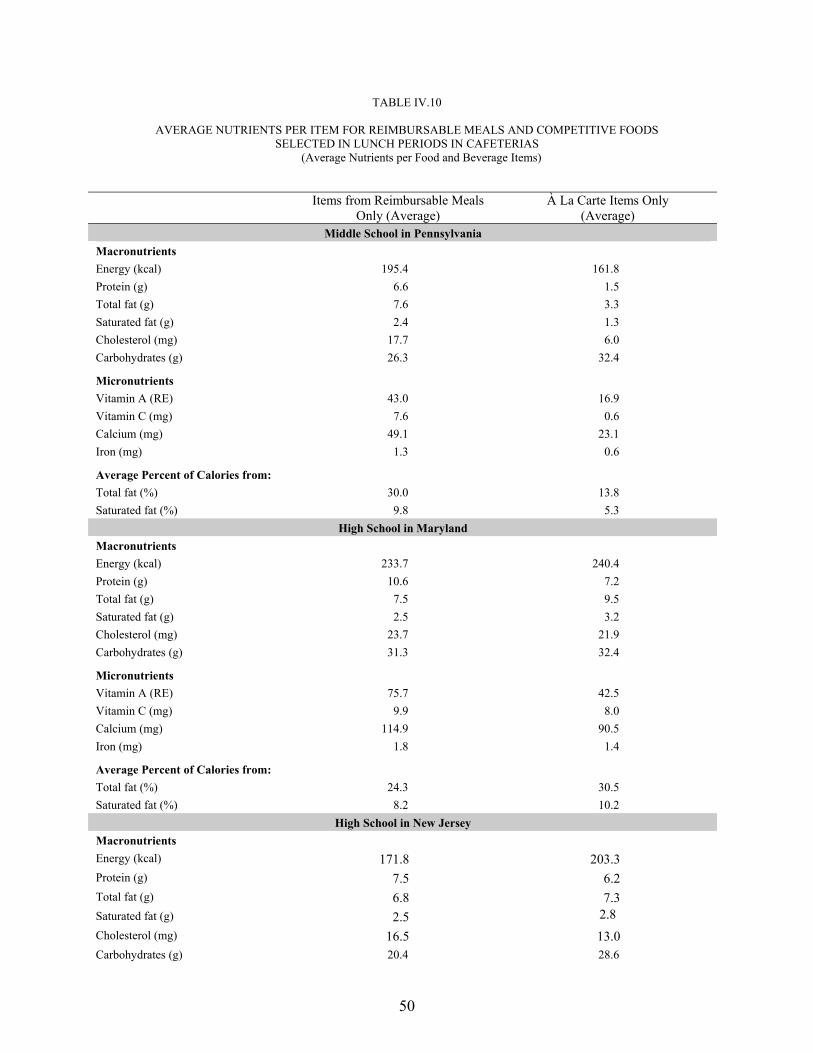
50
TABLE IV.10
AVERAGE NUTRIENTS PER ITEM FOR REIMBURSABLE MEALS AND COMPETITIVE FOODS SELECTED IN LUNCH PERIODS IN CAFETERIAS
(Average Nutrients per Food and Beverage Items)
Items from Reimbursable Meals Only (Average)
À La Carte Items Only (Average)
Middle School in Pennsylvania Macronutrients Energy (kcal) 195.4 161.8 Protein (g) 6.6 1.5 Total fat (g) 7.6 3.3 Saturated fat (g) 2.4 1.3 Cholesterol (mg) 17.7 6.0 Carbohydrates (g) 26.3 32.4
Micronutrients
Vitamin A (RE) 43.0 16.9 Vitamin C (mg) 7.6 0.6 Calcium (mg) 49.1 23.1 Iron (mg) 1.3 0.6
Average Percent of Calories from:
Total fat (%) 30.0 13.8 Saturated fat (%) 9.8 5.3
High School in Maryland Macronutrients Energy (kcal) 233.7 240.4 Protein (g) 10.6 7.2 Total fat (g) 7.5 9.5 Saturated fat (g) 2.5 3.2 Cholesterol (mg) 23.7 21.9 Carbohydrates (g) 31.3 32.4
Micronutrients Vitamin A (RE) 75.7 42.5 Vitamin C (mg) 9.9 8.0 Calcium (mg) 114.9 90.5 Iron (mg) 1.8 1.4
Average Percent of Calories from: Total fat (%) 24.3 30.5 Saturated fat (%) 8.2 10.2
High School in New Jersey Macronutrients Energy (kcal) 171.8 203.3 Protein (g) 7.5 6.2 Total fat (g) 6.8 7.3 Saturated fat (g) 2.5 2.8 Cholesterol (mg) 16.5 13.0 Carbohydrates (g) 20.4 28.6
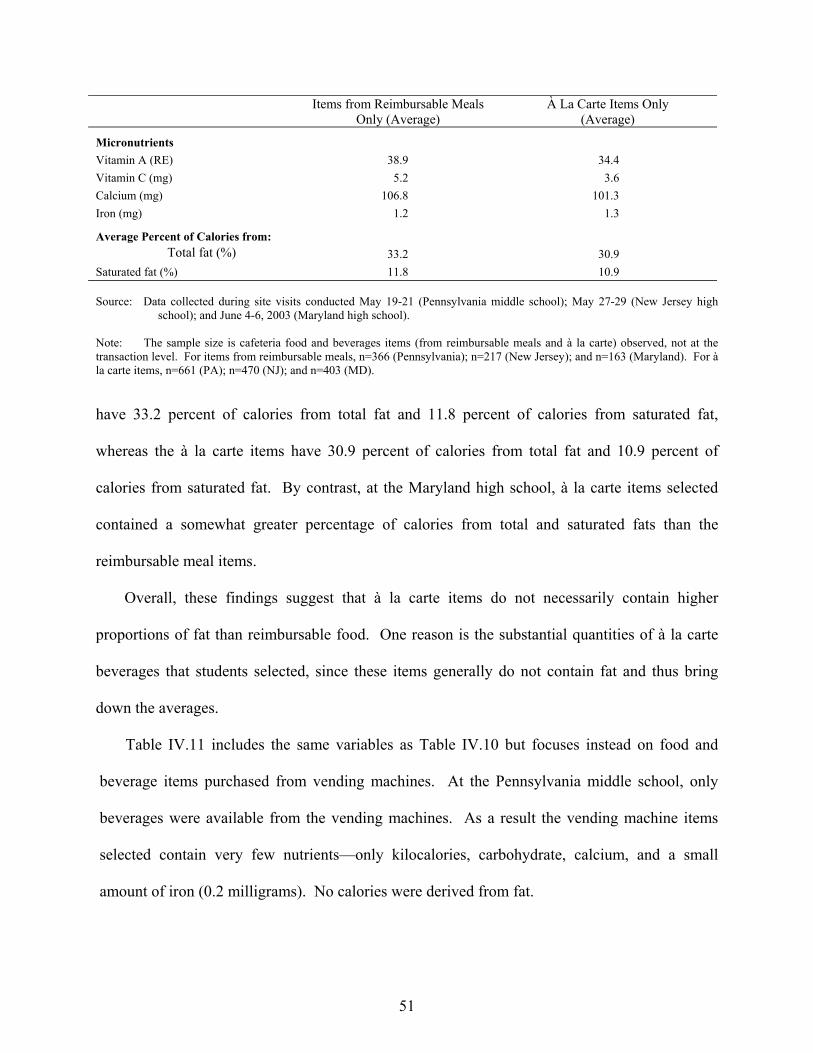
51
Items from Reimbursable Meals Only (Average)
À La Carte Items Only (Average)
Micronutrients
Vitamin A (RE) 38.9 34.4 Vitamin C (mg) 5.2 3.6 Calcium (mg) 106.8 101.3 Iron (mg) 1.2 1.3
Average Percent of Calories from:
Total fat (%) 33.2 30.9 Saturated fat (%) 11.8 10.9 Source: Data collected during site visits conducted May 19-21 (Pennsylvania middle school); May 27-29 (New Jersey high
school); and June 4-6, 2003 (Maryland high school).
Note: The sample size is cafeteria food and beverages items (from reimbursable meals and à la carte) observed, not at the transaction level. For items from reimbursable meals, n=366 (Pennsylvania); n=217 (New Jersey); and n=163 (Maryland). For à la carte items, n=661 (PA); n=470 (NJ); and n=403 (MD). have 33.2 percent of calories from total fat and 11.8 percent of calories from saturated fat,
whereas the à la carte items have 30.9 percent of calories from total fat and 10.9 percent of
calories from saturated fat. By contrast, at the Maryland high school, à la carte items selected
contained a somewhat greater percentage of calories from total and saturated fats than the
reimbursable meal items.
Overall, these findings suggest that à la carte items do not necessarily contain higher
proportions of fat than reimbursable food. One reason is the substantial quantities of à la carte
beverages that students selected, since these items generally do not contain fat and thus bring
down the averages.
Table IV.11 includes the same variables as Table IV.10 but focuses instead on food and
beverage items purchased from vending machines. At the Pennsylvania middle school, only
beverages were available from the vending machines. As a result the vending machine items
selected contain very few nutrients—only kilocalories, carbohydrate, calcium, and a small
amount of iron (0.2 milligrams). No calories were derived from fat.
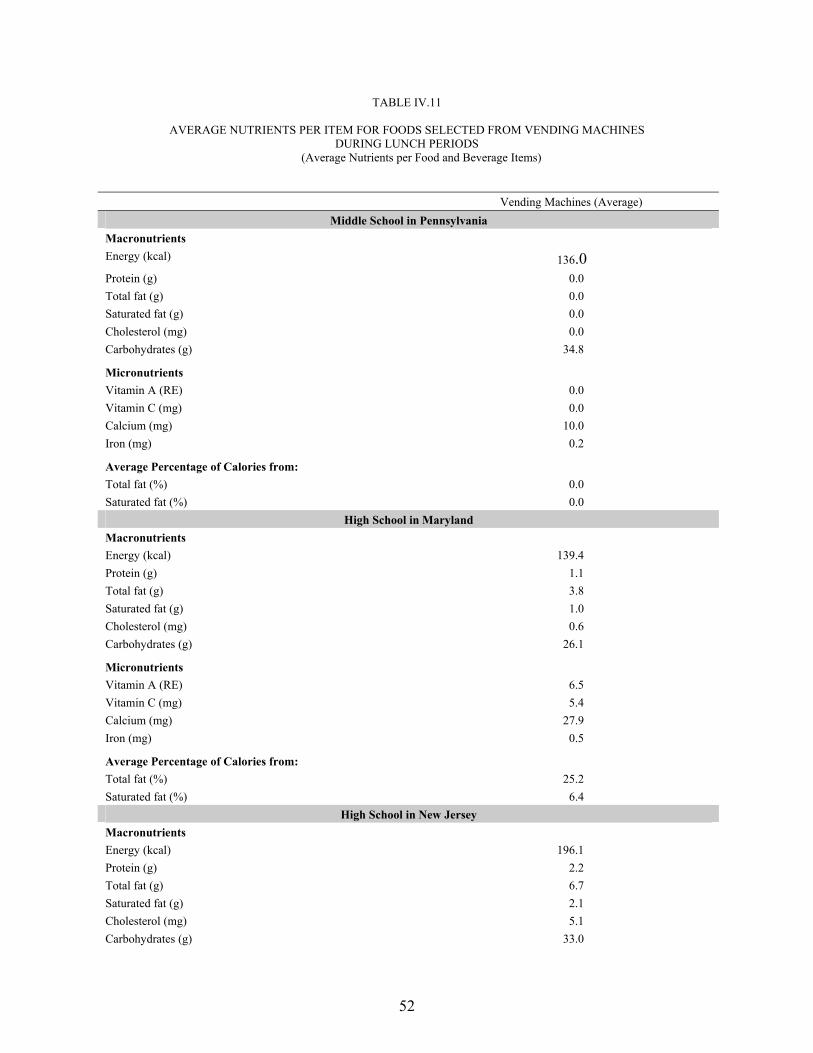
52
TABLE IV.11
AVERAGE NUTRIENTS PER ITEM FOR FOODS SELECTED FROM VENDING MACHINES DURING LUNCH PERIODS
(Average Nutrients per Food and Beverage Items)
Vending Machines (Average) Middle School in Pennsylvania
Macronutrients Energy (kcal) 136.0 Protein (g) 0.0 Total fat (g) 0.0 Saturated fat (g) 0.0 Cholesterol (mg) 0.0 Carbohydrates (g) 34.8
Micronutrients
Vitamin A (RE) 0.0 Vitamin C (mg) 0.0 Calcium (mg) 10.0 Iron (mg) 0.2
Average Percentage of Calories from:
Total fat (%) 0.0 Saturated fat (%) 0.0
High School in Maryland Macronutrients Energy (kcal) 139.4 Protein (g) 1.1 Total fat (g) 3.8 Saturated fat (g) 1.0 Cholesterol (mg) 0.6 Carbohydrates (g) 26.1
Micronutrients
Vitamin A (RE) 6.5 Vitamin C (mg) 5.4 Calcium (mg) 27.9 Iron (mg) 0.5
Average Percentage of Calories from:
Total fat (%) 25.2 Saturated fat (%) 6.4
High School in New Jersey Macronutrients Energy (kcal) 196.1 Protein (g) 2.2 Total fat (g) 6.7 Saturated fat (g) 2.1 Cholesterol (mg) 5.1 Carbohydrates (g) 33.0
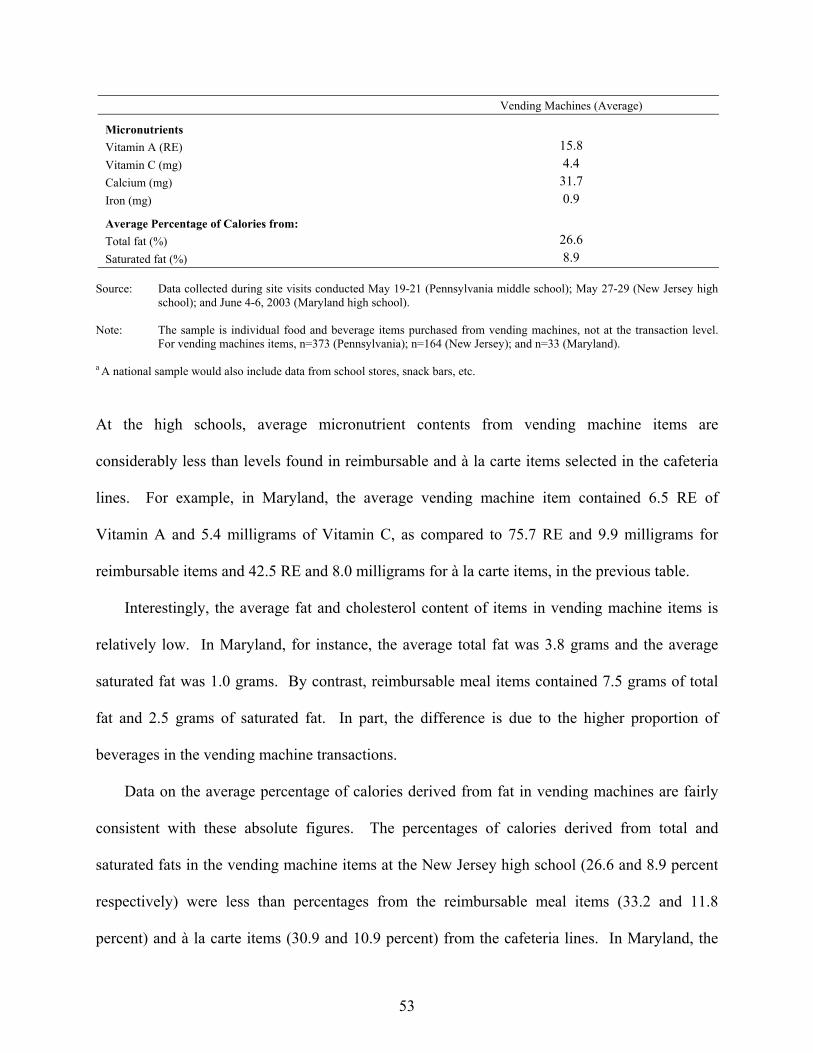
53
Vending Machines (Average)
Micronutrients
Vitamin A (RE) 15.8 Vitamin C (mg) 4.4 Calcium (mg) 31.7 Iron (mg) 0.9
Average Percentage of Calories from:
Total fat (%) 26.6 Saturated fat (%) 8.9
Source: Data collected during site visits conducted May 19-21 (Pennsylvania middle school); May 27-29 (New Jersey high
school); and June 4-6, 2003 (Maryland high school). Note: The sample is individual food and beverage items purchased from vending machines, not at the transaction level.
For vending machines items, n=373 (Pennsylvania); n=164 (New Jersey); and n=33 (Maryland). a A national sample would also include data from school stores, snack bars, etc.
At the high schools, average micronutrient contents from vending machine items are
considerably less than levels found in reimbursable and à la carte items selected in the cafeteria
lines. For example, in Maryland, the average vending machine item contained 6.5 RE of
Vitamin A and 5.4 milligrams of Vitamin C, as compared to 75.7 RE and 9.9 milligrams for
reimbursable items and 42.5 RE and 8.0 milligrams for à la carte items, in the previous table.
Interestingly, the average fat and cholesterol content of items in vending machine items is
relatively low. In Maryland, for instance, the average total fat was 3.8 grams and the average
saturated fat was 1.0 grams. By contrast, reimbursable meal items contained 7.5 grams of total
fat and 2.5 grams of saturated fat. In part, the difference is due to the higher proportion of
beverages in the vending machine transactions.
Data on the average percentage of calories derived from fat in vending machines are fairly
consistent with these absolute figures. The percentages of calories derived from total and
saturated fats in the vending machine items at the New Jersey high school (26.6 and 8.9 percent
respectively) were less than percentages from the reimbursable meal items (33.2 and 11.8
percent) and à la carte items (30.9 and 10.9 percent) from the cafeteria lines. In Maryland, the
54
percentages of calories contained from total fat fell in between the percentages for reimbursable
meal items and à la carte items, though vending machine items contained the fewest calories
from saturated fat.
Thus, while vending machine items may be considered poor sources of micronutrients,
based on what students selected in the three schools we observed, they do not necessarily contain
relatively high levels of fat or cholesterol, or at least not significantly more than items selected in
cafeteria lines. This is not to say that all vending machine items are low in fat. Different
nutrient data would emerge if the tables were divided into foods and beverages. Individual snack
cake items, for example, can contain very high levels of total and saturated fat, whereas sodas
and fruit drinks contain no fat. The popularity of fruit drinks is an important reason that the
average fat levels for vending machine items are lower than for cafeteria items.5
Table IV.12 compares the average nutrient content of vending machine items selected
during lunch periods with those selected during non-lunch periods.6 This table focuses on the
New Jersey school, because the Pennsylvania school limited use of its machines to lunch periods,
and very few students at the Maryland high school purchased vending machine items apart from
lunch periods (n=4).
In general, there did not seem to be substantially different patterns of average macronutrient
and micronutrient contents for vending machine items selected during lunch and those selected at
other times. Vitamin A was the only nutrient where levels were noticeably different in items
5FIAS does not calculate sugar levels for food and beverage items. However, it would be
interesting to calculate sugar data and compare it to the National Research Council’s recommendation that added sugars should be no more than 25 percent of total calories consumed. In a larger study, it would be possible to link the FIAS codes with the USDA nutrient database to retrieve sugar content data.
6The non-lunch time period includes purchases made from the period when the school opens until lunch begins, as well as the end of the last lunch period through the end of the school day.
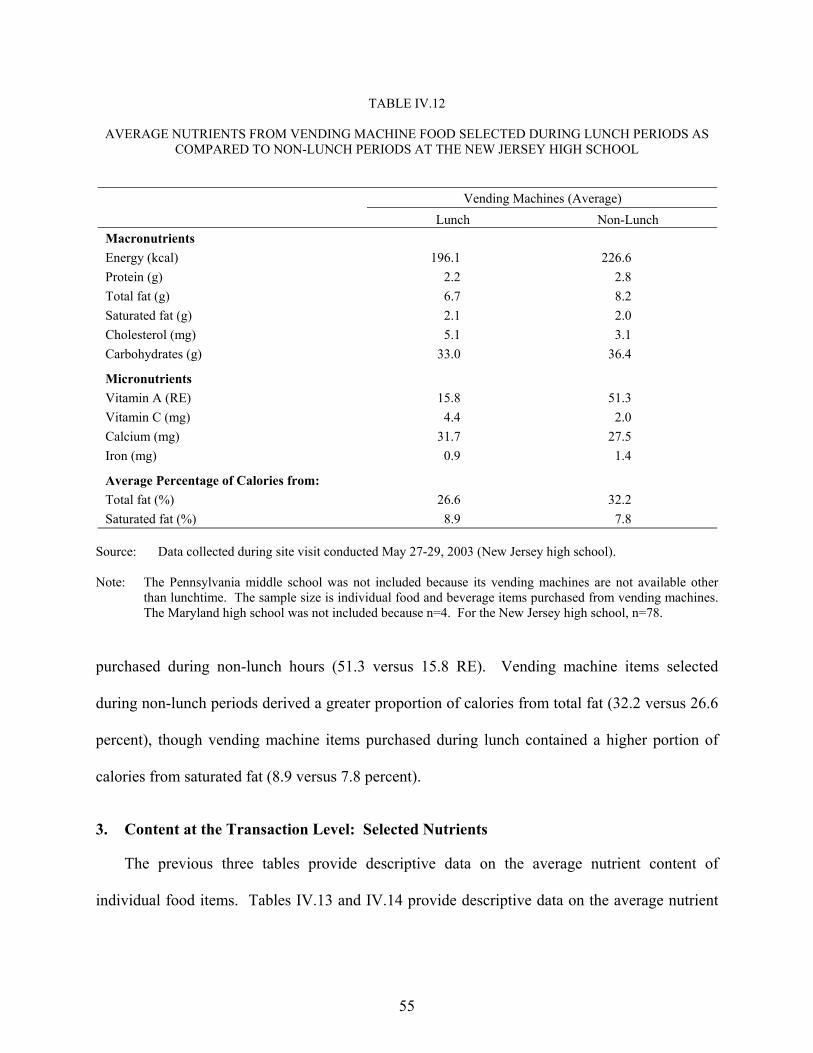
55
TABLE IV.12
AVERAGE NUTRIENTS FROM VENDING MACHINE FOOD SELECTED DURING LUNCH PERIODS AS COMPARED TO NON-LUNCH PERIODS AT THE NEW JERSEY HIGH SCHOOL
Vending Machines (Average) Lunch Non-Lunch Macronutrients Energy (kcal) 196.1 226.6 Protein (g) 2.2 2.8 Total fat (g) 6.7 8.2 Saturated fat (g) 2.1 2.0 Cholesterol (mg) 5.1 3.1 Carbohydrates (g) 33.0 36.4
Micronutrients Vitamin A (RE) 15.8 51.3 Vitamin C (mg) 4.4 2.0 Calcium (mg) 31.7 27.5 Iron (mg) 0.9 1.4
Average Percentage of Calories from: Total fat (%) 26.6 32.2 Saturated fat (%) 8.9 7.8
Source: Data collected during site visit conducted May 27-29, 2003 (New Jersey high school). Note: The Pennsylvania middle school was not included because its vending machines are not available other than lunchtime. The sample size is individual food and beverage items purchased from vending machines. The Maryland high school was not included because n=4. For the New Jersey high school, n=78.
purchased during non-lunch hours (51.3 versus 15.8 RE). Vending machine items selected
during non-lunch periods derived a greater proportion of calories from total fat (32.2 versus 26.6
percent), though vending machine items purchased during lunch contained a higher portion of
calories from saturated fat (8.9 versus 7.8 percent).
3. Content at the Transaction Level: Selected Nutrients
The previous three tables provide descriptive data on the average nutrient content of
individual food items. Tables IV.13 and IV.14 provide descriptive data on the average nutrient
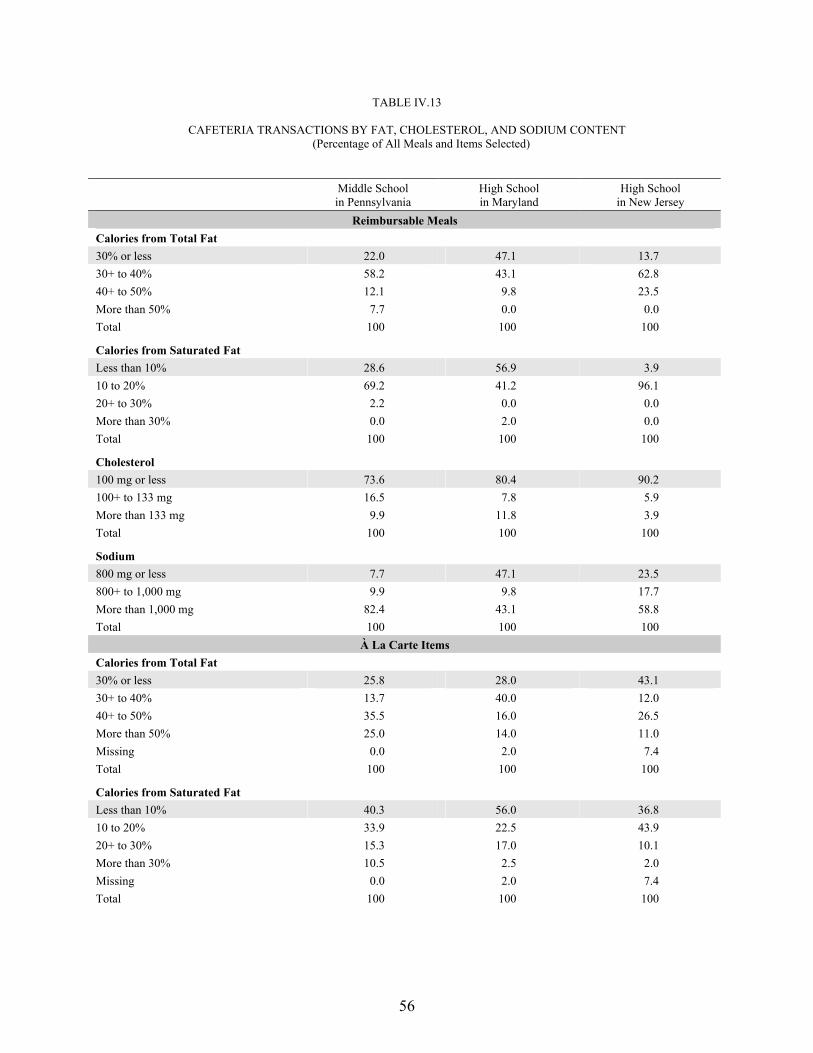
56
TABLE IV.13
CAFETERIA TRANSACTIONS BY FAT, CHOLESTEROL, AND SODIUM CONTENT (Percentage of All Meals and Items Selected)
Middle School in Pennsylvania
High School in Maryland
High School in New Jersey
Reimbursable Meals Calories from Total Fat 30% or less 22.0 47.1 13.7 30+ to 40% 58.2 43.1 62.8 40+ to 50% 12.1 9.8 23.5 More than 50% 7.7 0.0 0.0 Total 100 100 100
Calories from Saturated Fat
Less than 10% 28.6 56.9 3.9 10 to 20% 69.2 41.2 96.1 20+ to 30% 2.2 0.0 0.0 More than 30% 0.0 2.0 0.0 Total 100 100 100
Cholesterol
100 mg or less 73.6 80.4 90.2 100+ to 133 mg 16.5 7.8 5.9 More than 133 mg 9.9 11.8 3.9 Total 100 100 100
Sodium
800 mg or less 7.7 47.1 23.5 800+ to 1,000 mg 9.9 9.8 17.7 More than 1,000 mg 82.4 43.1 58.8 Total 100 100 100
À La Carte Items Calories from Total Fat 30% or less 25.8 28.0 43.1 30+ to 40% 13.7 40.0 12.0 40+ to 50% 35.5 16.0 26.5 More than 50% 25.0 14.0 11.0 Missing 0.0 2.0 7.4 Total 100 100 100
Calories from Saturated Fat
Less than 10% 40.3 56.0 36.8 10 to 20% 33.9 22.5 43.9 20+ to 30% 15.3 17.0 10.1 More than 30% 10.5 2.5 2.0 Missing 0.0 2.0 7.4 Total 100 100 100
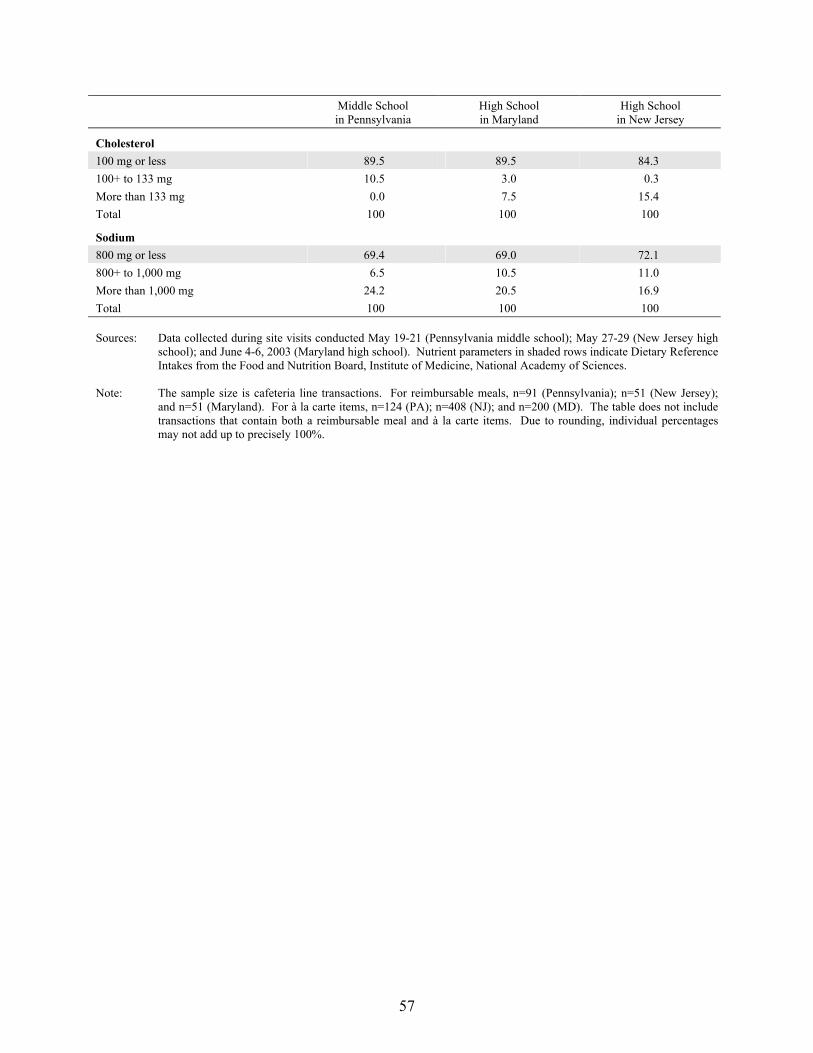
57
Middle School in Pennsylvania
High School in Maryland
High School in New Jersey
Cholesterol
100 mg or less 89.5 89.5 84.3 100+ to 133 mg 10.5 3.0 0.3 More than 133 mg 0.0 7.5 15.4 Total 100 100 100
Sodium
800 mg or less 69.4 69.0 72.1 800+ to 1,000 mg 6.5 10.5 11.0 More than 1,000 mg 24.2 20.5 16.9 Total 100 100 100 Sources: Data collected during site visits conducted May 19-21 (Pennsylvania middle school); May 27-29 (New Jersey high
school); and June 4-6, 2003 (Maryland high school). Nutrient parameters in shaded rows indicate Dietary Reference Intakes from the Food and Nutrition Board, Institute of Medicine, National Academy of Sciences.
Note: The sample size is cafeteria line transactions. For reimbursable meals, n=91 (Pennsylvania); n=51 (New Jersey);
and n=51 (Maryland). For à la carte items, n=124 (PA); n=408 (NJ); and n=200 (MD). The table does not include transactions that contain both a reimbursable meal and à la carte items. Due to rounding, individual percentages may not add up to precisely 100%.
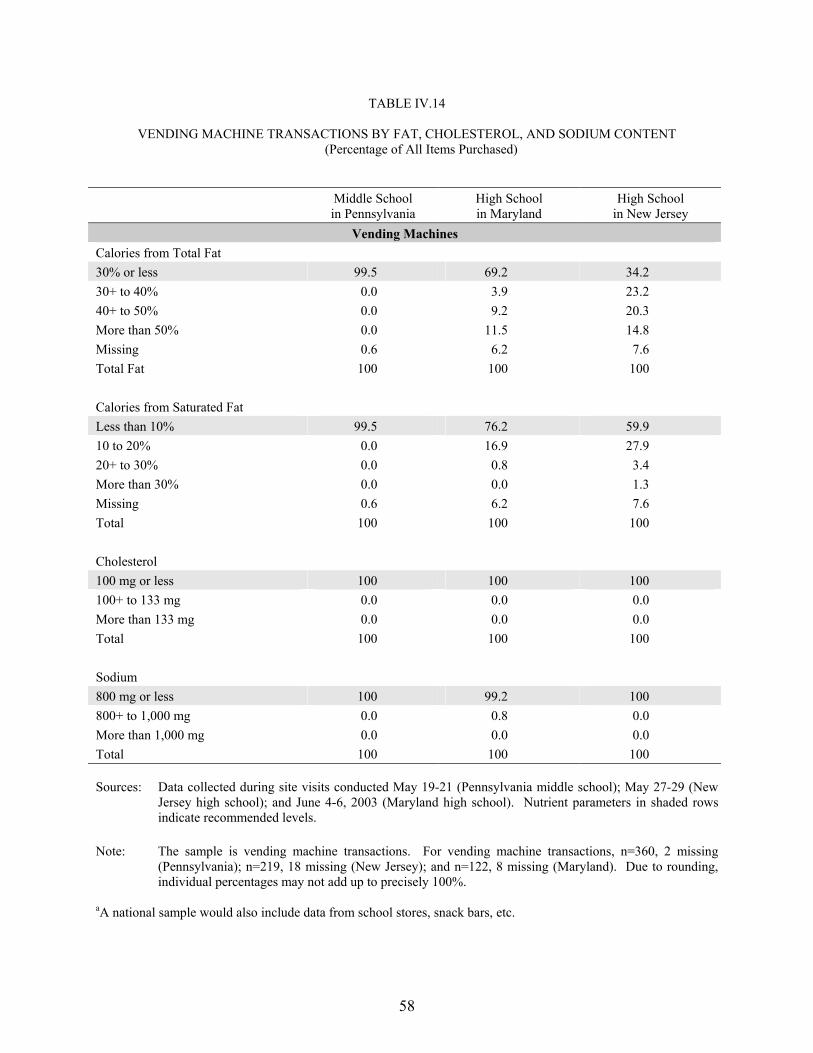
58
TABLE IV.14
VENDING MACHINE TRANSACTIONS BY FAT, CHOLESTEROL, AND SODIUM CONTENT (Percentage of All Items Purchased)
Middle School in Pennsylvania
High School in Maryland
High School in New Jersey
Vending Machines Calories from Total Fat 30% or less 99.5 69.2 34.2 30+ to 40% 0.0 3.9 23.2 40+ to 50% 0.0 9.2 20.3 More than 50% 0.0 11.5 14.8 Missing 0.6 6.2 7.6 Total Fat 100 100 100 Calories from Saturated Fat Less than 10% 99.5 76.2 59.9 10 to 20% 0.0 16.9 27.9 20+ to 30% 0.0 0.8 3.4 More than 30% 0.0 0.0 1.3 Missing 0.6 6.2 7.6 Total 100 100 100 Cholesterol 100 mg or less 100 100 100 100+ to 133 mg 0.0 0.0 0.0 More than 133 mg 0.0 0.0 0.0 Total 100 100 100 Sodium 800 mg or less 100 99.2 100 800+ to 1,000 mg 0.0 0.8 0.0 More than 1,000 mg 0.0 0.0 0.0 Total 100 100 100 Sources: Data collected during site visits conducted May 19-21 (Pennsylvania middle school); May 27-29 (New
Jersey high school); and June 4-6, 2003 (Maryland high school). Nutrient parameters in shaded rows indicate recommended levels.
Note: The sample is vending machine transactions. For vending machine transactions, n=360, 2 missing
(Pennsylvania); n=219, 18 missing (New Jersey); and n=122, 8 missing (Maryland). Due to rounding, individual percentages may not add up to precisely 100%.
aA national sample would also include data from school stores, snack bars, etc.
59
content of item(s) that students selected as one transaction. This level of analysis is of interest,
because it reveals what students are purchasing for an entire meal. These tables concentrate on
four nutrients: total and saturated fats as a percentage of calories, cholesterol, and sodium. These
nutrients were included in the analysis due to their association with cardiovascular and other
disease risk; other nutrients of interest could be examined in this format, as well. The
macronutrient data here are presented as percentages of transactions that fall within defined
nutrient content ranges. Shaded rows indicate current health recommendations.
Consistent with earlier studies, a majority of reimbursable meals across the three schools
exceeded the recommended levels for the proportions of calories derived from total fat (≤30
percent) and from saturated fat (< 10 percent). At the Maryland high school 47.1 and 56.9
percent of reimbursable meals fell within the recommended ranges for the fat and saturated fat.
For the Pennsylvania middle school, 22.0 and 28.6 percent of reimbursable meals fell within
recommended ranges, while 13.7 and 3.9 percent of reimbursable meals for the New Jersey high
school did so. Most of the remaining reimbursable meals for all three schools emerged in the
next higher ranges—30 to 40 percent of calories derived from total fat, and 10 to 20 percent of
calories derived from saturated fat.
A majority of reimbursable meals at all three schools contained one third or less of
recommended levels of cholesterol (100 milligrams or less for a third of a day),7 with the New
Jersey high school having the highest percentage of meals that fall within the recommended
range (90.2 percent). Sodium amounts, however, tended to far exceed the recommended levels
(800 milligrams or less for a third of a day). A little less than half (47.1 percent) of all
7Recommended cholesterol and sodium levels in this table are per meal and are based on
daily recommended levels of 300 milligrams for cholesterol and 2,400 milligrams for sodium.
60
reimbursable meals from the Maryland high school fell within the recommended sodium range,
while 7.7 percent (in Pennsylvania) and 23.5 percent (in New Jersey) did so. For the
Pennsylvania and New Jersey schools, most reimbursable meals contain, on average, more than
1,000 milligrams of sodium (82.4 percent for Pennsylvania and 58.8 percent for New Jersey).
Different patterns emerged for à la carte transactions. Greater proportions of à la carte
transactions exceeded the recommended daily intake levels for the percentage of calories from
fats. For calories derived from total fat, 35.5 percent (PA), 16.0 percent (MD), and 26.5 percent
(NJ) fell in the 40-to-50 percent range, whereas 25.0 percent (PA), 14.0 percent (MD), and 11.0
percent (NJ) exceeded 50 percent of calories derived from total fat. A sizeable proportion of à la
carte transactions also exceeded the recommended percent of calories from saturated fat, though
more so at the middle school.
Table IV.14 highlights competitive food and beverage transactions from vending machines.
All vending machine transactions from the middle school met the daily recommended levels for
percentage of calories from total and saturated fat, cholesterol, and sodium. As previously
discussed in conjunction with Table 10, these figures resulted from the fact that the school’s
vending machines sell only beverages, specifically sodas, fruit drinks, and iced tea.
The cholesterol and sodium content of individual vending machine items at the high schools
also are consistent with dietary guidelines. In large part, this is because the cholesterol and
sodium guidelines are stated in absolute rather than percentage terms, and the purchases from
vending machines are usually a single food or a small number of items and do not usually
represent an entire meal.
Additional insight into the nutritional patterns discussed above can be obtained by
classifying the foods made available to students in cafeteria serving lines according to indicators
of healthy eating patterns. Table IV.15 classifies the competitive non-beverage foods offered
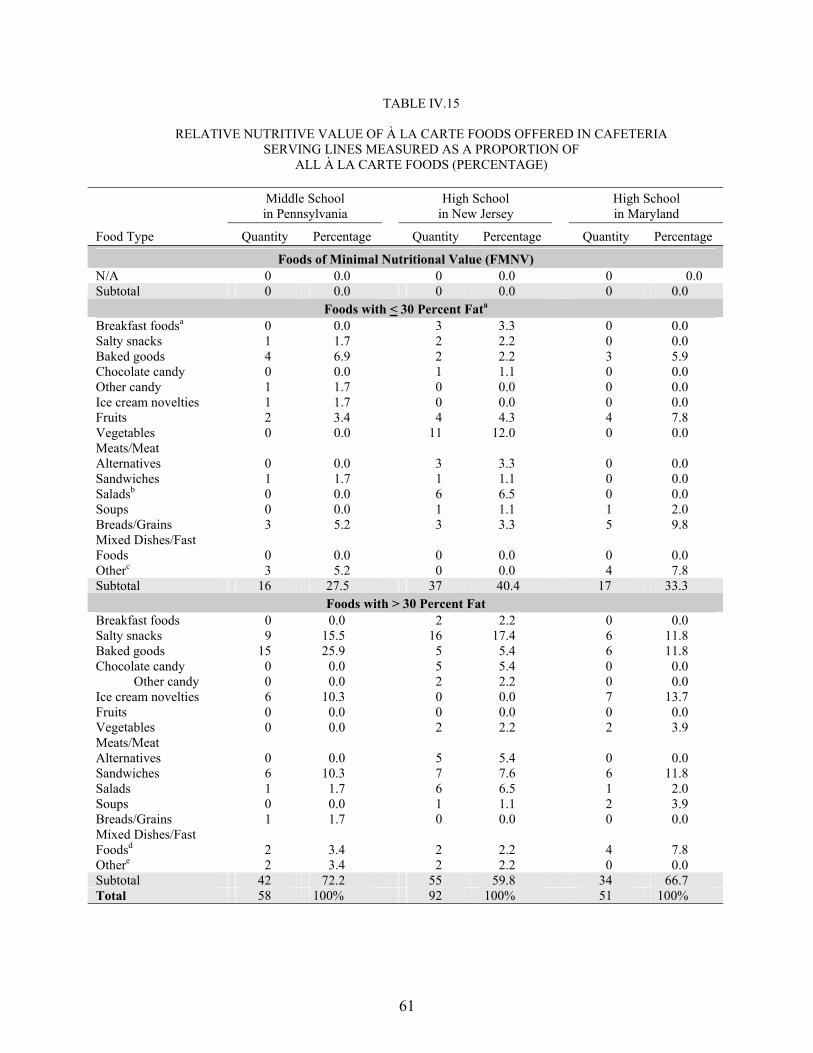
61
TABLE IV.15
RELATIVE NUTRITIVE VALUE OF À LA CARTE FOODS OFFERED IN CAFETERIA SERVING LINES MEASURED AS A PROPORTION OF
ALL À LA CARTE FOODS (PERCENTAGE)
Middle School in Pennsylvania
High School in New Jersey
High School in Maryland
Food Type Quantity Percentage Quantity Percentage Quantity Percentage
Foods of Minimal Nutritional Value (FMNV) N/A 0 0.0 0 0.0 0 0.0 Subtotal 0 0.0 0 0.0 0 0.0
Foods with < 30 Percent Fata Breakfast foodsa 0 0.0 3 3.3 0 0.0 Salty snacks 1 1.7 2 2.2 0 0.0 Baked goods 4 6.9 2 2.2 3 5.9 Chocolate candy 0 0.0 1 1.1 0 0.0 Other candy 1 1.7 0 0.0 0 0.0 Ice cream novelties 1 1.7 0 0.0 0 0.0 Fruits 2 3.4 4 4.3 4 7.8 Vegetables 0 0.0 11 12.0 0 0.0 Meats/Meat Alternatives 0 0.0 3 3.3 0 0.0 Sandwiches 1 1.7 1 1.1 0 0.0 Saladsb 0 0.0 6 6.5 0 0.0 Soups 0 0.0 1 1.1 1 2.0 Breads/Grains 3 5.2 3 3.3 5 9.8 Mixed Dishes/Fast Foods 0 0.0 0 0.0 0 0.0 Otherc 3 5.2 0 0.0 4 7.8 Subtotal 16 27.5 37 40.4 17 33.3
Foods with > 30 Percent Fat Breakfast foods 0 0.0 2 2.2 0 0.0 Salty snacks 9 15.5 16 17.4 6 11.8 Baked goods 15 25.9 5 5.4 6 11.8 Chocolate candy 0 0.0 5 5.4 0 0.0
Other candy 0 0.0 2 2.2 0 0.0 Ice cream novelties 6 10.3 0 0.0 7 13.7 Fruits 0 0.0 0 0.0 0 0.0 Vegetables 0 0.0 2 2.2 2 3.9 Meats/Meat Alternatives 0 0.0 5 5.4 0 0.0 Sandwiches 6 10.3 7 7.6 6 11.8 Salads 1 1.7 6 6.5 1 2.0 Soups 0 0.0 1 1.1 2 3.9 Breads/Grains 1 1.7 0 0.0 0 0.0 Mixed Dishes/Fast Foodsd 2 3.4 2 2.2 4 7.8 Othere 2 3.4 2 2.2 0 0.0 Subtotal 42 72.2 55 59.8 34 66.7 Total 58 100% 92 100% 51 100%
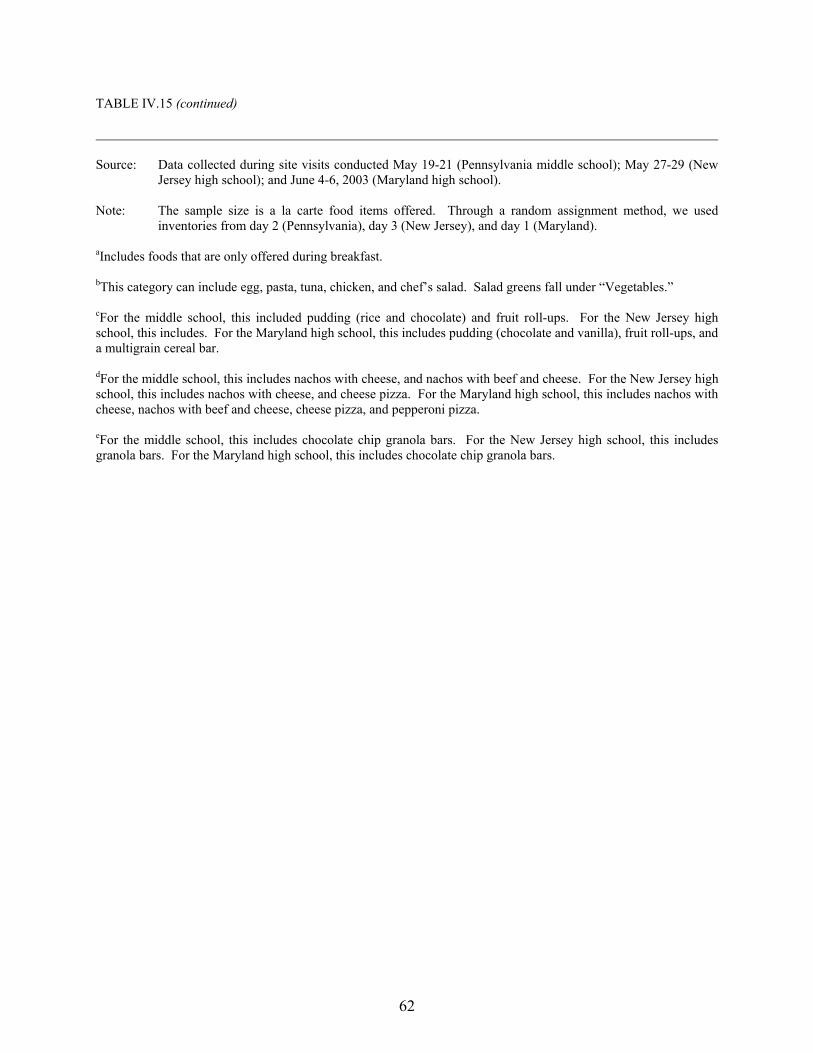
62
TABLE IV.15 (continued)
Source: Data collected during site visits conducted May 19-21 (Pennsylvania middle school); May 27-29 (New
Jersey high school); and June 4-6, 2003 (Maryland high school). Note: The sample size is a la carte food items offered. Through a random assignment method, we used
inventories from day 2 (Pennsylvania), day 3 (New Jersey), and day 1 (Maryland). aIncludes foods that are only offered during breakfast. bThis category can include egg, pasta, tuna, chicken, and chef’s salad. Salad greens fall under “Vegetables.” cFor the middle school, this included pudding (rice and chocolate) and fruit roll-ups. For the New Jersey high school, this includes. For the Maryland high school, this includes pudding (chocolate and vanilla), fruit roll-ups, and a multigrain cereal bar. dFor the middle school, this includes nachos with cheese, and nachos with beef and cheese. For the New Jersey high school, this includes nachos with cheese, and cheese pizza. For the Maryland high school, this includes nachos with cheese, nachos with beef and cheese, cheese pizza, and pepperoni pizza. eFor the middle school, this includes chocolate chip granola bars. For the New Jersey high school, this includes granola bars. For the Maryland high school, this includes chocolate chip granola bars.
63
into three categories: (1) food identified by USDA regulations as being Foods of Minimum
Nutritional Value (FMNV)8; (2) foods that do not fall into the FMNV classification but which
have 30 percent or more fat content, as a percentage of calories; and (3) foods with less than 30
percent fat content as a percentage of calories. As shown in the table, none of the foods offered
for selection from the cafeteria lines at the three schools fell into the FMNV category. However,
a majority of the non-beverage competitive foods offered in each school contained fat contents
greater than 30 percent—this included 72 percent of the foods offered at the Pennsylvania middle
school, 67 percent at the Maryland high school, and 60 percent at the New Jersey high school.
Similarly, beverages offered as competitive foods in cafeteria serving lines were classified
by the presence of added sweeteners as an indicator of whether they promote healthy diets (Table
IV.16). At both the Pennsylvania middle school and the New Jersey high school, more than 75
percent of the beverages offered contained added sweeteners. The comparable figure for the
Maryland high school was about 58 percent.
E. USE OF VENDING MACHINES AT THE THREE SCHOOLS
An April 2001 report indicated that 55 percent of public middle schools and 76 percent of
public high schools had vending machines on their campuses (Fox 2001).9 Child heath
advocates have raised concerns about the prevalence of machines and how they could have
adverse effects on the nutritional intake and health of children and adolescents, particularly since
8The FMNV concept is defined in more detail in Section E below.
9The 2000 School Health Policies and Programs Study, which was released in September 2001, looked at a nationally representative sample of public and private schools and found that 62 percent of middle/junior high schools and 94.9 percent of senior high schools have one or more vending machines.
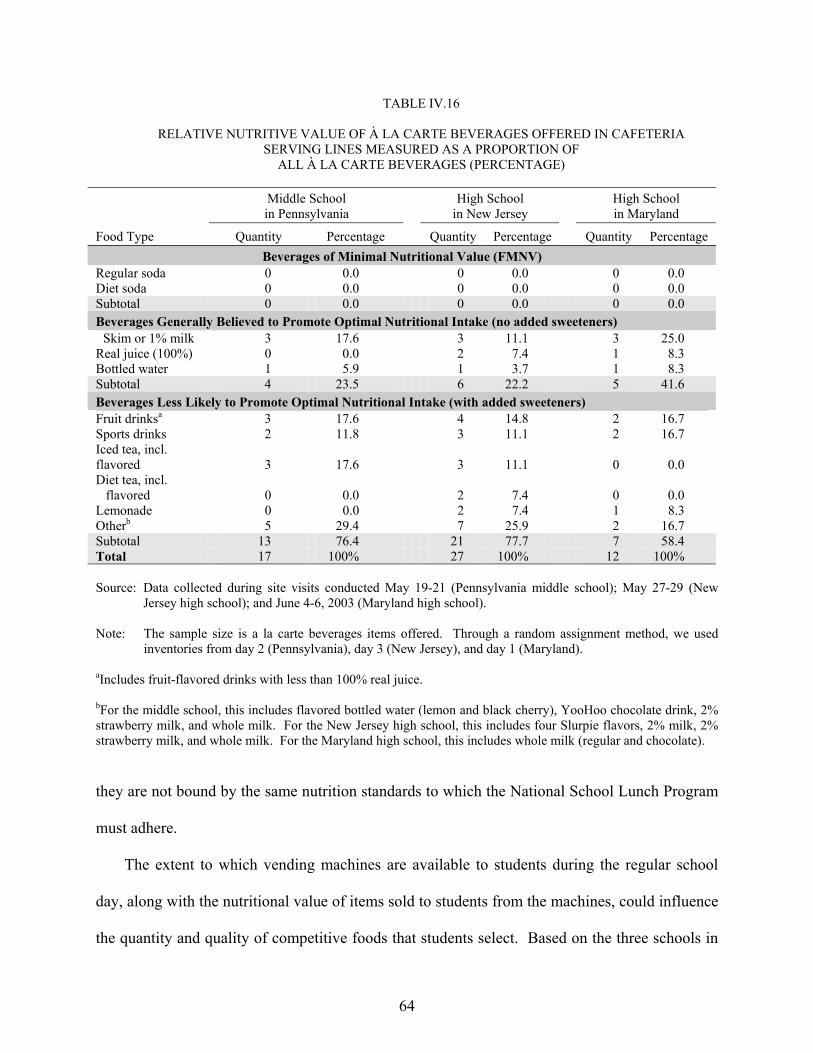
64
TABLE IV.16
RELATIVE NUTRITIVE VALUE OF À LA CARTE BEVERAGES OFFERED IN CAFETERIA SERVING LINES MEASURED AS A PROPORTION OF
ALL À LA CARTE BEVERAGES (PERCENTAGE)
Middle School in Pennsylvania
High School in New Jersey
High School in Maryland
Food Type Quantity Percentage Quantity Percentage Quantity Percentage Beverages of Minimal Nutritional Value (FMNV)
Regular soda 0 0.0 0 0.0 0 0.0 Diet soda 0 0.0 0 0.0 0 0.0 Subtotal 0 0.0 0 0.0 0 0.0 Beverages Generally Believed to Promote Optimal Nutritional Intake (no added sweeteners)
Skim or 1% milk 3 17.6 3 11.1 3 25.0 Real juice (100%) 0 0.0 2 7.4 1 8.3 Bottled water 1 5.9 1 3.7 1 8.3 Subtotal 4 23.5 6 22.2 5 41.6 Beverages Less Likely to Promote Optimal Nutritional Intake (with added sweeteners) Fruit drinksa 3 17.6 4 14.8 2 16.7 Sports drinks 2 11.8 3 11.1 2 16.7 Iced tea, incl. flavored 3 17.6 3 11.1 0 0.0 Diet tea, incl. flavored 0 0.0 2 7.4 0 0.0 Lemonade 0 0.0 2 7.4 1 8.3 Otherb 5 29.4 7 25.9 2 16.7 Subtotal 13 76.4 21 77.7 7 58.4 Total 17 100% 27 100% 12 100% Source: Data collected during site visits conducted May 19-21 (Pennsylvania middle school); May 27-29 (New
Jersey high school); and June 4-6, 2003 (Maryland high school). Note: The sample size is a la carte beverages items offered. Through a random assignment method, we used inventories from day 2 (Pennsylvania), day 3 (New Jersey), and day 1 (Maryland).
aIncludes fruit-flavored drinks with less than 100% real juice. bFor the middle school, this includes flavored bottled water (lemon and black cherry), YooHoo chocolate drink, 2% strawberry milk, and whole milk. For the New Jersey high school, this includes four Slurpie flavors, 2% milk, 2% strawberry milk, and whole milk. For the Maryland high school, this includes whole milk (regular and chocolate). they are not bound by the same nutrition standards to which the National School Lunch Program
must adhere.
The extent to which vending machines are available to students during the regular school
day, along with the nutritional value of items sold to students from the machines, could influence
the quantity and quality of competitive foods that students select. Based on the three schools in
65
this feasibility study, this section describes the issues surrounding the availability of competitive
items offered in vending machines, the relative nutritional value of these items, and incentives
that vending machine corporations offer schools for allowing their products to be sold on
campus. Appendix C presents in detail the configurations of items sold in vending machines at
the three schools in our sample. (In order to supply additional content, Appendix D lists the à la
carte foods available in cafeteria serving lines at the three schools, not including items that can
also constitute reimbursable meals.10)
1. Policy Issues Surrounding the Use of Vending Machines
There are several ways in which school officials can potentially limit the amount of food and
beverage items that they believe to have low nutritional value sold during the regular school day.
They can (a) limit the number, location, and hours of operation of vending machines; (b) limit
the proportion of items of minimal nutritional value or items of less nutritional value sold in
vending machines or times when these items are offered; and (c) create cost disincentives for
selecting less nutritious items, such as soda as opposed to bottled water.
In the subsections below, we briefly discuss each of these approaches, in order to provide a
context for discussing the use of vending machines in the three schools we observed.
Physical Environment Issues—Number, Location, and Hours of Operation. The
amount of competitive foods and beverages that students purchase from vending machines
depends, in part, on the number of machines available, where the machines are located, and the
hours that students can access the machines. Vendors ideally want to situate machines in well-
traveled areas and preferably where students eat their meals—either in the cafeteria, just outside
the cafeteria, or in a hallway where students walk frequently throughout the day. School
10For example, french fries would not be included in Appendix D for this reason.
66
officials could choose to restrict the quantity of items sold in vending machines during the
regular school day by, for example, limiting the availability of vending machines to after school
hours or non-meal times (Bogden 2000).
The three schools in this feasibility study varied in the degree to which they limited the
availability of vending machines to students during the regular school day. Aside from two
schools limiting hours of operation to certain periods during the school day (none of the sampled
schools limit all machines to non-school hours), students seem to have easy access to multiple
vending machines at some point during the school day. Most machines from all three schools
were located in or very close to the cafeteria, or in a student commons area.
The middle school in Pennsylvania had five beverage machines they sold mostly regular
soda products, and three of them were located just outside the cafeteria. These three machines
are available only for about half an hour during each 39-minute lunch period.11
The high school in New Jersey has 12 vending machines available. Students could access
two Snapple machines (one cans, one bottles) in the main room of the cafeteria, and seven
machines in an alcove located in the cafeteria. The alcove included four beverage machines, two
snack machines, and one ice cream machine. These nine vending machines were available
before, during, and after school.12
Finally, the high school in Maryland has 12 beverage machines and 3 snack machines.
There are eight beverage machines and three snack machines in the Student Commons, one floor
above the cafeteria, two beverage machines in an alcove near the Commons, and two beverage
11 Two beverage machines that we did not include in our sampling are located in the boys’
locker room and outside on school grounds and are not accessible during the school day.
12 The remaining three machines, which were not part of our sampling, are accessible only after school and are located indoors at the other end of the school near the gym.
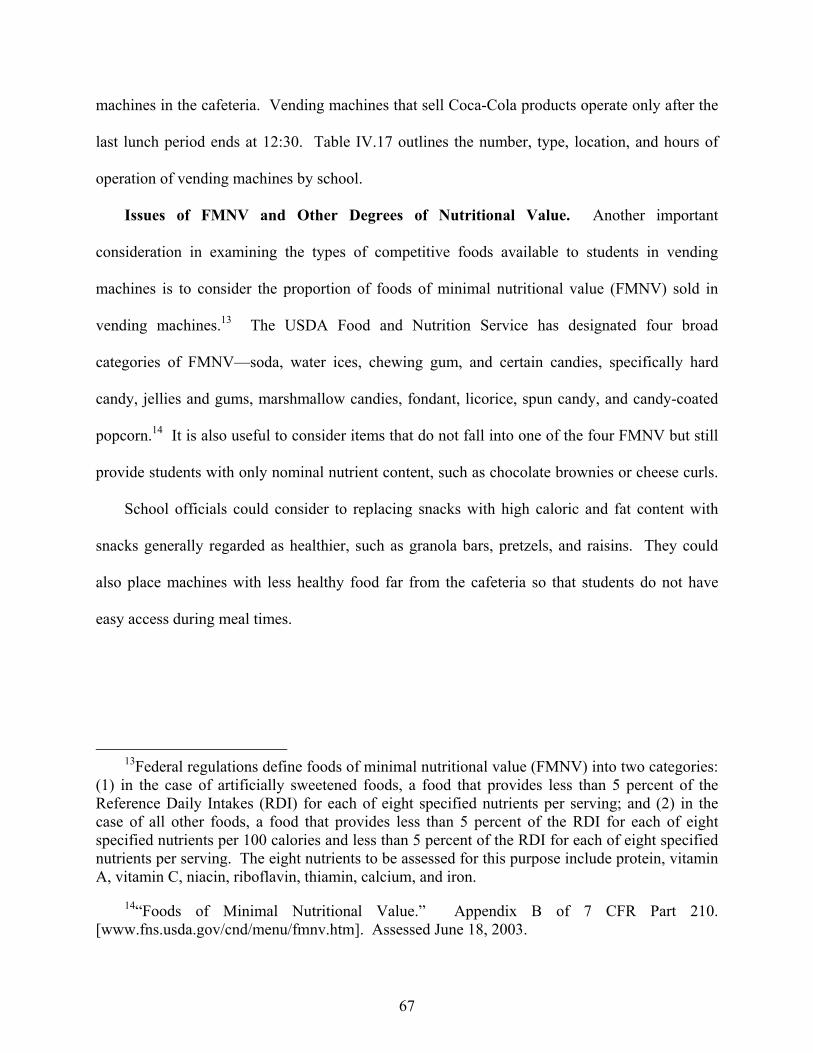
67
machines in the cafeteria. Vending machines that sell Coca-Cola products operate only after the
last lunch period ends at 12:30. Table IV.17 outlines the number, type, location, and hours of
operation of vending machines by school.
Issues of FMNV and Other Degrees of Nutritional Value. Another important
consideration in examining the types of competitive foods available to students in vending
machines is to consider the proportion of foods of minimal nutritional value (FMNV) sold in
vending machines.13 The USDA Food and Nutrition Service has designated four broad
categories of FMNV—soda, water ices, chewing gum, and certain candies, specifically hard
candy, jellies and gums, marshmallow candies, fondant, licorice, spun candy, and candy-coated
popcorn.14 It is also useful to consider items that do not fall into one of the four FMNV but still
provide students with only nominal nutrient content, such as chocolate brownies or cheese curls.
School officials could consider to replacing snacks with high caloric and fat content with
snacks generally regarded as healthier, such as granola bars, pretzels, and raisins. They could
also place machines with less healthy food far from the cafeteria so that students do not have
easy access during meal times.
13Federal regulations define foods of minimal nutritional value (FMNV) into two categories:
(1) in the case of artificially sweetened foods, a food that provides less than 5 percent of the Reference Daily Intakes (RDI) for each of eight specified nutrients per serving; and (2) in the case of all other foods, a food that provides less than 5 percent of the RDI for each of eight specified nutrients per 100 calories and less than 5 percent of the RDI for each of eight specified nutrients per serving. The eight nutrients to be assessed for this purpose include protein, vitamin A, vitamin C, niacin, riboflavin, thiamin, calcium, and iron.
14“Foods of Minimal Nutritional Value.” Appendix B of 7 CFR Part 210. [www.fns.usda.gov/cnd/menu/fmnv.htm]. Assessed June 18, 2003.
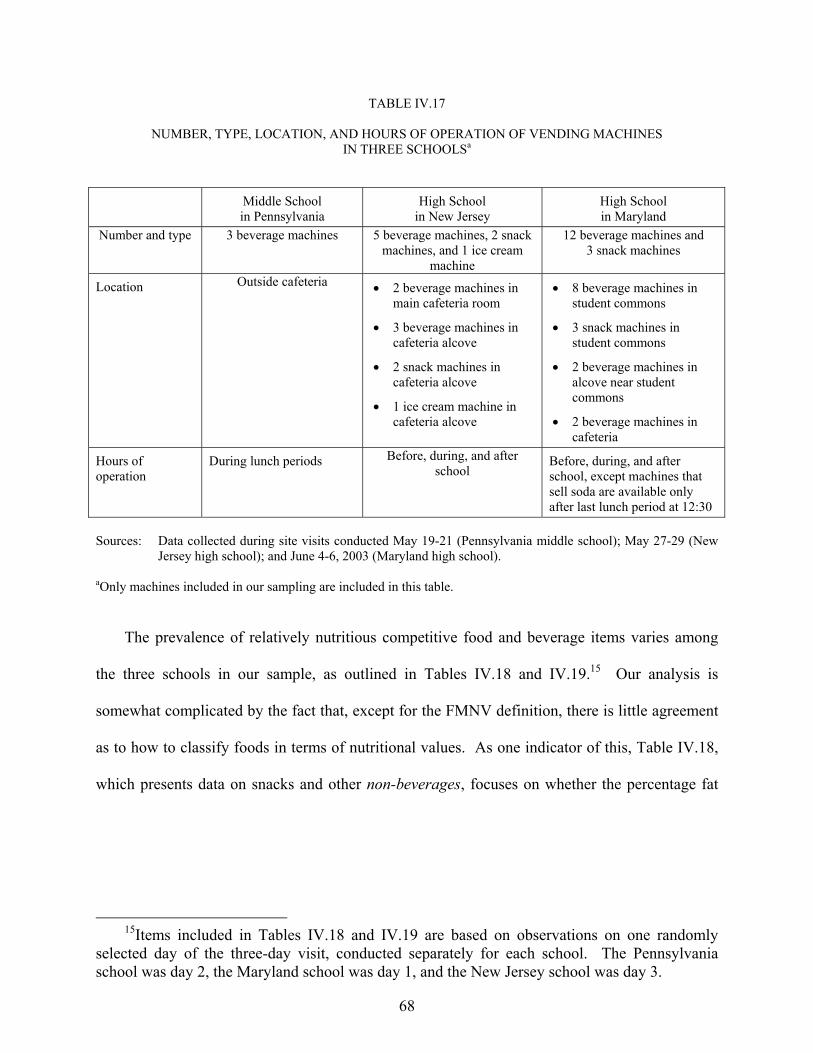
68
TABLE IV.17
NUMBER, TYPE, LOCATION, AND HOURS OF OPERATION OF VENDING MACHINES IN THREE SCHOOLSa
Middle School in Pennsylvania
High School in New Jersey
High School in Maryland
Number and type 3 beverage machines 5 beverage machines, 2 snack machines, and 1 ice cream
machine
12 beverage machines and 3 snack machines
Location Outside cafeteria • 2 beverage machines in main cafeteria room
• 3 beverage machines in cafeteria alcove
• 2 snack machines in cafeteria alcove
• 1 ice cream machine in cafeteria alcove
• 8 beverage machines in student commons
• 3 snack machines in student commons
• 2 beverage machines in alcove near student commons
• 2 beverage machines in cafeteria
Hours of operation
During lunch periods Before, during, and after school
Before, during, and after school, except machines that sell soda are available only after last lunch period at 12:30
Sources: Data collected during site visits conducted May 19-21 (Pennsylvania middle school); May 27-29 (New
Jersey high school); and June 4-6, 2003 (Maryland high school). aOnly machines included in our sampling are included in this table.
The prevalence of relatively nutritious competitive food and beverage items varies among
the three schools in our sample, as outlined in Tables IV.18 and IV.19.15 Our analysis is
somewhat complicated by the fact that, except for the FMNV definition, there is little agreement
as to how to classify foods in terms of nutritional values. As one indicator of this, Table IV.18,
which presents data on snacks and other non-beverages, focuses on whether the percentage fat
15Items included in Tables IV.18 and IV.19 are based on observations on one randomly
selected day of the three-day visit, conducted separately for each school. The Pennsylvania school was day 2, the Maryland school was day 1, and the New Jersey school was day 3.
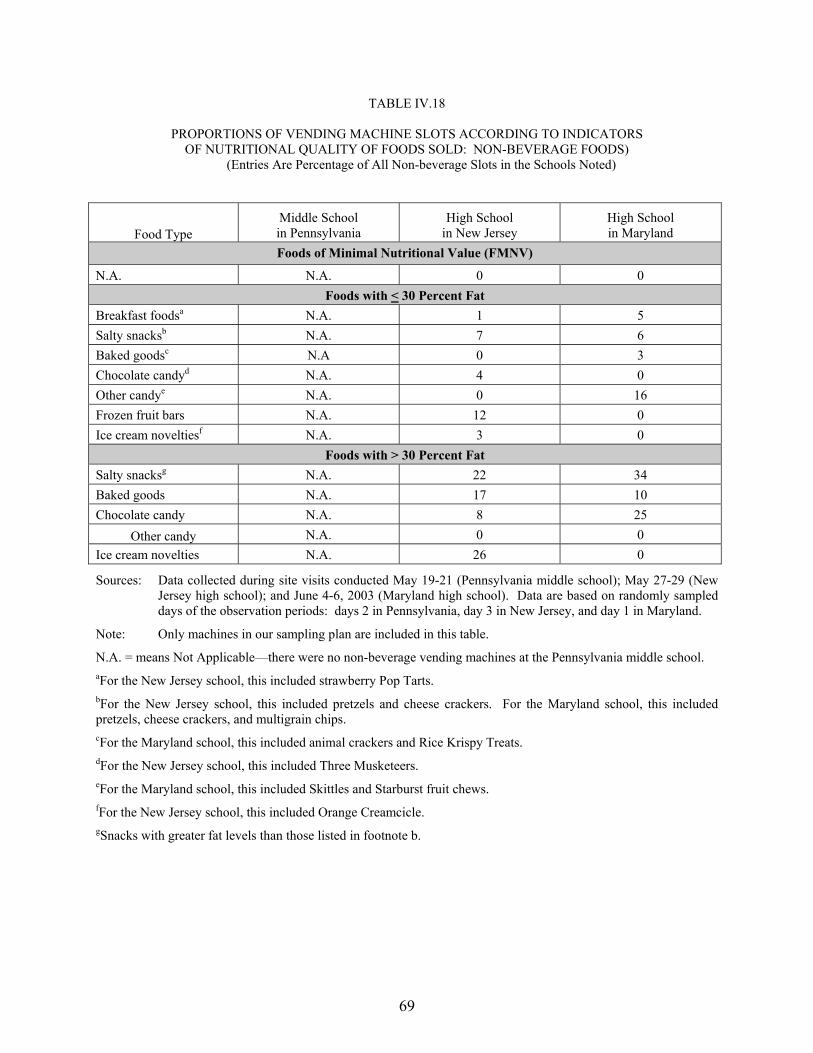
69
TABLE IV.18
PROPORTIONS OF VENDING MACHINE SLOTS ACCORDING TO INDICATORS OF NUTRITIONAL QUALITY OF FOODS SOLD: NON-BEVERAGE FOODS)
(Entries Are Percentage of All Non-beverage Slots in the Schools Noted)
Food Type Middle School in Pennsylvania
High School in New Jersey
High School in Maryland
Foods of Minimal Nutritional Value (FMNV)
N.A. N.A. 0 0 Foods with < 30 Percent Fat
Breakfast foodsa N.A. 1 5 Salty snacksb N.A. 7 6 Baked goodsc N.A 0 3 Chocolate candyd N.A. 4 0 Other candye N.A. 0 16 Frozen fruit bars N.A. 12 0 Ice cream noveltiesf N.A. 3 0
Foods with > 30 Percent Fat Salty snacksg N.A. 22 34 Baked goods N.A. 17 10 Chocolate candy N.A. 8 25
Other candy N.A. 0 0 Ice cream novelties N.A. 26 0
Sources: Data collected during site visits conducted May 19-21 (Pennsylvania middle school); May 27-29 (New Jersey high school); and June 4-6, 2003 (Maryland high school). Data are based on randomly sampled days of the observation periods: days 2 in Pennsylvania, day 3 in New Jersey, and day 1 in Maryland.
Note: Only machines in our sampling plan are included in this table.
N.A. = means Not Applicable—there were no non-beverage vending machines at the Pennsylvania middle school. aFor the New Jersey school, this included strawberry Pop Tarts. bFor the New Jersey school, this included pretzels and cheese crackers. For the Maryland school, this included pretzels, cheese crackers, and multigrain chips. cFor the Maryland school, this included animal crackers and Rice Krispy Treats. dFor the New Jersey school, this included Three Musketeers. eFor the Maryland school, this included Skittles and Starburst fruit chews. fFor the New Jersey school, this included Orange Creamcicle. gSnacks with greater fat levels than those listed in footnote b.
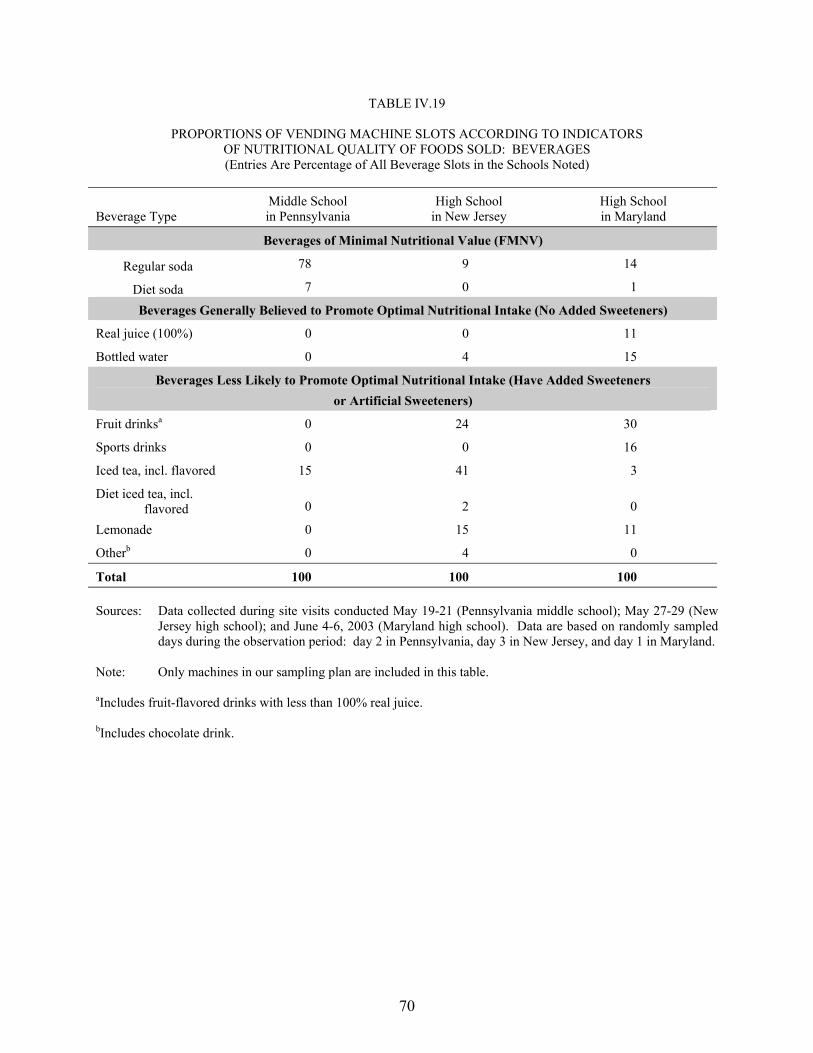
70
TABLE IV.19
PROPORTIONS OF VENDING MACHINE SLOTS ACCORDING TO INDICATORS OF NUTRITIONAL QUALITY OF FOODS SOLD: BEVERAGES (Entries Are Percentage of All Beverage Slots in the Schools Noted)
Beverage Type Middle School in Pennsylvania
High School in New Jersey
High School in Maryland
Beverages of Minimal Nutritional Value (FMNV)
Regular soda 78 9 14
Diet soda 7 0 1
Beverages Generally Believed to Promote Optimal Nutritional Intake (No Added Sweeteners)
Real juice (100%) 0 0 11
Bottled water 0 4 15
Beverages Less Likely to Promote Optimal Nutritional Intake (Have Added Sweeteners or Artificial Sweeteners)
Fruit drinksa 0 24 30
Sports drinks 0 0 16
Iced tea, incl. flavored 15 41 3
Diet iced tea, incl. flavored 0 2 0
Lemonade 0 15 11
Otherb 0 4 0
Total 100 100 100 Sources: Data collected during site visits conducted May 19-21 (Pennsylvania middle school); May 27-29 (New
Jersey high school); and June 4-6, 2003 (Maryland high school). Data are based on randomly sampled days during the observation period: day 2 in Pennsylvania, day 3 in New Jersey, and day 1 in Maryland.
Note: Only machines in our sampling plan are included in this table. aIncludes fruit-flavored drinks with less than 100% real juice. bIncludes chocolate drink.
71
content in the food is above or below 30 percent. Table IV.19, which presents data on beverages
sold in vending machines focuses on whether the beverages include added sweeteners or not.
The Pennsylvania middle school limits vending machines to beverages only. Among the
three machines located just outside the cafeteria, machine #1 had seven regular soda slots and
two iced tea slots; and machines #2 and #3 had seven regular sodas, one diet soda, and one ice
tea slot.16 All three machines offered regular soda in 78 percent of the slots, and none of them
offered bottled water.
Both high schools offered a wide variety of machine types, with varying degrees of items
that could be considered to be somewhat nutritious. In the two candy and snack machines at the
New Jersey school, most items contained high fat content, although they did not technically fall
into one of the four FMNV categories. Out of an average of 42 possible slots, approximately 40
percent dispensed salty snacks, 24 percent were filled with baked goods, and 25 percent
contained chocolate candy. Twelve percent were pretzels, cheddar popcorn, or multigrain
chips.17 In the 31 ice cream slots, 29 percent were frozen fruit bars,18 and 71 percent were ice
cream novelties, such as ice cream and chocolate chip cookies sandwiches.
Among drink machines at that school, four had mostly fruit drink or iced tea slots, but they also
offered some bottled water slots. The soda machine offered four soda slots and five lemonade
slots. Of all beverages, 80 percent of the slots offered iced tea, fruit drinks, or lemonade, 9
16A “slot” is defined as a discrete selection in a vending machine for a particular product.
17The proportions add up to more than 100 percent because these figures represent an average over three days, and the selections varied slightly from day to day.
18Frozen fruit bars contain bits of real fruit.
72
percent offered regular soda, and 4 percent offered a chocolate drink. Four percent of the slots
sold diet drinks, and 4 percent sold bottled water.19
As compared with the other two schools, the Maryland high school seemed to provide
competitive foods with somewhat greater nutritional value, particularly beverages. Out of 115
non-beverage food slots, about 26 percent were chocolate candy, 19 percent were chip snacks, 14
percent were other candies (such as Skittles), and 12 percent were baked goods. Fourteen
percent were foods usually considered to be more nutritious items, such as pretzels, granola bars,
and fruit snacks. Each of the three food vending machines had at least four slots with such
healthier snacks as options.
Out of 12 beverage vending machines (114 total slots), one exclusively offered bottled
water, and another machine offered bottled water in 50 percent of its slots. Most beverage slots
were filled with fruit drinks or iced tea (49 percent). Sports drinks comprised 16 percent; bottled
water 15 percent, regular soda 14 percent, real juice 11 percent; and diet soda less than 1 percent
of all vending beverage options.
Aside from the proportion of more-healthy versus less-healthy food and beverage options, it
is useful to consider the configuration of products in vending machines. For example, several
low-fat snacks might be arranged at eye level to encourage demand, or a single bottled water slot
might be ‘buried’ under 10 soda slots. Upon reviewing the vending machine configurations of
the three schools, researchers could not discern any noticeable patterns that would suggest a
proactive decision from either the schools or the vendors to place items strategically in certain
19These figures do not include 10 sports drink slots from a Gatorade machine, which was
broken during the three-day data collection period.
73
slots. (Appendix D provides a detailed layout of items sold in vending machines according to
slot location in these schools.)
Pricing Issues. Also of interest is whether there appear to be price differentials for different
types of vending machine items (French 2001). The three schools in our sample offered minimal
pricing disincentives to dissuade students from purchasing FMNV or other less nutritious items.
All beverages in the middle school cost the same amount. At the high school in New Jersey, in
general the snack food items with various nutrient and caloric content had comparable prices,
though several baked goods cost only 25 cents. Bottled water and Snapple cost 90 cents (10
cents less than soda and 35 cents less than sports drinks). In Maryland, all beverages besides
juice cost $1.00, and juices cost $1.25.
2. How Revenues From Vending Machines Are Used
Schools and districts can receive financial and/or non-monetary incentives for providing
vending machines on school grounds. Incentives can range from a “signing bonus” and a flat
percentage of sales to educational materials such as textbooks or computer software. A U.S.
General Accounting Office report revealed that a growing number of schools were accepting
incentives to engage in exclusive sales contracts, also known as “pouring contracts” (U.S.
General Accounting Office 2000). One study revealed that of schools engaged in such contracts,
39.5 percent receive a percentage of soft drink sales, and 31.2 percent receive cash awards,
donations of equipment, or supplies once sales receipts totaled a predetermined amount
(Wechsler 2001). The promotion of vending machine products may involve direct marketing
(such as posters of corporate products in hallways or a corporate logo on the school’s exterior
welcome sign), or the quantity, content, and location of vending machines, as discussed in the
previous section.
74
Each of the three schools in our sample engages in some formal arrangements with vendors,
with moderate financial returns. The middle school in Pennsylvania has a pouring contract with
Coca-Cola but does not receive any incentives for increasing volume. In contrast, while the New
Jersey high school does not have an exclusive contract with a vendor, it receives 25 cents for
every case of one vendors product sold. (The district food service supervisor estimated that the
school receives approximately $2,000 annually, in addition to a percentage of sales.) Finally, the
high school in Maryland has an exclusive contract with Coca-Cola and receives 44 percent of
sales from Coke products, with profits split evenly between the athletic department and a general
fund. None of the schools permit corporate advertising on or around school property, except for
logos that may appear on the vending machines themselves. Further, none of them receive non-
monetary incentives.20
20In addition to “Snapple Dollars” (term used to refer to reimbursements received from the
beverage company), the New Jersey high school earns between $650 and $700 each month from the three beverage vending machines near the cafeteria during lunch periods, and between $75 and $100 each month from these vending machines after school. Profits go to Child Nutrition Services, though 25 percent of after school sales go to school activities. The high school in Maryland earns about $2,680 each month from Coke products and $375 from snacks. Coke profits go to the athletic department, while 50 percent of the remaining profits go to the school’s general fund.
75
V. OTHER FINDINGS FROM THE STUDY
In planning the research, MPR staff conducted informal visits to 12 schools across the
country early in the project work, during March and April of 2003. The purpose of these visits
was to obtain information that would be useful in developing our prototype data collection plans.
In particular observing different types of competitive food arrangements allowed us to evaluate
the feasibility of collecting detailed information on competitive foods through various methods.
We incorporated the findings of this work into our subsequent data collection procedures, as
described in earlier chapters. However, this “reconnaissance” study obtained information in a
number of areas that may be useful to present directly, as it has the potential to inform future
research efforts in this area. In this chapter, we discuss the findings from the 12 school visits and
related data collection efforts as they relate to two key issues:
1. The feasibility of using data from electronic cash registers and related POS systems at schools to obtain information about competitive food use
2. The feasibility of obtaining detailed information on vending machine sales from the vending companies that operate machines in many schools
Our findings in these areas are presented in this chapter.
A. THE POSSIBILITY OF OBTAINING DATA FROM POS SYSTEMS IN SCHOOLS
As discussed below, using POS data to examine competitive food issues is, on the surface,
appealing. However, we determined that the available data are not detailed enough to allow the
kind of in-depth study that FNS specified for the current contract.
1. Findings from the Informal Visits
Generally, computerized POS systems allow food service personnel to track daily food
purchases by students. Cashiers at checkout stations use this equipment to record food
76
purchases.1 Half of the 12 schools we visited had some form of computerized POS checkout
system in place. The other schools did not have computerized systems and relied on traditional
cash registers or cash drawers for transacting purchases.
Based on our observations, there is considerable variation in the sophistication of POS
systems and the level of detail captured. For instance, some systems capture only broad
categories of food sales, such as the number of free, reduced-price, and full-price lunches sold on
a daily basis. Other systems, such as the WinSNAP School Foodservice Management Software,
record the types of food items sold and identify whether these items are reimbursable or a la
carte. Two schools that we visited used the WinSNAP system.2
The following examples illustrate the variation in the information captured by POS systems.
The first example describes a basic POS system, while the second characterizes one of the more
sophisticated systems we encountered.
• One high school uses POS cash registers only for items that are part of reimbursable
meals. POS cash registers are not used to record á la carte items. The reports the system produces include breakdowns on the number of free, reduced-price, and full-price lunches sold to students and adults on a daily basis.
• At another high school, the cash registers include keys for the broad types of food items served. For instance, there are keys for “cold sandwiches,” “assorted fruit,” “Little Debbie snack,” and “milk.” This system can produce detailed reports on the types of items sold and whether they were part of reimbursable lunch or a la carte. An example of the type of report this system can produce is shown in Table V.1.
1Students with debit accounts can have the cost of their meal automatically deducted from
their account. They also have the option of paying with cash.
2While a number of POS software systems are available to schools, the WinSNAP system appears to be the most widely used. The WinSNAP system is installed in nearly one-third of the largest 250 districts in the U.S.
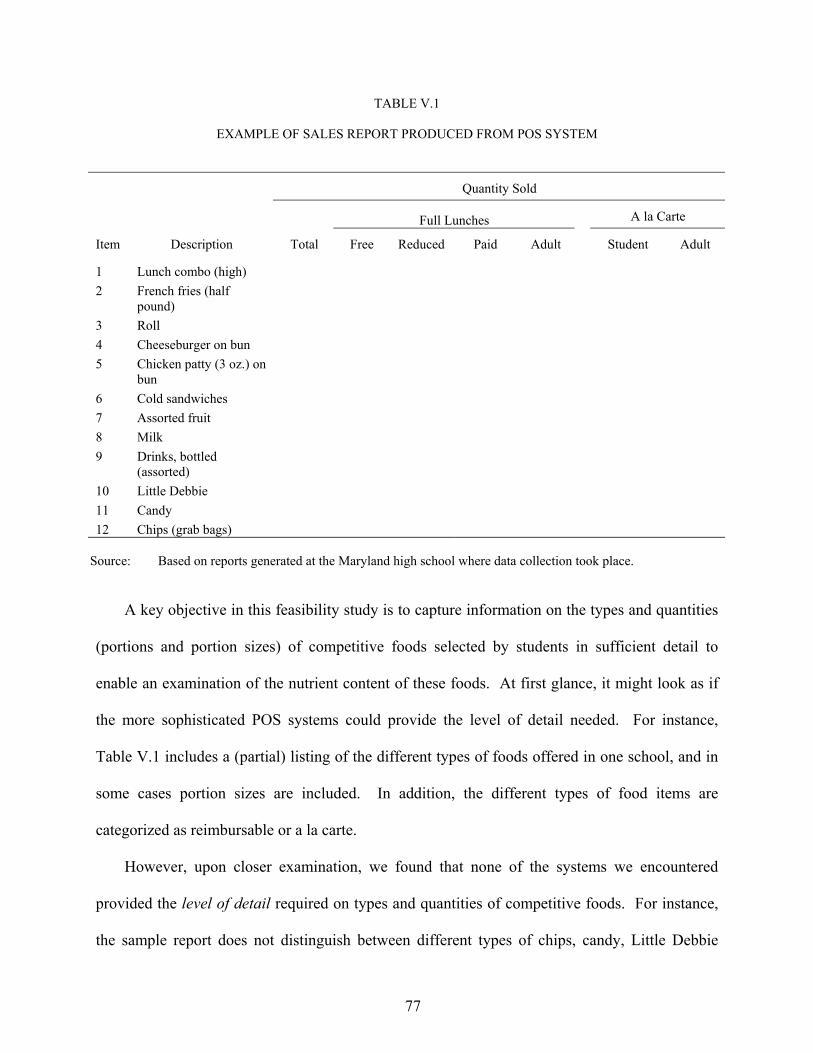
77
TABLE V.1
EXAMPLE OF SALES REPORT PRODUCED FROM POS SYSTEM Quantity Sold
Full Lunches A la Carte
Item Description Total Free Reduced Paid Adult Student Adult
1 Lunch combo (high) 2 French fries (half
pound)
3 Roll 4 Cheeseburger on bun 5 Chicken patty (3 oz.) on
bun
6 Cold sandwiches 7 Assorted fruit 8 Milk 9 Drinks, bottled
(assorted)
10 Little Debbie 11 Candy 12 Chips (grab bags)
Source: Based on reports generated at the Maryland high school where data collection took place.
A key objective in this feasibility study is to capture information on the types and quantities
(portions and portion sizes) of competitive foods selected by students in sufficient detail to
enable an examination of the nutrient content of these foods. At first glance, it might look as if
the more sophisticated POS systems could provide the level of detail needed. For instance,
Table V.1 includes a (partial) listing of the different types of foods offered in one school, and in
some cases portion sizes are included. In addition, the different types of food items are
categorized as reimbursable or a la carte.
However, upon closer examination, we found that none of the systems we encountered
provided the level of detail required on types and quantities of competitive foods. For instance,
the sample report does not distinguish between different types of chips, candy, Little Debbie
78
snacks, or drinks. The nutrient content of chips, for instance, depends significantly on whether
they are potato or corn chips, and whether or not they are “low fat.” Similarly, the Little Debbie
line of snacks includes myriad types of pastries, from fruit bars to cinnamon buns to chocolate
cake. Based on our observations of POS systems, we found that in all these systems, key food
items were grouped into broad categories in ways that would constrain nutrient coding. The
following list illustrates the level of detail required but generally not provided. None of the POS
systems we encountered could produce this level of detail:
• Types of cookies
• Kinds of packaged cakes from commercial vendors that produce a variety of cakes
• 100 percent versus 50 percent versus 10 percent fruit drinks
• Flavors of juice
• Diet beverage versus non-diet beverage
• Types of sandwich
• Potato chips versus corn chips
2. Summary
In summary, even though POS equipment is being used increasingly, numerous schools still
do not use it. Further, even in schools where POS equipment is used, the level of detail at which
foods are recorded usually does not support the kinds of analysis currently under consideration.
Our conclusion, therefore, is that computerized POS records, as they are currently configured,
cannot be used as the basis for the data collection being designed under this contract.
B. THE POSSIBILITY OF OBTAINING VENDING MACHINE DATA FROM VENDORS
The potential methods of collecting data for vending machines include gathering sales
records, conducting direct POS observations, or using a combination. One important issue was
79
whether sales records could produce adequate reports on the types and quantities of competitive
foods purchased from vending machines.
In this section we (1) present our findings from the 12 reconnaissance school visits
regarding the frequency of vending machine use and the availability of sales data, and (2) discuss
the best method of obtaining information on the types and quantities of competitive foods
purchased from vending machines. Table V.2 presents an overview of relevant data for each
school visited, including the number and location of vending machines, access times for students,
the range of food and beverage items sold, 3 and the availability of sales records.
1. Sales Records
To determine the adequacy of reviewing sales records to obtain vending machine sales data,
we needed to consider what sales information these schools could provide with reasonable effort.
Schools that stock vending machines directly may be more likely to have access to sales data
than those that do not. Of the nine schools in our sample where students can use vending
machines during the school day, four were stocked solely by outside vendors. Two additional
schools have vendors stock all machines outside the cafeteria, while food service staff stock
inside machines. We did not have stocking information for three schools.
Food service staff could provide complete sales data directly to researchers only for the two
schools where staff stock some machines themselves. In the other seven schools, food service
staff would have to request sales data from vendors if data were needed for research purposes.
Schools That Stock Their Own Machines. For the two schools with machines located in
the cafeterias and stocked by school staff, food service workers maintain sales records but could
3A 12th school (high school), in the Middle Atlantic states, did not have vending machines.
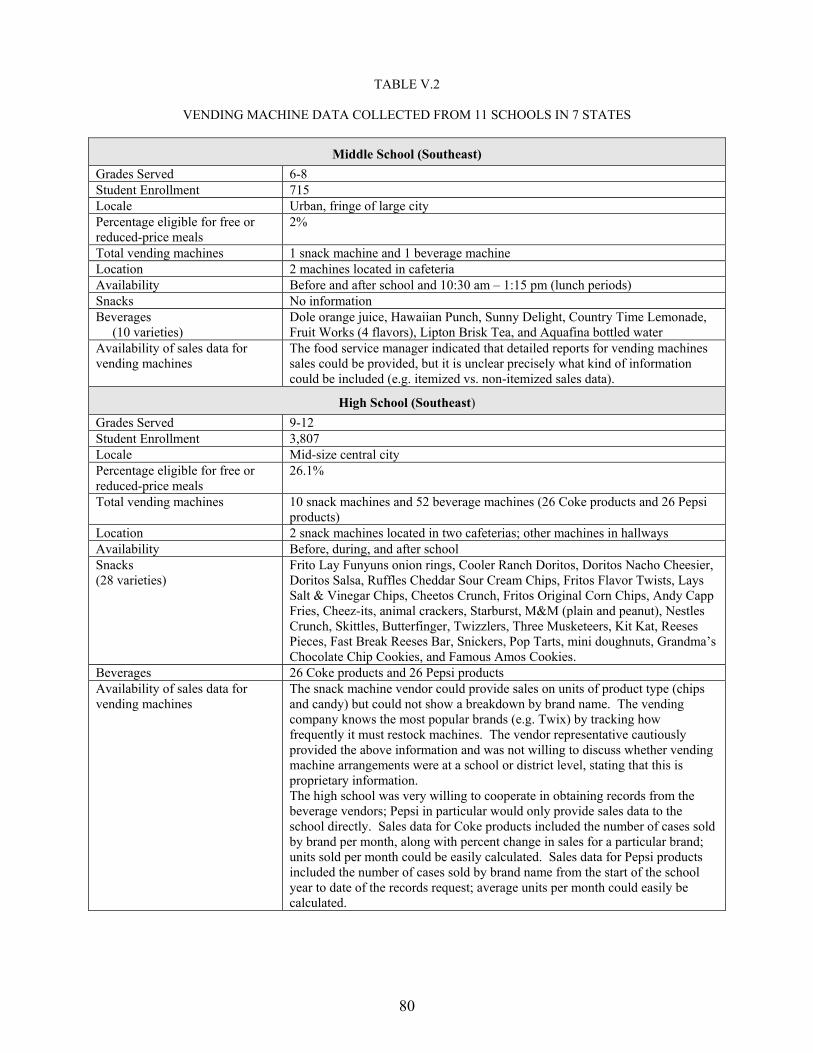
80
TABLE V.2
VENDING MACHINE DATA COLLECTED FROM 11 SCHOOLS IN 7 STATES
Middle School (Southeast) Grades Served 6-8 Student Enrollment 715 Locale Urban, fringe of large city Percentage eligible for free or reduced-price meals
2%
Total vending machines 1 snack machine and 1 beverage machine Location 2 machines located in cafeteria Availability Before and after school and 10:30 am – 1:15 pm (lunch periods) Snacks No information Beverages (10 varieties)
Dole orange juice, Hawaiian Punch, Sunny Delight, Country Time Lemonade, Fruit Works (4 flavors), Lipton Brisk Tea, and Aquafina bottled water
Availability of sales data for vending machines
The food service manager indicated that detailed reports for vending machines sales could be provided, but it is unclear precisely what kind of information could be included (e.g. itemized vs. non-itemized sales data).
High School (Southeast) Grades Served 9-12 Student Enrollment 3,807 Locale Mid-size central city Percentage eligible for free or reduced-price meals
26.1%
Total vending machines 10 snack machines and 52 beverage machines (26 Coke products and 26 Pepsi products)
Location 2 snack machines located in two cafeterias; other machines in hallways Availability Before, during, and after school Snacks (28 varieties)
Frito Lay Funyuns onion rings, Cooler Ranch Doritos, Doritos Nacho Cheesier, Doritos Salsa, Ruffles Cheddar Sour Cream Chips, Fritos Flavor Twists, Lays Salt & Vinegar Chips, Cheetos Crunch, Fritos Original Corn Chips, Andy Capp Fries, Cheez-its, animal crackers, Starburst, M&M (plain and peanut), Nestles Crunch, Skittles, Butterfinger, Twizzlers, Three Musketeers, Kit Kat, Reeses Pieces, Fast Break Reeses Bar, Snickers, Pop Tarts, mini doughnuts, Grandma’s Chocolate Chip Cookies, and Famous Amos Cookies.
Beverages 26 Coke products and 26 Pepsi products Availability of sales data for vending machines
The snack machine vendor could provide sales on units of product type (chips and candy) but could not show a breakdown by brand name. The vending company knows the most popular brands (e.g. Twix) by tracking how frequently it must restock machines. The vendor representative cautiously provided the above information and was not willing to discuss whether vending machine arrangements were at a school or district level, stating that this is proprietary information. The high school was very willing to cooperate in obtaining records from the beverage vendors; Pepsi in particular would only provide sales data to the school directly. Sales data for Coke products included the number of cases sold by brand per month, along with percent change in sales for a particular brand; units sold per month could be easily calculated. Sales data for Pepsi products included the number of cases sold by brand name from the start of the school year to date of the records request; average units per month could easily be calculated.
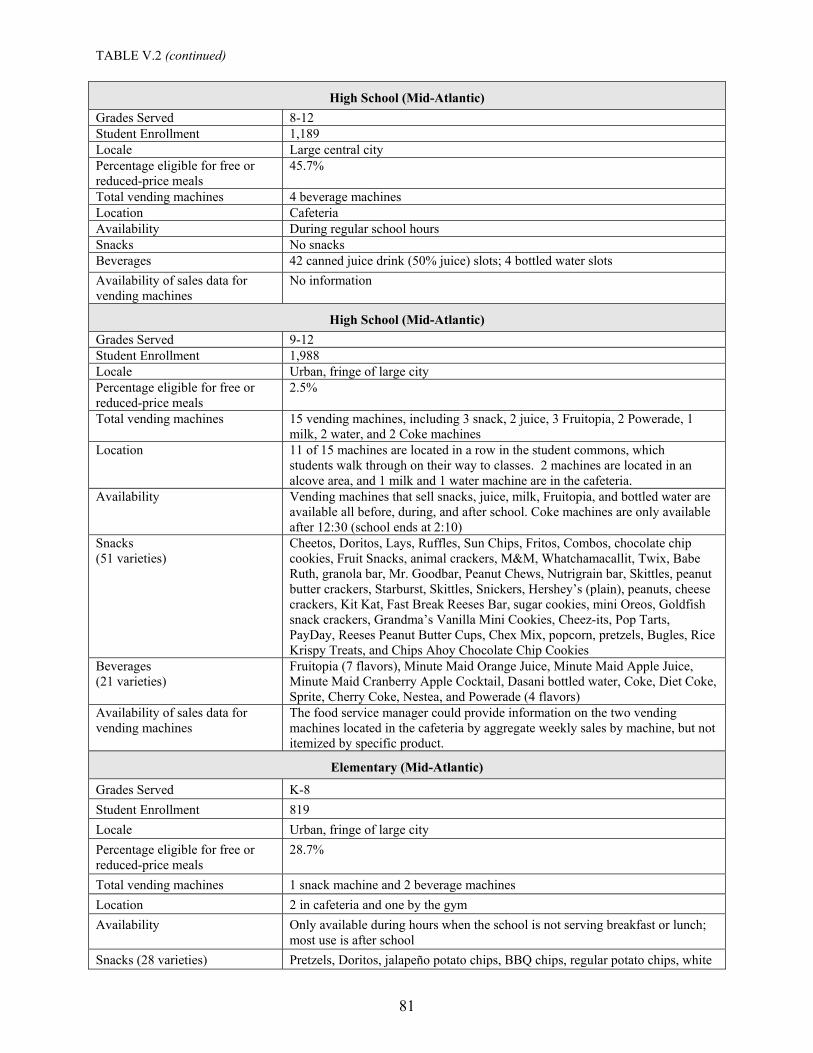
TABLE V.2 (continued)
81
High School (Mid-Atlantic) Grades Served 8-12 Student Enrollment 1,189 Locale Large central city Percentage eligible for free or reduced-price meals
45.7%
Total vending machines 4 beverage machines Location Cafeteria Availability During regular school hours Snacks No snacks Beverages 42 canned juice drink (50% juice) slots; 4 bottled water slots Availability of sales data for vending machines
No information
High School (Mid-Atlantic) Grades Served 9-12 Student Enrollment 1,988 Locale Urban, fringe of large city Percentage eligible for free or reduced-price meals
2.5%
Total vending machines 15 vending machines, including 3 snack, 2 juice, 3 Fruitopia, 2 Powerade, 1 milk, 2 water, and 2 Coke machines
Location 11 of 15 machines are located in a row in the student commons, which students walk through on their way to classes. 2 machines are located in an alcove area, and 1 milk and 1 water machine are in the cafeteria.
Availability Vending machines that sell snacks, juice, milk, Fruitopia, and bottled water are available all before, during, and after school. Coke machines are only available after 12:30 (school ends at 2:10)
Snacks (51 varieties)
Cheetos, Doritos, Lays, Ruffles, Sun Chips, Fritos, Combos, chocolate chip cookies, Fruit Snacks, animal crackers, M&M, Whatchamacallit, Twix, Babe Ruth, granola bar, Mr. Goodbar, Peanut Chews, Nutrigrain bar, Skittles, peanut butter crackers, Starburst, Skittles, Snickers, Hershey’s (plain), peanuts, cheese crackers, Kit Kat, Fast Break Reeses Bar, sugar cookies, mini Oreos, Goldfish snack crackers, Grandma’s Vanilla Mini Cookies, Cheez-its, Pop Tarts, PayDay, Reeses Peanut Butter Cups, Chex Mix, popcorn, pretzels, Bugles, Rice Krispy Treats, and Chips Ahoy Chocolate Chip Cookies
Beverages (21 varieties)
Fruitopia (7 flavors), Minute Maid Orange Juice, Minute Maid Apple Juice, Minute Maid Cranberry Apple Cocktail, Dasani bottled water, Coke, Diet Coke, Sprite, Cherry Coke, Nestea, and Powerade (4 flavors)
Availability of sales data for vending machines
The food service manager could provide information on the two vending machines located in the cafeteria by aggregate weekly sales by machine, but not itemized by specific product.
Elementary (Mid-Atlantic)
Grades Served K-8 Student Enrollment 819 Locale Urban, fringe of large city Percentage eligible for free or reduced-price meals
28.7%
Total vending machines 1 snack machine and 2 beverage machines Location 2 in cafeteria and one by the gym Availability Only available during hours when the school is not serving breakfast or lunch;
most use is after school Snacks (28 varieties) Pretzels, Doritos, jalapeño potato chips, BBQ chips, regular potato chips, white
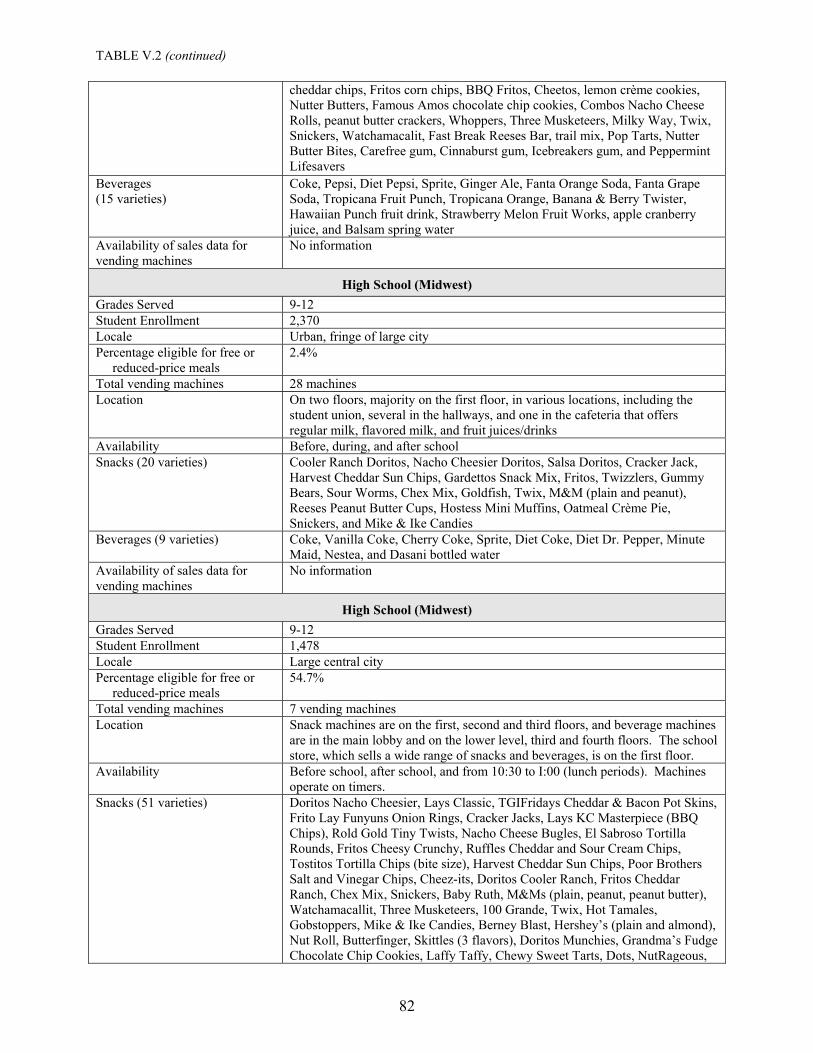
TABLE V.2 (continued)
82
cheddar chips, Fritos corn chips, BBQ Fritos, Cheetos, lemon crème cookies, Nutter Butters, Famous Amos chocolate chip cookies, Combos Nacho Cheese Rolls, peanut butter crackers, Whoppers, Three Musketeers, Milky Way, Twix, Snickers, Watchamacalit, Fast Break Reeses Bar, trail mix, Pop Tarts, Nutter Butter Bites, Carefree gum, Cinnaburst gum, Icebreakers gum, and Peppermint Lifesavers
Beverages (15 varieties)
Coke, Pepsi, Diet Pepsi, Sprite, Ginger Ale, Fanta Orange Soda, Fanta Grape Soda, Tropicana Fruit Punch, Tropicana Orange, Banana & Berry Twister, Hawaiian Punch fruit drink, Strawberry Melon Fruit Works, apple cranberry juice, and Balsam spring water
Availability of sales data for vending machines
No information
High School (Midwest) Grades Served 9-12 Student Enrollment 2,370 Locale Urban, fringe of large city Percentage eligible for free or reduced-price meals
2.4%
Total vending machines 28 machines Location On two floors, majority on the first floor, in various locations, including the
student union, several in the hallways, and one in the cafeteria that offers regular milk, flavored milk, and fruit juices/drinks
Availability Before, during, and after school Snacks (20 varieties) Cooler Ranch Doritos, Nacho Cheesier Doritos, Salsa Doritos, Cracker Jack,
Harvest Cheddar Sun Chips, Gardettos Snack Mix, Fritos, Twizzlers, Gummy Bears, Sour Worms, Chex Mix, Goldfish, Twix, M&M (plain and peanut), Reeses Peanut Butter Cups, Hostess Mini Muffins, Oatmeal Crème Pie, Snickers, and Mike & Ike Candies
Beverages (9 varieties) Coke, Vanilla Coke, Cherry Coke, Sprite, Diet Coke, Diet Dr. Pepper, Minute Maid, Nestea, and Dasani bottled water
Availability of sales data for vending machines
No information
High School (Midwest) Grades Served 9-12 Student Enrollment 1,478 Locale Large central city Percentage eligible for free or reduced-price meals
54.7%
Total vending machines 7 vending machines Location Snack machines are on the first, second and third floors, and beverage machines
are in the main lobby and on the lower level, third and fourth floors. The school store, which sells a wide range of snacks and beverages, is on the first floor.
Availability Before school, after school, and from 10:30 to I:00 (lunch periods). Machines operate on timers.
Snacks (51 varieties) Doritos Nacho Cheesier, Lays Classic, TGIFridays Cheddar & Bacon Pot Skins, Frito Lay Funyuns Onion Rings, Cracker Jacks, Lays KC Masterpiece (BBQ Chips), Rold Gold Tiny Twists, Nacho Cheese Bugles, El Sabroso Tortilla Rounds, Fritos Cheesy Crunchy, Ruffles Cheddar and Sour Cream Chips, Tostitos Tortilla Chips (bite size), Harvest Cheddar Sun Chips, Poor Brothers Salt and Vinegar Chips, Cheez-its, Doritos Cooler Ranch, Fritos Cheddar Ranch, Chex Mix, Snickers, Baby Ruth, M&Ms (plain, peanut, peanut butter), Watchamacallit, Three Musketeers, 100 Grande, Twix, Hot Tamales, Gobstoppers, Mike & Ike Candies, Berney Blast, Hershey’s (plain and almond), Nut Roll, Butterfinger, Skittles (3 flavors), Doritos Munchies, Grandma’s Fudge Chocolate Chip Cookies, Laffy Taffy, Chewy Sweet Tarts, Dots, NutRageous,
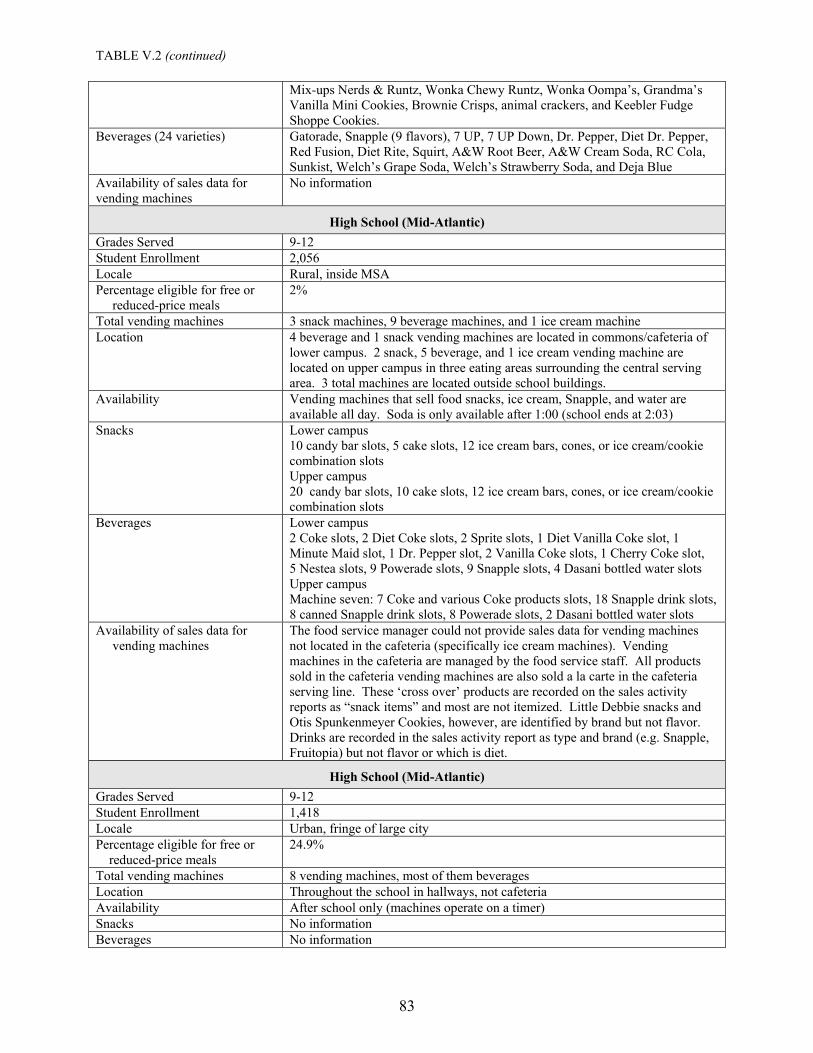
TABLE V.2 (continued)
83
Mix-ups Nerds & Runtz, Wonka Chewy Runtz, Wonka Oompa’s, Grandma’s Vanilla Mini Cookies, Brownie Crisps, animal crackers, and Keebler Fudge Shoppe Cookies.
Beverages (24 varieties) Gatorade, Snapple (9 flavors), 7 UP, 7 UP Down, Dr. Pepper, Diet Dr. Pepper, Red Fusion, Diet Rite, Squirt, A&W Root Beer, A&W Cream Soda, RC Cola, Sunkist, Welch’s Grape Soda, Welch’s Strawberry Soda, and Deja Blue
Availability of sales data for vending machines
No information
High School (Mid-Atlantic) Grades Served 9-12 Student Enrollment 2,056 Locale Rural, inside MSA Percentage eligible for free or reduced-price meals
2%
Total vending machines 3 snack machines, 9 beverage machines, and 1 ice cream machine Location 4 beverage and 1 snack vending machines are located in commons/cafeteria of
lower campus. 2 snack, 5 beverage, and 1 ice cream vending machine are located on upper campus in three eating areas surrounding the central serving area. 3 total machines are located outside school buildings.
Availability Vending machines that sell food snacks, ice cream, Snapple, and water are available all day. Soda is only available after 1:00 (school ends at 2:03)
Snacks Lower campus 10 candy bar slots, 5 cake slots, 12 ice cream bars, cones, or ice cream/cookie combination slots Upper campus 20 candy bar slots, 10 cake slots, 12 ice cream bars, cones, or ice cream/cookie combination slots
Beverages Lower campus 2 Coke slots, 2 Diet Coke slots, 2 Sprite slots, 1 Diet Vanilla Coke slot, 1 Minute Maid slot, 1 Dr. Pepper slot, 2 Vanilla Coke slots, 1 Cherry Coke slot, 5 Nestea slots, 9 Powerade slots, 9 Snapple slots, 4 Dasani bottled water slots Upper campus Machine seven: 7 Coke and various Coke products slots, 18 Snapple drink slots, 8 canned Snapple drink slots, 8 Powerade slots, 2 Dasani bottled water slots
Availability of sales data for vending machines
The food service manager could not provide sales data for vending machines not located in the cafeteria (specifically ice cream machines). Vending machines in the cafeteria are managed by the food service staff. All products sold in the cafeteria vending machines are also sold a la carte in the cafeteria serving line. These ‘cross over’ products are recorded on the sales activity reports as “snack items” and most are not itemized. Little Debbie snacks and Otis Spunkenmeyer Cookies, however, are identified by brand but not flavor. Drinks are recorded in the sales activity report as type and brand (e.g. Snapple, Fruitopia) but not flavor or which is diet.
High School (Mid-Atlantic) Grades Served 9-12 Student Enrollment 1,418 Locale Urban, fringe of large city Percentage eligible for free or reduced-price meals
24.9%
Total vending machines 8 vending machines, most of them beverages Location Throughout the school in hallways, not cafeteria Availability After school only (machines operate on a timer) Snacks No information Beverages No information
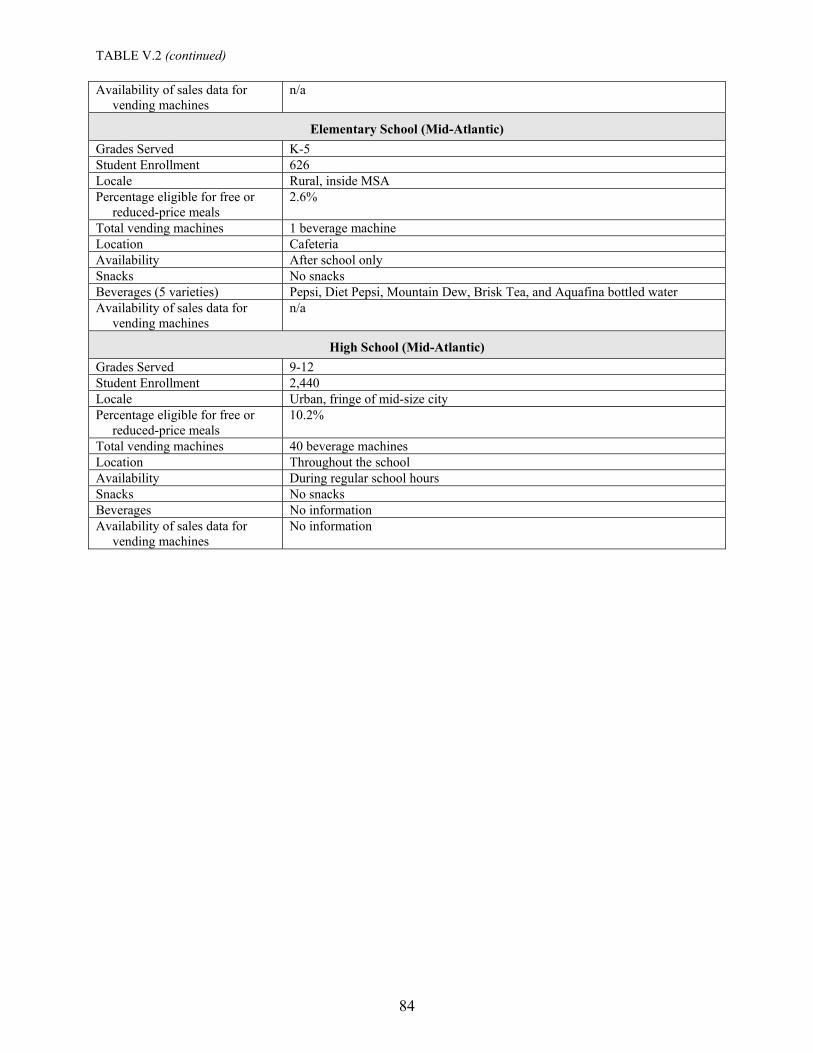
TABLE V.2 (continued)
84
Availability of sales data for vending machines
n/a
Elementary School (Mid-Atlantic) Grades Served K-5 Student Enrollment 626 Locale Rural, inside MSA Percentage eligible for free or reduced-price meals
2.6%
Total vending machines 1 beverage machine Location Cafeteria Availability After school only Snacks No snacks Beverages (5 varieties) Pepsi, Diet Pepsi, Mountain Dew, Brisk Tea, and Aquafina bottled water Availability of sales data for vending machines
n/a
High School (Mid-Atlantic) Grades Served 9-12 Student Enrollment 2,440 Locale Urban, fringe of mid-size city Percentage eligible for free or reduced-price meals
10.2%
Total vending machines 40 beverage machines Location Throughout the school Availability During regular school hours Snacks No snacks Beverages No information Availability of sales data for vending machines
No information
85
not provide detailed itemized information. At one of these schools, the food service manager
reported that her high school does not track what is sold in vending machines outside the
cafeteria. Instead, machines are simply restocked by an outside vendor (see next section for
what these vendors could provide). At that school, items sold in the cafeteria’s vending
machines are recorded in a somewhat detailed fashion, but not at the level of detail that would
indicate exact quantities of which products students purchase. For example, since all items sold
in the machines are also sold a la carte in the cafeteria serving line, the food service manager
records the sales figures for these crossover items as simply snacks in the sales activity reports.4
Little Debbie and Otis Spunkenmeyer baked goods are identified by brand but not flavor. Drinks
are recorded by type and brand but are not classified by flavor or whether they are diet versus
non-diet.
The food service manager from the other high school that manages vending machines in the
cafeteria could provide aggregate weekly sales data by machine on the milk and bottled water
machines, but not on the other 13 machines located throughout the school.
Obtaining Information from Outside Vendors. The other potential source for vending
machine sales data is the outside vendors. We have information on this only for three schools in
the sample, and, based on those schools, it seems that obtaining sales data in any format could be
challenging. Examples of what sales data vendors could supply varied from school to school,
and even from vendor to vendor within a school. One high school had contracts with three
vendors—one for snacks and two for beverages. The school staff showed our site visitor a
4For example, if the vending machine sells pretzels, potato chips, crackers, and cupcakes, the
serving line also sells these four items. Sales records would show the aggregate sales for these four products under the heading “snacks” (not total sales for pretzels, total sales for chips, and so on), regardless of whether they were purchased a la carte or through the vending machine.
86
sample sales report directly from the Coca-Cola vendor, which indicated the number of cases
sold by brand name and type (such as Coke versus Diet Coke) per month.
In contrast, the Pepsi vendor would release information indicating only the number of cases
sold by brand name (such as Diet Pepsi versus Pepsi Blue) since the beginning of the school
year. The assistant principal willingly interceded on the interviewer’s behalf to obtain this
information from the Pepsi vendor, but it took considerable time and effort, by both the school
and of the interviewer.5 The snack vendor was even less forthcoming with sharing information.
The vendor representative discussed the broad types of sales (sales by food type, such as chips or
candy) but would not provide information about detailed brand type or brand name, citing
concerns about proprietary information.
Another high school food service manager noted that a beverage vendor submits monthly
reports itemizing sales by three categories—7 UP products, Gatorade, and other drinks. An
additional report of the number of cases of each item sold is available upon request by the
school. Reports on what the snack vendor could provide at this school are less precise. A
distributor prepares a report reflecting units sold per machine, but sales data are not itemized by
product. According to a school official, the vendor might be able to obtain information on the
number of each item sold, but the report would be in a “very crude form.” (It was not clear what
level of detail this implied.)
At a third high school, the food service manager seemed confident that she could obtain
information from the vendors but was not sure how detailed the information would be, for
5The researcher spent about six hours making multiple trips to the school to meet with the assistant principal and obtain the reports.
87
example, whether the data would be aggregate sales by machine, sales by food category, or sales
itemized by specific product type and brand.
At another school, a business manager tried multiple times over several weeks at MPR’s
request to obtain sales information from a vending company but could not get his call returned.
This experience suggests that it could be difficult it could be to obtain information from vendors,
even when school officials intervene on behalf of the researchers.
2. Issues Related to Access to Vending Machines
Even to the extent that schools could provide vending machine sales data fairly easily—
either directly or by submitting requests to the vendors—the data could be misleading, depending
on who uses the machines and when students can access them. In particular, if adult staff and
visitors also use machines, it may not be possible to determine the quantity of snacks and
beverages that students purchase.
Moreover, our focus here is on items purchased during the regular school day. Even if
students use the vending machines exclusively, it could be difficult to obtain information that
indicates the times of day that items have been purchased. This is illustrated by our findings in
the schools we visited. In five schools, students can access all vending machines all day, as well
as before and after school. Three schools allow snack machines to operate all day, but soda
machines are available only after the last lunch period ends. One K–8 school allows students to
use the vending machines only at times other than when breakfast and lunch are served, and a
high school allows students to use machines only before and after school and during lunch
periods. An elementary school and a high school permit students to use machines only after
school. In general, it would be virtually impossible to exclude purchases made before and after
school, as well as on weekends.
88
3. Recommendations
The type of analysis specified for the current study requires detailed information about foods
used. For instance, one needs to know (1) the type of prepackaged baked goods sold in vending
machines, (2) the type of chips, and (3) whether sodas sold were regular or diet.
Based on the informal discussions with 12 schools reported above, we believe it is quite
unlikely that sufficiently detailed sales records could be reliably obtained from vendors. We also
believe that any attempt to obtain such data could impose considerable burden on school staff, in
terms of their required interactions with vendors who would be reluctant or unable to supply this
information.
Based on our findings from the reconnaissance visits, we concluded that direct observation
would tend to yield more accurate sales data than records supplied by school or vendors. First,
the content of sales data provided by vendors could vary considerably across schools. Second, it
appears that the cooperation of outside vendors would not be assured, both because of burden
issues and because private vendors might be unwilling to release proprietary sales data. Also, in
many schools it cannot be assumed that items sold in the machines were sold during regular
school hours or were purchased by students. School staff and visitors can often use the same
vending machines as students, and students purchase items during non-school hours.
In light of these factors, in designing the data collection for the current study, we decided to
focus on direct observation of POS sales at the vending machines. We believe that this method
worked quite well. However, because of the costs of stationing observers at specific machines, it
yields less comprehensive data than those that could be obtained from detailed and
comprehensive sales records.
Finally, in assessing our somewhat negative conclusion about the feasibility of obtaining
vendor data, we note that issues related to vendors were only one matter among many discussed
89
in the 12 school visits. Also, it was only when we were well into this exploratory study that we
realized fully the importance of this issue. As a result, we do not feel that we have researched
the issue as far as we could. To pursue this source of data further, would require an intensive
effort involving trying to obtain vendor data for a sample of schools. Such a study would not
necessarily need to be very expensive, but it would have to include enough schools to capture the
range of variation involved. We do not doubt that vendor data can be obtained at some schools.
The relevant question, however, is whether they could be obtained consistently at most schools.
Based on our preliminary reconnaissance, we think the answer to this questions is “no,” but we
cannot be certain at this point.
90
VI. CONCLUSIONS
Our basic objectives in this study were to determine whether it was feasible to collect
detailed information about competitive foods in schools and, if so, to develop and test procedures
for doing so. We believe that these objectives have largely been accomplished through the three-
school data collection. Our conclusions from this work are summarized in this chapter.
A. IS IT FEASIBLE TO USE THE POINT OF SALE OBSERVATION APPROACH TO
COLLECT COMPETITIVE FOOD DATA?
Based on initial impressions from reconnaissance visits to 12 schools in an early stage of the
study, along with formal data collection at three sites later in the study, we conclude that it is
feasible to use a POS-based observational approach to collect data on competitive foods. Using
this direct observation approach, we obtained data that appear to be reasonably accurate and
substantively interesting.
Moreover, there is strong evidence that the data collection was not burdensome to district
and school-level staff. During on-site data collection, the observers were generally unobtrusive,
and their presence did not affect food service operations during food preparation and food
service. Overall the estimated staff time required at the sites was very low, ranging from a total
of 2.5 hours to 6 hours.
The basic resources MPR needed for collecting the data at a school were:
• 2 to 3 hours of set-up time over the telephone by mid-level staff
• 2 to 3 hours of sampling by a mid-level statistical specialist
• 6 days of observation time by trained junior-level staff
• Approximately 4 days of coding data entry by trained junior-level staff
91
While none of the three schools had a school store, we are confident that the approach could
be extended to this and similar competitive food sources as well. During our early
reconnaissance at twelve schools, we noted few school stores, and they sold a very limited
number of different food items.1 Therefore, implementing POS observation procedures at the
school stores we observed during our reconnaissance would have been even easier than
observing transactions at snack or á la carte lines in the cafeteria.
B. WHAT ARE SOME KEY LESSONS LEARNED ABOUT HOW TO COLLECT THESE DATA?
Possible Use of Electronic Cash Register Data. Data from POS cash register equipment is
seldom—if ever—detailed enough to permit transaction-level nutrient coding of reimbursable
versus competitive food items. Some schools simply use a cash box and have no systematic
recording system to track individual transactions; even those schools with electronic equipment
do not record items with enough detail to allow full nutrient coding. By contrast, the
observational approach can be applied universally to all POS regardless of the degree of
sophistication of the cash receipt system.
Possibility of Obtaining Vending Machine Data from Vendors. Obtaining vending
machine use data from the vending companies is difficult because of problems (1) accessing the
companies through the schools, (2) getting their cooperation to provide sales data, and
(3) obtaining enough detail in the data the companies record for individual schools.
Consequently, we believe the POS approach is more reliable.
Sampling. Sampling POS can be more difficult than originally anticipated, because the
sampling process involves sampling not only the POS but also the times at which they will be
1One exception was a high school store in Iowa that sold a full range of chewing gum,
chocolate, non-chocolate candy (including lollipops), salty snacks, cookies, and beef jerky.
92
observed. Furthermore, the process is constrained by the number of observers available at any
given time. However, we believe that the approach we developed is statistically efficient and
quite generalizable. The detailed instrumentation and protocols that we used worked well and
could easily be adapted to a larger study.
C. SUBSTANTIVE FINDINGS THAT COULD AFFECT DATA COLLECTION STRATEGIES
In this study, there were three interesting findings that could affect any strategy for
collecting data on competitive foods. First, competitive foods were a substantial component of
the overall food sales that took place at each school. As a percentage of calories sold, they
ranged from 59.3 to 72.1 percent (see Table IV.2). This caloric information highlights the
importance of these foods.
Second, it is frequently not useful to distinguish analytically between vending machines and
serving lines. Frequently, the same foods (fruit drinks, salty snacks, baked goods) are sold
simultaneously by the lunch lines and the vending machines. Any data collection strategy that
focused only on vending machines would omit substantial quantities of the specific foods those
machines sell.
Third, for at least some nutritional criteria, competitive foods are not necessarily always less
nutritionally desirable than the foods that constitute reimbursable meals. In particular, because
of the high incidence of soda and fruit drinks among competitive food sales, the average
percentage fat content of competitive foods, taken as a whole, tends to be lower than for
reimbursable meals.
93
D. COULD SCHOOLS APPLY THESE POS OBSERVATION TECHNIQUES THEMSELVES TO MONITOR THEIR OWN USE OF COMPETITIVE FOODS?
Most of the basic data collection procedures that we used at the three schools could be
effectively implemented by schools themselves. However, they would probably need some
technical assistance from an external agency for certain components of the work..
Assembling the up-front “setup” information (most important, descriptions of all the POS)
could be done by the schools. Food service staff could also observe and record the POS
transactions, as well as provide recipes, package labels, and portion information for nutrient
coding of items selected by students. This would require only minor modification of the
protocols.
However, three salient research activities, sampling, food data coding, and statistical
computer analysis of the data, require technical expertise not usually available within school
districts. However, with volume, these steps could be streamlined, so that an outside agency
performing them could do so for a reasonable unit cost.
95
REFERENCES
Bodgen, Jim. Fit, Healthy, and Ready to Learn: A School Health Policy Guide. Alexandria, VA: National Association of School Boards of Education, 2000.
Fox, Mary Kay, Mary Kay Crepinsek, Patty Connor, and Michael Battaglia. “School Nutrition Dietary Assessment Study-II: Final Report.” Cambridge, MA: Abt Associates, Inc., April 2001.
French, Simone A., Robert W. Jeffrey, Mary Story, Kyke K. Breitlow, Judith S. Baxter, Peter Hannan, and M. Patricia Snyder. “Pricing and Promotion Effects on Low-Fat Vending Snack Purchases: The CHIPS Study.” American Journal of Public Health, vol. 91, no. 1, January 2001.
Gordon, Anne, Ronette Briefel, Karen Needels, Nancy Wemmerus, Teresa Zavitsky, Randy Rosso, Tania Tasse, Laura Kalb, Anne Peterson, and Darryl Creel. “Feeding Low-Income Children When School Is Out: The Summer Food Service Program: Final Report.” Princeton, NJ: Mathematica Policy Research, Inc., March 2003.
Jacobson, Michael F. “Liquid Candy: How Soft Drinks Are Harming Americans’ Health.” Washington, DC: Center for Science in the Public Interest, 1998.
National Academies Press Website. http://books.nap.edu/books/0309085373/ html/1.html#pagetop].National Center for Education Statistics. “Common Core of Data.” [http://nces.ed.gov/ccd/]
U.S. Department of Agriculture. “Foods Sold in Competition with USDA School Meal Programs. A Report to Congress.” Washington, DC: USDA, January 2001.
U.S. Department of Agriculture, Food and Nutrition Service. A Menu Planner for Healthy School Meals.(Publication no. FNS-303. Washington, DC: 1998, Chs. 1-4 and Appendixes.
U.S. General Accounting Office. “Commercial Activities in Schools.” Publication no. GSO/HEHS-00-156. Washington, DC: September 2000.
Wechsler, Howell, Nancy D. Brener, Sarah Kuester, and Clare Miller. “Food Service and Foods and Beverages Available at School: Results from the School Health Policies and Programs Study 2000;” Journal of School Health, volume 71, no. 7; September 2001.
APPENDIX A
DATA COLLECTION INSTRUMENTS
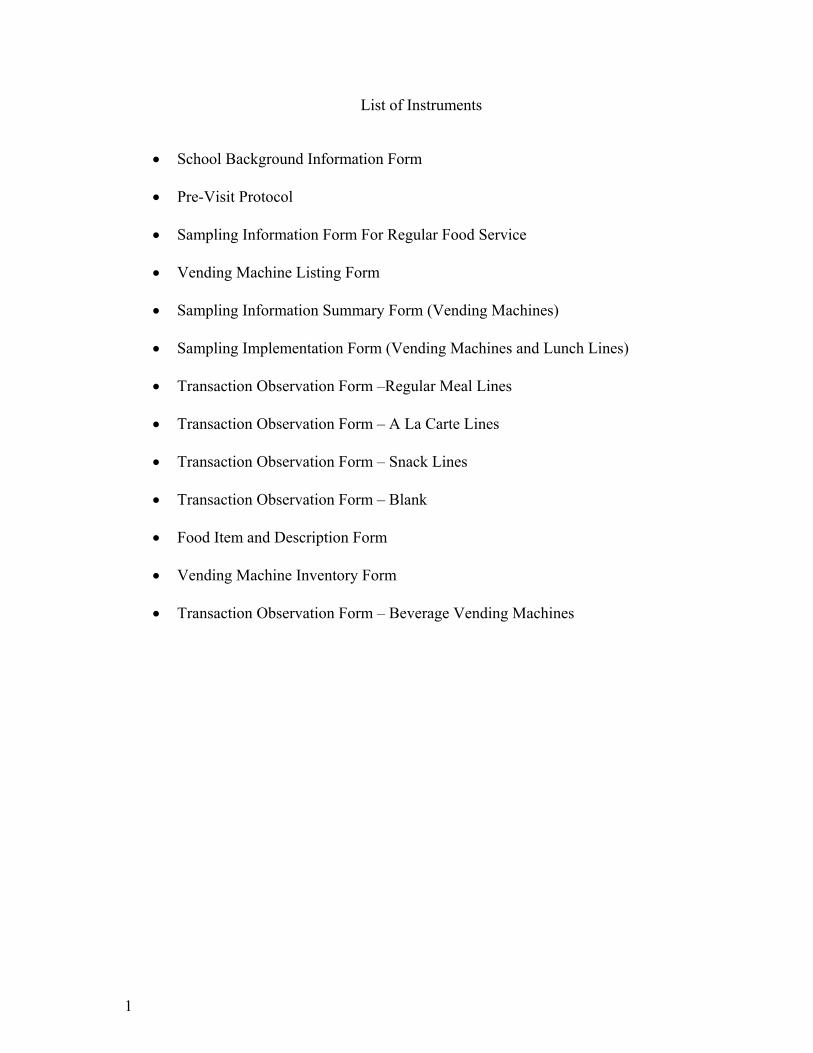
1
List of Instruments
• School Background Information Form
• Pre-Visit Protocol
• Sampling Information Form For Regular Food Service
• Vending Machine Listing Form
• Sampling Information Summary Form (Vending Machines)
• Sampling Implementation Form (Vending Machines and Lunch Lines)
• Transaction Observation Form –Regular Meal Lines
• Transaction Observation Form – A La Carte Lines
• Transaction Observation Form – Snack Lines
• Transaction Observation Form – Blank
• Food Item and Description Form
• Vending Machine Inventory Form
• Transaction Observation Form – Beverage Vending Machines
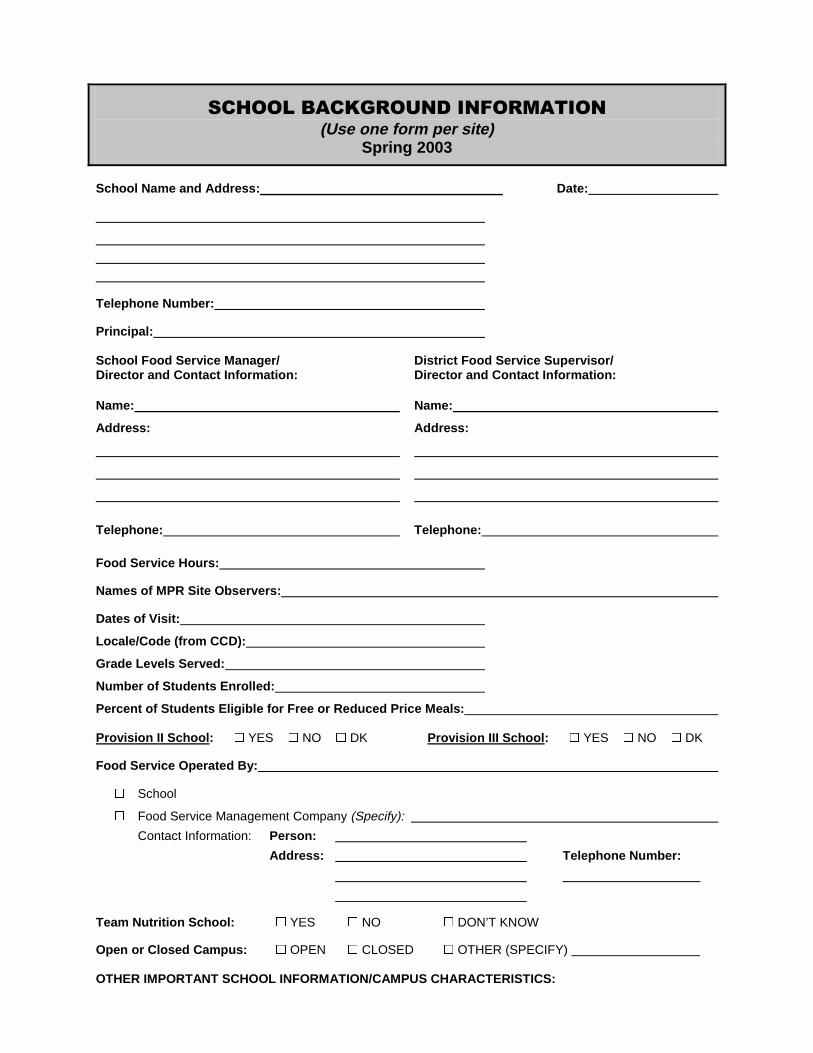
������������� ��� �������� �
(Use one form per site) Spring 2003
School Name and Address: Date:
Telephone Number: Principal: School Food Service Manager/ Director and Contact Information:
District Food Service Supervisor/ Director and Contact Information:
Name: Name:
Address:
Address:
Telephone: Telephone:
Food Service Hours: Names of MPR Site Observers: Dates of Visit:
Locale/Code (from CCD):
Grade Levels Served:
Number of Students Enrolled:
Percent of Students Eligible for Free or Reduced Price Meals: Provision II School: � YES � NO � DK Provision III School: � YES � NO � DK Food Service Operated By: � School
� Food Service Management Company (Specify):
Contact Information: Person:
Address: Telephone Number:
Team Nutrition School: � YES � NO � DON’T KNOW Open or Closed Campus: � OPEN � CLOSED � OTHER (SPECIFY) OTHER IMPORTANT SCHOOL INFORMATION/CAMPUS CHARACTERISTICS:
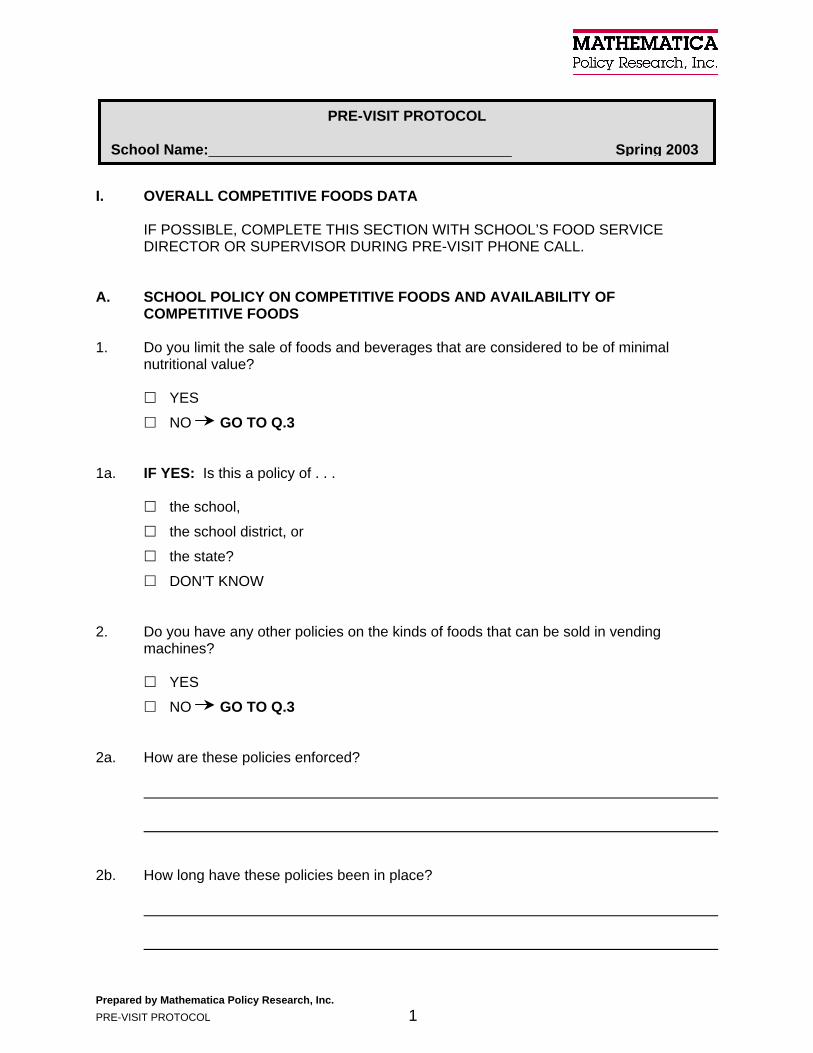
Prepared by Mathematica Policy Research, Inc. PRE-VISIT PROTOCOL 1
PRE-VISIT PROTOCOL
School Name: Spring 2003
I. OVERALL COMPETITIVE FOODS DATA IF POSSIBLE, COMPLETE THIS SECTION WITH SCHOOL’S FOOD SERVICE
DIRECTOR OR SUPERVISOR DURING PRE-VISIT PHONE CALL. A. SCHOOL POLICY ON COMPETITIVE FOODS AND AVAILABILITY OF
COMPETITIVE FOODS
1. Do you limit the sale of foods and beverages that are considered to be of minimal nutritional value?
! YES ! NO GO TO Q.3
1a. IF YES: Is this a policy of . . . ! the school, ! the school district, or ! the state? ! DON’T KNOW 2. Do you have any other policies on the kinds of foods that can be sold in vending
machines? ! YES ! NO GO TO Q.3 2a. How are these policies enforced? 2b. How long have these policies been in place?
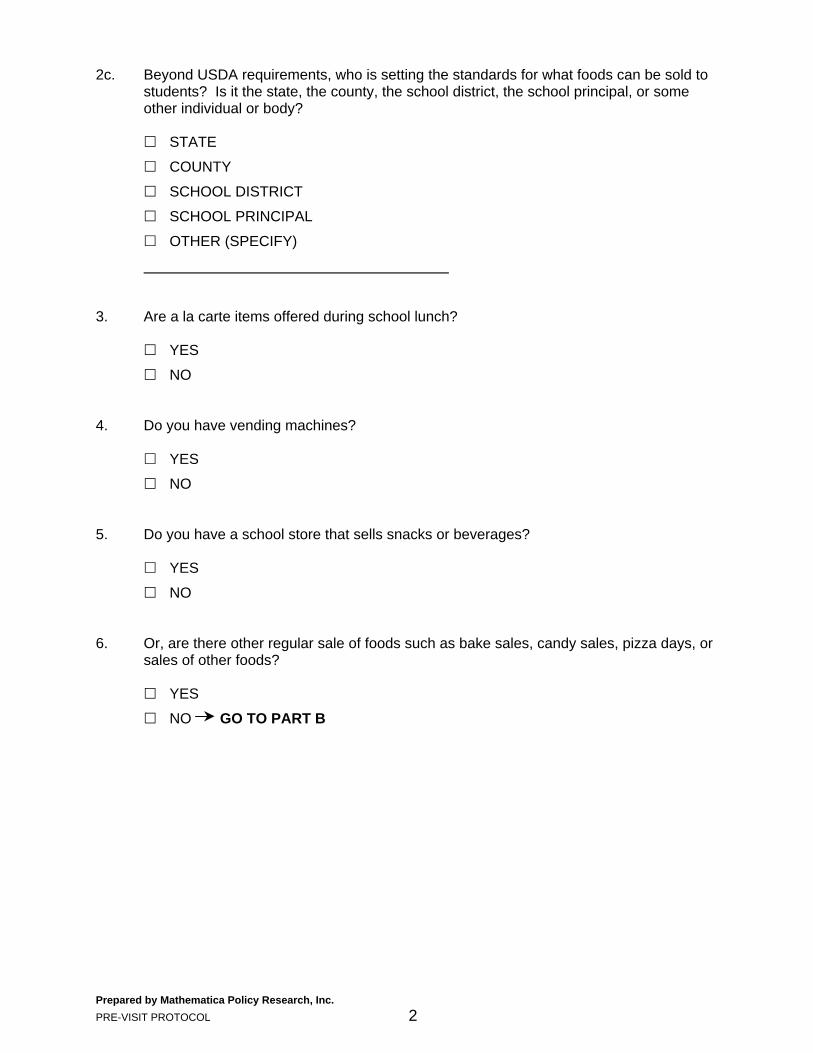
Prepared by Mathematica Policy Research, Inc. PRE-VISIT PROTOCOL 2
2c. Beyond USDA requirements, who is setting the standards for what foods can be sold to students? Is it the state, the county, the school district, the school principal, or some other individual or body?
! STATE ! COUNTY ! SCHOOL DISTRICT ! SCHOOL PRINCIPAL ! OTHER (SPECIFY) 3. Are a la carte items offered during school lunch? ! YES ! NO 4. Do you have vending machines? ! YES ! NO 5. Do you have a school store that sells snacks or beverages? ! YES ! NO 6. Or, are there other regular sale of foods such as bake sales, candy sales, pizza days, or
sales of other foods? ! YES ! NO GO TO PART B
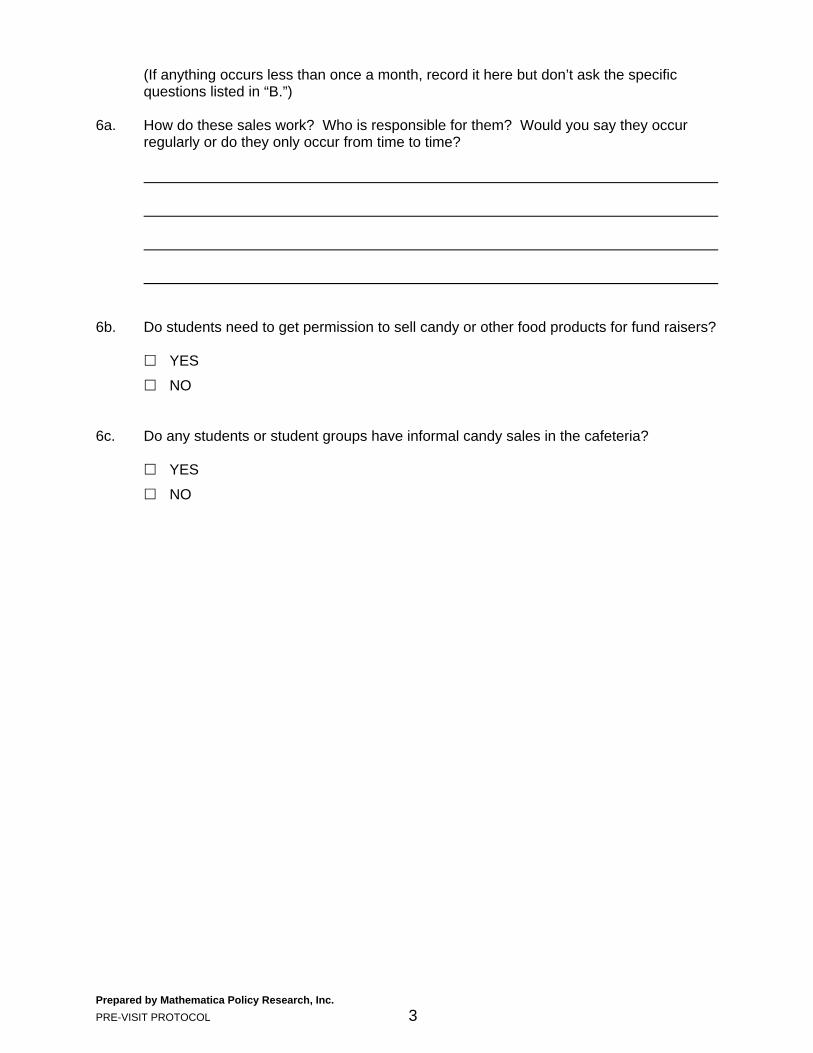
Prepared by Mathematica Policy Research, Inc. PRE-VISIT PROTOCOL 3
(If anything occurs less than once a month, record it here but don’t ask the specific questions listed in “B.”)
6a. How do these sales work? Who is responsible for them? Would you say they occur
regularly or do they only occur from time to time? 6b. Do students need to get permission to sell candy or other food products for fund raisers? ! YES ! NO 6c. Do any students or student groups have informal candy sales in the cafeteria? ! YES ! NO
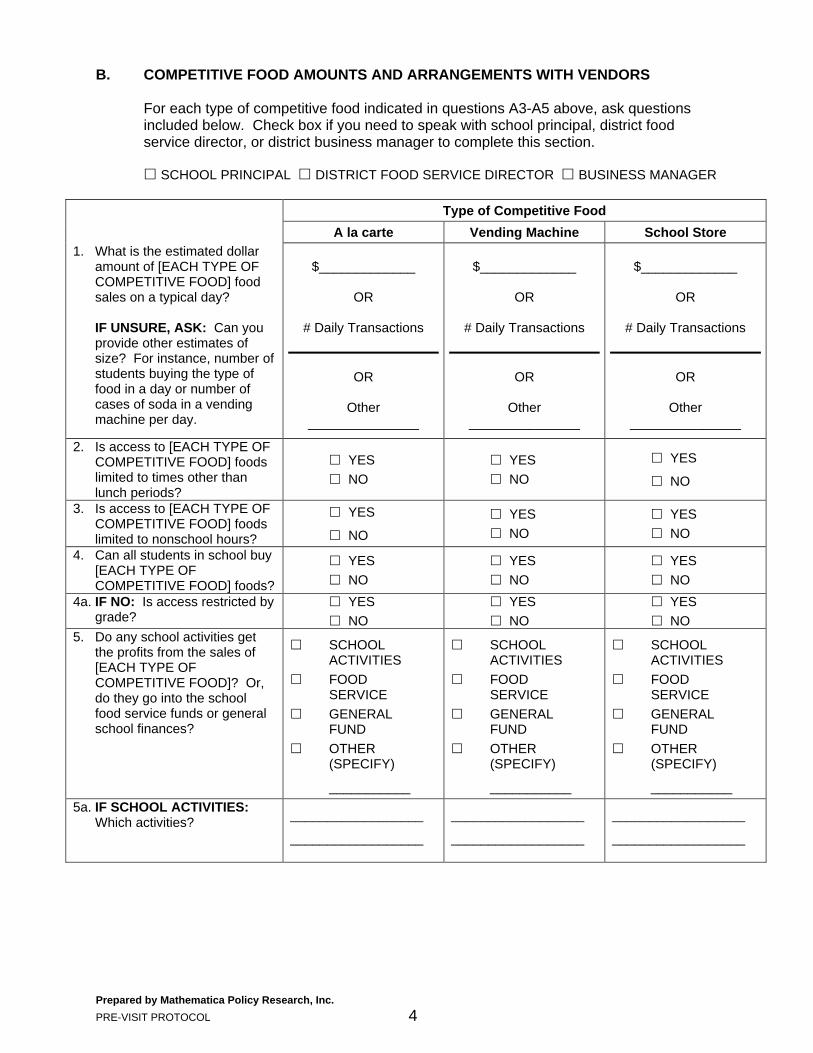
Prepared by Mathematica Policy Research, Inc. PRE-VISIT PROTOCOL 4
B. COMPETITIVE FOOD AMOUNTS AND ARRANGEMENTS WITH VENDORS For each type of competitive food indicated in questions A3-A5 above, ask questions
included below. Check box if you need to speak with school principal, district food service director, or district business manager to complete this section.
! SCHOOL PRINCIPAL ! DISTRICT FOOD SERVICE DIRECTOR ! BUSINESS MANAGER
Type of Competitive Food A la carte Vending Machine School Store 1. What is the estimated dollar
amount of [EACH TYPE OF COMPETITIVE FOOD] food sales on a typical day?
IF UNSURE, ASK: Can you
provide other estimates of size? For instance, number of students buying the type of food in a day or number of cases of soda in a vending machine per day.
$_____________
OR
# Daily Transactions
OR
Other _______________
$_____________
OR
# Daily Transactions
OR
Other _______________
$_____________
OR
# Daily Transactions
OR
Other _______________
2. Is access to [EACH TYPE OF COMPETITIVE FOOD] foods limited to times other than lunch periods?
! YES ! NO
! YES ! NO
! YES
! NO
3. Is access to [EACH TYPE OF COMPETITIVE FOOD] foods limited to nonschool hours?
! YES
! NO ! YES ! NO
! YES ! NO
4. Can all students in school buy [EACH TYPE OF COMPETITIVE FOOD] foods?
! YES ! NO
! YES ! NO
! YES ! NO
4a. IF NO: Is access restricted by grade?
! YES ! NO
! YES ! NO
! YES ! NO
5. Do any school activities get the profits from the sales of [EACH TYPE OF COMPETITIVE FOOD]? Or, do they go into the school food service funds or general school finances?
! SCHOOL ACTIVITIES ! FOOD SERVICE ! GENERAL FUND ! OTHER (SPECIFY)
___________
! SCHOOL ACTIVITIES ! FOOD SERVICE ! GENERAL FUND ! OTHER (SPECIFY)
___________
! SCHOOL ACTIVITIES ! FOOD SERVICE ! GENERAL FUND ! OTHER (SPECIFY)
___________ 5a. IF SCHOOL ACTIVITIES:
Which activities? __________________
__________________
__________________
__________________
__________________
__________________
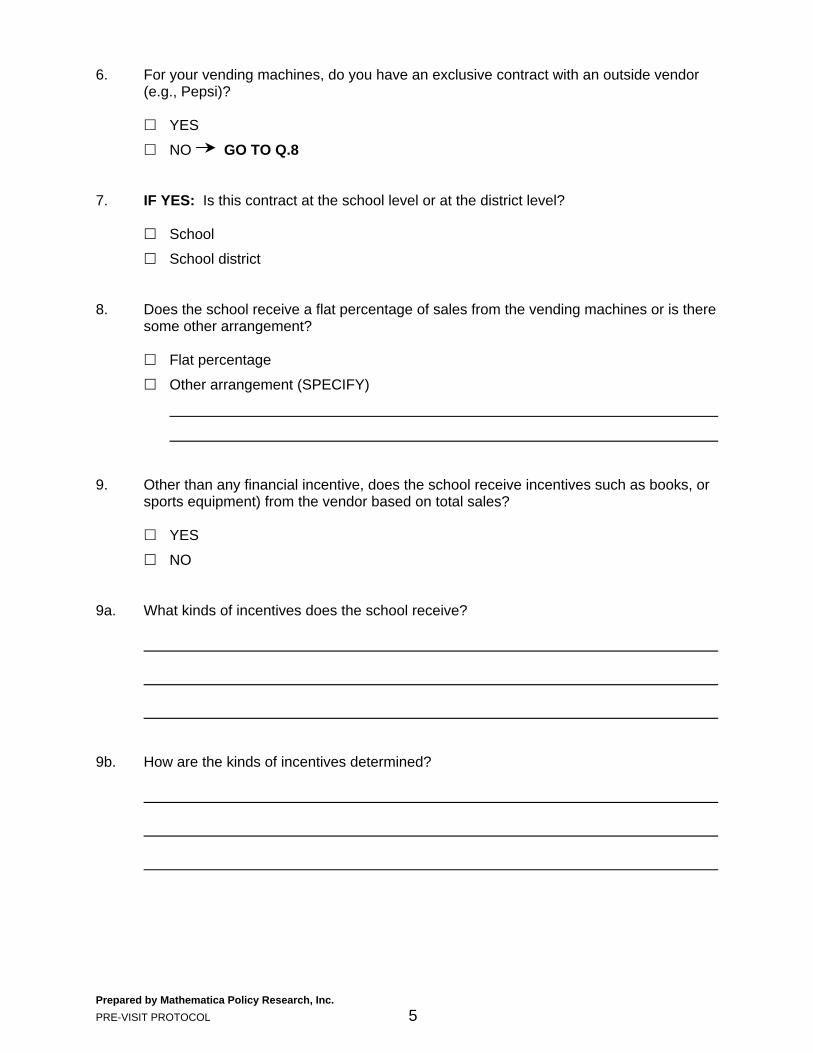
Prepared by Mathematica Policy Research, Inc. PRE-VISIT PROTOCOL 5
6. For your vending machines, do you have an exclusive contract with an outside vendor (e.g., Pepsi)?
! YES ! NO GO TO Q.8 7. IF YES: Is this contract at the school level or at the district level? ! School ! School district 8. Does the school receive a flat percentage of sales from the vending machines or is there
some other arrangement? ! Flat percentage ! Other arrangement (SPECIFY) 9. Other than any financial incentive, does the school receive incentives such as books, or
sports equipment) from the vendor based on total sales? ! YES ! NO 9a. What kinds of incentives does the school receive? 9b. How are the kinds of incentives determined?
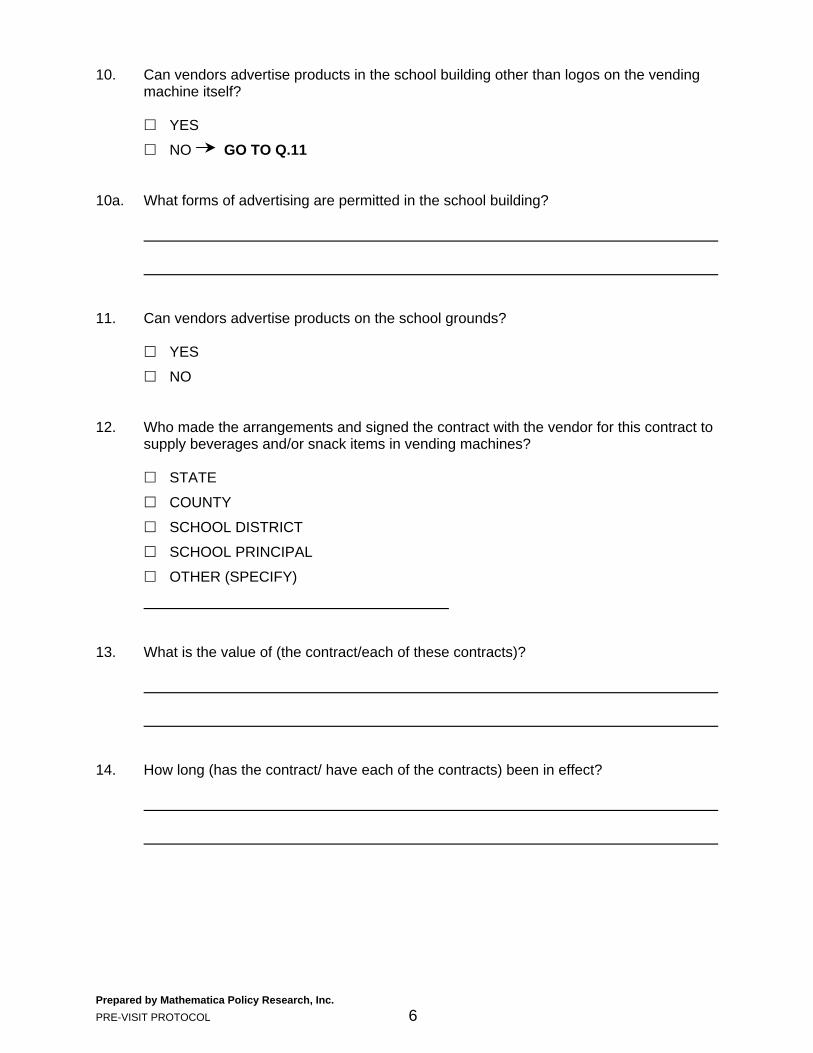
Prepared by Mathematica Policy Research, Inc. PRE-VISIT PROTOCOL 6
10. Can vendors advertise products in the school building other than logos on the vending machine itself?
! YES ! NO GO TO Q.11 10a. What forms of advertising are permitted in the school building? 11. Can vendors advertise products on the school grounds? ! YES ! NO 12. Who made the arrangements and signed the contract with the vendor for this contract to
supply beverages and/or snack items in vending machines? ! STATE ! COUNTY ! SCHOOL DISTRICT ! SCHOOL PRINCIPAL ! OTHER (SPECIFY) 13. What is the value of (the contract/each of these contracts)? 14. How long (has the contract/ have each of the contracts) been in effect?
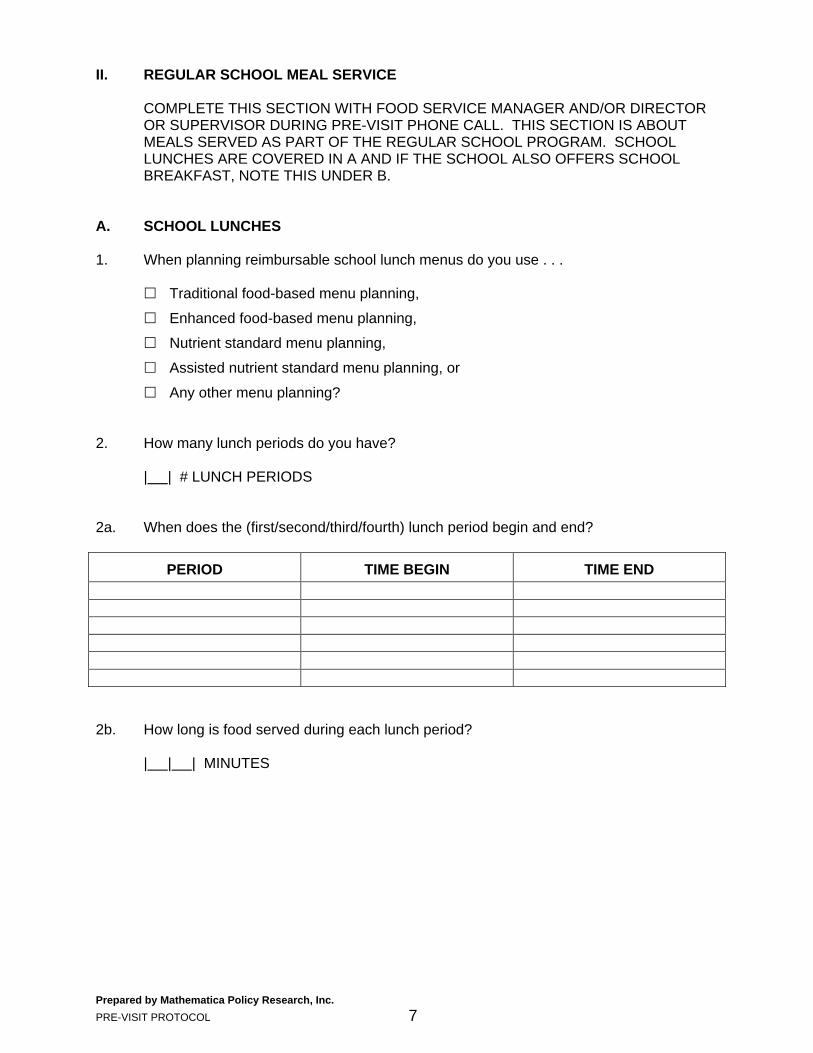
Prepared by Mathematica Policy Research, Inc. PRE-VISIT PROTOCOL 7
II. REGULAR SCHOOL MEAL SERVICE COMPLETE THIS SECTION WITH FOOD SERVICE MANAGER AND/OR DIRECTOR
OR SUPERVISOR DURING PRE-VISIT PHONE CALL. THIS SECTION IS ABOUT MEALS SERVED AS PART OF THE REGULAR SCHOOL PROGRAM. SCHOOL LUNCHES ARE COVERED IN A AND IF THE SCHOOL ALSO OFFERS SCHOOL BREAKFAST, NOTE THIS UNDER B.
A. SCHOOL LUNCHES 1. When planning reimbursable school lunch menus do you use . . . ! Traditional food-based menu planning, ! Enhanced food-based menu planning, ! Nutrient standard menu planning, ! Assisted nutrient standard menu planning, or ! Any other menu planning? 2. How many lunch periods do you have? | | # LUNCH PERIODS 2a. When does the (first/second/third/fourth) lunch period begin and end?
PERIOD TIME BEGIN TIME END 2b. How long is food served during each lunch period? | | | MINUTES
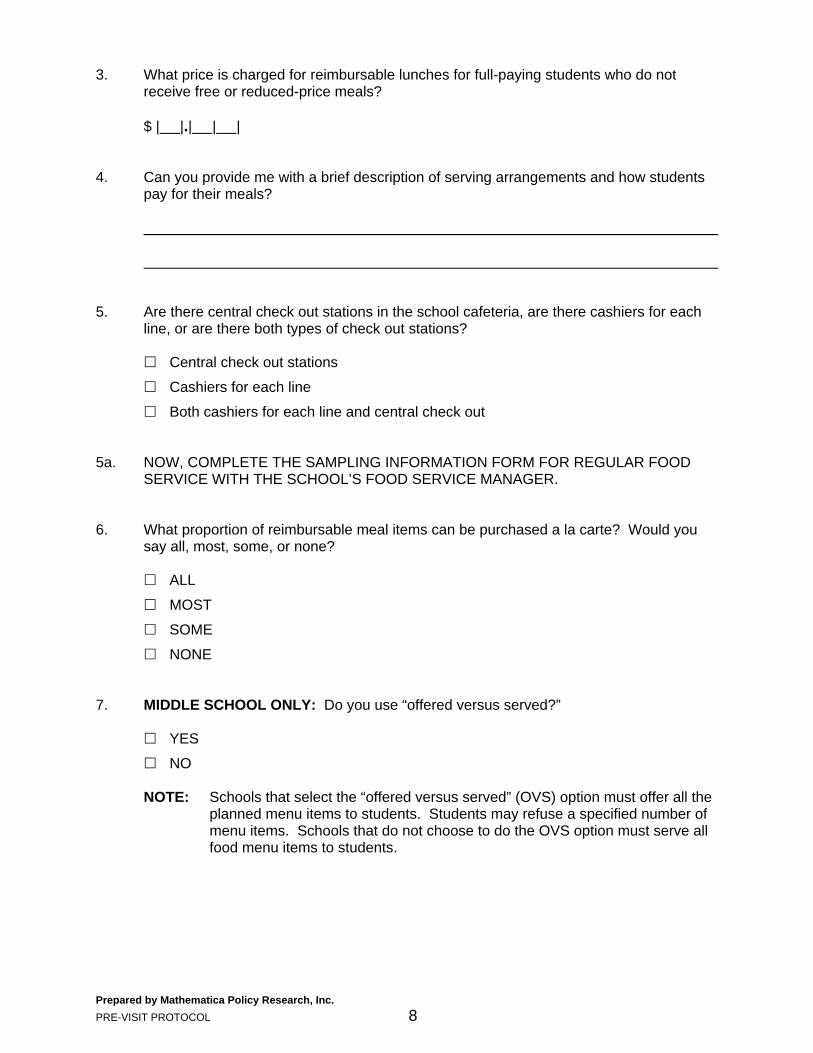
Prepared by Mathematica Policy Research, Inc. PRE-VISIT PROTOCOL 8
3. What price is charged for reimbursable lunches for full-paying students who do not receive free or reduced-price meals?
$ | |.| | | 4. Can you provide me with a brief description of serving arrangements and how students
pay for their meals? 5. Are there central check out stations in the school cafeteria, are there cashiers for each
line, or are there both types of check out stations? ! Central check out stations ! Cashiers for each line ! Both cashiers for each line and central check out 5a. NOW, COMPLETE THE SAMPLING INFORMATION FORM FOR REGULAR FOOD
SERVICE WITH THE SCHOOL’S FOOD SERVICE MANAGER. 6. What proportion of reimbursable meal items can be purchased a la carte? Would you
say all, most, some, or none? ! ALL ! MOST ! SOME ! NONE 7. MIDDLE SCHOOL ONLY: Do you use “offered versus served?” ! YES ! NO NOTE: Schools that select the “offered versus served” (OVS) option must offer all the
planned menu items to students. Students may refuse a specified number of menu items. Schools that do not choose to do the OVS option must serve all food menu items to students.
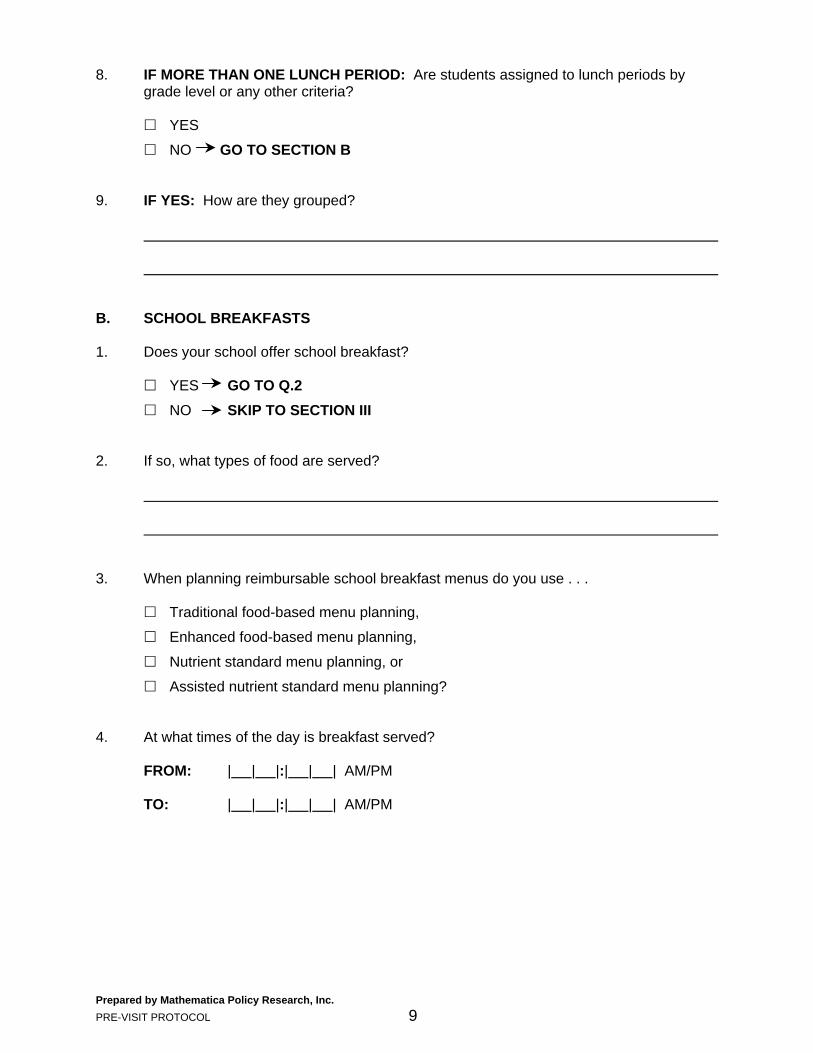
Prepared by Mathematica Policy Research, Inc. PRE-VISIT PROTOCOL 9
8. IF MORE THAN ONE LUNCH PERIOD: Are students assigned to lunch periods by grade level or any other criteria?
! YES ! NO GO TO SECTION B 9. IF YES: How are they grouped? B. SCHOOL BREAKFASTS 1. Does your school offer school breakfast? ! YES GO TO Q.2 ! NO SKIP TO SECTION III 2. If so, what types of food are served? 3. When planning reimbursable school breakfast menus do you use . . . ! Traditional food-based menu planning, ! Enhanced food-based menu planning, ! Nutrient standard menu planning, or ! Assisted nutrient standard menu planning? 4. At what times of the day is breakfast served? FROM: | | |:| | | AM/PM TO: | | |:| | | AM/PM
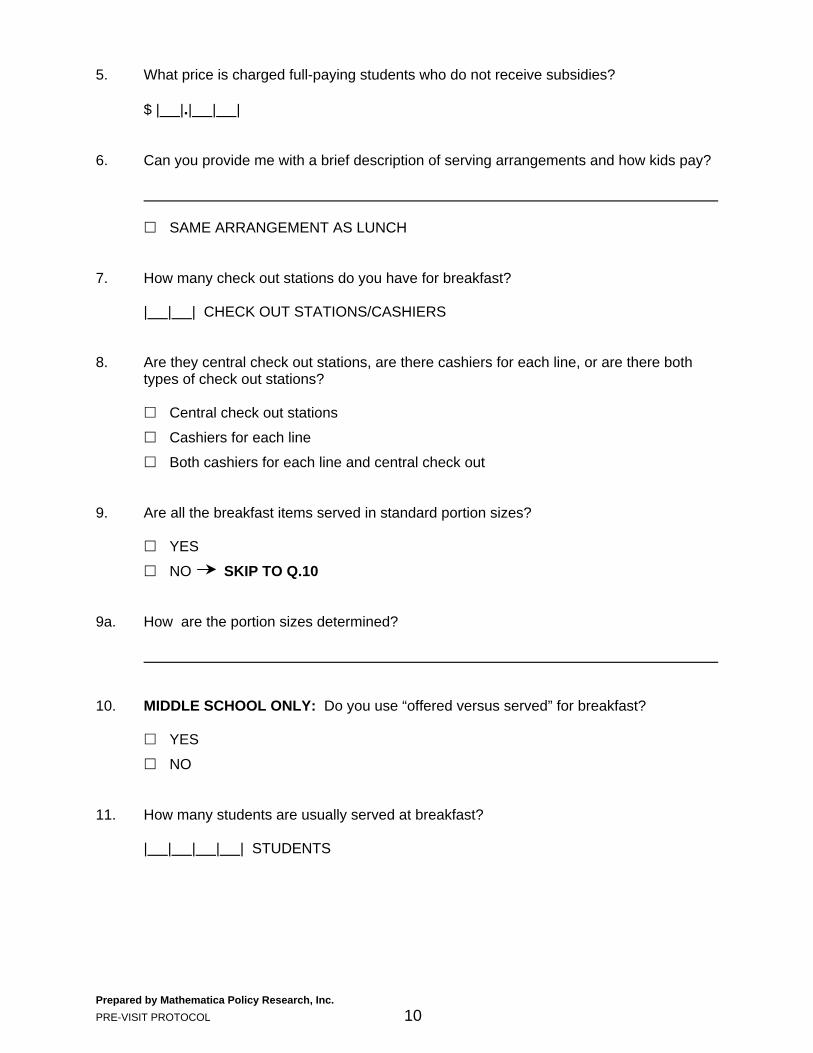
Prepared by Mathematica Policy Research, Inc. PRE-VISIT PROTOCOL 10
5. What price is charged full-paying students who do not receive subsidies? $ | |.| | | 6. Can you provide me with a brief description of serving arrangements and how kids pay? ! SAME ARRANGEMENT AS LUNCH 7. How many check out stations do you have for breakfast? | | | CHECK OUT STATIONS/CASHIERS 8. Are they central check out stations, are there cashiers for each line, or are there both
types of check out stations? ! Central check out stations ! Cashiers for each line ! Both cashiers for each line and central check out 9. Are all the breakfast items served in standard portion sizes? ! YES ! NO SKIP TO Q.10 9a. How are the portion sizes determined? 10. MIDDLE SCHOOL ONLY: Do you use “offered versus served” for breakfast? ! YES ! NO 11. How many students are usually served at breakfast? | | | | | STUDENTS
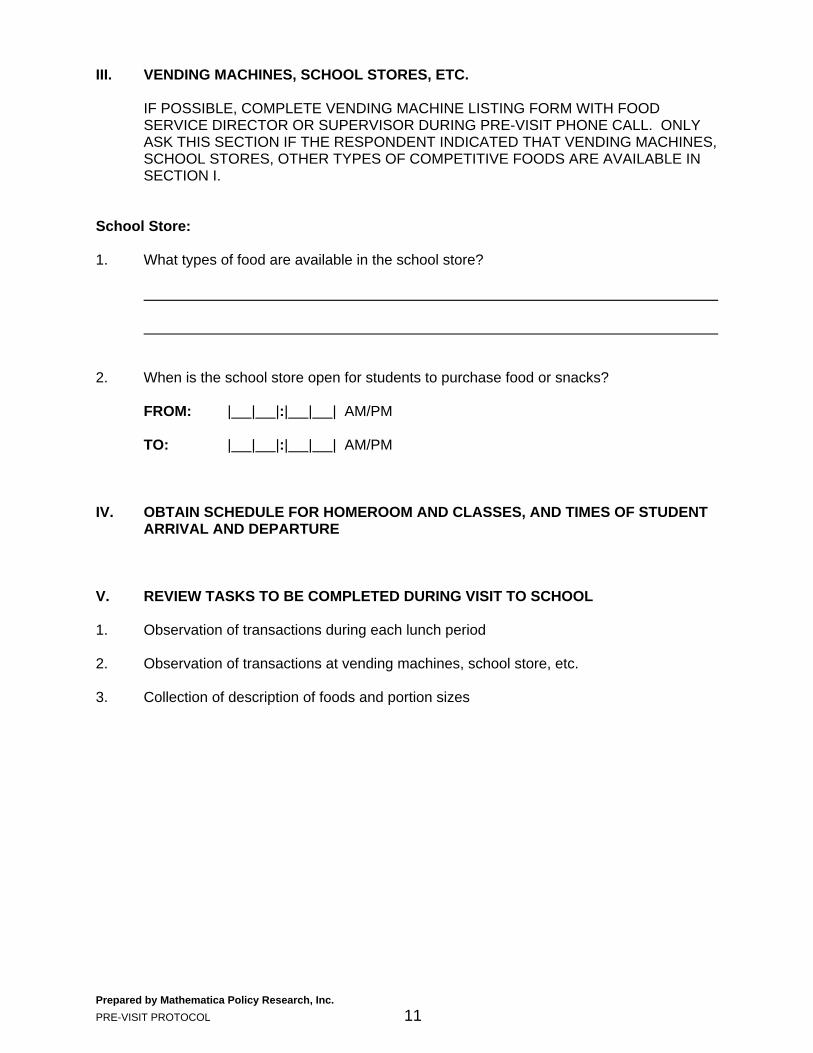
Prepared by Mathematica Policy Research, Inc. PRE-VISIT PROTOCOL 11
III. VENDING MACHINES, SCHOOL STORES, ETC. IF POSSIBLE, COMPLETE VENDING MACHINE LISTING FORM WITH FOOD
SERVICE DIRECTOR OR SUPERVISOR DURING PRE-VISIT PHONE CALL. ONLY ASK THIS SECTION IF THE RESPONDENT INDICATED THAT VENDING MACHINES, SCHOOL STORES, OTHER TYPES OF COMPETITIVE FOODS ARE AVAILABLE IN SECTION I.
School Store: 1. What types of food are available in the school store? 2. When is the school store open for students to purchase food or snacks? FROM: | | |:| | | AM/PM TO: | | |:| | | AM/PM IV. OBTAIN SCHEDULE FOR HOMEROOM AND CLASSES, AND TIMES OF STUDENT
ARRIVAL AND DEPARTURE V. REVIEW TASKS TO BE COMPLETED DURING VISIT TO SCHOOL 1. Observation of transactions during each lunch period 2. Observation of transactions at vending machines, school store, etc. 3. Collection of description of foods and portion sizes
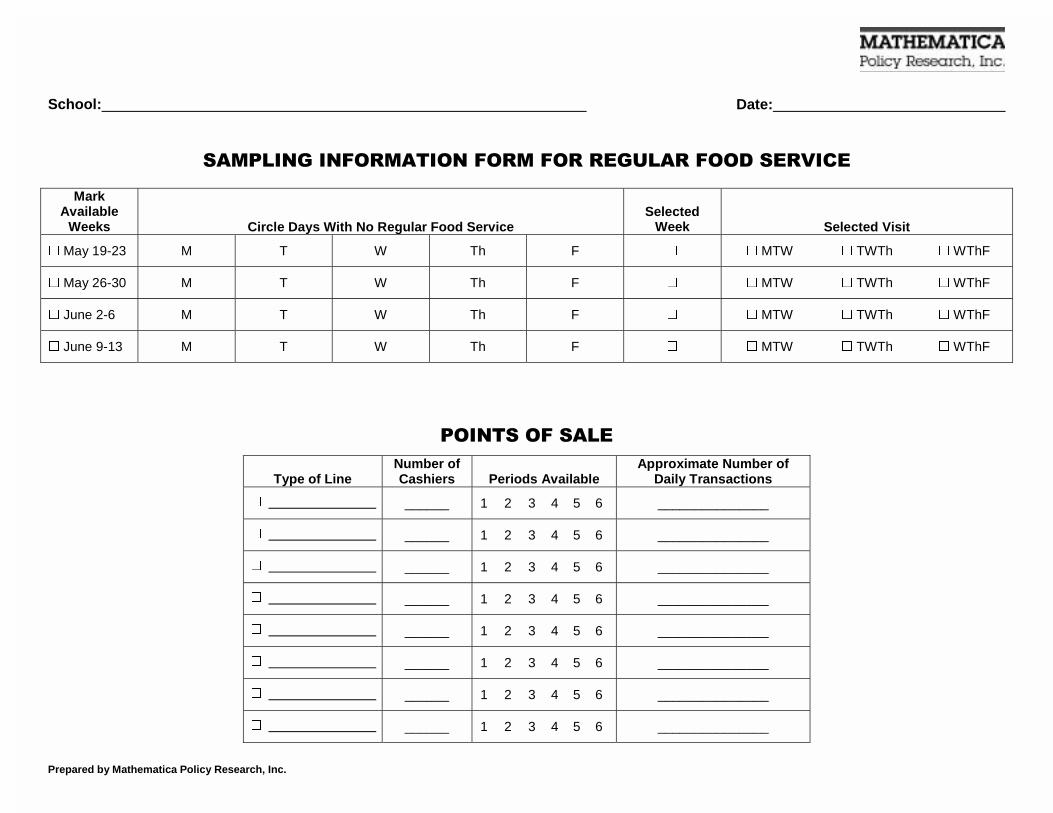
Prepared by Mathematica Policy Research, Inc.
School: Date:
�������������� �������������������������
Mark
Available Weeks Circle Days With No Regular Food Service
Selected Week Selected Visit
� May 19-23 M T W Th F � � MTW � TWTh � WThF
� May 26-30 M T W Th F � � MTW � TWTh � WThF
� June 2-6 M T W Th F � � MTW � TWTh � WThF
� June 9-13 M T W Th F � � MTW � TWTh � WThF
���� ������
Type of Line Number of Cashiers Periods Available
Approximate Number of Daily Transactions
� ______ 1 2 3 4 5 6 _______________
� ______ 1 2 3 4 5 6 _______________
� ______ 1 2 3 4 5 6 _______________
� ______ 1 2 3 4 5 6 _______________
� ______ 1 2 3 4 5 6 _______________
� ______ 1 2 3 4 5 6 _______________
� ______ 1 2 3 4 5 6 _______________
� ______ 1 2 3 4 5 6 _______________
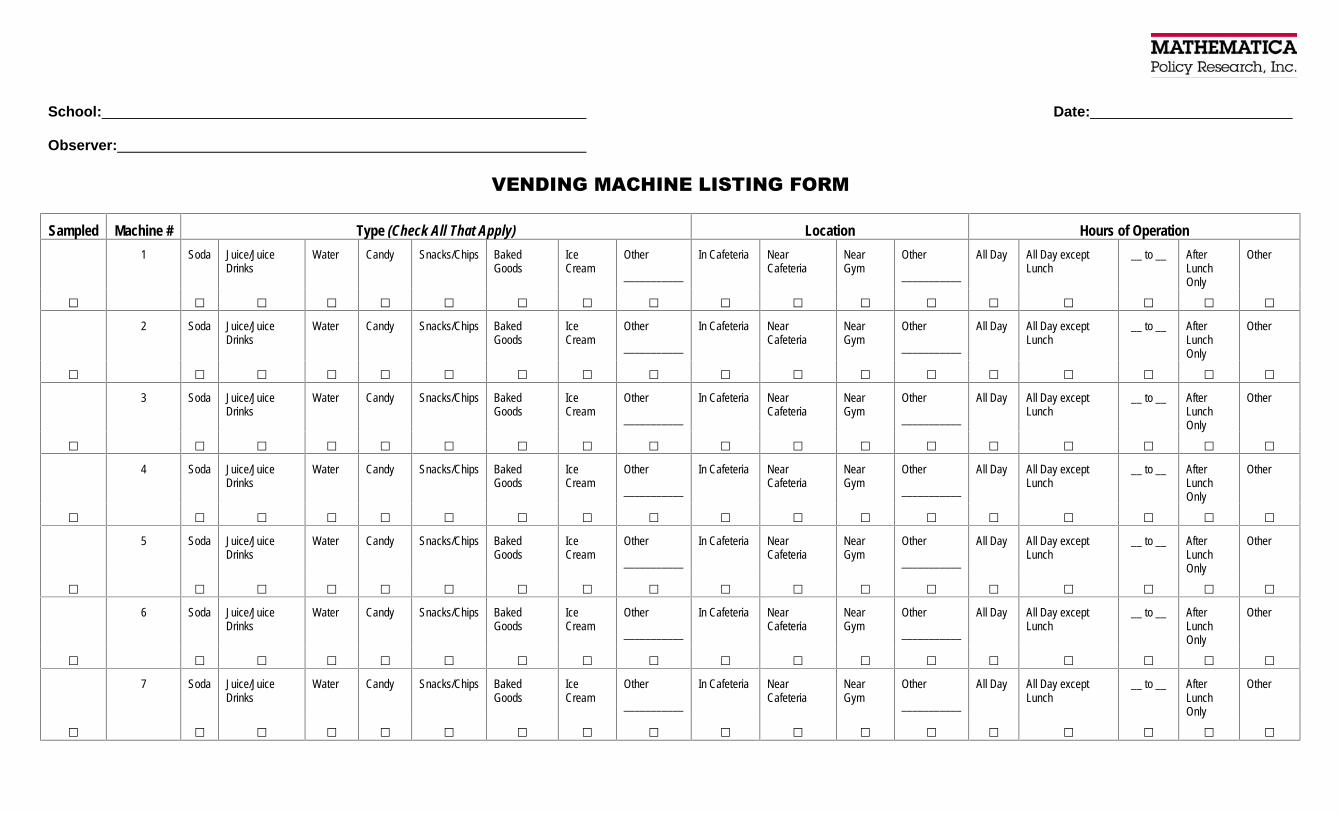
School: Date: Observer:
���������������� ����������
Sampled Machine # Type (Check All That Apply) Location Hours of Operation
1 Soda Juice/Juice Drinks
Water Candy Snacks/Chips Baked Goods
Ice Cream
Other
___________
In Cafeteria Near Cafeteria
Near Gym
Other
___________
All Day All Day except Lunch
__ to __ After Lunch Only
Other
� � � � � � � � � � � � � � � � � �
2 Soda Juice/Juice Drinks
Water Candy Snacks/Chips Baked Goods
Ice Cream
Other
___________
In Cafeteria Near Cafeteria
Near Gym
Other
___________
All Day All Day except Lunch
__ to __ After Lunch Only
Other
� � � � � � � � � � � � � � � � � �
3 Soda Juice/Juice Drinks
Water Candy Snacks/Chips Baked Goods
Ice Cream
Other
___________
In Cafeteria Near Cafeteria
Near Gym
Other
___________
All Day All Day except Lunch
__ to __ After Lunch Only
Other
� � � � � � � � � � � � � � � � � �
4 Soda Juice/Juice Drinks
Water Candy Snacks/Chips Baked Goods
Ice Cream
Other
___________
In Cafeteria Near Cafeteria
Near Gym
Other
___________
All Day All Day except Lunch
__ to __ After Lunch Only
Other
� � � � � � � � � � � � � � � � � �
5 Soda Juice/Juice Drinks
Water Candy Snacks/Chips Baked Goods
Ice Cream
Other
___________
In Cafeteria Near Cafeteria
Near Gym
Other
___________
All Day All Day except Lunch
__ to __ After Lunch Only
Other
� � � � � � � � � � � � � � � � � �
6 Soda Juice/Juice Drinks
Water Candy Snacks/Chips Baked Goods
Ice Cream
Other
___________
In Cafeteria Near Cafeteria
Near Gym
Other
___________
All Day All Day except Lunch
__ to __ After Lunch Only
Other
� � � � � � � � � � � � � � � � � �
7 Soda Juice/Juice Drinks
Water Candy Snacks/Chips Baked Goods
Ice Cream
Other
___________
In Cafeteria Near Cafeteria
Near Gym
Other
___________
All Day All Day except Lunch
__ to __ After Lunch Only
Other
� � � � � � � � � � � � � � � � � �
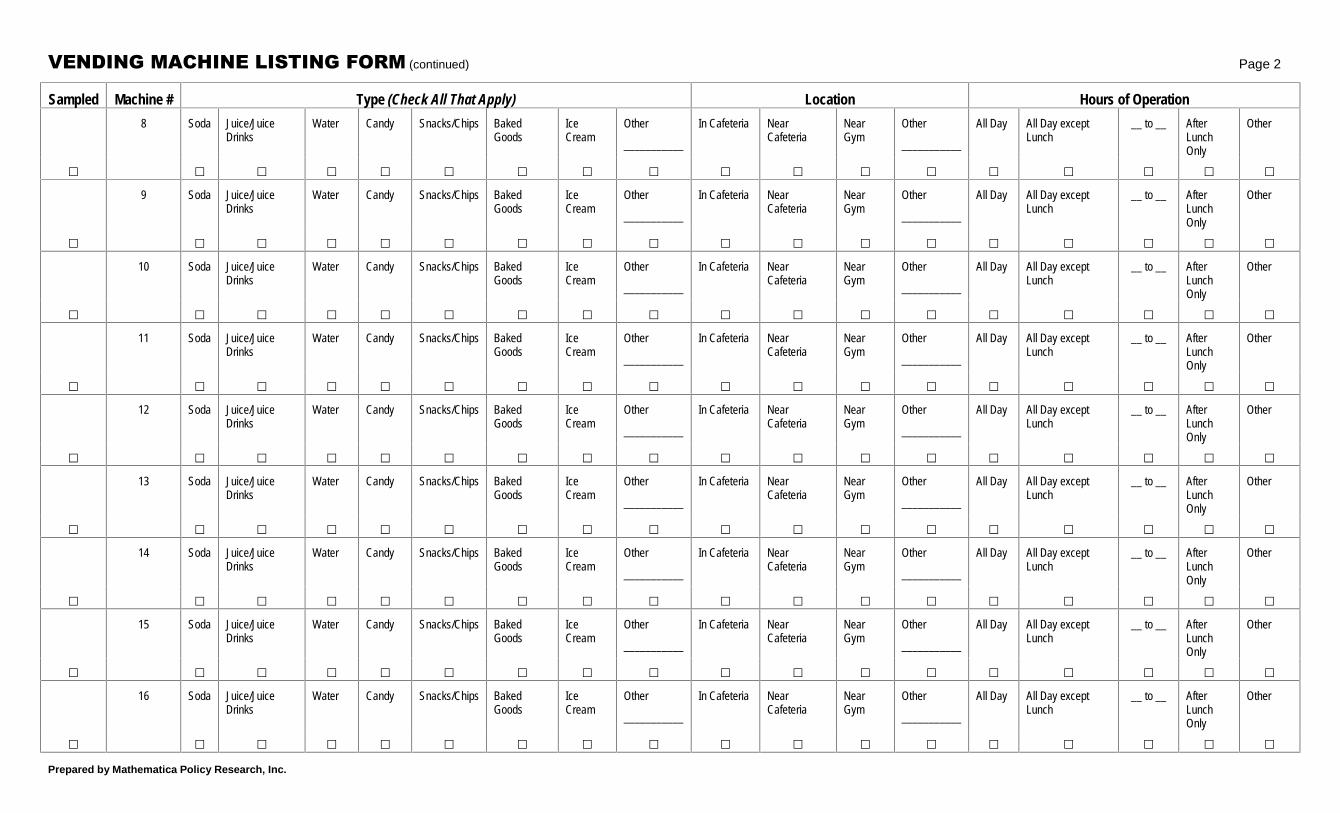
���������������� ��������� (continued) Page 2
Prepared by Mathematica Policy Research, Inc.
Sampled Machine # Type (Check All That Apply) Location Hours of Operation
8 Soda Juice/Juice Drinks
Water Candy Snacks/Chips Baked Goods
Ice Cream
Other
___________
In Cafeteria Near Cafeteria
Near Gym
Other
___________
All Day All Day except Lunch
__ to __ After Lunch Only
Other
� � � � � � � � � � � � � � � � � �
9 Soda Juice/Juice Drinks
Water Candy Snacks/Chips Baked Goods
Ice Cream
Other
___________
In Cafeteria Near Cafeteria
Near Gym
Other
___________
All Day All Day except Lunch
__ to __ After Lunch Only
Other
� � � � � � � � � � � � � � � � � �
10 Soda Juice/Juice Drinks
Water Candy Snacks/Chips Baked Goods
Ice Cream
Other
___________
In Cafeteria Near Cafeteria
Near Gym
Other
___________
All Day All Day except Lunch
__ to __ After Lunch Only
Other
� � � � � � � � � � � � � � � � � �
11 Soda Juice/Juice Drinks
Water Candy Snacks/Chips Baked Goods
Ice Cream
Other
___________
In Cafeteria Near Cafeteria
Near Gym
Other
___________
All Day All Day except Lunch
__ to __ After Lunch Only
Other
� � � � � � � � � � � � � � � � � �
12 Soda Juice/Juice Drinks
Water Candy Snacks/Chips Baked Goods
Ice Cream
Other
___________
In Cafeteria Near Cafeteria
Near Gym
Other
___________
All Day All Day except Lunch
__ to __ After Lunch Only
Other
� � � � � � � � � � � � � � � � � �
13 Soda Juice/Juice Drinks
Water Candy Snacks/Chips Baked Goods
Ice Cream
Other
___________
In Cafeteria Near Cafeteria
Near Gym
Other
___________
All Day All Day except Lunch
__ to __ After Lunch Only
Other
� � � � � � � � � � � � � � � � � �
14 Soda Juice/Juice Drinks
Water Candy Snacks/Chips Baked Goods
Ice Cream
Other
___________
In Cafeteria Near Cafeteria
Near Gym
Other
___________
All Day All Day except Lunch
__ to __ After Lunch Only
Other
� � � � � � � � � � � � � � � � � �
15 Soda Juice/Juice Drinks
Water Candy Snacks/Chips Baked Goods
Ice Cream
Other
___________
In Cafeteria Near Cafeteria
Near Gym
Other
___________
All Day All Day except Lunch
__ to __ After Lunch Only
Other
� � � � � � � � � � � � � � � � � �
16 Soda Juice/Juice Drinks
Water Candy Snacks/Chips Baked Goods
Ice Cream
Other
___________
In Cafeteria Near Cafeteria
Near Gym
Other
___________
All Day All Day except Lunch
__ to __ After Lunch Only
Other
� � � � � � � � � � � � � � � � � �
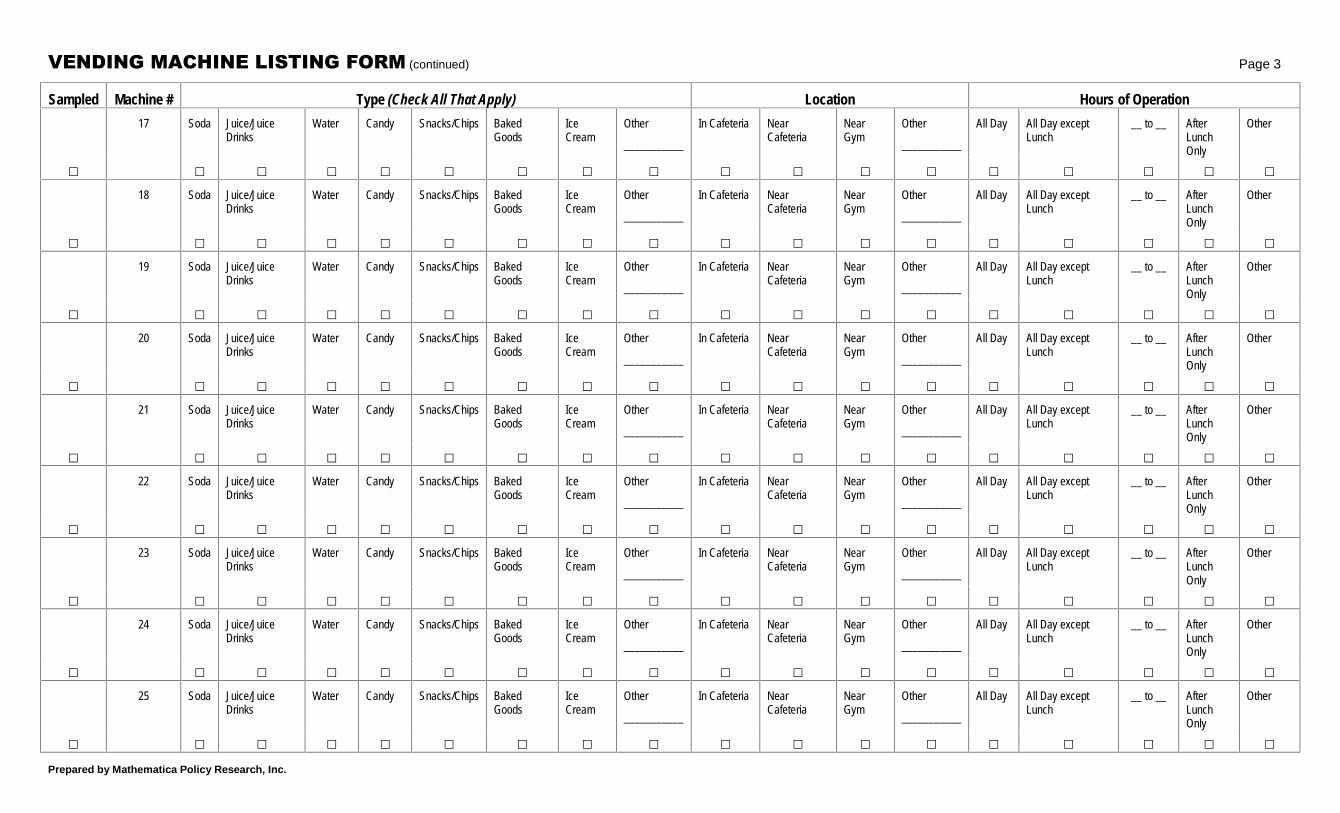
���������������� ��������� (continued) Page 3
Prepared by Mathematica Policy Research, Inc.
Sampled Machine # Type (Check All That Apply) Location Hours of Operation
17 Soda Juice/Juice Drinks
Water Candy Snacks/Chips Baked Goods
Ice Cream
Other
___________
In Cafeteria Near Cafeteria
Near Gym
Other
___________
All Day All Day except Lunch
__ to __ After Lunch Only
Other
� � � � � � � � � � � � � � � � � �
18 Soda Juice/Juice Drinks
Water Candy Snacks/Chips Baked Goods
Ice Cream
Other
___________
In Cafeteria Near Cafeteria
Near Gym
Other
___________
All Day All Day except Lunch
__ to __ After Lunch Only
Other
� � � � � � � � � � � � � � � � � �
19 Soda Juice/Juice Drinks
Water Candy Snacks/Chips Baked Goods
Ice Cream
Other
___________
In Cafeteria Near Cafeteria
Near Gym
Other
___________
All Day All Day except Lunch
__ to __ After Lunch Only
Other
� � � � � � � � � � � � � � � � � �
20 Soda Juice/Juice Drinks
Water Candy Snacks/Chips Baked Goods
Ice Cream
Other
___________
In Cafeteria Near Cafeteria
Near Gym
Other
___________
All Day All Day except Lunch
__ to __ After Lunch Only
Other
� � � � � � � � � � � � � � � � � �
21 Soda Juice/Juice Drinks
Water Candy Snacks/Chips Baked Goods
Ice Cream
Other
___________
In Cafeteria Near Cafeteria
Near Gym
Other
___________
All Day All Day except Lunch
__ to __ After Lunch Only
Other
� � � � � � � � � � � � � � � � � �
22 Soda Juice/Juice Drinks
Water Candy Snacks/Chips Baked Goods
Ice Cream
Other
___________
In Cafeteria Near Cafeteria
Near Gym
Other
___________
All Day All Day except Lunch
__ to __ After Lunch Only
Other
� � � � � � � � � � � � � � � � � �
23 Soda Juice/Juice Drinks
Water Candy Snacks/Chips Baked Goods
Ice Cream
Other
___________
In Cafeteria Near Cafeteria
Near Gym
Other
___________
All Day All Day except Lunch
__ to __ After Lunch Only
Other
� � � � � � � � � � � � � � � � � �
24 Soda Juice/Juice Drinks
Water Candy Snacks/Chips Baked Goods
Ice Cream
Other
___________
In Cafeteria Near Cafeteria
Near Gym
Other
___________
All Day All Day except Lunch
__ to __ After Lunch Only
Other
� � � � � � � � � � � � � � � � � �
25 Soda Juice/Juice Drinks
Water Candy Snacks/Chips Baked Goods
Ice Cream
Other
___________
In Cafeteria Near Cafeteria
Near Gym
Other
___________
All Day All Day except Lunch
__ to __ After Lunch Only
Other
� � � � � � � � � � � � � � � � � �

���������������� ��������� (continued) Page 4
Prepared by Mathematica Policy Research, Inc.
Sampled Machine # Type (Check All That Apply) Location Hours of Operation
26 Soda Juice/Juice Drinks
Water Candy Snacks/Chips Baked Goods
Ice Cream
Other
___________
In Cafeteria Near Cafeteria
Near Gym
Other
___________
All Day All Day except Lunch
__ to __ After Lunch Only
Other
� � � � � � � � � � � � � � � � � �
27 Soda Juice/Juice Drinks
Water Candy Snacks/Chips Baked Goods
Ice Cream
Other
___________
In Cafeteria Near Cafeteria
Near Gym
Other
___________
All Day All Day except Lunch
__ to __ After Lunch Only
Other
� � � � � � � � � � � � � � � � � �
28 Soda Juice/Juice Drinks
Water Candy Snacks/Chips Baked Goods
Ice Cream
Other
___________
In Cafeteria Near Cafeteria
Near Gym
Other
___________
All Day All Day except Lunch
__ to __ After Lunch Only
Other
� � � � � � � � � � � � � � � � � �
29 Soda Juice/Juice Drinks
Water Candy Snacks/Chips Baked Goods
Ice Cream
Other
___________
In Cafeteria Near Cafeteria
Near Gym
Other
___________
All Day All Day except Lunch
__ to __ After Lunch Only
Other
� � � � � � � � � � � � � � � � � �
30 Soda Juice/Juice Drinks
Water Candy Snacks/Chips Baked Goods
Ice Cream
Other
___________
In Cafeteria Near Cafeteria
Near Gym
Other
___________
All Day All Day except Lunch
__ to __ After Lunch Only
Other
� � � � � � � � � � � � � � � � � �
31 Soda Juice/Juice Drinks
Water Candy Snacks/Chips Baked Goods
Ice Cream
Other
___________
In Cafeteria Near Cafeteria
Near Gym
Other
___________
All Day All Day except Lunch
__ to __ After Lunch Only
Other
� � � � � � � � � � � � � � � � � �
32 Soda Juice/Juice Drinks
Water Candy Snacks/Chips Baked Goods
Ice Cream
Other
___________
In Cafeteria Near Cafeteria
Near Gym
Other
___________
All Day All Day except Lunch
__ to __ After Lunch Only
Other
� � � � � � � � � � � � � � � � � �
33 Soda Juice/Juice Drinks
Water Candy Snacks/Chips Baked Goods
Ice Cream
Other
___________
In Cafeteria Near Cafeteria
Near Gym
Other
___________
All Day All Day except Lunch
__ to __ After Lunch Only
Other
� � � � � � � � � � � � � � � � � �
34 Soda Juice/Juice Drinks
Water Candy Snacks/Chips Baked Goods
Ice Cream
Other
___________
In Cafeteria Near Cafeteria
Near Gym
Other
___________
All Day All Day except Lunch
__ to __ After Lunch Only
Other
� � � � � � � � � � � � � � � � � �
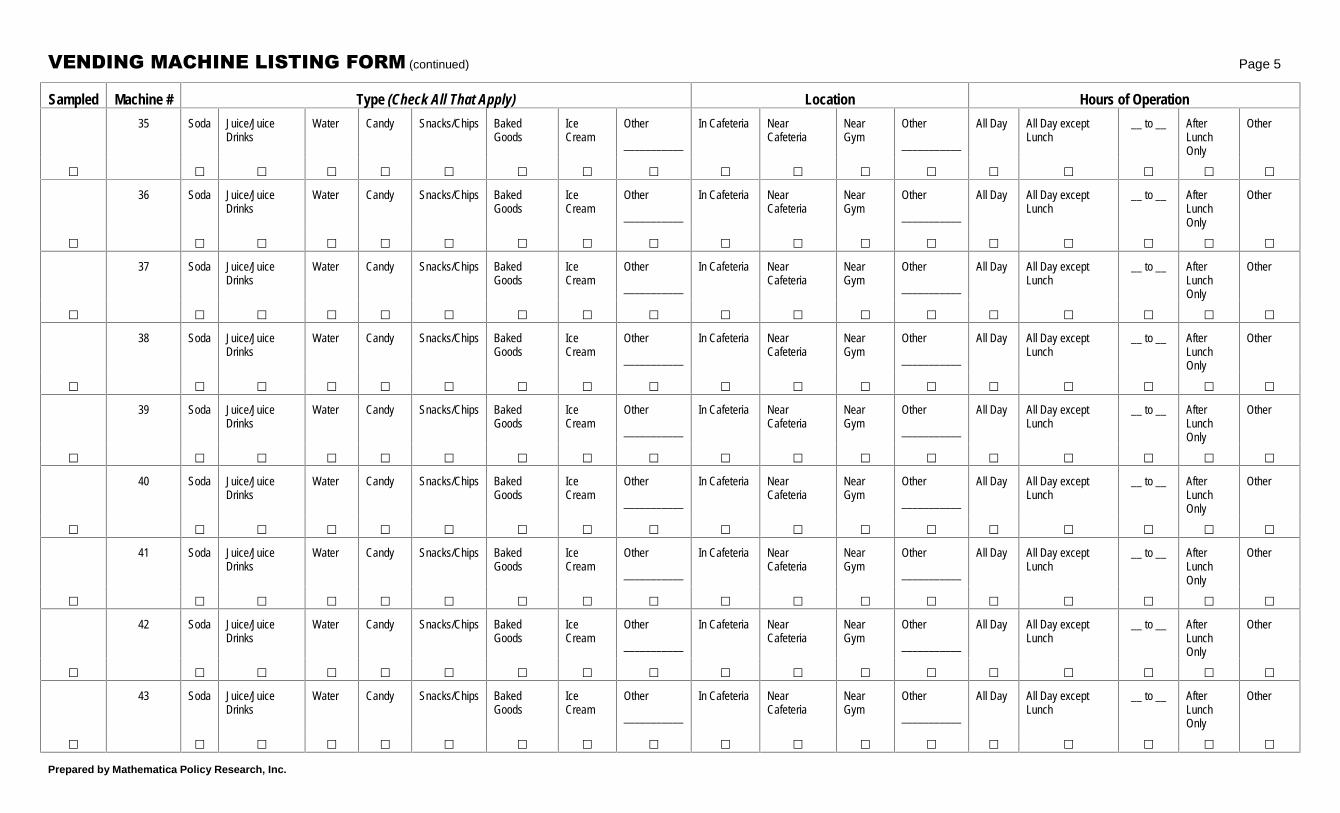
���������������� ��������� (continued) Page 5
Prepared by Mathematica Policy Research, Inc.
Sampled Machine # Type (Check All That Apply) Location Hours of Operation
35 Soda Juice/Juice Drinks
Water Candy Snacks/Chips Baked Goods
Ice Cream
Other
___________
In Cafeteria Near Cafeteria
Near Gym
Other
___________
All Day All Day except Lunch
__ to __ After Lunch Only
Other
� � � � � � � � � � � � � � � � � �
36 Soda Juice/Juice Drinks
Water Candy Snacks/Chips Baked Goods
Ice Cream
Other
___________
In Cafeteria Near Cafeteria
Near Gym
Other
___________
All Day All Day except Lunch
__ to __ After Lunch Only
Other
� � � � � � � � � � � � � � � � � �
37 Soda Juice/Juice Drinks
Water Candy Snacks/Chips Baked Goods
Ice Cream
Other
___________
In Cafeteria Near Cafeteria
Near Gym
Other
___________
All Day All Day except Lunch
__ to __ After Lunch Only
Other
� � � � � � � � � � � � � � � � � �
38 Soda Juice/Juice Drinks
Water Candy Snacks/Chips Baked Goods
Ice Cream
Other
___________
In Cafeteria Near Cafeteria
Near Gym
Other
___________
All Day All Day except Lunch
__ to __ After Lunch Only
Other
� � � � � � � � � � � � � � � � � �
39 Soda Juice/Juice Drinks
Water Candy Snacks/Chips Baked Goods
Ice Cream
Other
___________
In Cafeteria Near Cafeteria
Near Gym
Other
___________
All Day All Day except Lunch
__ to __ After Lunch Only
Other
� � � � � � � � � � � � � � � � � �
40 Soda Juice/Juice Drinks
Water Candy Snacks/Chips Baked Goods
Ice Cream
Other
___________
In Cafeteria Near Cafeteria
Near Gym
Other
___________
All Day All Day except Lunch
__ to __ After Lunch Only
Other
� � � � � � � � � � � � � � � � � �
41 Soda Juice/Juice Drinks
Water Candy Snacks/Chips Baked Goods
Ice Cream
Other
___________
In Cafeteria Near Cafeteria
Near Gym
Other
___________
All Day All Day except Lunch
__ to __ After Lunch Only
Other
� � � � � � � � � � � � � � � � � �
42 Soda Juice/Juice Drinks
Water Candy Snacks/Chips Baked Goods
Ice Cream
Other
___________
In Cafeteria Near Cafeteria
Near Gym
Other
___________
All Day All Day except Lunch
__ to __ After Lunch Only
Other
� � � � � � � � � � � � � � � � � �
43 Soda Juice/Juice Drinks
Water Candy Snacks/Chips Baked Goods
Ice Cream
Other
___________
In Cafeteria Near Cafeteria
Near Gym
Other
___________
All Day All Day except Lunch
__ to __ After Lunch Only
Other
� � � � � � � � � � � � � � � � � �
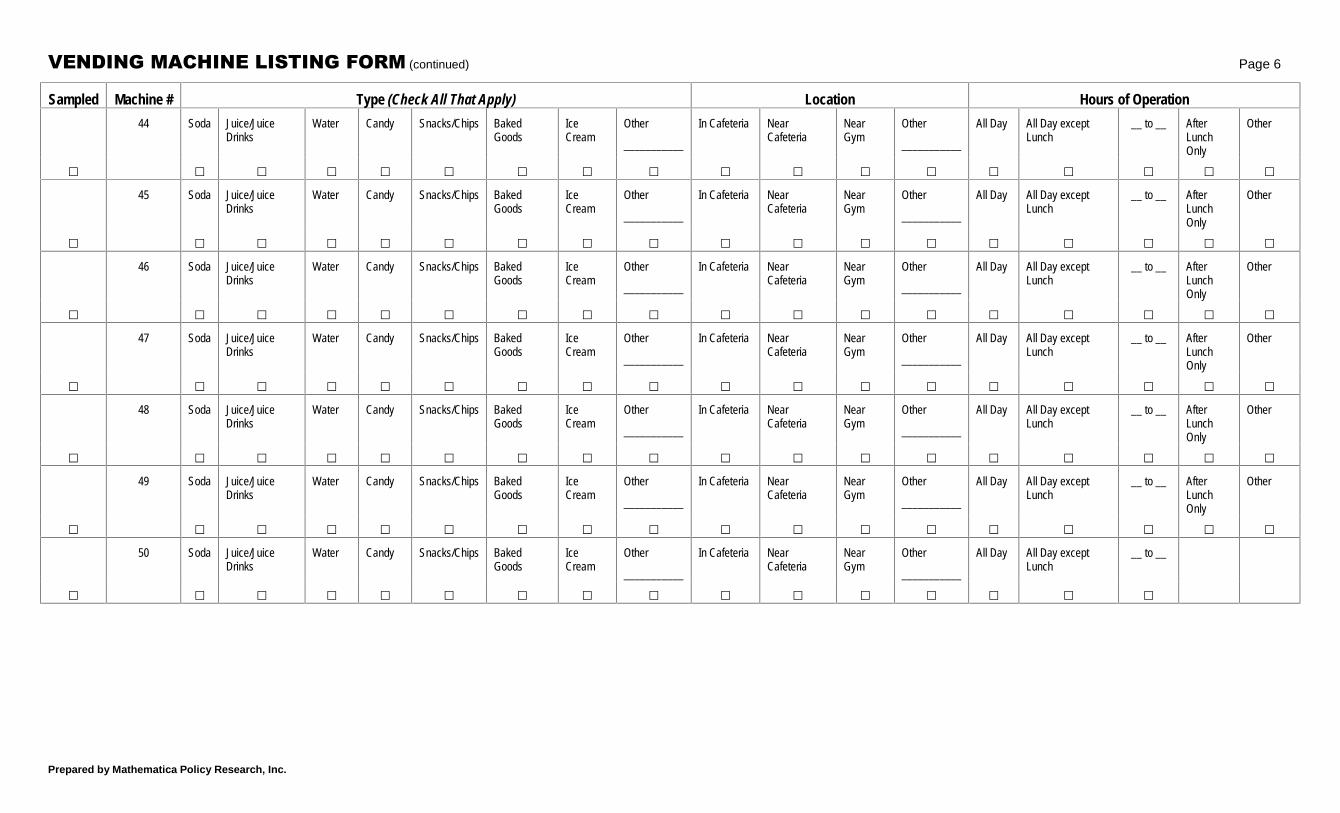
���������������� ��������� (continued) Page 6
Prepared by Mathematica Policy Research, Inc.
Sampled Machine # Type (Check All That Apply) Location Hours of Operation
44 Soda Juice/Juice Drinks
Water Candy Snacks/Chips Baked Goods
Ice Cream
Other
___________
In Cafeteria Near Cafeteria
Near Gym
Other
___________
All Day All Day except Lunch
__ to __ After Lunch Only
Other
� � � � � � � � � � � � � � � � � �
45 Soda Juice/Juice Drinks
Water Candy Snacks/Chips Baked Goods
Ice Cream
Other
___________
In Cafeteria Near Cafeteria
Near Gym
Other
___________
All Day All Day except Lunch
__ to __ After Lunch Only
Other
� � � � � � � � � � � � � � � � � �
46 Soda Juice/Juice Drinks
Water Candy Snacks/Chips Baked Goods
Ice Cream
Other
___________
In Cafeteria Near Cafeteria
Near Gym
Other
___________
All Day All Day except Lunch
__ to __ After Lunch Only
Other
� � � � � � � � � � � � � � � � � �
47 Soda Juice/Juice Drinks
Water Candy Snacks/Chips Baked Goods
Ice Cream
Other
___________
In Cafeteria Near Cafeteria
Near Gym
Other
___________
All Day All Day except Lunch
__ to __ After Lunch Only
Other
� � � � � � � � � � � � � � � � � �
48 Soda Juice/Juice Drinks
Water Candy Snacks/Chips Baked Goods
Ice Cream
Other
___________
In Cafeteria Near Cafeteria
Near Gym
Other
___________
All Day All Day except Lunch
__ to __ After Lunch Only
Other
� � � � � � � � � � � � � � � � � �
49 Soda Juice/Juice Drinks
Water Candy Snacks/Chips Baked Goods
Ice Cream
Other
___________
In Cafeteria Near Cafeteria
Near Gym
Other
___________
All Day All Day except Lunch
__ to __ After Lunch Only
Other
� � � � � � � � � � � � � � � � � �
50 Soda Juice/Juice Drinks
Water Candy Snacks/Chips Baked Goods
Ice Cream
Other
___________
In Cafeteria Near Cafeteria
Near Gym
Other
___________
All Day All Day except Lunch
__ to __
� � � � � � � � � � � � � � � �
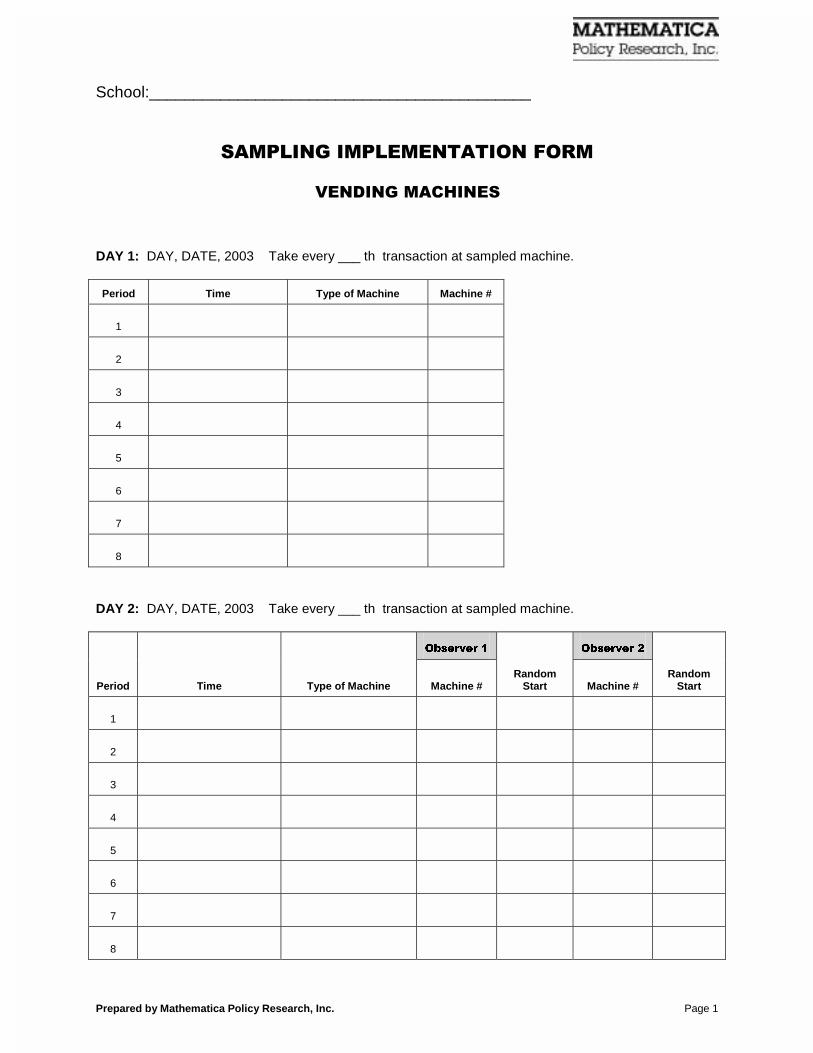
Prepared by Mathematica Policy Research, Inc. Page 1
School:___________________________________________
�������������������� ���
�������������
DAY 1: DAY, DATE, 2003 Take every ___ th transaction at sampled machine.
Period Time Type of Machine Machine #
1
2
3
4
5
6
7
8
DAY 2: DAY, DATE, 2003 Take every ___ th transaction at sampled machine.
�������� � ��������
Period Time Type of Machine Machine # Random
Start Machine # Random
Start
1
2
3
4
5
6
7
8
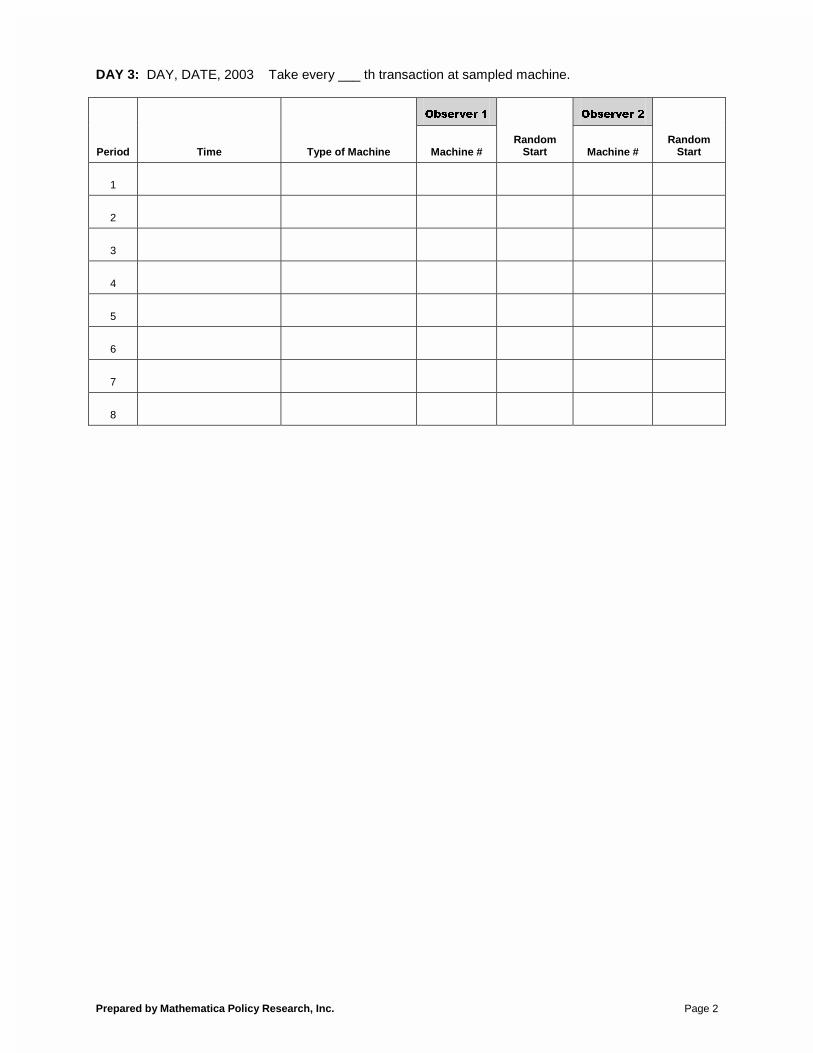
Prepared by Mathematica Policy Research, Inc. Page 2
DAY 3: DAY, DATE, 2003 Take every ___ th transaction at sampled machine.
�������� � ��������
Period Time Type of Machine Machine # Random
Start Machine # Random
Start
1
2
3
4
5
6
7
8

Prepared by Mathematica Policy Research, Inc. Page 3
�����������
DAY 1: DAY, DATE, 2003 Take every ___ th transaction
Lunch Period Time Type of Line Cashier Est. Observations Random Start
1
2
3
4
5
6
DAY 2: DAY, DATE, 2003 Take every ___ th transaction
Lunch Period Time Type of Line Cashier Est. Observations Random Start
1
2
3
4
5
6
DAY 3: DAY, DATE, 2003 Take every ___ th transaction
Lunch Period Time Type of Line Cashier Est. Observations Random Start
1
2
3
4
5
6
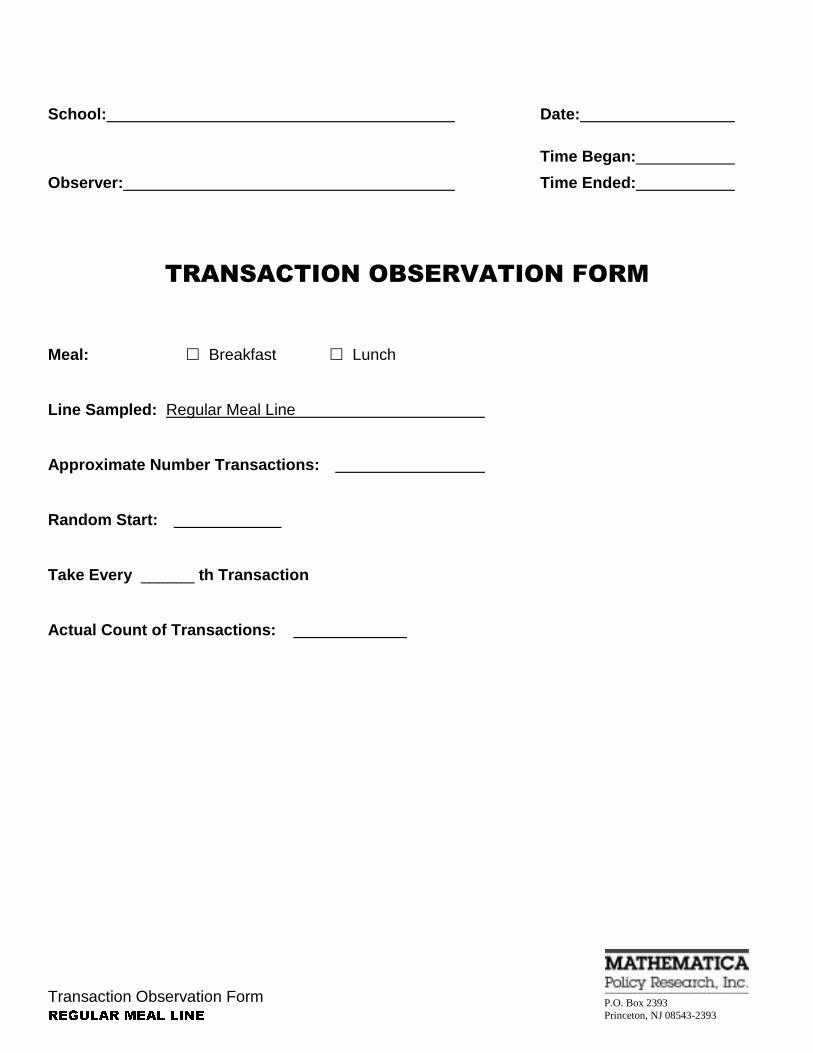
Transaction Observation Form ������� ���� ��
P.O. Box 2393 Princeton, NJ 08543-2393
School: Date:
Observer:
Time Began:
Time Ended:
��������������������� ���
Meal: � Breakfast � Lunch Line Sampled: Regular Meal Line Approximate Number Transactions: Random Start: Take Every ______ th Transaction Actual Count of Transactions:

Transaction Observation Form Tray #1 aFurther Information for foods items in “Notes” ������� ���� ��
# of Units Reimb. Meal
# of Units A la Carte Notesa
To create the Regular Meal Line Transaction Observation Form, 74 pages similar to this one would be inserted before the page labeled for Transaction #75. The 74 pages would be cut along the line at the right edge of this column and bound on the right edge of the page to form a booklet
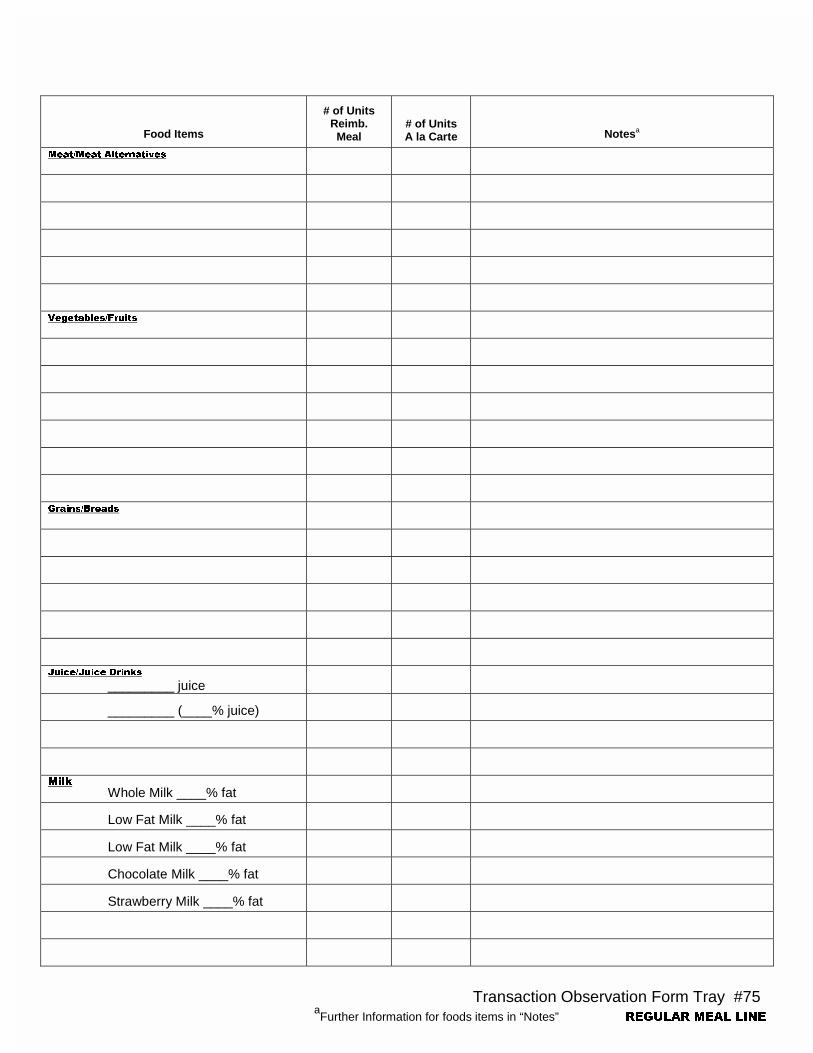
Transaction Observation Form Tray #75 aFurther Information for foods items in “Notes” ������� ���� ��
Food Items
# of Units Reimb. Meal
# of Units A la Carte Notesa
��������� ���������
��������� �����
��� �����
����������� ���
_________ juice
_________ (____% juice)
����
Whole Milk ____% fat
Low Fat Milk ____% fat
Low Fat Milk ____% fat
Chocolate Milk ____% fat
Strawberry Milk ____% fat

Transaction Observation Form � �� ����� �������� ���
P.O. Box 2393 Princeton, NJ 08543-2393
School: Date:
Observer:
Time Began:
Time Ended:
��������������������� ���
Meal: � Breakfast � Lunch Line Sampled: A la carte Line-Specified Approximate Number Transactions: Random Start: Take Every ______ th Transaction Actual Count of Transactions:
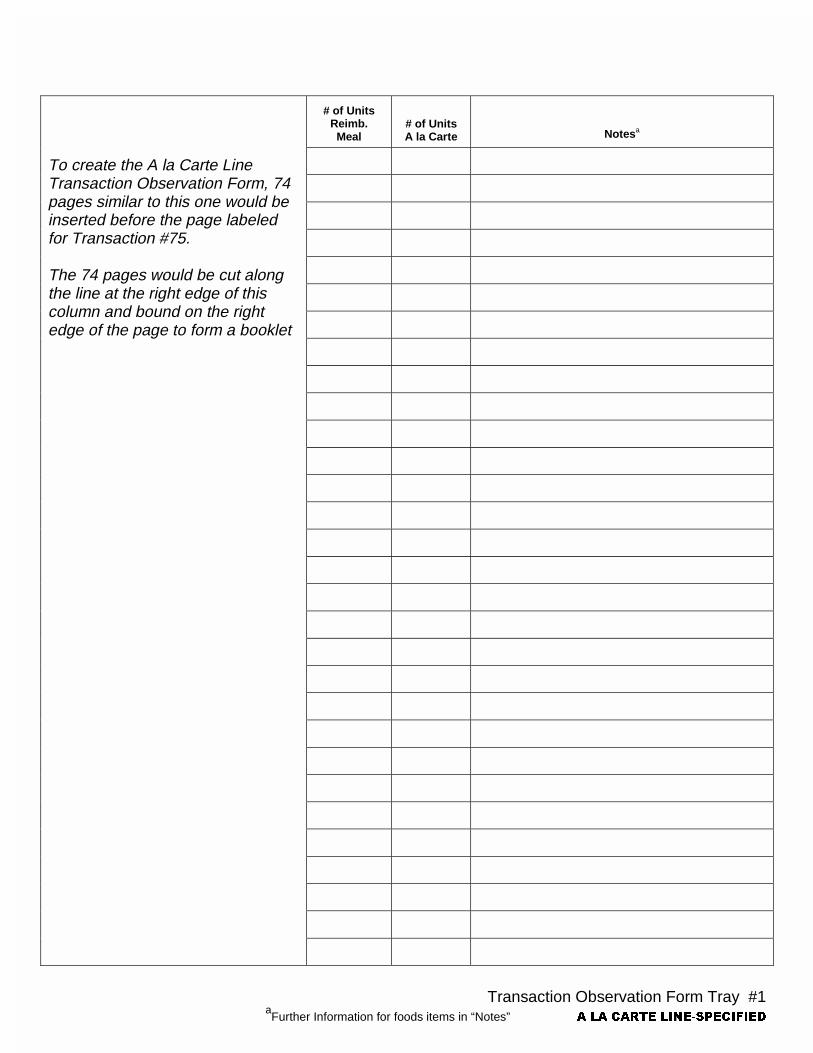
Transaction Observation Form Tray #1 aFurther Information for foods items in “Notes” � �� ����� �������� ���
# of Units Reimb. Meal
# of Units A la Carte Notesa
To create the A la Carte Line Transaction Observation Form, 74 pages similar to this one would be inserted before the page labeled for Transaction #75. The 74 pages would be cut along the line at the right edge of this column and bound on the right edge of the page to form a booklet
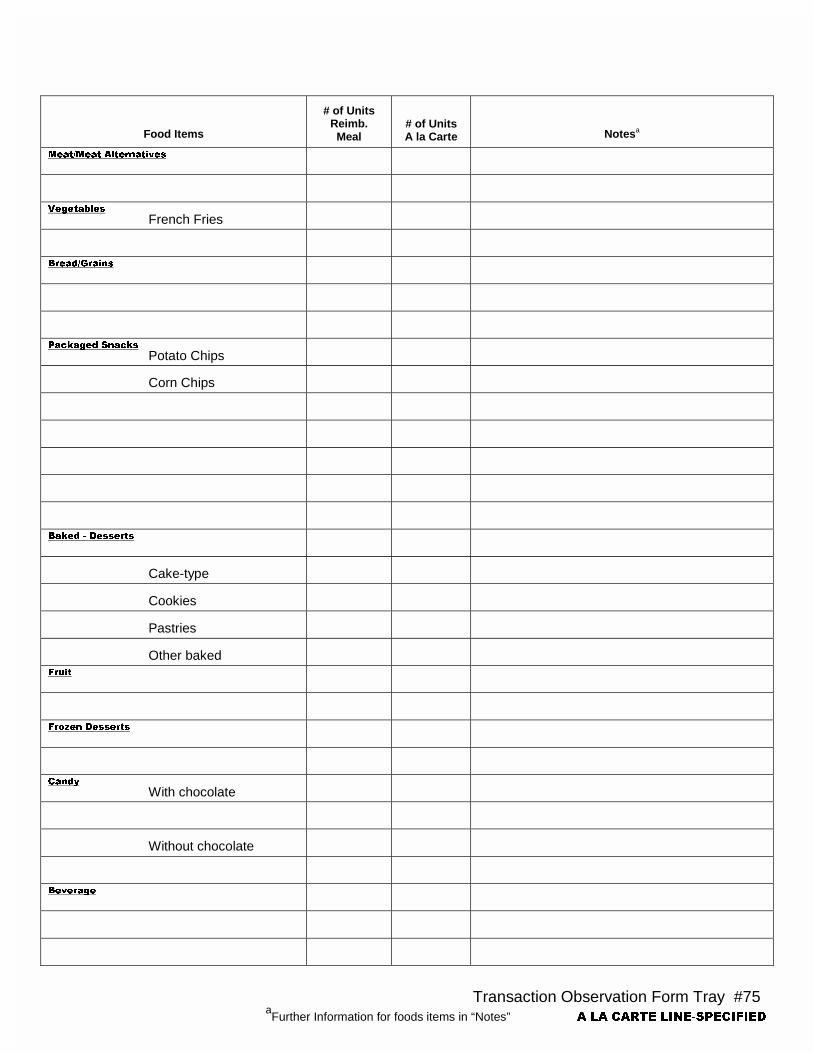
Transaction Observation Form Tray #75 aFurther Information for foods items in “Notes” � �� ����� �������� ���
Food Items
# of Units Reimb. Meal
# of Units A la Carte Notesa
��������� ���������
���������
French Fries
��������
�������� ����
Potato Chips
Corn Chips
����� � �� ��
Cake-type
Cookies
Pastries
Other baked ����
���� �� ��
����
With chocolate
Without chocolate
�������

Transaction Observation Form ����� ���
P.O. Box 2393 Princeton, NJ 08543-2393
School: Date:
Observer:
Time Began:
Time Ended:
��������������������� ���
Meal: � Breakfast � Lunch Line Sampled: Snack Line Approximate Number Transactions: Random Start: Take Every ______ th Transaction Actual Count of Transactions:
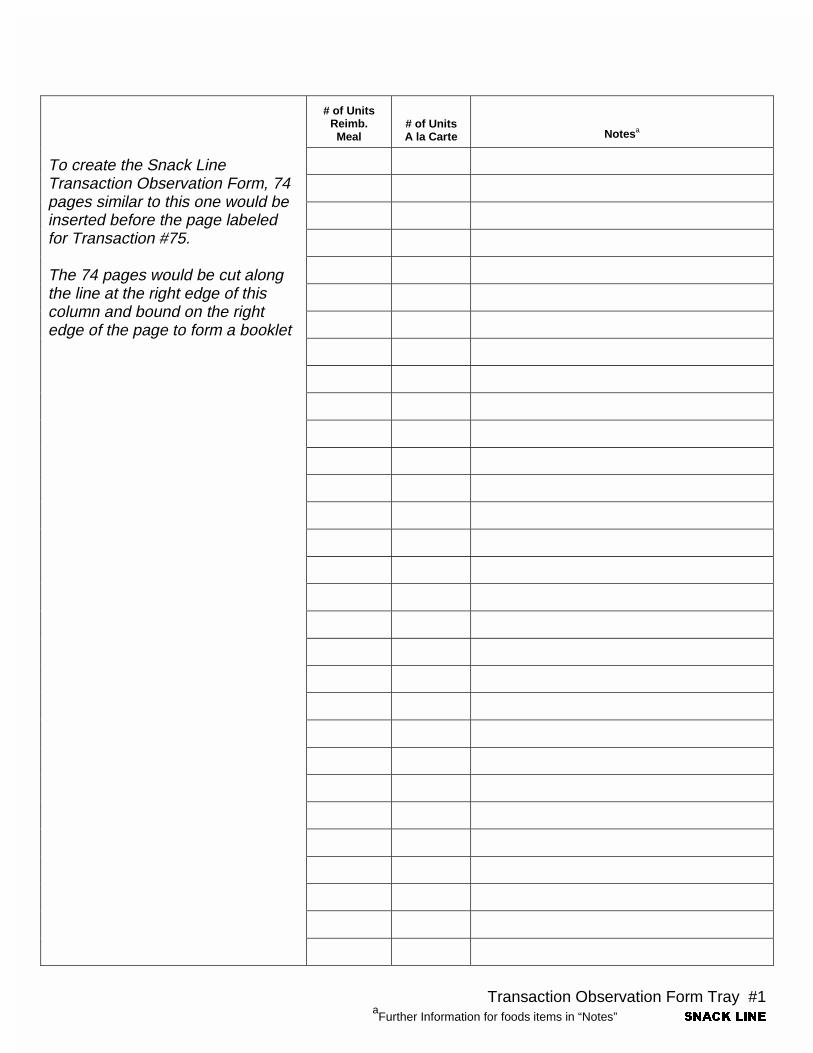
Transaction Observation Form Tray #1 aFurther Information for foods items in “Notes” ����� ���
# of Units Reimb. Meal
# of Units A la Carte Notesa
To create the Snack Line Transaction Observation Form, 74 pages similar to this one would be inserted before the page labeled for Transaction #75. The 74 pages would be cut along the line at the right edge of this column and bound on the right edge of the page to form a booklet
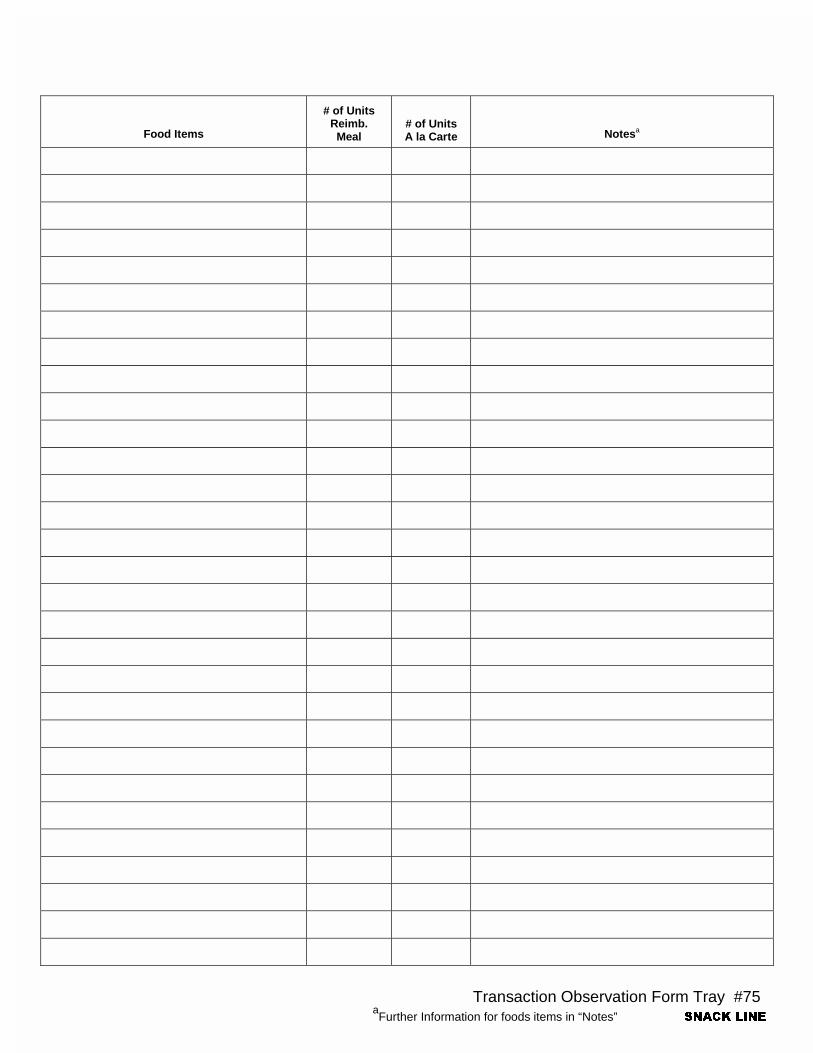
Transaction Observation Form Tray #75 aFurther Information for foods items in “Notes” ����� ���
Food Items
# of Units Reimb. Meal
# of Units A la Carte Notesa
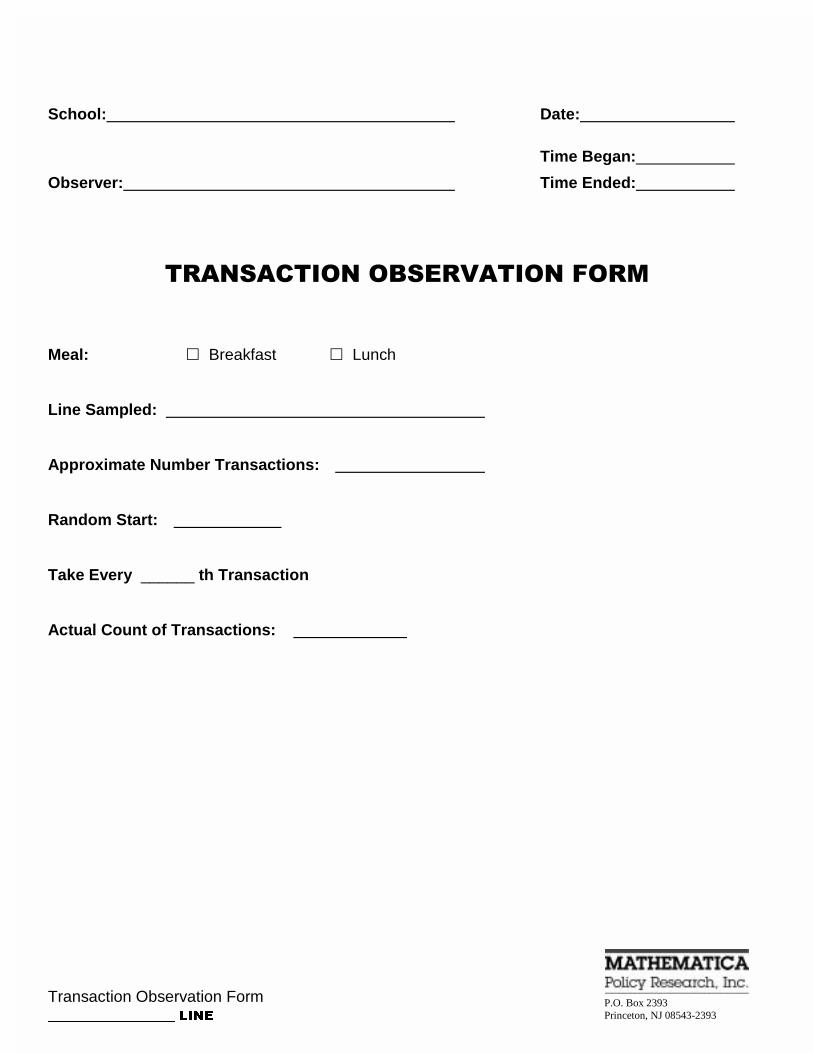
Transaction Observation Form ������������������� ����
P.O. Box 2393 Princeton, NJ 08543-2393
School: Date:
Observer:
Time Began:
Time Ended:
��������������������� ���
Meal: � Breakfast � Lunch Line Sampled: Approximate Number Transactions: Random Start: Take Every ______ th Transaction Actual Count of Transactions:
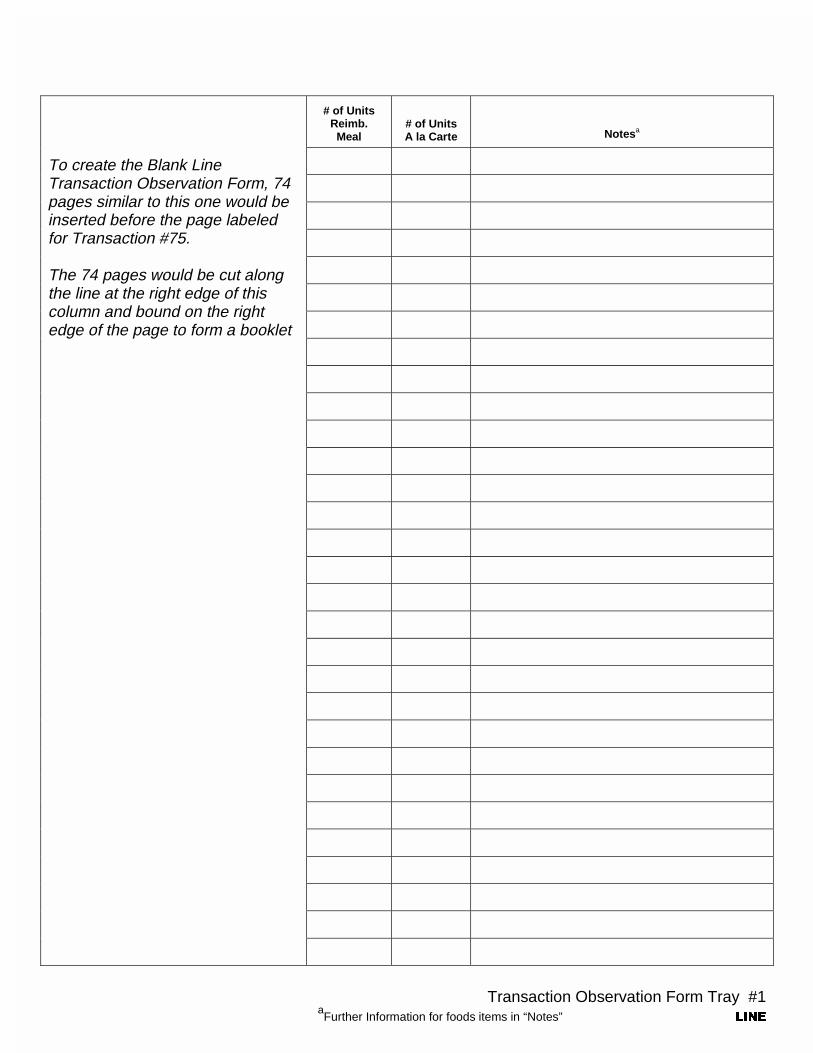
Transaction Observation Form Tray #1 aFurther Information for foods items in “Notes” ����������������� ����
# of Units Reimb. Meal
# of Units A la Carte Notesa
To create the Blank Line Transaction Observation Form, 74 pages similar to this one would be inserted before the page labeled for Transaction #75. The 74 pages would be cut along the line at the right edge of this column and bound on the right edge of the page to form a booklet
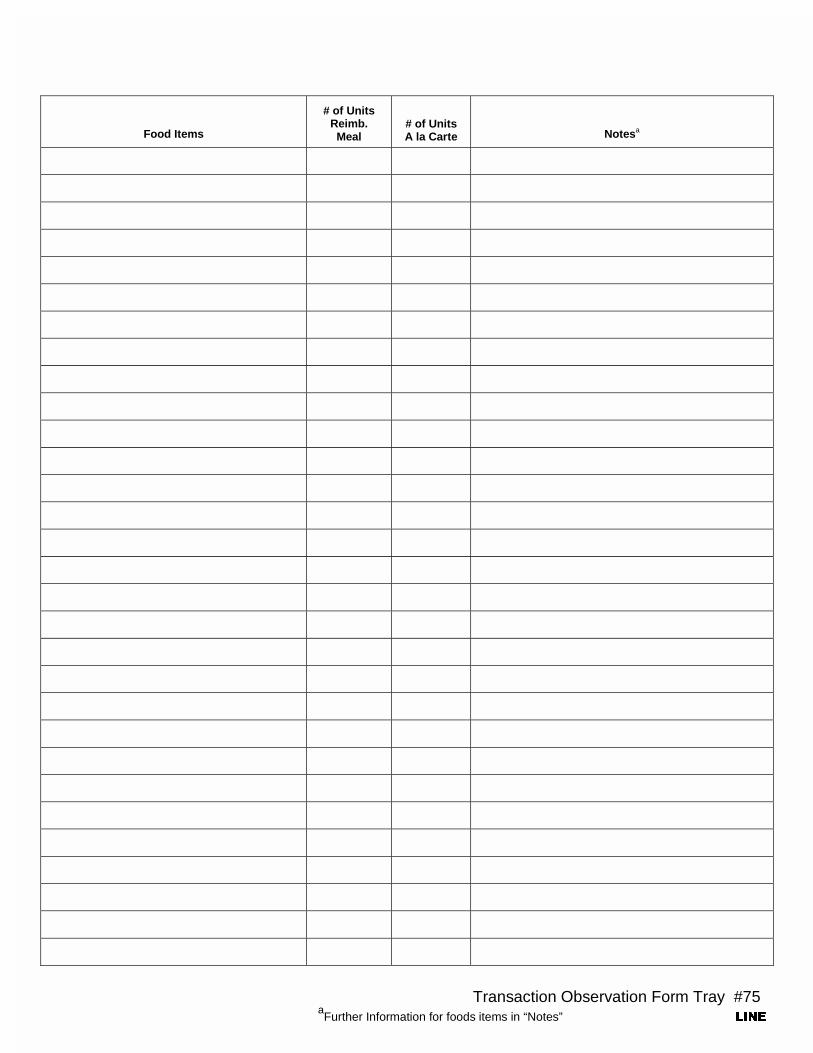
Transaction Observation Form Tray #75 aFurther Information for foods items in “Notes” ����������������� ����
Food Items
# of Units Reimb. Meal
# of Units A la Carte Notesa
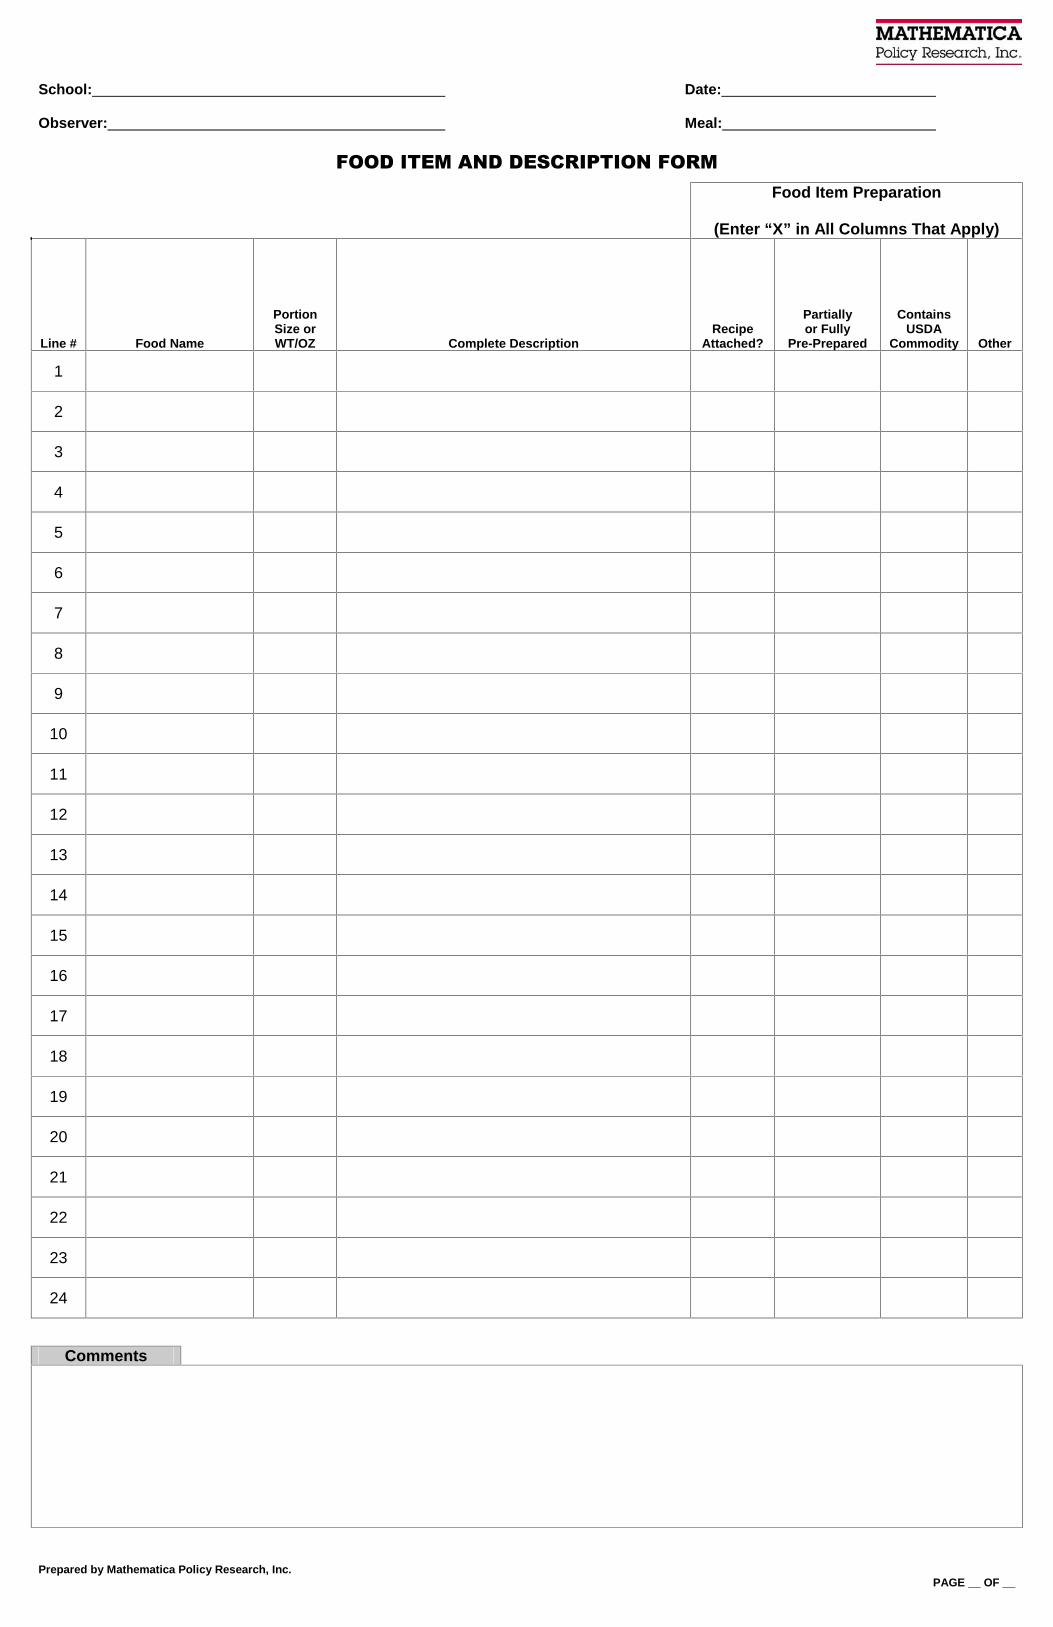
School: Date: Observer: Meal:
���������������� �������� ��
Prepared by Mathematica Policy Research, Inc. PAGE __ OF __
Food Item Preparation
(Enter “X” in All Columns That Apply)
Line # Food Name
Portion Size or WT/OZ Complete Description
Recipe Attached?
Partially or Fully
Pre-Prepared
Contains USDA
Commodity Other
1
2
3
4
5
6
7
8
9
10
11
12
13
14
15
16
17
18
19
20
21
22
23
24
Comments
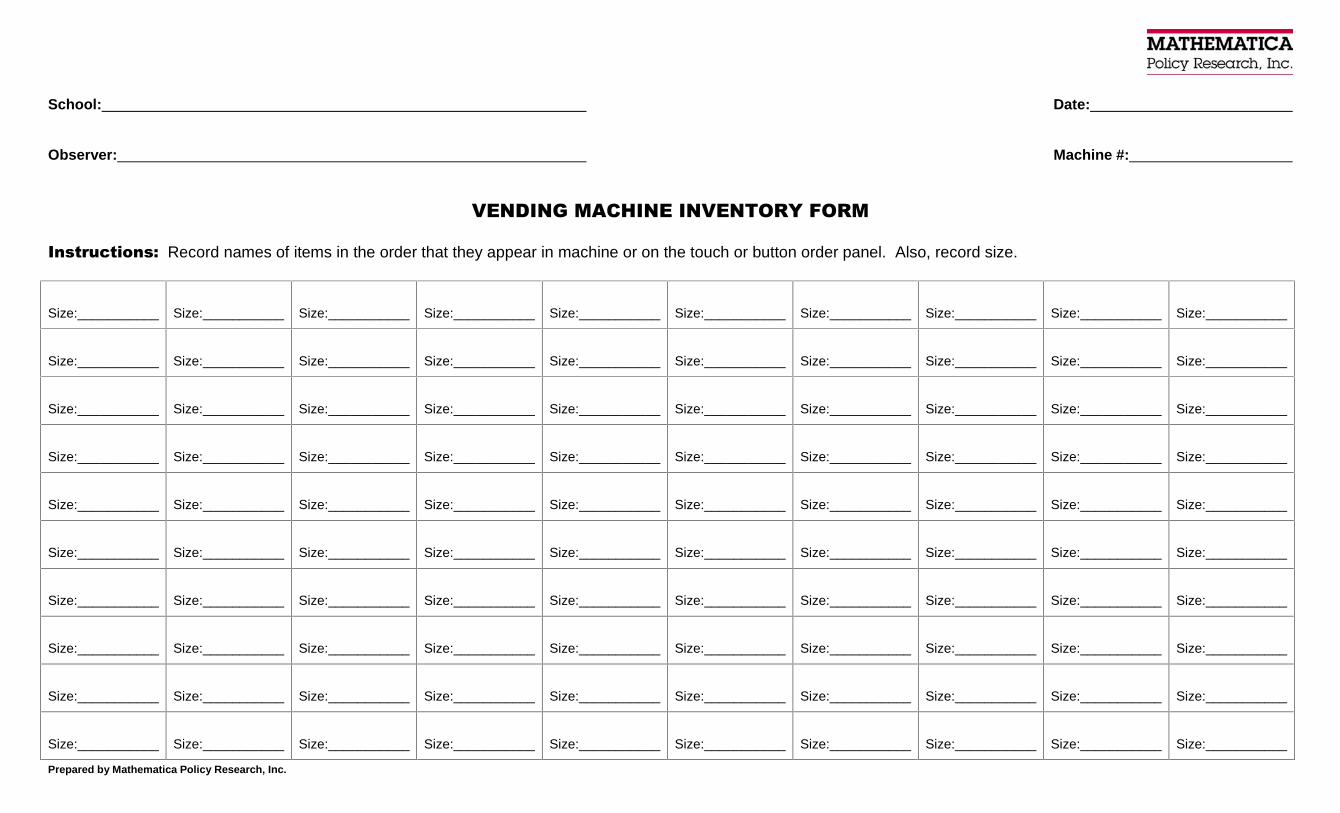
Prepared by Mathematica Policy Research, Inc.
School: Date: Observer: Machine #:
�������������������� ���� ��� ������������� Record names of items in the order that they appear in machine or on the touch or button order panel. Also, record size.
Size:___________ Size:___________ Size:___________ Size:___________ Size:___________ Size:___________ Size:___________ Size:___________ Size:___________ Size:___________
Size:___________ Size:___________ Size:___________ Size:___________ Size:___________ Size:___________ Size:___________ Size:___________ Size:___________ Size:___________
Size:___________ Size:___________ Size:___________ Size:___________ Size:___________ Size:___________ Size:___________ Size:___________ Size:___________ Size:___________
Size:___________ Size:___________ Size:___________ Size:___________ Size:___________ Size:___________ Size:___________ Size:___________ Size:___________ Size:___________
Size:___________ Size:___________ Size:___________ Size:___________ Size:___________ Size:___________ Size:___________ Size:___________ Size:___________ Size:___________
Size:___________ Size:___________ Size:___________ Size:___________ Size:___________ Size:___________ Size:___________ Size:___________ Size:___________ Size:___________
Size:___________ Size:___________ Size:___________ Size:___________ Size:___________ Size:___________ Size:___________ Size:___________ Size:___________ Size:___________
Size:___________ Size:___________ Size:___________ Size:___________ Size:___________ Size:___________ Size:___________ Size:___________ Size:___________ Size:___________
Size:___________ Size:___________ Size:___________ Size:___________ Size:___________ Size:___________ Size:___________ Size:___________ Size:___________ Size:___________
Size:___________ Size:___________ Size:___________ Size:___________ Size:___________ Size:___________ Size:___________ Size:___________ Size:___________ Size:___________
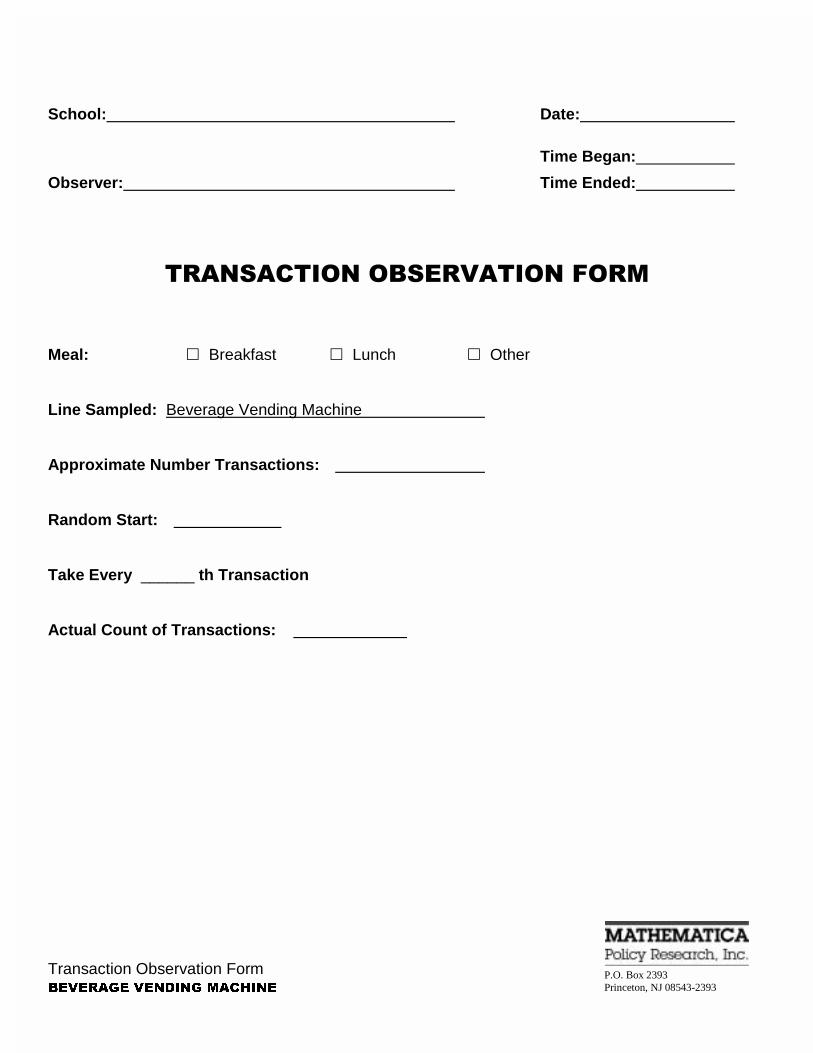
Transaction Observation Form �������� ����� ��� ��
P.O. Box 2393 Princeton, NJ 08543-2393
School: Date:
Observer:
Time Began:
Time Ended:
��������������������� ���
Meal: � Breakfast � Lunch � Other Line Sampled: Beverage Vending Machine Approximate Number Transactions: Random Start: Take Every ______ th Transaction Actual Count of Transactions:
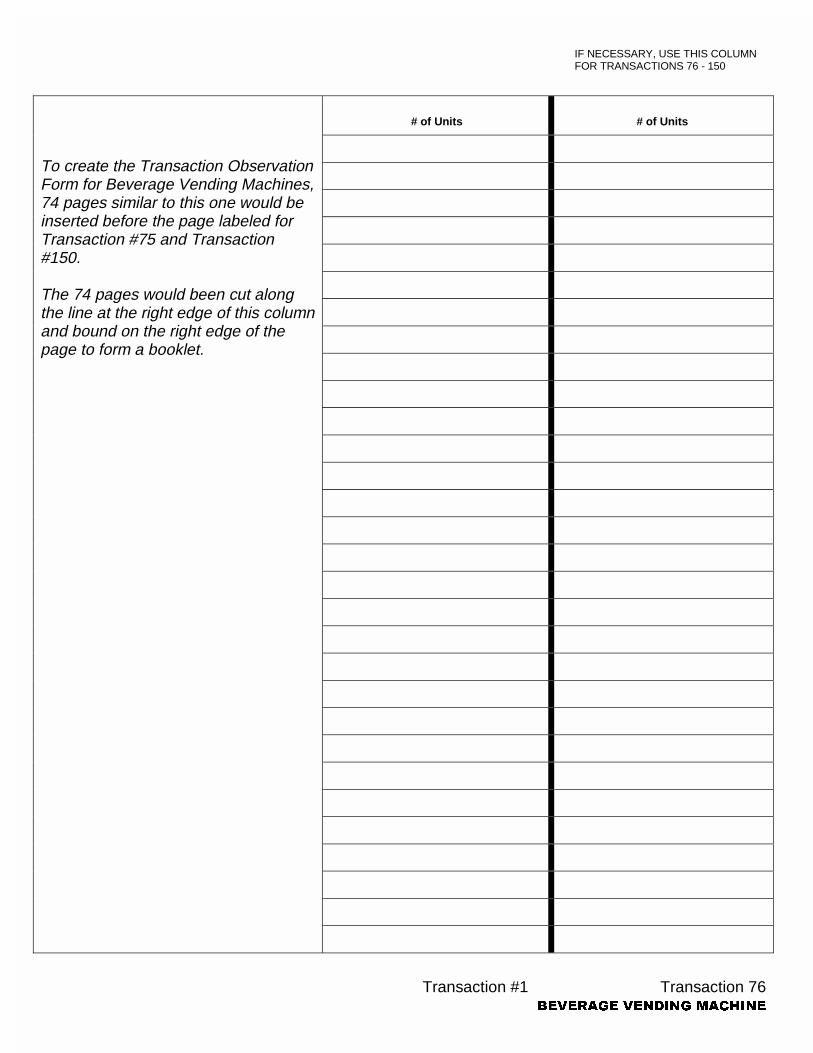
IF NECESSARY, USE THIS COLUMN FOR TRANSACTIONS 76 - 150
Transaction #1 Transaction 76 �������� ����� ��� ��
# of Units # of Units
To create the Transaction Observation Form for Beverage Vending Machines, 74 pages similar to this one would be inserted before the page labeled for Transaction #75 and Transaction #150. The 74 pages would been cut along the line at the right edge of this column and bound on the right edge of the page to form a booklet.
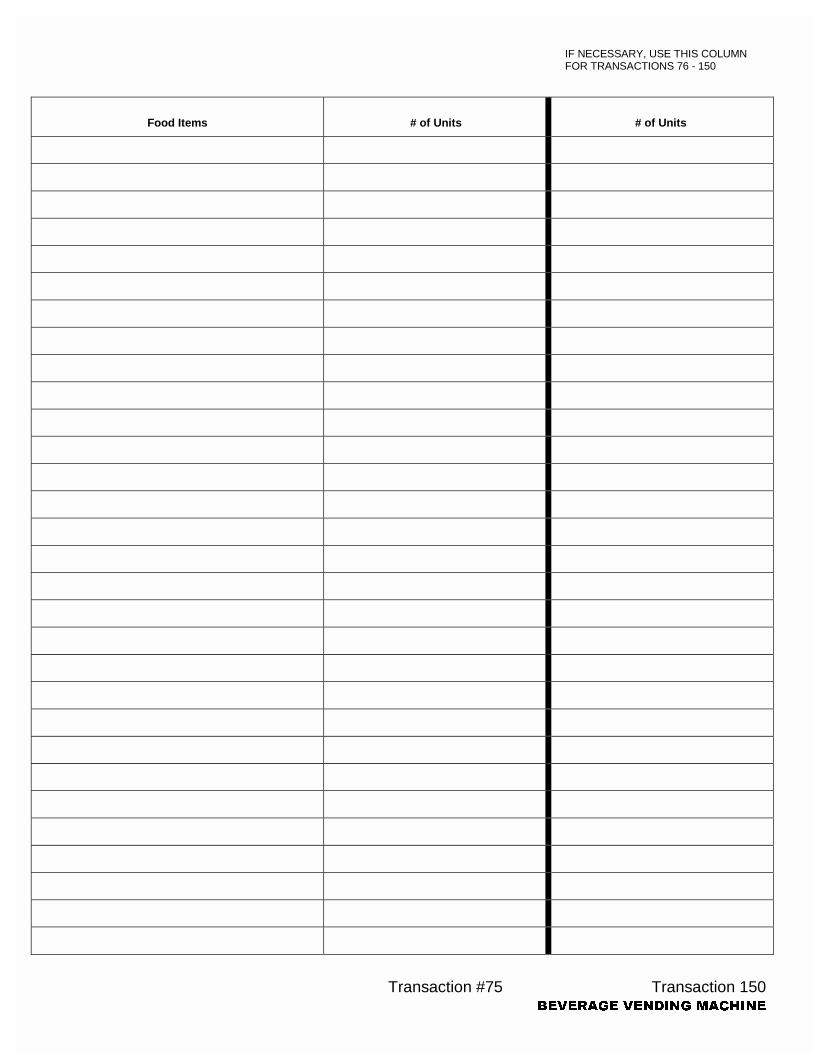
IF NECESSARY, USE THIS COLUMN FOR TRANSACTIONS 76 - 150
Transaction #75 Transaction 150 �������� ����� ��� ��
Food Items # of Units # of Units

APPENDIX B
DETAILS OF SAMPLING METHODS
B.3
A. DETAILS OF SAMPLING METHODS
This appendix provides additional details concerning the sampling methods summarized in Chapter II. Given that the focus of this study was to pilot test operational and analytical techniques in three schools, the sampling activities focused on the selection of a sample of cashier lines (or separately, vending machines) and a sample of transactions from these selected point of sale (POS) locations in each school. While our methods were developed and implemented on only three schools we feel our approach is methodologically defensible and would be transferable to a larger study. In a large scale application, the contractor also would potentially need to develop a sampling plan for selecting a sample of school districts and member schools to be included in the study. Furthermore, the contractor would need to develop a strategy for selecting the calendar days that each school would be visited during the data collection period.1 Such school and days-to-visit sampling procedures are not discussed here, as they were beyond the scope of this study.
In many schools, the students have the opportunity at each lunch period to purchase food
and beverage items from multiple food lines that have a separate cash registers. Likewise, students may be able to purchase such items from multiple vending machines. This situation presents a problem for designing a transaction-based data collection process since we did not think that it was feasible for a single data collector to observe even a sample of transactions at more than one POS location during any given lunch period. As a result, if there are in fact multiple locations operating at each lunch period, then to observe all of these locations, the contractor would need to have observers available to cover all of them. This approach would often be cost prohibitive. Therefore, we developed the sampling plan presented in this section to identify from the possible POS locations in operation during a given lunch period the one POS to assign to a single data collector for observation, as well as a sampling method for selecting transactions from these POS location assignments.
1. Selecting Cashier Lines and Vending Machines for Transaction Observations
Considerations
The development of a sampling plan for assigning cashier lines or vending machines to observers at a school was a challenging problem, given the operational constraints associated with the data collection process. As a starting point for discussing these issues, we define the population of entities that could be observed as the combination of a set of POS locations in operation2 during the days and associated lunch periods included in the data collection plan.
1We assume in this sampling plan that all the lunch periods would be observed on the days selected for visits and, as such, a lunch period sampling strategy would not be needed. It would be possible to incorporate into our plan a by-day lunch period sampling procedure if needed.
2We define an “operating” POS location as one that, under normal conditions, would be in use during the lunch period. We do not recommend excluding temporarily out-of-service POS locations from the sampling process. We also do not recommend the use of a sample location replacement approach, given the complexity it adds to the observer’s task. If a temporary out-of
B.4
Since we anticipate that a separate observer(s) would be used for vending machines from those used for the cashier lines, we consider these two groups to be distinct populations for sampling purposes.3 As an example for the cashier lines, suppose the school has two lunch periods operating on each day of the week, and for each lunch period there are two cashier lunch lines in operation. If the contractor decides to observe the transactions on two days, say, Tuesday and Wednesday, then the population of entities they could be observed consists of eight cashier line by day by period combinations (2 lines at each of 2 lunch periods for each of 2 days of the week).
From our set of observable entities, our goal was to design a sampling process for assigning
observers to a sample of these entities such that the observed transactions from these POS location assignments could be used to produce representative estimates of the desired outcomes. In light of this goal, we developed a sampling plan to meet the following objectives:
1. The plan provides for an unbiased estimation of the characteristics of the POS transactions at a given school, which we define as a plan that gives each observable entity a known, non-zero probability of selection.
2. The plan provides the ability to prepare separate estimates for each school for each POS location or at least some group of these locations (referred to as POS strata).4 To achieve this we require that at each school each POS location or POS strata be observed at least once during the data collection period.
3. Based on the assumption that an observer can only observe one POS location per lunch period, the plan must be designed accordingly so that no worker is required to observe more than one POS location at the same day and period.
(continued) –service location is sampled, we recommend that the observer record a value of 0 transactions for the POS location and note the condition. This approach produces survey estimates that reflect transaction counts and profiles on a typical set of school days rather than what would be observed in an ideal setting in which all units are in operation.
3Depending on the situations, the two types of POS locations may combinable for sampling purposes. In general, however, we anticipate that some machines would not be located in the main cafeteria to facilitate some combined observation and sampling process. Furthermore, vending machines, unlike the cashier lines, may not be in close proximity to each other. Instead, they may be spread throughout the school building(s).
4Lines could be grouped by common characteristics such a preparation methods (e.g., hot vs. cold), taste appeal, and nutritional profile. Likewise, vending machines could be grouped by the type of product offered, beverages vs. snacks, and so forth.
B.5
4. The plan accounts for, to the extent possible, a differential volume of transactions across the POS locations or POS location strata, and for the fact that the observers will be limited as to how many transactions they can observe on a given assignment.5
We recommend that the observer sample and observe transactions on the assigned POS location for the entire term of the lunch period. Given that the flow of transactions will vary over the period a sampling method to observe the transactions for a portion of the lunch period may be inefficient.
Methods
The sampling plan developed for selecting day/time/POS combinations is based on a relatively simple set of procedures that assigns POS locations to be observed in a probabilistic fashion to available observers at each lunch period and day combination. As we will show, this assignment methodology—by the nature of the approach—achieves the first three of our suggested requirements (objectives #1, #2 and #3 above). Depending on the situation, it at least partially accounts for the variation in line volumes (objective #4) to improve the precision in the survey estimates. While the process is fairly simple to implement in most situations, the conceptual framework behind it quite complex. We discuss this framework in the next few paragraphs for interested readers; we follow with an overview of the individual sampling steps.
For sampling, one can envision the sampling “problem” as consisting of two combination sets that describe the items to be observed and who can observe them that, in essence, must be mapped to each other to generate a set of sampled POS location observer assignments. The first combination set is previously defined as the population of observable entities consisting of the combination of POS locations (i.e., being cashier lines or vending machines). The second combination set describes the observer assignments, defined as the available “observer slots” that consists of the combination of the number of observers available for each lunch period on each of the days in the data collection period. To our benefit, in most cases these two combination sets share identical day and lunch period components.6 This provides us with two ways to approach the sampling issues that we will contrast briefly. The first method is akin to traditional sampling concepts and, as such, conceptually produces a representative sample. Unfortunately, this approach fails to achieve the critical operational objectives without the use of a fairly complex algorithm. The second method meets all of the sampling requirements and as such was
5In light of these objectives, the standard sampling practice is to sample the POS locations in
proportion to their volume and then to select a fixed sample of transactions from each. This basically achieves a self-weighting sample in that each transaction has the same probability of selection to maximize the statistical precision in the estimates, and likewise achieves a constant workload for each observer.
6We note that it is possible for a particular lunch line to operate only during a subset of lunch periods or days. In that case, we present in the discussion of the sampling steps a method to account for partial operation of some lines over the term.
B.6
adopted for this study. Yet it approaches the problem from a different perspective, thus making it more difficult to recognize its representative properties.
In the first approach, we reduce the observer combination set to its fundamental units, the number of observers assigned to the school, which typically would be one. That leaves us with the combination set of observable entities at specific days and times. If we consider this as the sampling frame in the traditional sampling sense, we can simply draw a sample from this list and assign the data collector to observe these selected POS, day, and period combinations. However, there are numerous potential undesirable operational outcomes with this approach. The major problem with this approach that the set of all possible samples includes situations in which two or more POS locations are assigned to the same observer for a given day and lunch period. Furthermore, there is no guarantee that each location will be sampled at least once and that assignments will be created for every period.
One way to solve these problems is to adapt the sampling method by identifying among the possible set of samples the ones that meet the sampling requirements, and then select one of these from that set. Unfortunately, we anticipate that a complex computer algorithm would be required to identify the subset of samples that meet the objectives, and therefore exclude this approach.
In the second selected sampling approach, the methods are somewhat reversed. We first reduce the combination of observable entities, rather than the observer slots as in the first approach, to their core units—the unique POS locations. The process then becomes one of assigning a POS location to each observer slot. For a representative sample, we want each POS location to have a probability to be selected in each observer slot. Bearing this in mind, if we just pick a POS locations at random to assign to each slot, we are not guaranteed that each location will be picked at least once.
To solve this problem, we developed a systematic sampling based procedure. For the simplest application of our technique, one sorts the slots in a random order and then, to mimic a systematic sampling process, a POS location is selected for random assignment to the first slot. Then, based on some ordering of the POS locations, the next ordered POS location is assigned to slot #2 and so on, recycling through the list of POS locations as needed until the all the slots have been assigned. This process by design ensures that only one location is assigned to each slot. Unless the number of unique POS locations exceeds the number of slots, all locations will be sampled at least once with this approach.7 Moreover, as in a systematic sampling process, each POS location has a chance to be selected in any slot to produce a representative sample since the first assignment is made at random.
7If the number of POS locations exceeds the available slots, one can relax the sampling
objectives to only require that each POS location stratum is observed at least once. With that approach, one uses the POS location stratum groups in place of the locations in the described systematic sampling approach. Then, once the location strata are assigned to each slot, one of the member lines can be selected at random to be observed.
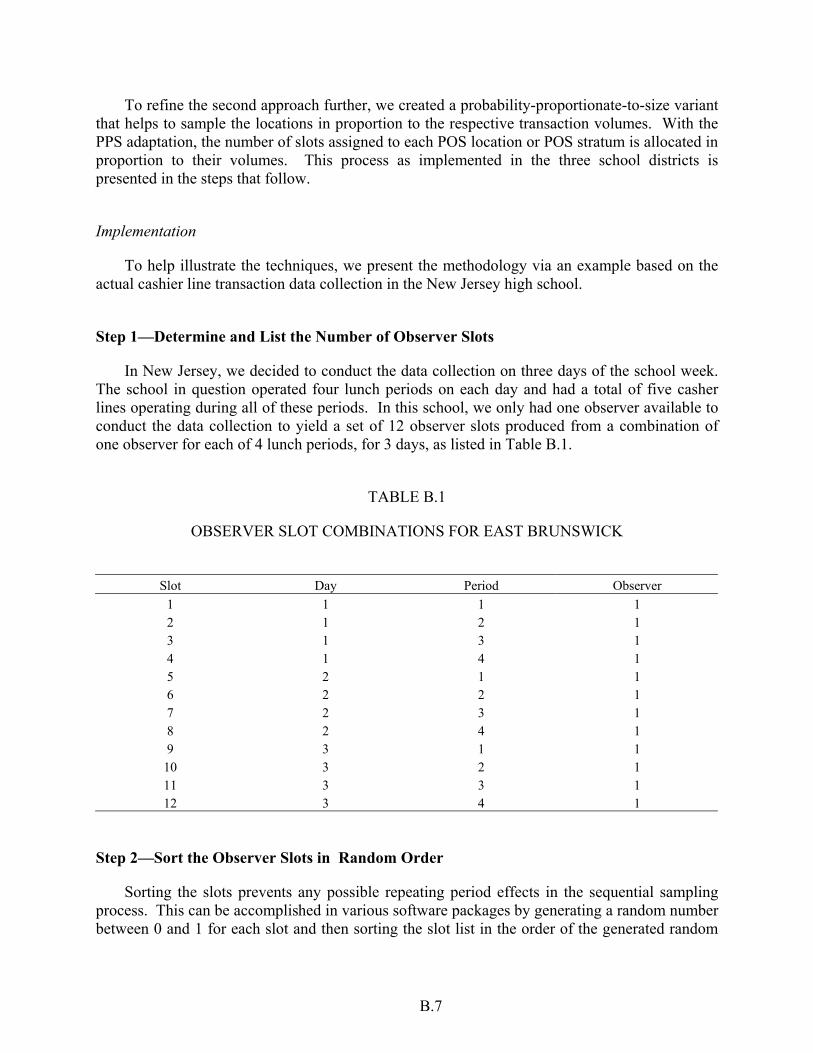
B.7
To refine the second approach further, we created a probability-proportionate-to-size variant that helps to sample the locations in proportion to the respective transaction volumes. With the PPS adaptation, the number of slots assigned to each POS location or POS stratum is allocated in proportion to their volumes. This process as implemented in the three school districts is presented in the steps that follow.
Implementation
To help illustrate the techniques, we present the methodology via an example based on the actual cashier line transaction data collection in the New Jersey high school.
Step 1—Determine and List the Number of Observer Slots
In New Jersey, we decided to conduct the data collection on three days of the school week. The school in question operated four lunch periods on each day and had a total of five casher lines operating during all of these periods. In this school, we only had one observer available to conduct the data collection to yield a set of 12 observer slots produced from a combination of one observer for each of 4 lunch periods, for 3 days, as listed in Table B.1.
TABLE B.1
OBSERVER SLOT COMBINATIONS FOR EAST BRUNSWICK
Slot Day Period Observer
1 1 1 1 2 1 2 1 3 1 3 1 4 1 4 1 5 2 1 1 6 2 2 1 7 2 3 1 8 2 4 1 9 3 1 1
10 3 2 1 11 3 3 1 12 3 4 1
Step 2—Sort the Observer Slots in Random Order
Sorting the slots prevents any possible repeating period effects in the sequential sampling process. This can be accomplished in various software packages by generating a random number between 0 and 1 for each slot and then sorting the slot list in the order of the generated random
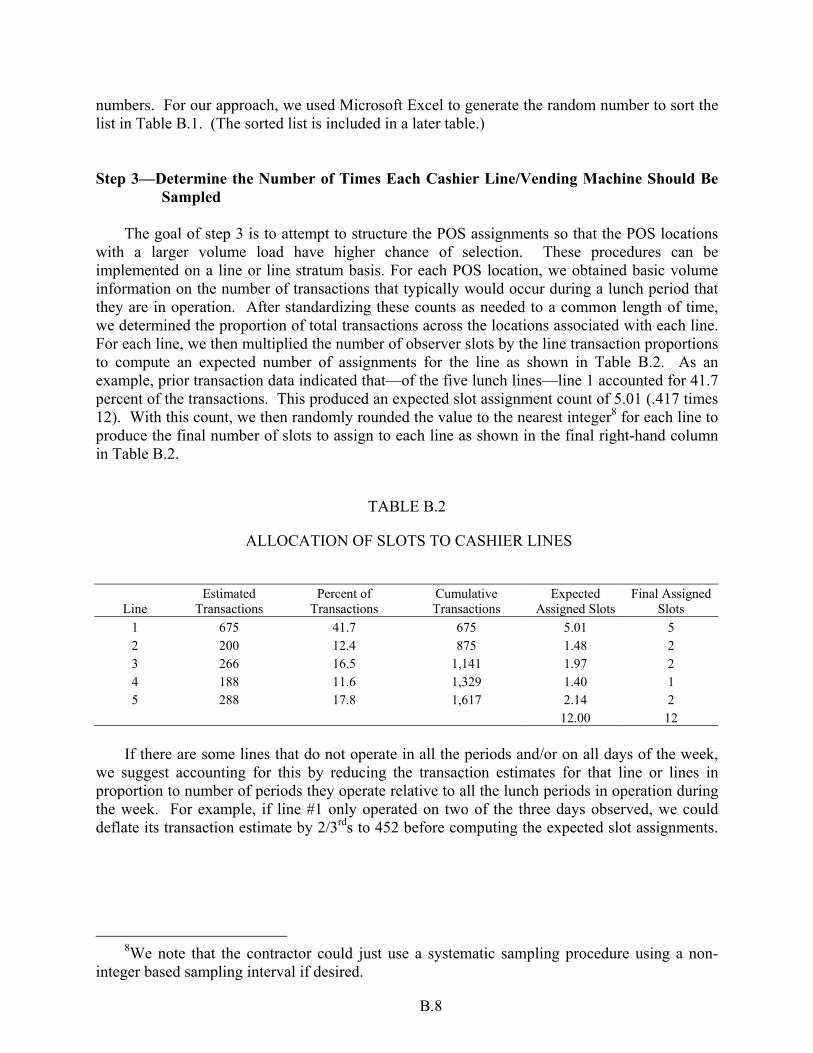
B.8
numbers. For our approach, we used Microsoft Excel to generate the random number to sort the list in Table B.1. (The sorted list is included in a later table.) Step 3—Determine the Number of Times Each Cashier Line/Vending Machine Should Be
Sampled
The goal of step 3 is to attempt to structure the POS assignments so that the POS locations with a larger volume load have higher chance of selection. These procedures can be implemented on a line or line stratum basis. For each POS location, we obtained basic volume information on the number of transactions that typically would occur during a lunch period that they are in operation. After standardizing these counts as needed to a common length of time, we determined the proportion of total transactions across the locations associated with each line. For each line, we then multiplied the number of observer slots by the line transaction proportions to compute an expected number of assignments for the line as shown in Table B.2. As an example, prior transaction data indicated that—of the five lunch lines—line 1 accounted for 41.7 percent of the transactions. This produced an expected slot assignment count of 5.01 (.417 times 12). With this count, we then randomly rounded the value to the nearest integer8 for each line to produce the final number of slots to assign to each line as shown in the final right-hand column in Table B.2.
TABLE B.2
ALLOCATION OF SLOTS TO CASHIER LINES
Line Estimated
Transactions Percent of
Transactions Cumulative Transactions
Expected Assigned Slots
Final Assigned Slots
1 675 41.7 675 5.01 5 2 200 12.4 875 1.48 2 3 266 16.5 1,141 1.97 2 4 188 11.6 1,329 1.40 1 5 288 17.8 1,617 2.14 2 12.00 12
If there are some lines that do not operate in all the periods and/or on all days of the week,
we suggest accounting for this by reducing the transaction estimates for that line or lines in proportion to number of periods they operate relative to all the lunch periods in operation during the week. For example, if line #1 only operated on two of the three days observed, we could deflate its transaction estimate by 2/3rds to 452 before computing the expected slot assignments.
8We note that the contractor could just use a systematic sampling procedure using a non-
integer based sampling interval if desired.
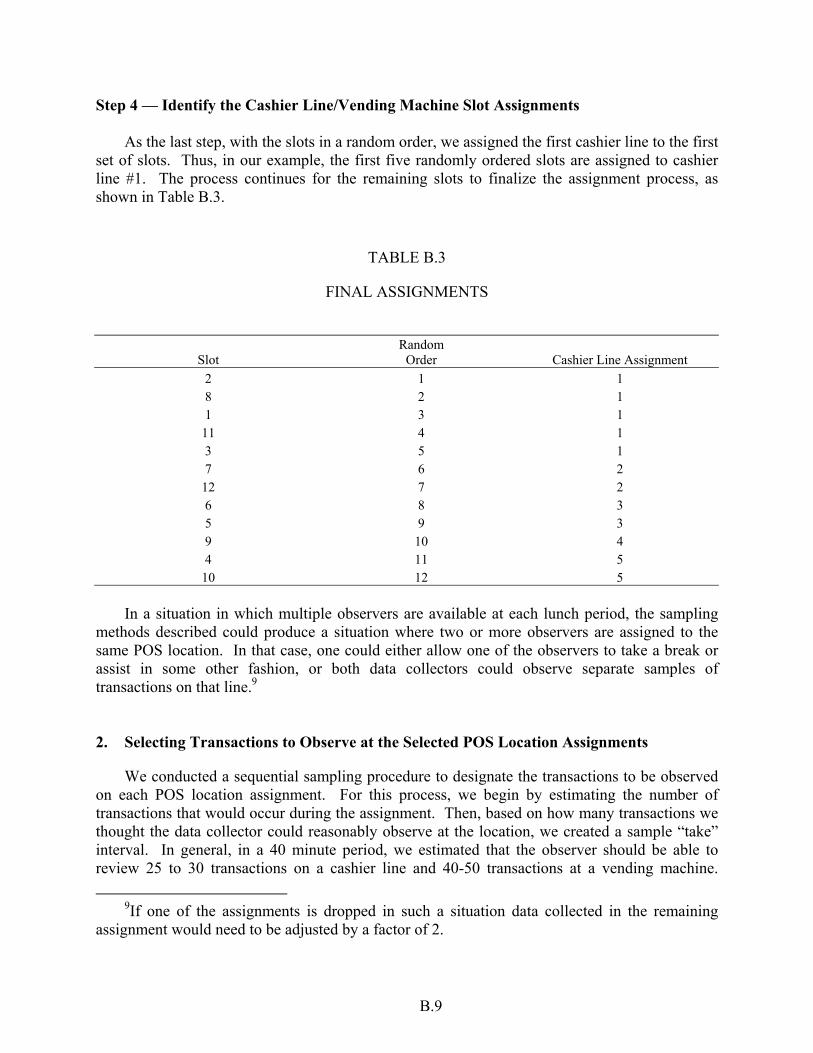
B.9
Step 4 — Identify the Cashier Line/Vending Machine Slot Assignments
As the last step, with the slots in a random order, we assigned the first cashier line to the first set of slots. Thus, in our example, the first five randomly ordered slots are assigned to cashier line #1. The process continues for the remaining slots to finalize the assignment process, as shown in Table B.3.
TABLE B.3
FINAL ASSIGNMENTS
Slot Random
Order Cashier Line Assignment 2 1 1 8 2 1 1 3 1
11 4 1 3 5 1 7 6 2
12 7 2 6 8 3 5 9 3 9 10 4 4 11 5
10 12 5 In a situation in which multiple observers are available at each lunch period, the sampling methods described could produce a situation where two or more observers are assigned to the same POS location. In that case, one could either allow one of the observers to take a break or assist in some other fashion, or both data collectors could observe separate samples of transactions on that line.9 2. Selecting Transactions to Observe at the Selected POS Location Assignments
We conducted a sequential sampling procedure to designate the transactions to be observed on each POS location assignment. For this process, we begin by estimating the number of transactions that would occur during the assignment. Then, based on how many transactions we thought the data collector could reasonably observe at the location, we created a sample “take” interval. In general, in a 40 minute period, we estimated that the observer should be able to review 25 to 30 transactions on a cashier line and 40-50 transactions at a vending machine.
9If one of the assignments is dropped in such a situation data collected in the remaining assignment would need to be adjusted by a factor of 2.
B.10
Using these counts, we computed the sampling take-interval (every nth record, e.g., every 5th transaction) equal to the number of expected transactions divided by the number of target transactions to observe. As a final step, we randomly rounded this value to an integer, and the observer selected every nth transaction (after using a random start between 1 and the “take” interval) for recording purposes.
APPENDIX C
SELECTION OF FOOD AND BEVERAGE ITEMS OFFERED IN VENDING MACHINES
C.3
Because of the importance of vending machines as a source of competitive foods, as well as
the extensive policy concerns that surround these machines, we believed it useful to supply a
detailed summary of the foods being offered in vending machines at the three schools we visited.
The tables in this appendix supply this information.
For each machine, the tables indicate both the foods and beverages that were available and
their physical position within the machine. For instance, for a typical beverage machine that
offers one vertical column of drinks, the selections are listed vertically in the corresponding table
below, with their order reflecting the observed arrangement in the machine. On the other hand,
many “snack” machines are set up as two-dimensional grids. In these cases, the foods in the
tables are listed in two-dimensional grids as well, showing the relative positions of the foods.
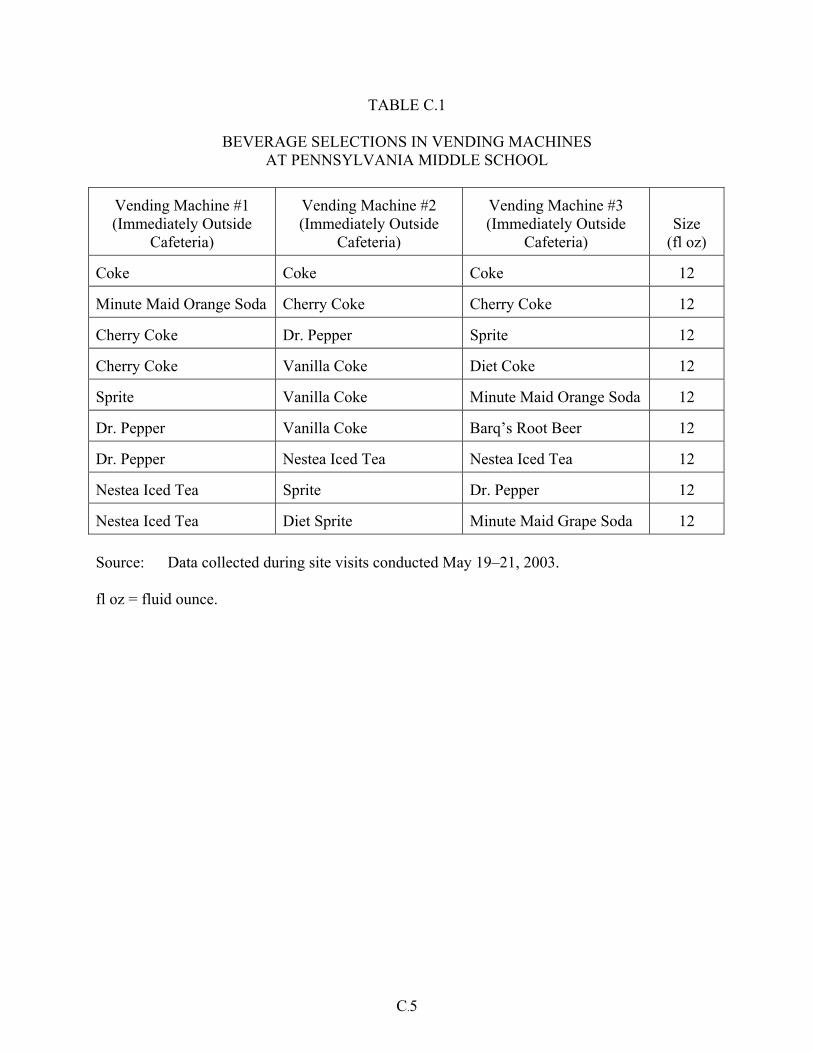
C.5
TABLE C.1
BEVERAGE SELECTIONS IN VENDING MACHINES AT PENNSYLVANIA MIDDLE SCHOOL
Vending Machine #1 (Immediately Outside
Cafeteria)
Vending Machine #2 (Immediately Outside
Cafeteria)
Vending Machine #3 (Immediately Outside
Cafeteria) Size
(fl oz)
Coke Coke Coke 12
Minute Maid Orange Soda Cherry Coke Cherry Coke 12
Cherry Coke Dr. Pepper Sprite 12
Cherry Coke Vanilla Coke Diet Coke 12
Sprite Vanilla Coke Minute Maid Orange Soda 12
Dr. Pepper Vanilla Coke Barq’s Root Beer 12
Dr. Pepper Nestea Iced Tea Nestea Iced Tea 12
Nestea Iced Tea Sprite Dr. Pepper 12
Nestea Iced Tea Diet Sprite Minute Maid Grape Soda 12 Source: Data collected during site visits conducted May 19–21, 2003. fl oz = fluid ounce.
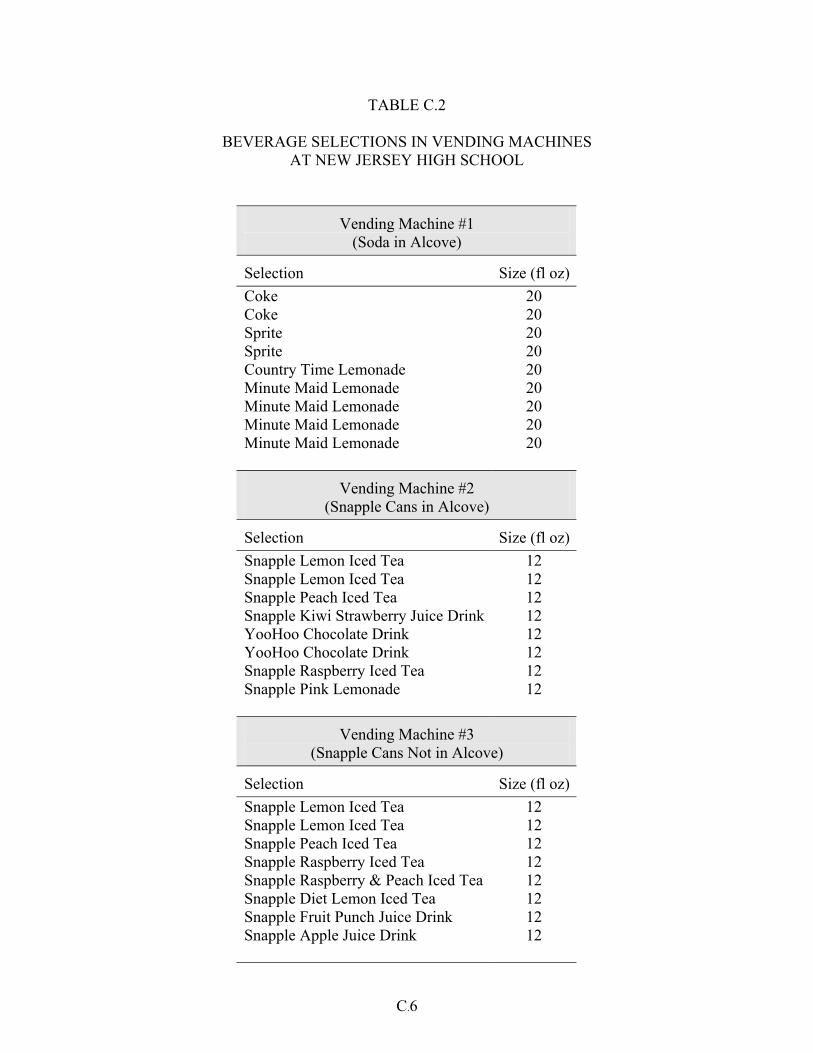
C.6
TABLE C.2
BEVERAGE SELECTIONS IN VENDING MACHINES AT NEW JERSEY HIGH SCHOOL
Vending Machine #1 (Soda in Alcove)
Selection Size (fl oz)Coke 20 Coke 20 Sprite 20 Sprite 20 Country Time Lemonade 20 Minute Maid Lemonade 20 Minute Maid Lemonade 20 Minute Maid Lemonade 20 Minute Maid Lemonade 20
Vending Machine #2 (Snapple Cans in Alcove)
Selection Size (fl oz)Snapple Lemon Iced Tea 12 Snapple Lemon Iced Tea 12 Snapple Peach Iced Tea 12 Snapple Kiwi Strawberry Juice Drink 12 YooHoo Chocolate Drink 12 YooHoo Chocolate Drink 12 Snapple Raspberry Iced Tea 12 Snapple Pink Lemonade 12
Vending Machine #3 (Snapple Cans Not in Alcove)
Selection Size (fl oz)Snapple Lemon Iced Tea 12 Snapple Lemon Iced Tea 12 Snapple Peach Iced Tea 12 Snapple Raspberry Iced Tea 12 Snapple Raspberry & Peach Iced Tea 12 Snapple Diet Lemon Iced Tea 12 Snapple Fruit Punch Juice Drink 12 Snapple Apple Juice Drink 12
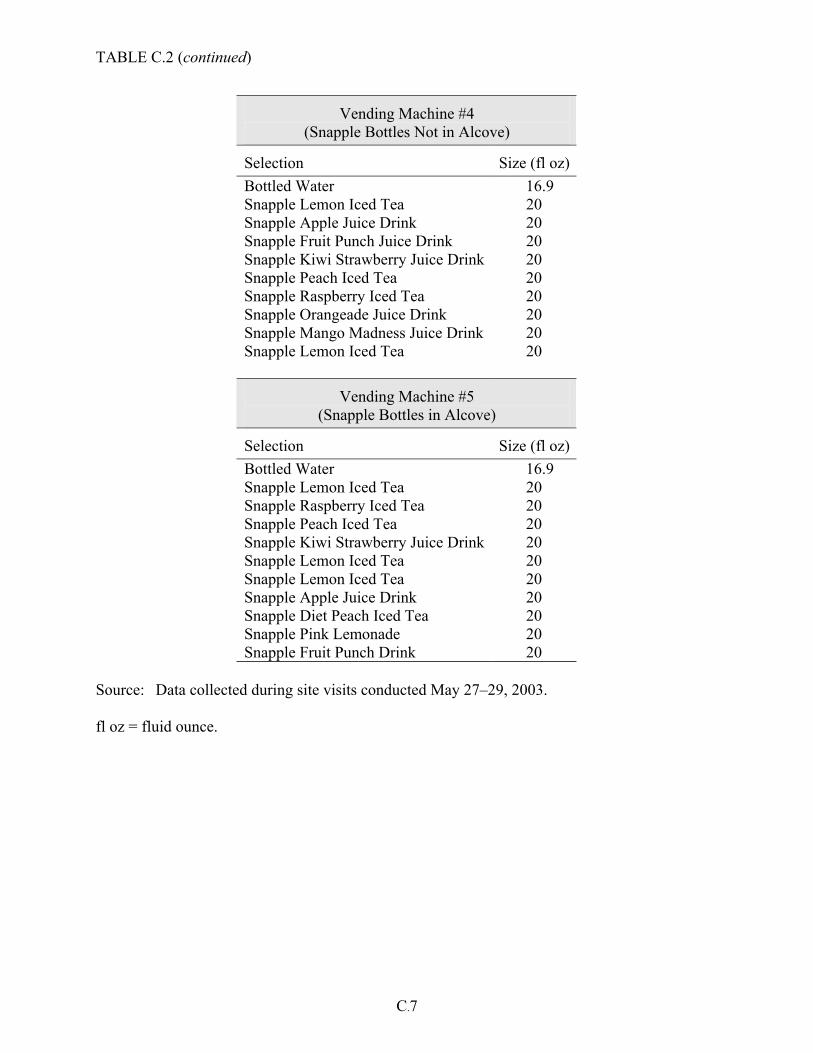
TABLE C.2 (continued)
C.7
Vending Machine #4 (Snapple Bottles Not in Alcove)
Selection Size (fl oz)Bottled Water 16.9 Snapple Lemon Iced Tea 20 Snapple Apple Juice Drink 20 Snapple Fruit Punch Juice Drink 20 Snapple Kiwi Strawberry Juice Drink 20 Snapple Peach Iced Tea 20 Snapple Raspberry Iced Tea 20 Snapple Orangeade Juice Drink 20 Snapple Mango Madness Juice Drink 20 Snapple Lemon Iced Tea 20
Vending Machine #5 (Snapple Bottles in Alcove)
Selection Size (fl oz)Bottled Water 16.9 Snapple Lemon Iced Tea 20 Snapple Raspberry Iced Tea 20 Snapple Peach Iced Tea 20 Snapple Kiwi Strawberry Juice Drink 20 Snapple Lemon Iced Tea 20 Snapple Lemon Iced Tea 20 Snapple Apple Juice Drink 20 Snapple Diet Peach Iced Tea 20 Snapple Pink Lemonade 20 Snapple Fruit Punch Drink 20
Source: Data collected during site visits conducted May 27–29, 2003. fl oz = fluid ounce.
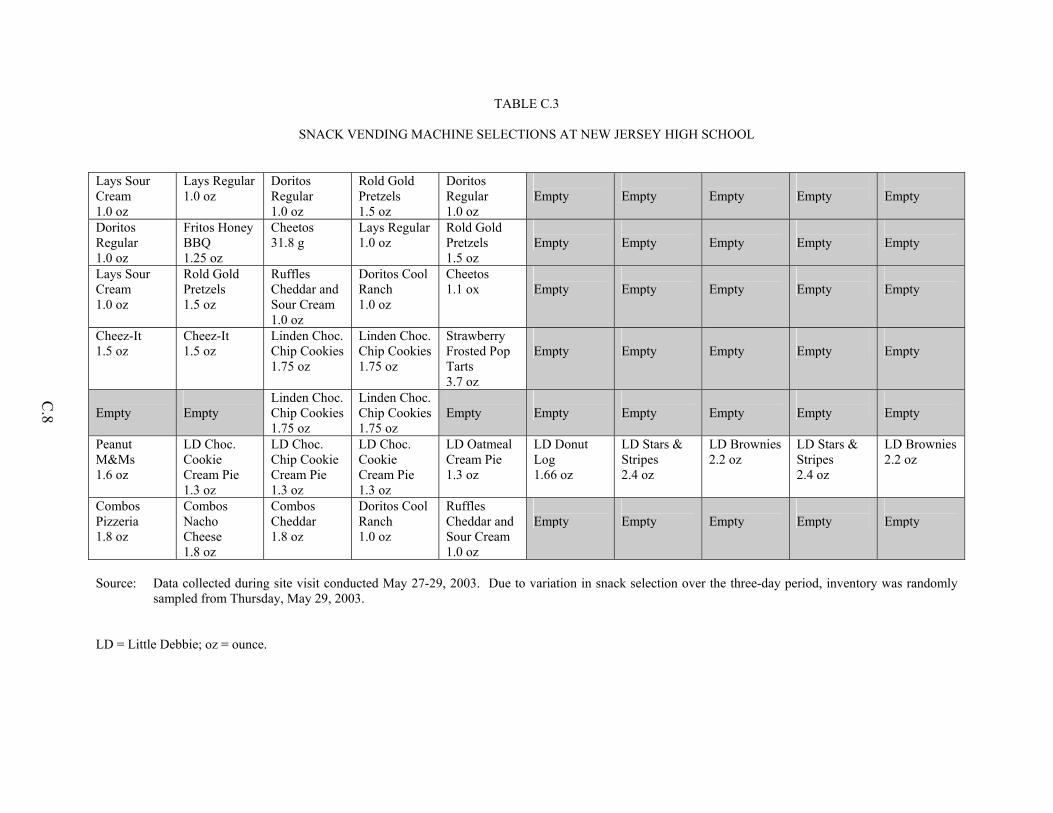
C.8
TABLE C.3
SNACK VENDING MACHINE SELECTIONS AT NEW JERSEY HIGH SCHOOL Lays Sour Cream 1.0 oz
Lays Regular 1.0 oz
Doritos Regular 1.0 oz
Rold Gold Pretzels 1.5 oz
Doritos Regular 1.0 oz
Empty
Empty
Empty
Empty
Empty
Doritos Regular 1.0 oz
Fritos Honey BBQ 1.25 oz
Cheetos 31.8 g
Lays Regular 1.0 oz
Rold Gold Pretzels 1.5 oz
Empty
Empty
Empty
Empty
Empty
Lays Sour Cream 1.0 oz
Rold Gold Pretzels 1.5 oz
Ruffles Cheddar and Sour Cream 1.0 oz
Doritos Cool Ranch 1.0 oz
Cheetos 1.1 ox
Empty
Empty
Empty
Empty
Empty
Cheez-It 1.5 oz
Cheez-It 1.5 oz
Linden Choc. Chip Cookies 1.75 oz
Linden Choc. Chip Cookies 1.75 oz
Strawberry Frosted Pop Tarts 3.7 oz
Empty
Empty
Empty
Empty
Empty
Empty
Empty
Linden Choc. Chip Cookies 1.75 oz
Linden Choc. Chip Cookies 1.75 oz
Empty
Empty
Empty
Empty
Empty
Empty
Peanut M&Ms 1.6 oz
LD Choc. Cookie Cream Pie 1.3 oz
LD Choc. Chip Cookie Cream Pie 1.3 oz
LD Choc. Cookie Cream Pie 1.3 oz
LD Oatmeal Cream Pie 1.3 oz
LD Donut Log 1.66 oz
LD Stars & Stripes 2.4 oz
LD Brownies 2.2 oz
LD Stars & Stripes 2.4 oz
LD Brownies 2.2 oz
Combos Pizzeria 1.8 oz
Combos Nacho Cheese 1.8 oz
Combos Cheddar 1.8 oz
Doritos Cool Ranch 1.0 oz
Ruffles Cheddar and Sour Cream 1.0 oz
Empty
Empty
Empty
Empty
Empty
Source: Data collected during site visit conducted May 27-29, 2003. Due to variation in snack selection over the three-day period, inventory was randomly
sampled from Thursday, May 29, 2003. LD = Little Debbie; oz = ounce.
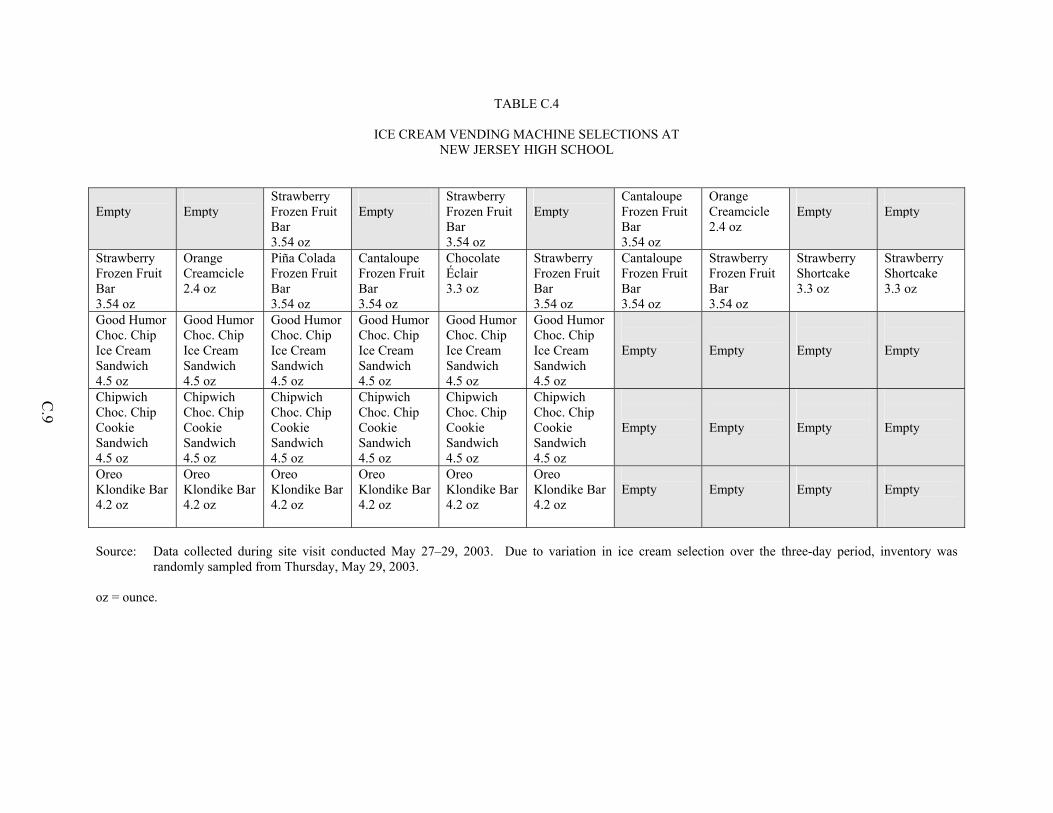
C.9
TABLE C.4
ICE CREAM VENDING MACHINE SELECTIONS AT NEW JERSEY HIGH SCHOOL
Empty
Empty
Strawberry Frozen Fruit Bar 3.54 oz
Empty
Strawberry Frozen Fruit Bar 3.54 oz
Empty
Cantaloupe Frozen Fruit Bar 3.54 oz
Orange Creamcicle 2.4 oz
Empty
Empty
Strawberry Frozen Fruit Bar 3.54 oz
Orange Creamcicle 2.4 oz
Piña Colada Frozen Fruit Bar 3.54 oz
Cantaloupe Frozen Fruit Bar 3.54 oz
Chocolate Éclair 3.3 oz
Strawberry Frozen Fruit Bar 3.54 oz
Cantaloupe Frozen Fruit Bar 3.54 oz
Strawberry Frozen Fruit Bar 3.54 oz
Strawberry Shortcake 3.3 oz
Strawberry Shortcake 3.3 oz
Good Humor Choc. Chip Ice Cream Sandwich 4.5 oz
Good Humor Choc. Chip Ice Cream Sandwich 4.5 oz
Good Humor Choc. Chip Ice Cream Sandwich 4.5 oz
Good Humor Choc. Chip Ice Cream Sandwich 4.5 oz
Good Humor Choc. Chip Ice Cream Sandwich 4.5 oz
Good Humor Choc. Chip Ice Cream Sandwich 4.5 oz
Empty
Empty
Empty
Empty
Chipwich Choc. Chip Cookie Sandwich 4.5 oz
Chipwich Choc. Chip Cookie Sandwich 4.5 oz
Chipwich Choc. Chip Cookie Sandwich 4.5 oz
Chipwich Choc. Chip Cookie Sandwich 4.5 oz
Chipwich Choc. Chip Cookie Sandwich 4.5 oz
Chipwich Choc. Chip Cookie Sandwich 4.5 oz
Empty
Empty
Empty
Empty
Oreo Klondike Bar 4.2 oz
Oreo Klondike Bar 4.2 oz
Oreo Klondike Bar 4.2 oz
Oreo Klondike Bar 4.2 oz
Oreo Klondike Bar 4.2 oz
Oreo Klondike Bar 4.2 oz
Empty
Empty
Empty
Empty
Source: Data collected during site visit conducted May 27–29, 2003. Due to variation in ice cream selection over the three-day period, inventory was
randomly sampled from Thursday, May 29, 2003. oz = ounce.
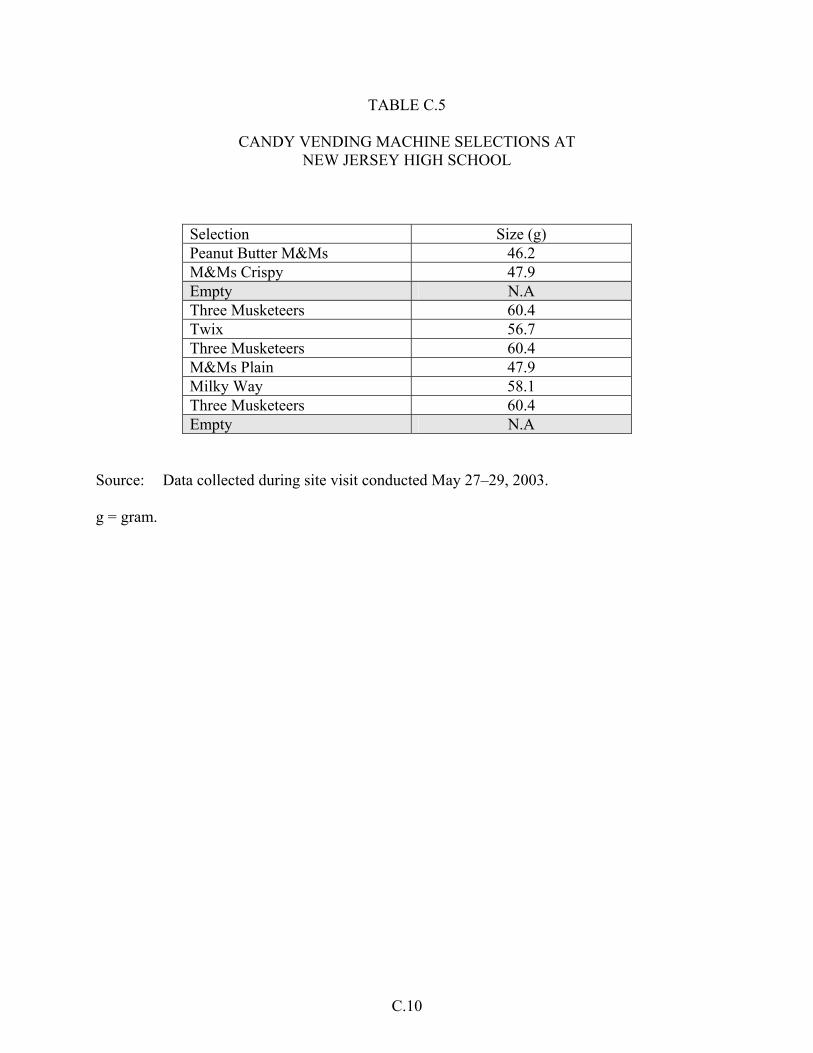
C.10
TABLE C.5
CANDY VENDING MACHINE SELECTIONS AT NEW JERSEY HIGH SCHOOL
Selection Size (g) Peanut Butter M&Ms 46.2 M&Ms Crispy 47.9 Empty N.A Three Musketeers 60.4 Twix 56.7 Three Musketeers 60.4 M&Ms Plain 47.9 Milky Way 58.1 Three Musketeers 60.4 Empty N.A
Source: Data collected during site visit conducted May 27–29, 2003. g = gram.
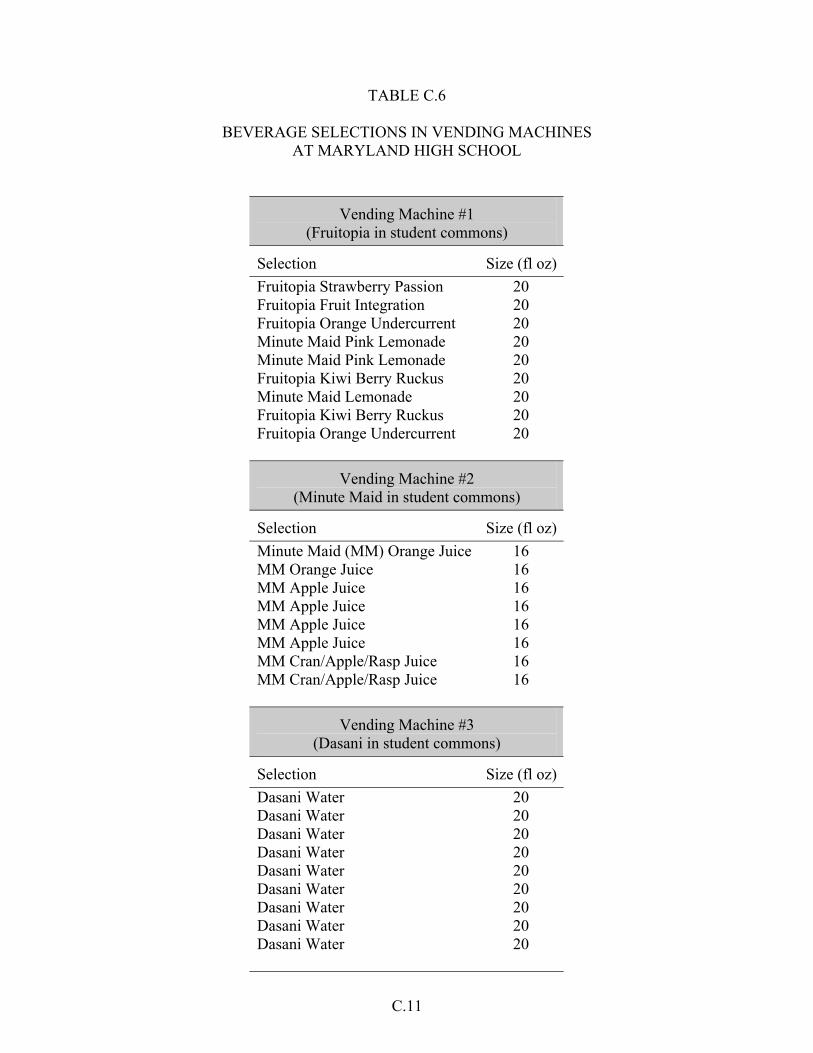
C.11
TABLE C.6
BEVERAGE SELECTIONS IN VENDING MACHINES AT MARYLAND HIGH SCHOOL
Vending Machine #1 (Fruitopia in student commons)
Selection Size (fl oz)Fruitopia Strawberry Passion 20 Fruitopia Fruit Integration 20 Fruitopia Orange Undercurrent 20 Minute Maid Pink Lemonade 20 Minute Maid Pink Lemonade 20 Fruitopia Kiwi Berry Ruckus 20 Minute Maid Lemonade 20 Fruitopia Kiwi Berry Ruckus 20 Fruitopia Orange Undercurrent 20
Vending Machine #2 (Minute Maid in student commons)
Selection Size (fl oz)Minute Maid (MM) Orange Juice 16 MM Orange Juice 16 MM Apple Juice 16 MM Apple Juice 16 MM Apple Juice 16 MM Apple Juice 16 MM Cran/Apple/Rasp Juice 16 MM Cran/Apple/Rasp Juice 16
Vending Machine #3 (Dasani in student commons)
Selection Size (fl oz)Dasani Water 20 Dasani Water 20 Dasani Water 20 Dasani Water 20 Dasani Water 20 Dasani Water 20 Dasani Water 20 Dasani Water 20 Dasani Water 20
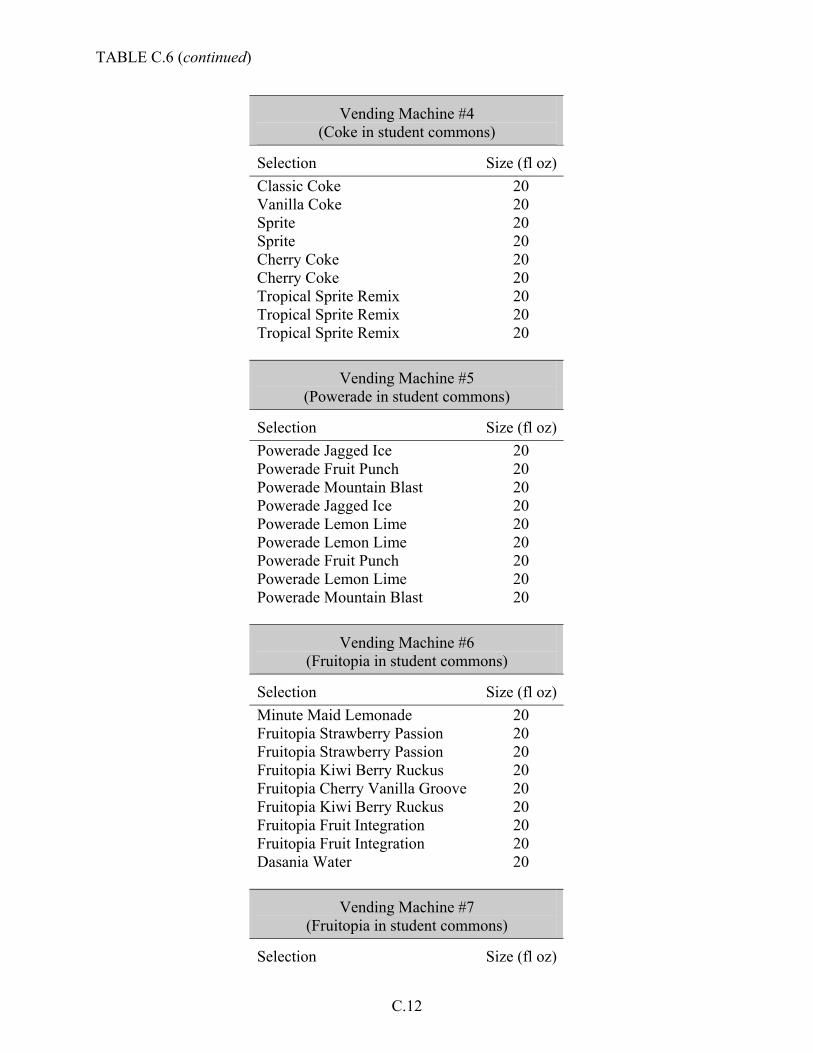
TABLE C.6 (continued)
C.12
Vending Machine #4 (Coke in student commons)
Selection Size (fl oz)Classic Coke 20 Vanilla Coke 20 Sprite 20 Sprite 20 Cherry Coke 20 Cherry Coke 20 Tropical Sprite Remix 20 Tropical Sprite Remix 20 Tropical Sprite Remix 20
Vending Machine #5 (Powerade in student commons)
Selection Size (fl oz)Powerade Jagged Ice 20 Powerade Fruit Punch 20 Powerade Mountain Blast 20 Powerade Jagged Ice 20 Powerade Lemon Lime 20 Powerade Lemon Lime 20 Powerade Fruit Punch 20 Powerade Lemon Lime 20 Powerade Mountain Blast 20
Vending Machine #6 (Fruitopia in student commons)
Selection Size (fl oz)Minute Maid Lemonade 20 Fruitopia Strawberry Passion 20 Fruitopia Strawberry Passion 20 Fruitopia Kiwi Berry Ruckus 20 Fruitopia Cherry Vanilla Groove 20 Fruitopia Kiwi Berry Ruckus 20 Fruitopia Fruit Integration 20 Fruitopia Fruit Integration 20 Dasania Water 20
Vending Machine #7 (Fruitopia in student commons)
Selection Size (fl oz)
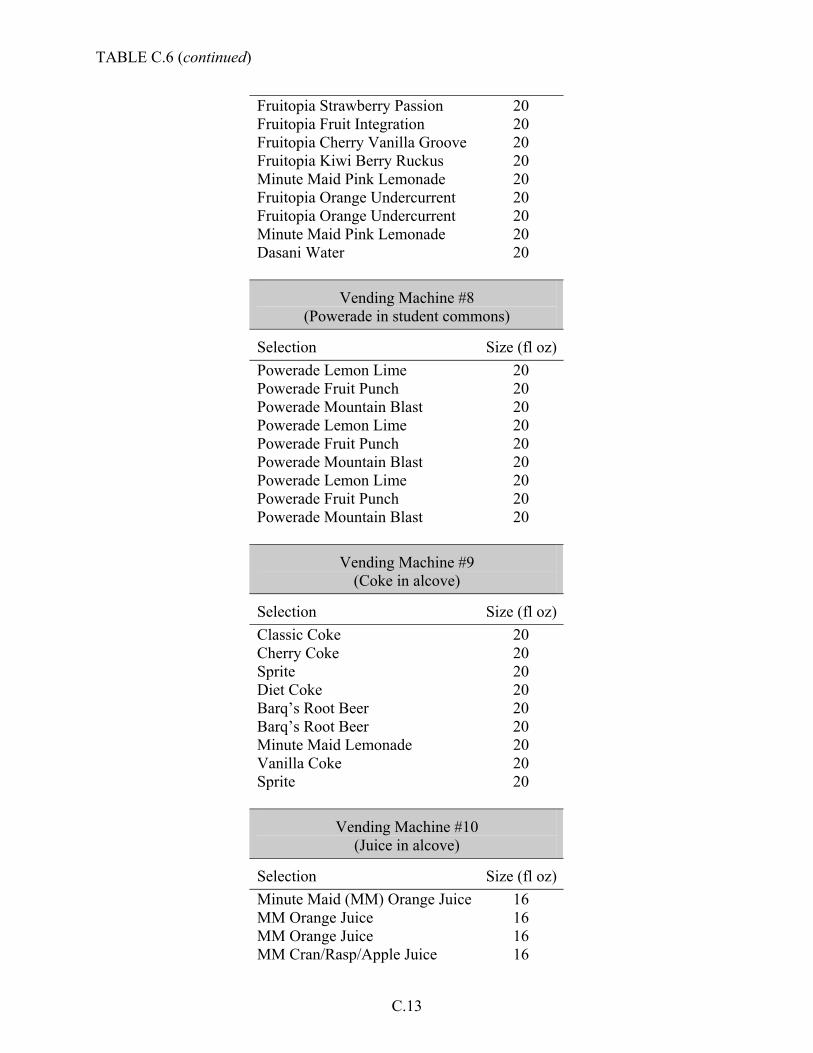
TABLE C.6 (continued)
C.13
Fruitopia Strawberry Passion 20 Fruitopia Fruit Integration 20 Fruitopia Cherry Vanilla Groove 20 Fruitopia Kiwi Berry Ruckus 20 Minute Maid Pink Lemonade 20 Fruitopia Orange Undercurrent 20 Fruitopia Orange Undercurrent 20 Minute Maid Pink Lemonade 20 Dasani Water 20
Vending Machine #8 (Powerade in student commons)
Selection Size (fl oz)Powerade Lemon Lime 20 Powerade Fruit Punch 20 Powerade Mountain Blast 20 Powerade Lemon Lime 20 Powerade Fruit Punch 20 Powerade Mountain Blast 20 Powerade Lemon Lime 20 Powerade Fruit Punch 20 Powerade Mountain Blast 20
Vending Machine #9 (Coke in alcove)
Selection Size (fl oz)Classic Coke 20 Cherry Coke 20 Sprite 20 Diet Coke 20 Barq’s Root Beer 20 Barq’s Root Beer 20 Minute Maid Lemonade 20 Vanilla Coke 20 Sprite 20
Vending Machine #10 (Juice in alcove)
Selection Size (fl oz)Minute Maid (MM) Orange Juice 16 MM Orange Juice 16 MM Orange Juice 16 MM Cran/Rasp/Apple Juice 16
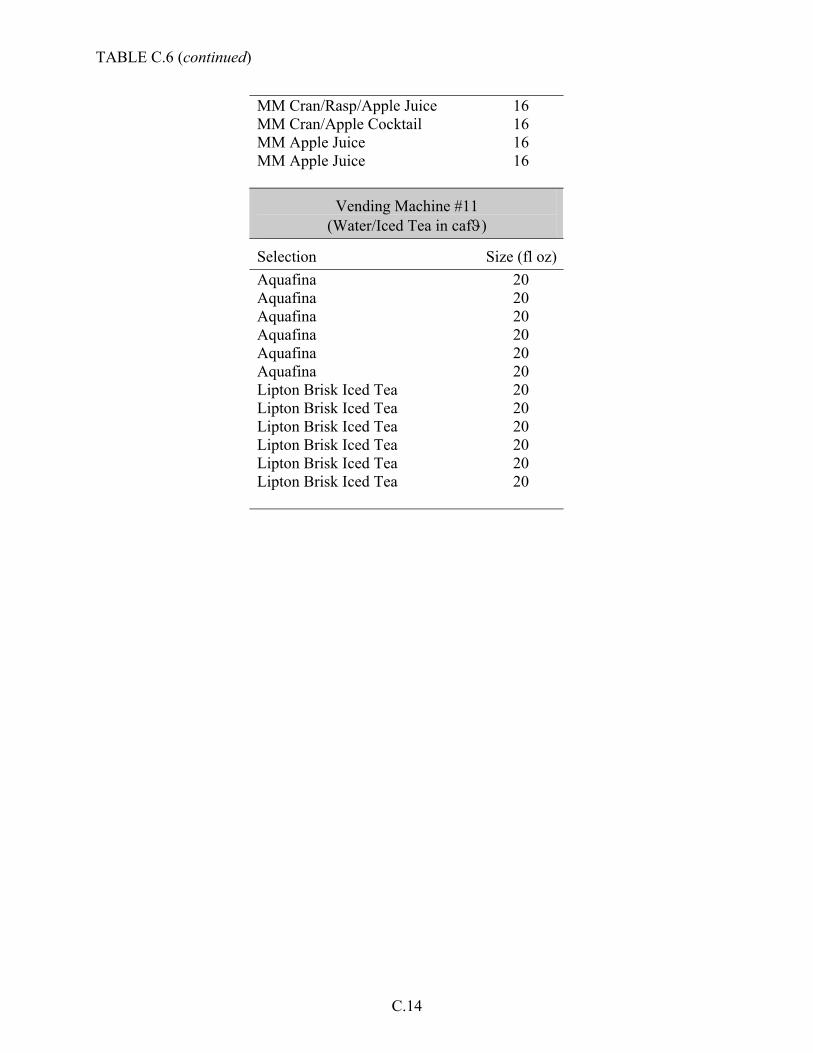
TABLE C.6 (continued)
C.14
MM Cran/Rasp/Apple Juice 16 MM Cran/Apple Cocktail 16 MM Apple Juice 16 MM Apple Juice 16
Vending Machine #11 (Water/Iced Tea in cafϑ)
Selection Size (fl oz)Aquafina 20 Aquafina 20 Aquafina 20 Aquafina 20 Aquafina 20 Aquafina 20 Lipton Brisk Iced Tea 20 Lipton Brisk Iced Tea 20 Lipton Brisk Iced Tea 20 Lipton Brisk Iced Tea 20 Lipton Brisk Iced Tea 20 Lipton Brisk Iced Tea 20
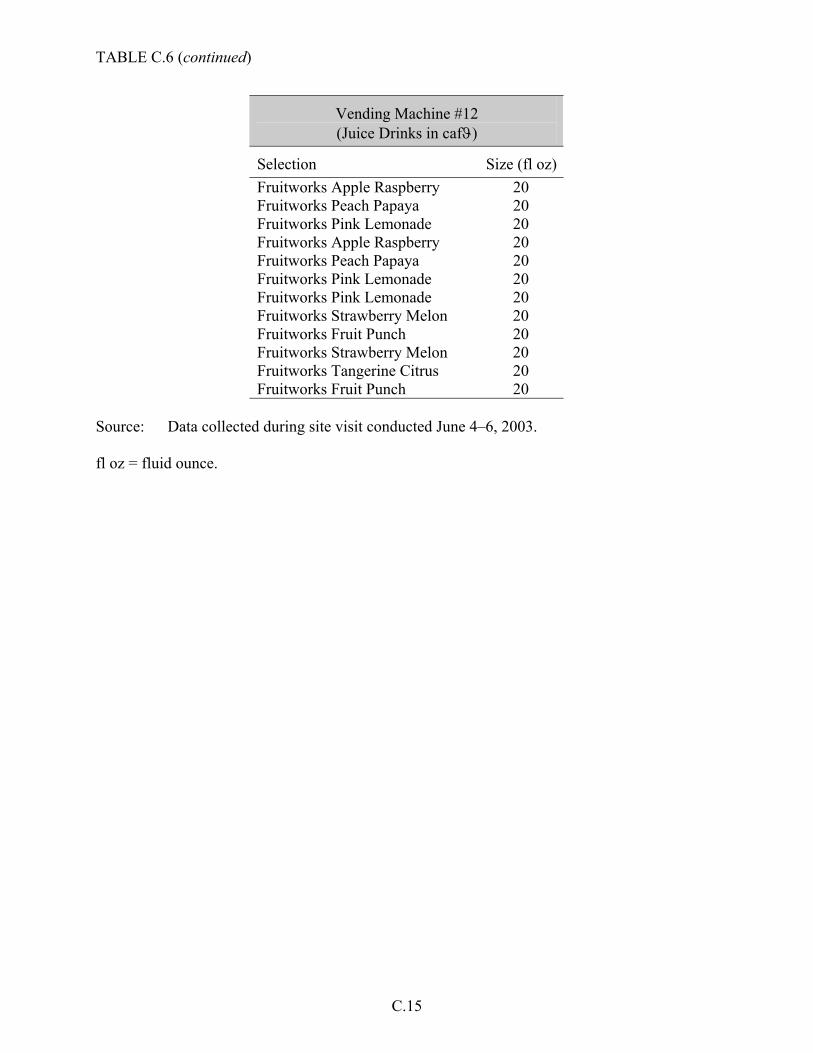
TABLE C.6 (continued)
C.15
Vending Machine #12 (Juice Drinks in cafϑ)
Selection Size (fl oz)Fruitworks Apple Raspberry 20 Fruitworks Peach Papaya 20 Fruitworks Pink Lemonade 20 Fruitworks Apple Raspberry 20 Fruitworks Peach Papaya 20 Fruitworks Pink Lemonade 20 Fruitworks Pink Lemonade 20 Fruitworks Strawberry Melon 20 Fruitworks Fruit Punch 20 Fruitworks Strawberry Melon 20 Fruitworks Tangerine Citrus 20 Fruitworks Fruit Punch 20
Source: Data collected during site visit conducted June 4–6, 2003. fl oz = fluid ounce.
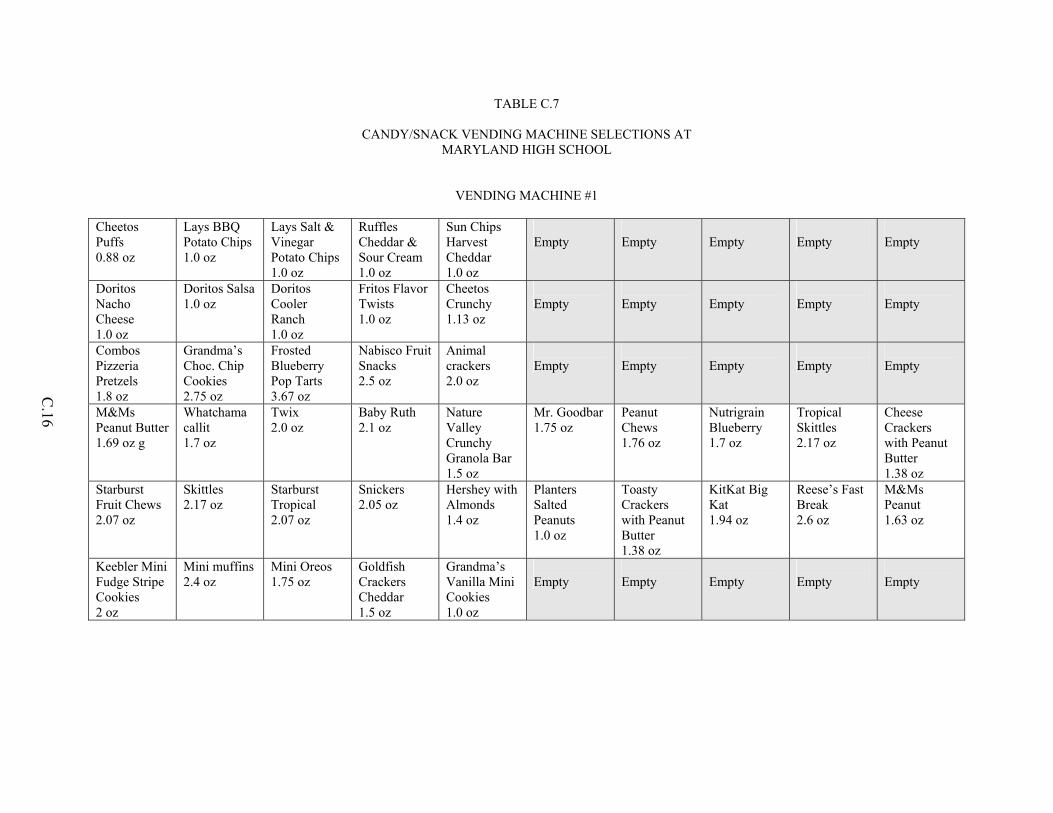
C.16
TABLE C.7
CANDY/SNACK VENDING MACHINE SELECTIONS AT MARYLAND HIGH SCHOOL
VENDING MACHINE #1 Cheetos Puffs 0.88 oz
Lays BBQ Potato Chips 1.0 oz
Lays Salt & Vinegar Potato Chips 1.0 oz
Ruffles Cheddar & Sour Cream 1.0 oz
Sun Chips Harvest Cheddar 1.0 oz
Empty
Empty
Empty
Empty
Empty
Doritos Nacho Cheese 1.0 oz
Doritos Salsa 1.0 oz
Doritos Cooler Ranch 1.0 oz
Fritos Flavor Twists 1.0 oz
Cheetos Crunchy 1.13 oz
Empty
Empty
Empty
Empty
Empty
Combos Pizzeria Pretzels 1.8 oz
Grandma’s Choc. Chip Cookies 2.75 oz
Frosted Blueberry Pop Tarts 3.67 oz
Nabisco Fruit Snacks 2.5 oz
Animal crackers 2.0 oz
Empty
Empty
Empty
Empty
Empty
M&Ms Peanut Butter 1.69 oz g
Whatchama callit 1.7 oz
Twix 2.0 oz
Baby Ruth 2.1 oz
Nature Valley Crunchy Granola Bar 1.5 oz
Mr. Goodbar 1.75 oz
Peanut Chews 1.76 oz
Nutrigrain Blueberry 1.7 oz
Tropical Skittles 2.17 oz
Cheese Crackers with Peanut Butter 1.38 oz
Starburst Fruit Chews 2.07 oz
Skittles 2.17 oz
Starburst Tropical 2.07 oz
Snickers 2.05 oz
Hershey with Almonds 1.4 oz
Planters Salted Peanuts 1.0 oz
Toasty Crackers with Peanut Butter 1.38 oz
KitKat Big Kat 1.94 oz
Reese’s Fast Break 2.6 oz
M&Ms Peanut 1.63 oz
Keebler Mini Fudge Stripe Cookies 2 oz
Mini muffins 2.4 oz
Mini Oreos 1.75 oz
Goldfish Crackers Cheddar 1.5 oz
Grandma’s Vanilla Mini Cookies 1.0 oz
Empty
Empty
Empty
Empty
Empty
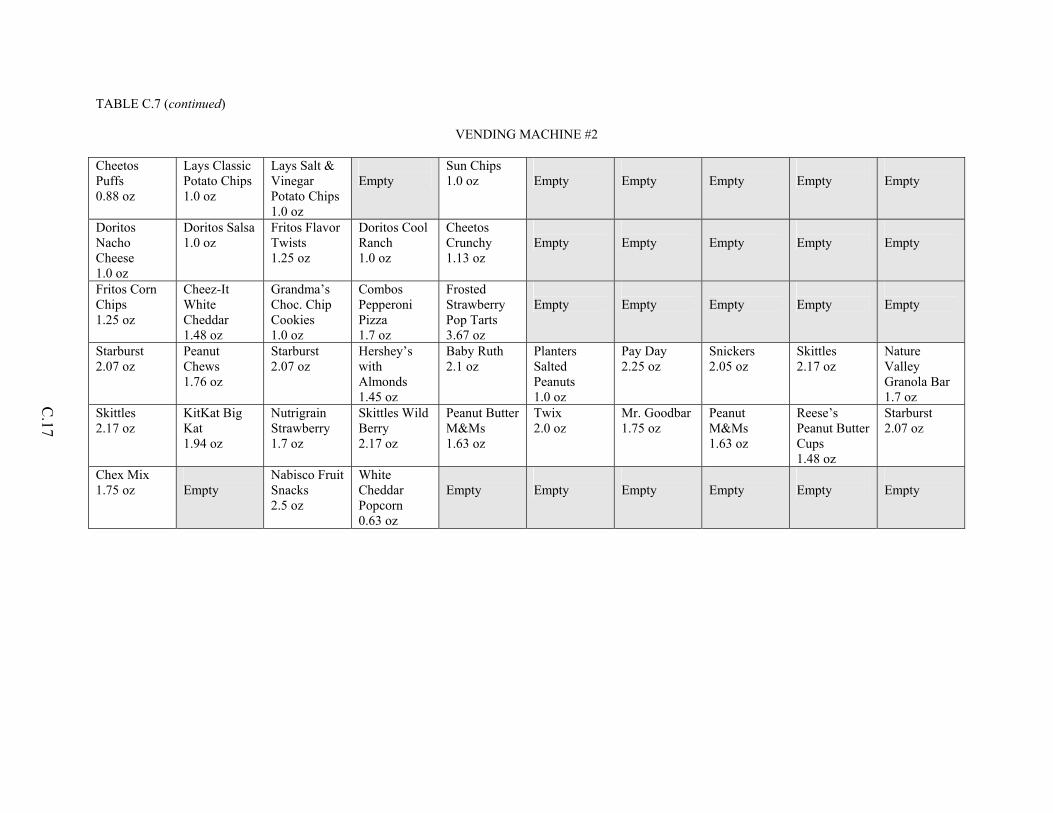
TABLE C.7 (continued)
C.17
VENDING MACHINE #2
Cheetos Puffs 0.88 oz
Lays Classic Potato Chips 1.0 oz
Lays Salt & Vinegar Potato Chips 1.0 oz
Empty
Sun Chips 1.0 oz
Empty
Empty
Empty
Empty
Empty
Doritos Nacho Cheese 1.0 oz
Doritos Salsa 1.0 oz
Fritos Flavor Twists 1.25 oz
Doritos Cool Ranch 1.0 oz
Cheetos Crunchy 1.13 oz
Empty
Empty
Empty
Empty
Empty
Fritos Corn Chips 1.25 oz
Cheez-It White Cheddar 1.48 oz
Grandma’s Choc. Chip Cookies 1.0 oz
Combos Pepperoni Pizza 1.7 oz
Frosted Strawberry Pop Tarts 3.67 oz
Empty
Empty
Empty
Empty
Empty
Starburst 2.07 oz
Peanut Chews 1.76 oz
Starburst 2.07 oz
Hershey’s with Almonds 1.45 oz
Baby Ruth 2.1 oz
Planters Salted Peanuts 1.0 oz
Pay Day 2.25 oz
Snickers 2.05 oz
Skittles 2.17 oz
Nature Valley Granola Bar 1.7 oz
Skittles 2.17 oz
KitKat Big Kat 1.94 oz
Nutrigrain Strawberry 1.7 oz
Skittles Wild Berry 2.17 oz
Peanut Butter M&Ms 1.63 oz
Twix 2.0 oz
Mr. Goodbar 1.75 oz
Peanut M&Ms 1.63 oz
Reese’s Peanut Butter Cups 1.48 oz
Starburst 2.07 oz
Chex Mix 1.75 oz
Empty
Nabisco Fruit Snacks 2.5 oz
White Cheddar Popcorn 0.63 oz
Empty
Empty
Empty
Empty
Empty
Empty
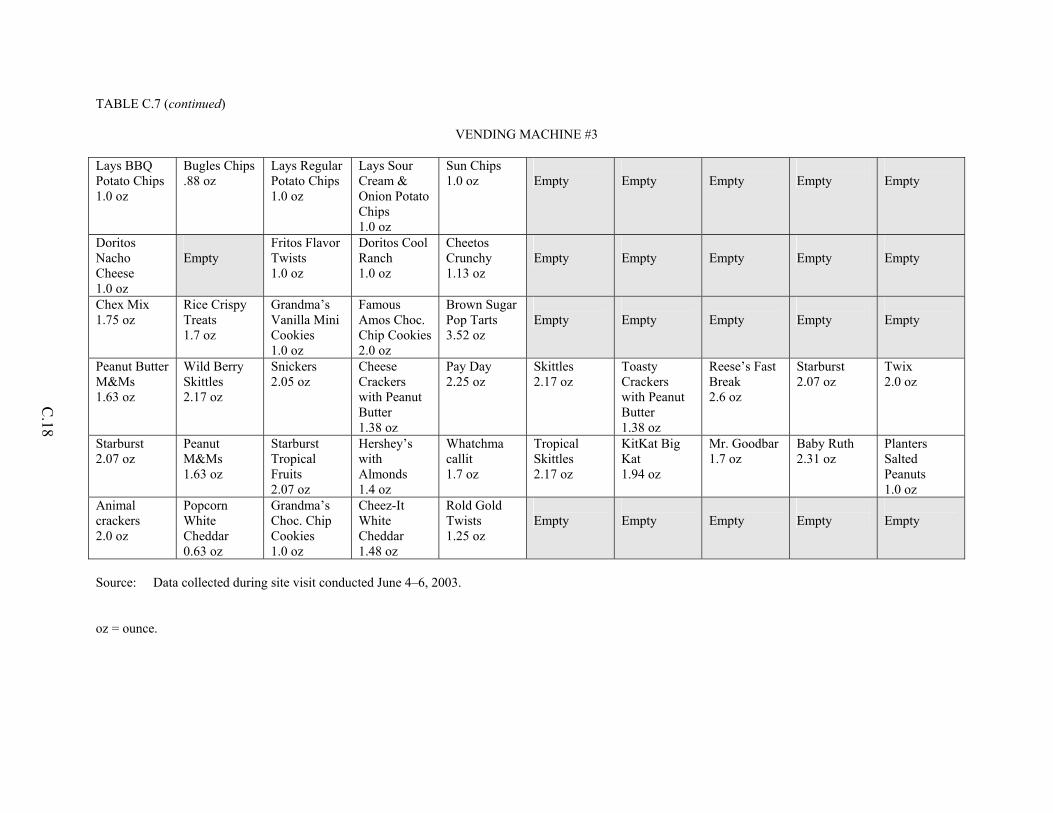
TABLE C.7 (continued)
C.18
VENDING MACHINE #3 Lays BBQ Potato Chips 1.0 oz
Bugles Chips .88 oz
Lays Regular Potato Chips 1.0 oz
Lays Sour Cream & Onion Potato Chips 1.0 oz
Sun Chips 1.0 oz
Empty
Empty
Empty
Empty
Empty
Doritos Nacho Cheese 1.0 oz
Empty
Fritos Flavor Twists 1.0 oz
Doritos Cool Ranch 1.0 oz
Cheetos Crunchy 1.13 oz
Empty
Empty
Empty
Empty
Empty
Chex Mix 1.75 oz
Rice Crispy Treats 1.7 oz
Grandma’s Vanilla Mini Cookies 1.0 oz
Famous Amos Choc. Chip Cookies 2.0 oz
Brown Sugar Pop Tarts 3.52 oz
Empty
Empty
Empty
Empty
Empty
Peanut Butter M&Ms 1.63 oz
Wild Berry Skittles 2.17 oz
Snickers 2.05 oz
Cheese Crackers with Peanut Butter 1.38 oz
Pay Day 2.25 oz
Skittles 2.17 oz
Toasty Crackers with Peanut Butter 1.38 oz
Reese’s Fast Break 2.6 oz
Starburst 2.07 oz
Twix 2.0 oz
Starburst 2.07 oz
Peanut M&Ms 1.63 oz
Starburst Tropical Fruits 2.07 oz
Hershey’s with Almonds 1.4 oz
Whatchma callit 1.7 oz
Tropical Skittles 2.17 oz
KitKat Big Kat 1.94 oz
Mr. Goodbar 1.7 oz
Baby Ruth 2.31 oz
Planters Salted Peanuts 1.0 oz
Animal crackers 2.0 oz
Popcorn White Cheddar 0.63 oz
Grandma’s Choc. Chip Cookies 1.0 oz
Cheez-It White Cheddar 1.48 oz
Rold Gold Twists 1.25 oz
Empty
Empty
Empty
Empty
Empty
Source: Data collected during site visit conducted June 4–6, 2003. oz = ounce.
APPENDIX D
À LA CARTE FOOD AND BEVERAGE ITEMS OFFERED IN CAFETERIA LINES
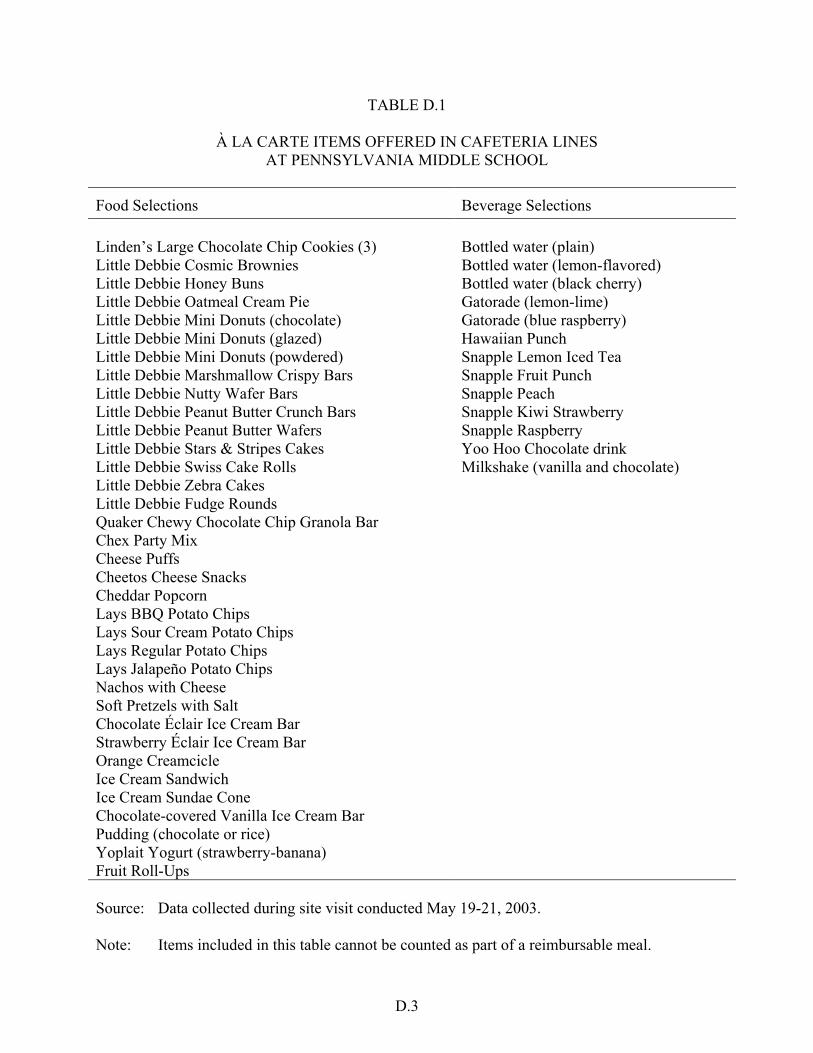
D.3
TABLE D.1
À LA CARTE ITEMS OFFERED IN CAFETERIA LINES AT PENNSYLVANIA MIDDLE SCHOOL
Food Selections Beverage Selections Linden’s Large Chocolate Chip Cookies (3)
Bottled water (plain)
Little Debbie Cosmic Brownies Bottled water (lemon-flavored) Little Debbie Honey Buns Bottled water (black cherry) Little Debbie Oatmeal Cream Pie Gatorade (lemon-lime) Little Debbie Mini Donuts (chocolate) Gatorade (blue raspberry) Little Debbie Mini Donuts (glazed) Hawaiian Punch Little Debbie Mini Donuts (powdered) Snapple Lemon Iced Tea Little Debbie Marshmallow Crispy Bars Snapple Fruit Punch Little Debbie Nutty Wafer Bars Snapple Peach Little Debbie Peanut Butter Crunch Bars Snapple Kiwi Strawberry Little Debbie Peanut Butter Wafers Snapple Raspberry Little Debbie Stars & Stripes Cakes Yoo Hoo Chocolate drink Little Debbie Swiss Cake Rolls Milkshake (vanilla and chocolate) Little Debbie Zebra Cakes Little Debbie Fudge Rounds Quaker Chewy Chocolate Chip Granola Bar Chex Party Mix Cheese Puffs Cheetos Cheese Snacks Cheddar Popcorn Lays BBQ Potato Chips Lays Sour Cream Potato Chips Lays Regular Potato Chips Lays Jalapeño Potato Chips Nachos with Cheese Soft Pretzels with Salt Chocolate Éclair Ice Cream Bar Strawberry Éclair Ice Cream Bar Orange Creamcicle Ice Cream Sandwich Ice Cream Sundae Cone Chocolate-covered Vanilla Ice Cream Bar Pudding (chocolate or rice) Yoplait Yogurt (strawberry-banana) Fruit Roll-Ups
Source: Data collected during site visit conducted May 19-21, 2003. Note: Items included in this table cannot be counted as part of a reimbursable meal.
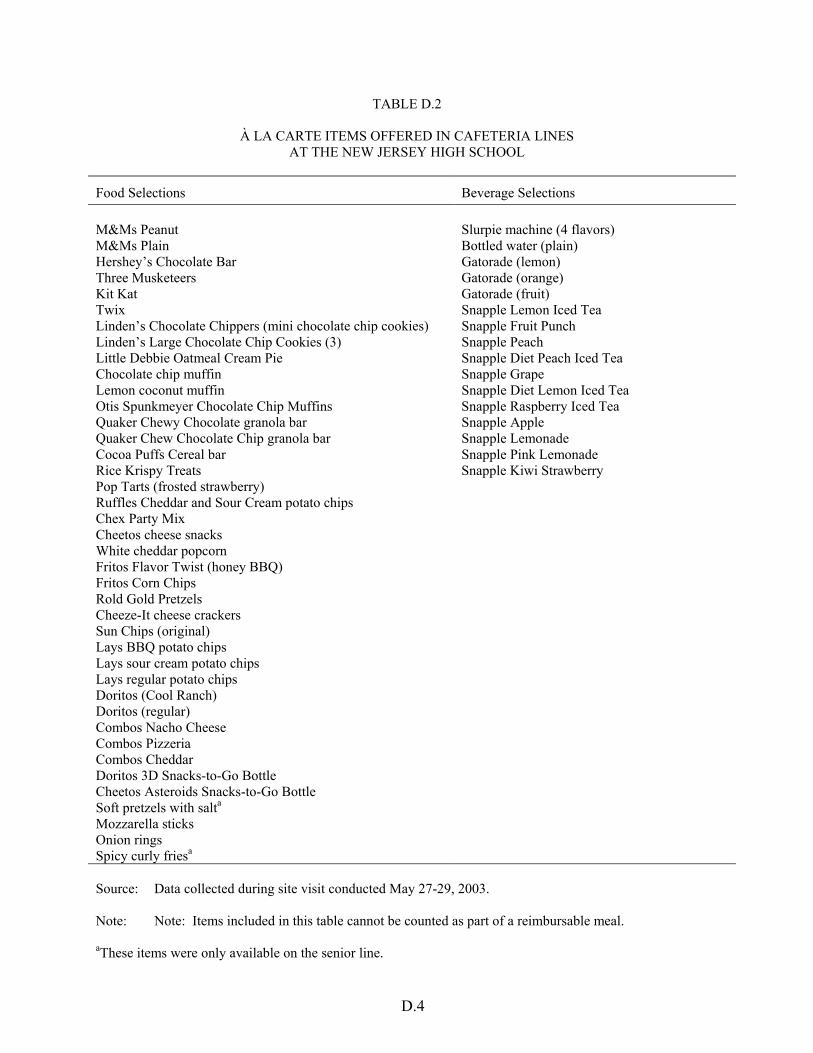
D.4
TABLE D.2
À LA CARTE ITEMS OFFERED IN CAFETERIA LINES AT THE NEW JERSEY HIGH SCHOOL
Food Selections Beverage Selections M&Ms Peanut
Slurpie machine (4 flavors)
M&Ms Plain Bottled water (plain) Hershey’s Chocolate Bar Gatorade (lemon) Three Musketeers Gatorade (orange) Kit Kat Gatorade (fruit) Twix Snapple Lemon Iced Tea Linden’s Chocolate Chippers (mini chocolate chip cookies) Snapple Fruit Punch Linden’s Large Chocolate Chip Cookies (3) Snapple Peach Little Debbie Oatmeal Cream Pie Snapple Diet Peach Iced Tea Chocolate chip muffin Snapple Grape Lemon coconut muffin Snapple Diet Lemon Iced Tea Otis Spunkmeyer Chocolate Chip Muffins Snapple Raspberry Iced Tea Quaker Chewy Chocolate granola bar Snapple Apple Quaker Chew Chocolate Chip granola bar Snapple Lemonade Cocoa Puffs Cereal bar Snapple Pink Lemonade Rice Krispy Treats Snapple Kiwi Strawberry Pop Tarts (frosted strawberry) Ruffles Cheddar and Sour Cream potato chips Chex Party Mix Cheetos cheese snacks White cheddar popcorn Fritos Flavor Twist (honey BBQ) Fritos Corn Chips Rold Gold Pretzels Cheeze-It cheese crackers Sun Chips (original) Lays BBQ potato chips Lays sour cream potato chips Lays regular potato chips Doritos (Cool Ranch) Doritos (regular) Combos Nacho Cheese Combos Pizzeria Combos Cheddar Doritos 3D Snacks-to-Go Bottle Cheetos Asteroids Snacks-to-Go Bottle Soft pretzels with salta Mozzarella sticks Onion rings Spicy curly friesa
Source: Data collected during site visit conducted May 27-29, 2003. Note: Note: Items included in this table cannot be counted as part of a reimbursable meal. aThese items were only available on the senior line.
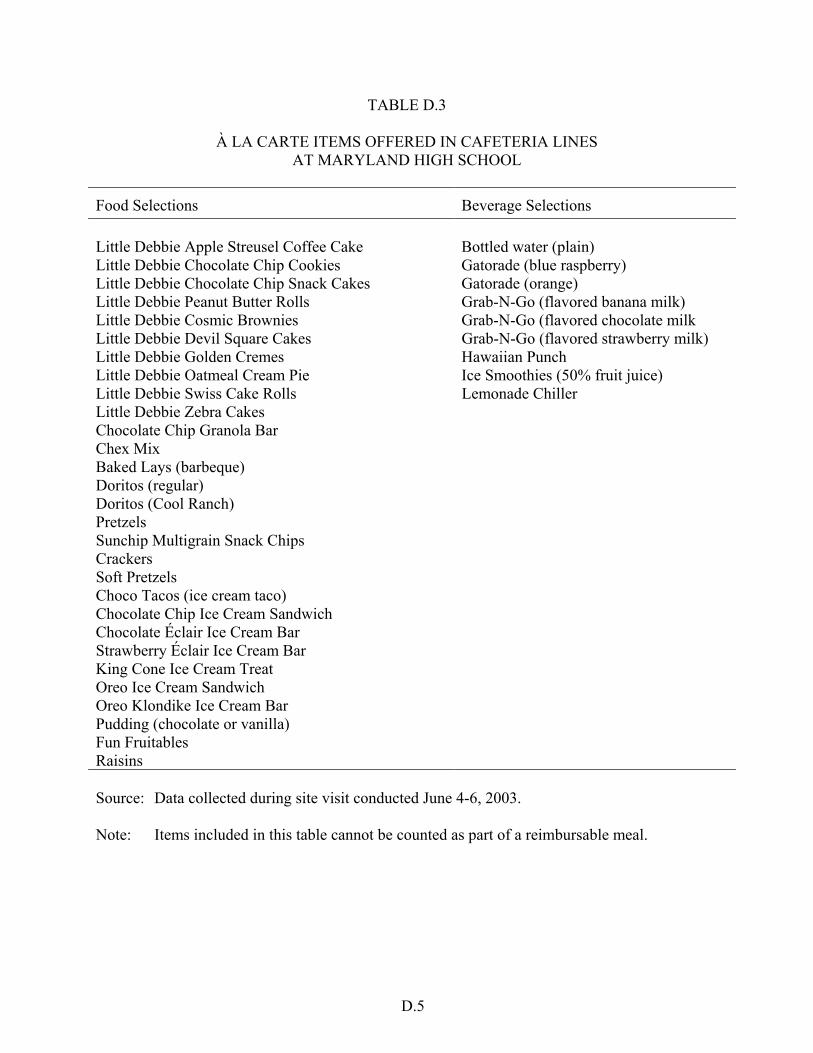
D.5
TABLE D.3
À LA CARTE ITEMS OFFERED IN CAFETERIA LINES AT MARYLAND HIGH SCHOOL
Food Selections Beverage Selections Little Debbie Apple Streusel Coffee Cake
Bottled water (plain)
Little Debbie Chocolate Chip Cookies Gatorade (blue raspberry) Little Debbie Chocolate Chip Snack Cakes Gatorade (orange) Little Debbie Peanut Butter Rolls Grab-N-Go (flavored banana milk) Little Debbie Cosmic Brownies Grab-N-Go (flavored chocolate milk Little Debbie Devil Square Cakes Grab-N-Go (flavored strawberry milk) Little Debbie Golden Cremes Hawaiian Punch Little Debbie Oatmeal Cream Pie Ice Smoothies (50% fruit juice) Little Debbie Swiss Cake Rolls Lemonade Chiller Little Debbie Zebra Cakes Chocolate Chip Granola Bar Chex Mix Baked Lays (barbeque) Doritos (regular) Doritos (Cool Ranch) Pretzels Sunchip Multigrain Snack Chips Crackers Soft Pretzels Choco Tacos (ice cream taco) Chocolate Chip Ice Cream Sandwich Chocolate Éclair Ice Cream Bar Strawberry Éclair Ice Cream Bar King Cone Ice Cream Treat Oreo Ice Cream Sandwich Oreo Klondike Ice Cream Bar Pudding (chocolate or vanilla) Fun Fruitables Raisins
Source: Data collected during site visit conducted June 4-6, 2003. Note: Items included in this table cannot be counted as part of a reimbursable meal.