Embed Size (px)
Citation preview
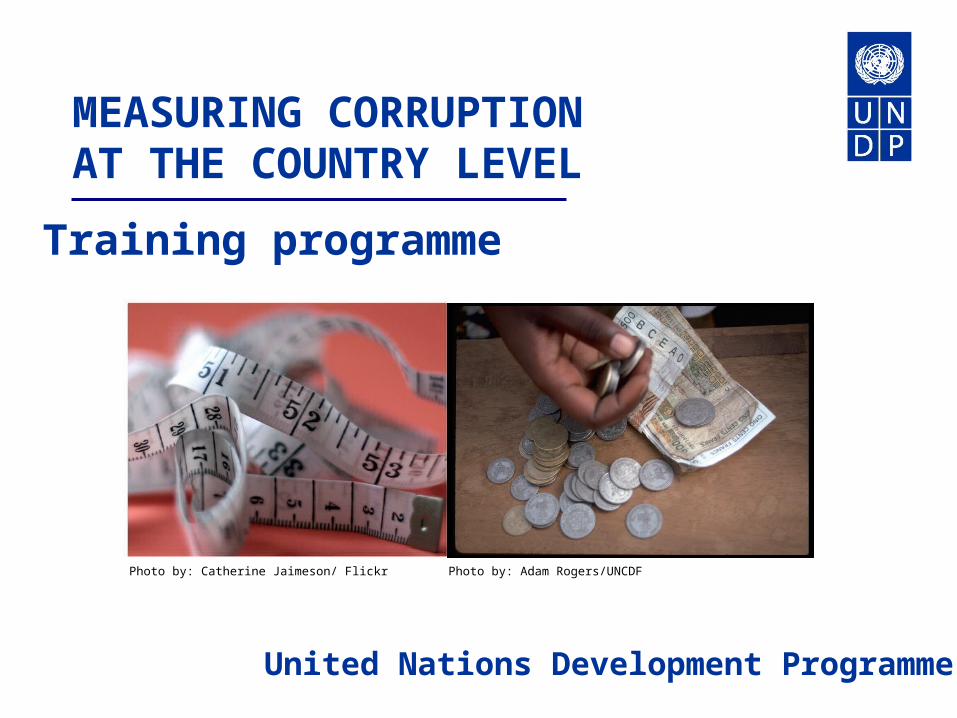
MEASURING CORRUPTION AT THE COUNTRY LEVEL
United Nations Development Programme
Training programme
Photo by: Adam Rogers/UNCDFPhoto by: Catherine Jaimeson/ Flickr

•Contrast how different global composite indicators define and measure corruption
•Examine the strengths and limitations of composite and original indicators
•Identify data that is ‘actionable’
•Identify at least 4 ways in which indicators can be made pro-poor and gender sensitive
What we will cover this afternoon
•Weigh up the advantages and disadvantages of using perception and experience-based data
•Explain the rationale for using complementary indicators (input vs. outcome – de jure vs. de facto)
•Distinguish the distinct purposes of various assessment tools
•Introduce a web-based ‘toolbox’ of ready-made corruption assessment methodologies
What we will cover this afternoon
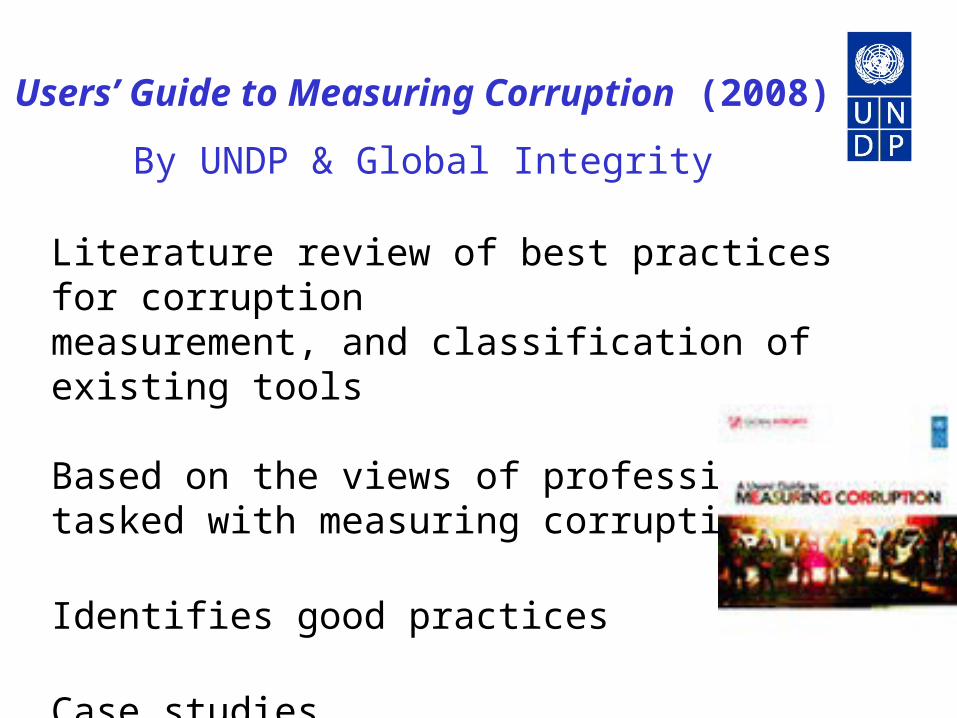
Users’ Guide to Measuring Corruption (2008)
By UNDP & Global IntegrityLiterature review of best practices for corruption measurement, and classification of existing tools
Based on the views of professionals tasked with measuring corruption
Identifies good practices
Case studies
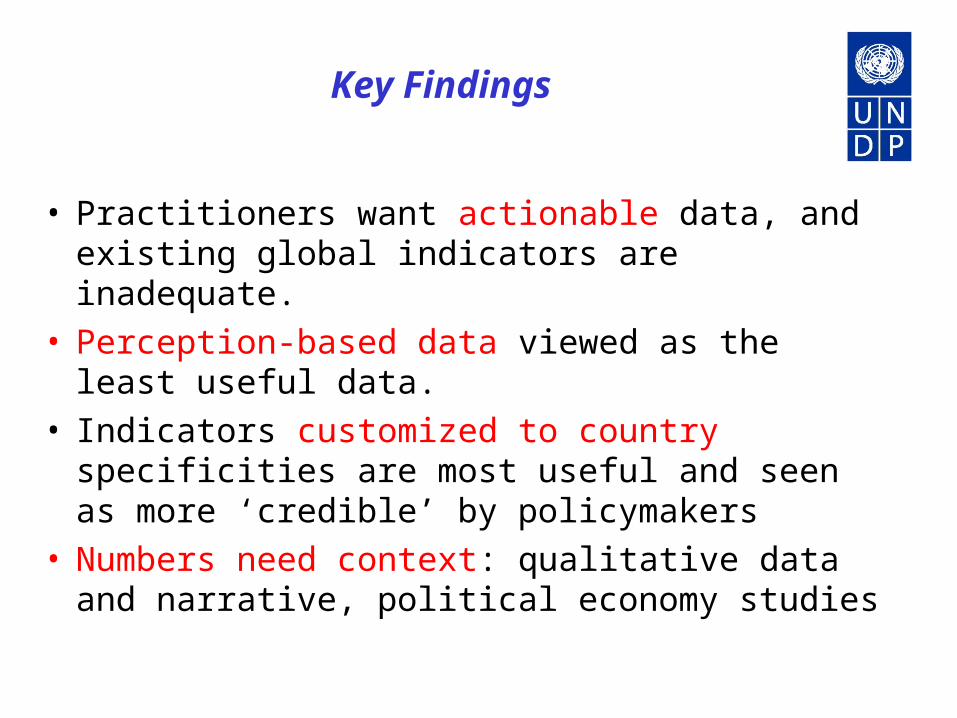
Key Findings
• Practitioners want actionable data, and existing global indicators are inadequate.
• Perception-based data viewed as the least useful data.
• Indicators customized to country specificities are most useful and seen as more ‘credible’ by policymakers
• Numbers need context: qualitative data and narrative, political economy studies

Part OneInternational sources of corruption Indicators
Photo by: Konomiho/flickr.

What are international corruption indicators used for?
1. Ranking countries & tracking changes over time is being used in order to:
• Name and shame governments and actors seen to be the worst corruption offenders
• Praise good performers and promote a virtuous
cycle of competition
• Inform decisions about aid allocations
• Inform investment decisions
Photo by: takeabreak/flickr
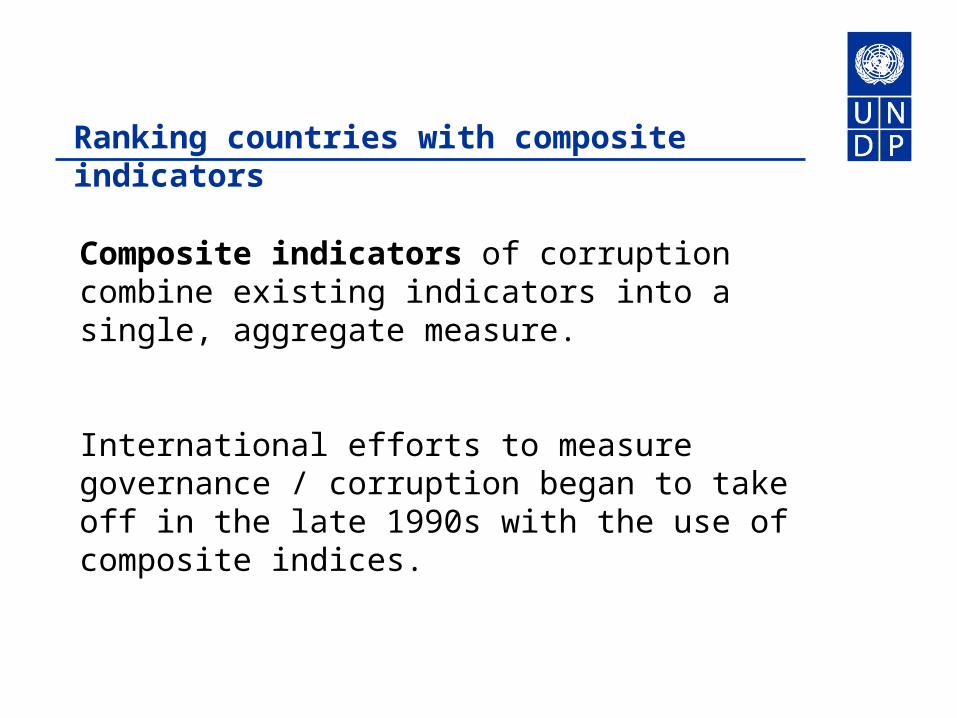
Ranking countries with composite indicators
Composite indicators of corruption combine existing indicators into a single, aggregate measure.
International efforts to measure governance / corruption began to take off in the late 1990s with the use of composite indices.

The mushrooming industry of indicators
80 90888682 84 96 98 00 02 0492 94 06
International Country Risk Guide
Corruption Perception Index
GovernanceMatters
7876
CPIA (WB)
1974
Freedom in the World
Afrobarometer
Bertelsmann Transformation
Index
Bribe Payers Index
BEEPS
CIRIHuman Rights
Database
Commitment to Development
East Asia Barometer
GAPS in Workers’ Rights
Gender Empowerment
Measure
Eurobarometer
Global Accountability Report
Global Competitiveness
Index
Global Integrity Index
Index of Economic Freedom
Journalists killed
Media Sustainability
Index
Opacity Index
Open Budget Index
Polity
Press Freedom
World Governance Assessment

Discrepancies in rankings
0
1
2
3
World Bank - Controlof Corruption
TransparencyInternational - CPI
Global Integrity Index
Corruption indices for China: Variations in rankings
China
Thailand
India
Corruption in China in 2007: 3 indices; 3 stories

Corruption in China over time (2004-06) Two indices, two stories
According to the World Bank, China is doing better in 2006 than it was in 2004
According to TI, China is doing worse in 2006 than it was in 2004
World Bank - Control of Corruption (China) 2004-2006
0
5
10
15
20
25
30
35
40
2004 2005 2006
Transparency International - CPI (China) 2004-2006
3.1
3.15
3.2
3.25
3.3
3.35
3.4
3.45
2004 2005 2006
Discrepancies in rankings

• What is each index measuring? • What types of indicators make up the
composite score for each index?
• What data sources are used?
• Are component indicators and data sources the same every year?
How to explain these discrepancies in rankings?

What is each index measuring, and what data sources are used?
0
1
2
3
World Bank - Controlof Corruption
TransparencyInternational - CPI
Global Integrity Index
Corruption indices for China: Variations in rankings
China
Thailand
India
Corruption in public sector as perceived by
“experts”
Corruption in public & private sector (+ some indicators at household level) as perceived
by “experts” + opinion polls (incl. NGO experts)
Existence, effectiveness and citizen access to anti-corruption mechanisms,
assessed by national experts

The CPI: Digging deeper... The CPI is the most famous source of information about the level of corruption.
To what extent is this ranking reliable?
To what extent is it useful?
Three sets of challenges:1. Ambiguities in definition2. Methodology3. Perception data

1. Ambiguities in definition
What is measured by the CPI?
Surveys ask different questions related to corruption – they do not cover the same issue!
• Political (grand corruption) vs. lower-level bureaucratic corruption• Frequency of corruption acts• Size of bribes• Legal or illegal activities (What is called “corruption” in one country
differs from another country) • Cost to society

1. Ambiguities in definitions
Selected sources
(out of 14 in 2007)
Subject asked Respondents Coverage
World Economic
Forum (WEF)
Undocumented extra payments or bribes connected
with various government
functions
Senior business leaders; domestic and international
companies
125 countries
Bertelsmann Transformation Index (BTI)
The government’s capacity to punish
and contain corruption
Network of local experts inside
and outside the organization
125 countries
Economist Intelligence Unit (EIU)
The misuse of public office for
private (or political party) gain
Expert staff assessment
166 countries
Composite indicators “have no explicit definition, but instead are defined implicitly by what goes
into them”.

2. Annual variations in methodology
Transparency International - CPI (China) 2004-2006
3.1
3.15
3.2
3.25
3.3
3.35
3.4
3.45
2004 2005 2006
Rank: 71th
Rank: 78th
Rank: 70th
Out of 145
Out of 158
Out of 163
16 surveys – out of 18
14 surveys – out of 16
9 surveys– out of 12
3. Perception dataLack of diversity in sources providing data for CPI:
• Private-sector biased: 12 out of 14 institutions have a private sector focus– But preferences of firms don’t always match those of
society (e.g. negative ratings to strong labour / environmental regulations, high taxes)
• Typical “respondent”: Male & economically well-off
• Missed: perspectives / interests of vulnerable groups, women & “unofficial businesses” which employ majority of population in developing countries
3. Perception data (cont.)CPI often used as a true (instead of perceived) corruption level estimate, BUT a gap between perceptions and actual level of corruption is to be expected:
• “Experts” read same reports and are influenced by other “experts”– CPI and WB ‘Control of Corruption’ scores for China
have 7 sources in common• “Experts” influenced by the same (biased / misleading)
sources, e.g. media, court cases – THEREFORE: A country score showing “high
accuracy” (low margin of error) is in fact derived from sources influenced by the same “mainstream information”!
• Different scores on 2 different indices does not mean that one index is right and the other is wrong.
• Only that the 2 indices are assessing different concepts
• Quick tip:1) Know what want to measure 2) Ignore an index’s “label” 3) Unpack component questions / indicators4) Which index really measures what you want
to measure? 5) Or do you need to generate your own
research?
Tip 1: Ignore an index’s label and dig underneath
Part twoNational corruption indicators
Complementarity in the use of indicators:
• input vs. outcome-based indicators• de jure vs. de facto indicators
Photo by: Konomiho/flickr.

“Second generation” of measurement tools focused on single countries: Original indicators•Original indicators of corruption: based on originally (and locally) generated rather than “third party” data •Can be single-country in focus, but many repeat methods across countries for comparison (e.g. Open Budget Index, Global Integrity Index, TI’s Global Corruption Barometer)
• Major strength: produce highly detailed and contextualized information that can be disaggregated to reveal local nuances (e.g. patterns between corruption incidence and income levels)
• Weaknesses:• A high degree of contextualization makes cross-country comparisons difficult

Country-specific corruption assessments may be used for:
• Understanding the drivers of corruption and the blockages to reform (diagnostic)• Assessing the effectiveness of anti-corruption mechanisms (monitoring)• Identifying capacity gaps (capacity development)• Understanding the impact of corruption, e.g. on marginalised groups, on business, on social service delivery (‘costs’ of corruption)•Monitoring national AC strategies (and/or UNCAC + other international AC conventions)
What are national corruption assessments used for?

• Which, if any, of these indicators are actionable? (drawn from CPI and WB’s Control of Corruption indicator)
1. How often do firms make extra payment to influence the content of new legislation? (Business Enterprise Environment Survey)
2. How many judges and magistrates do you think are involved in corruption? (Regional barometers)
• How would you make them, more ‘actionable’?
Activity: Identifying actionable indicators

Non-actionable Actionable
1. How often do firms make extra payment to influence the content of new legislation? (Business Enterprise Environment Survey)
2. How many judges and magistrates do you think are involved in corruption? (Regional barometers)
• In practice, are the regulations restricting post-government private sector employment for national legislators effective? • In practice, are the requirements for the independent auditing of the asset disclosure forms of members of the national legislature fulfilled?
• In practice, when necessary, does the judicial disciplinary agency initiates investigations?
• In practice, when necessary, does the judicial disciplinary agency impose penalties on offenders?
Activity: two examples

“Not everything that counts
can be counted, and
not everything that can be
counted counts.”
– Albert Einstein
Actionable indicators… a word of caution.

• What are the pitfalls of actionable indicators? – “Simply because something can be measured does not mean
that it is an important constraint on good governance.”
• Actionable does not mean action-worthy
– E.g. Measuring whether a country has an independent anti-corruption commission when there is no guarantee it will reduce corruption
– E.g. Measuring the speed of judicial proceedings when not clear that increasing the speed will ensure that justice is done
• Risk of measuring things because they are easily measurable, leading to “teaching to the test” and “reform illusion”
Actionable or ‘action-worthy’?

Determining what is an ‘action-worthy indicator’
1) Is it measuring interventions that are truly ‘beneficial’?
Assessing performance of interventions only makes sense if these are first deemed appropriate for the particular country context
Prior research can identify what reforms to prioritize, and ones that risk further entrenching corrupt systems e.g. political economy studies such as National Integrity Systems assessments by TI
2) Can the performance measured be attributed to specific policy inputs? (‘actionable’ indicator)

Input/de jure indicator: In law, is there an agency with a legal mandate to address corruption? Does it receive regular funding, a professional & full-time staff?
Outcome indicator: In practice, is the anti-corruption agency effective?
What are some factors which may affect the effectiveness of the agency?
Complementarity in the use of indicators:
1.Input/de jure indicators vs. outcome/de facto indicators

What are some factors which might affect the effectiveness of the agency?
•Head of ACA protected from removal without relevant justification & through a formal process? •Difficulties accessing politically sensitive info necessary for carrying out investigation? • Subject to favourable or unfavourable criticism by govt? •Political appointments vs. based on professional criteria? •Conflicting family relationships / personal loyalties?•Threats / harassments?
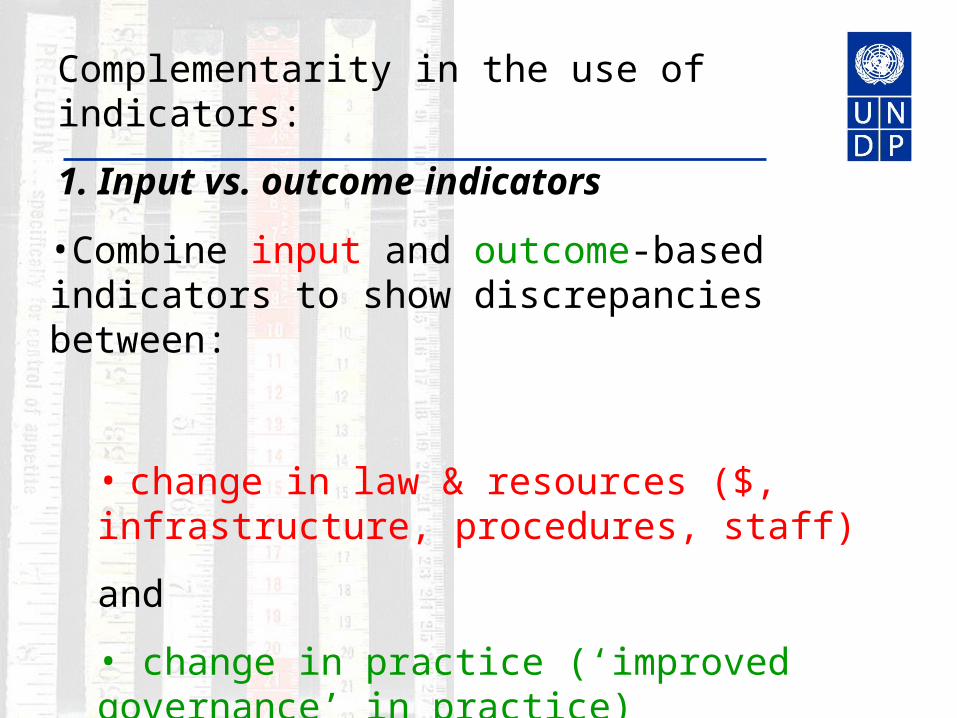
•Combine input and outcome-based indicators to show discrepancies between:
• change in law & resources ($, infrastructure, procedures, staff)
and
• change in practice (‘improved governance’ in practice)
Complementarity in the use of indicators:
1. Input vs. outcome indicators

Complementarity in the use of indicators:
1. Input vs. outcome indicators - example Input indicator: In law, is there an agency with a legal mandate to address corruption?
Outcome indicators: a)In practice, is the anti-corruption agency effective?•Does the ACA make regular public reports (e.g. to legislature)?•When necessary, is the ACA able to independently initiate investigations?
b) Can citizens access the anti-corruption agency?•Does the ACA act on complaints within a reasonable time period? •Can citizens complain to the ACA without fear of recrimination?

What is the value of monitoring the input and outcome sides of reform?
4 groups

Discrepancies in law and practice are revealing
Photo by S.P. Schuman/ State University New York
Are laws and organisational reforms translating into impact on the ground? If not, why not?
• Inappropriate reforms?
• Economically perverse incentives?
• Vested political interests?
• Lack of capacity (e.g. human resources, information retrieval systems)?
• High tolerance of corrupt conduct by the public?
• Different understandings of what is corrupt conduct?
Part threeExperience-based vs. perception-based indicators
Photo by: Konomiho/flickr.
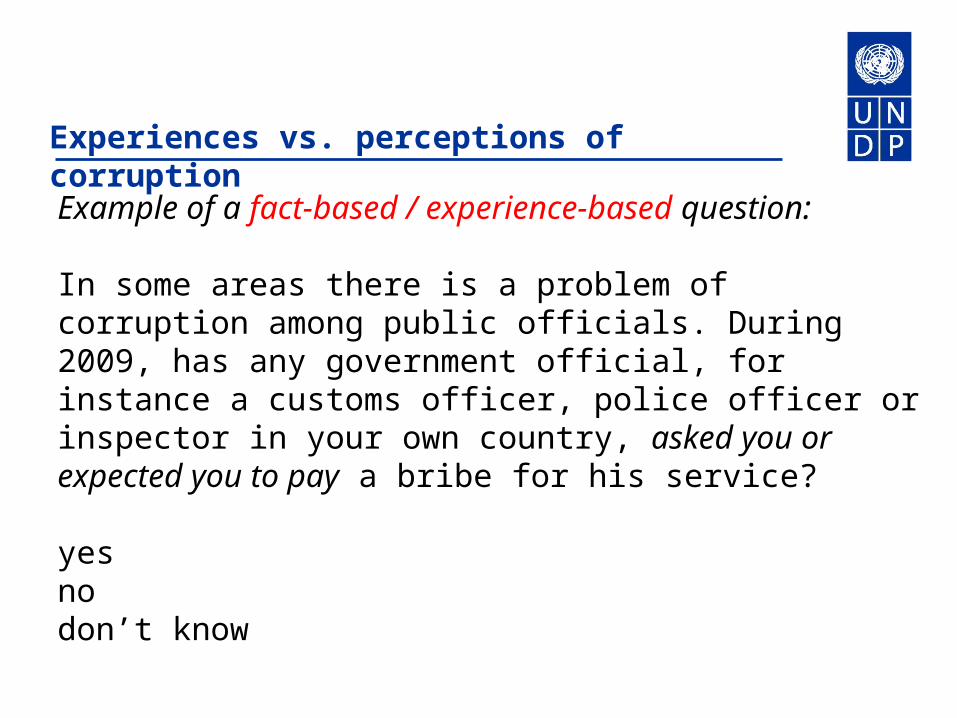
Experiences vs. perceptions of corruption
Example of a fact-based / experience-based question:
In some areas there is a problem of corruption among public officials. During 2009, has any government official, for instance a customs officer, police officer or inspector in your own country, asked you or expected you to pay a bribe for his service?
yesnodon’t know

Experiences vs. perceptions of corruptionExample of a “perception-based question”:
It is known that in some countries the problem of corruption among public officials is perceived to be high by citizens. Imagine a person who needs something that is entitled to him/her by law. Is it likely or not likely that this person would have to offer money, a present or a favour (e.g. more than the official charge) to get help from:
Member of Parliament? Elected municipal councillors? Customs officials? Hospital staff? Police officers ? Tax/revenues officials? Teachers/Professors? Courts officials? Inspectors? Private sector?
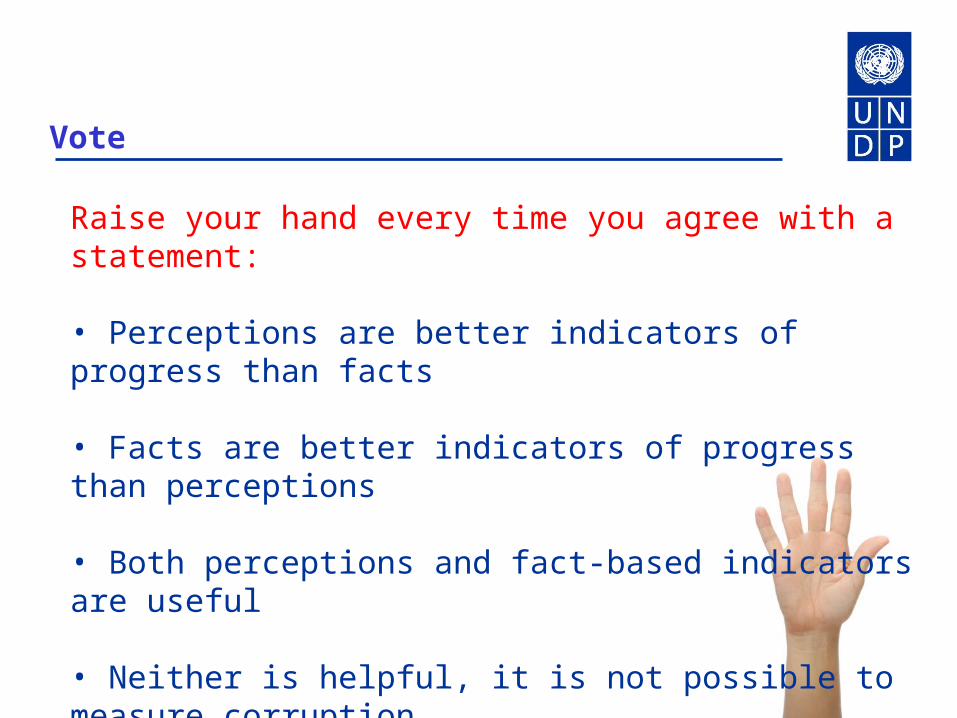
Vote
Raise your hand every time you agree with a statement:
• Perceptions are better indicators of progress than facts
• Facts are better indicators of progress than perceptions
• Both perceptions and fact-based indicators are useful
• Neither is helpful, it is not possible to measure corruption

Module 7 Complementarity in the use of indicators

Experiences vs. perceptions of corruption
Experiences of victimisation are only a small part of what affects people’s perceptions about corruption.
Respondents more likely to perceive corruption tend to: • feel unsafe; have been victims of other offences (e.g. theft, assault) • live in neighbourhoods with low levels of solidarity and social cohesion
Perception is not a proxy for actual levels of corruption. There are many social factors affecting perceptions, other than victimisation.
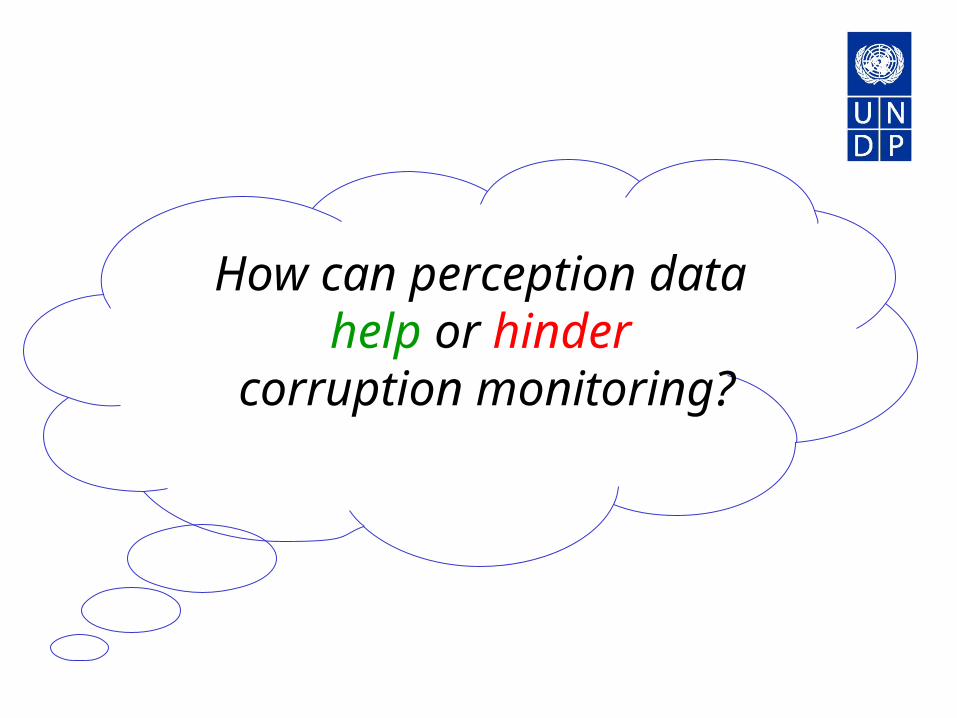
How can perception data help or hinder
corruption monitoring?
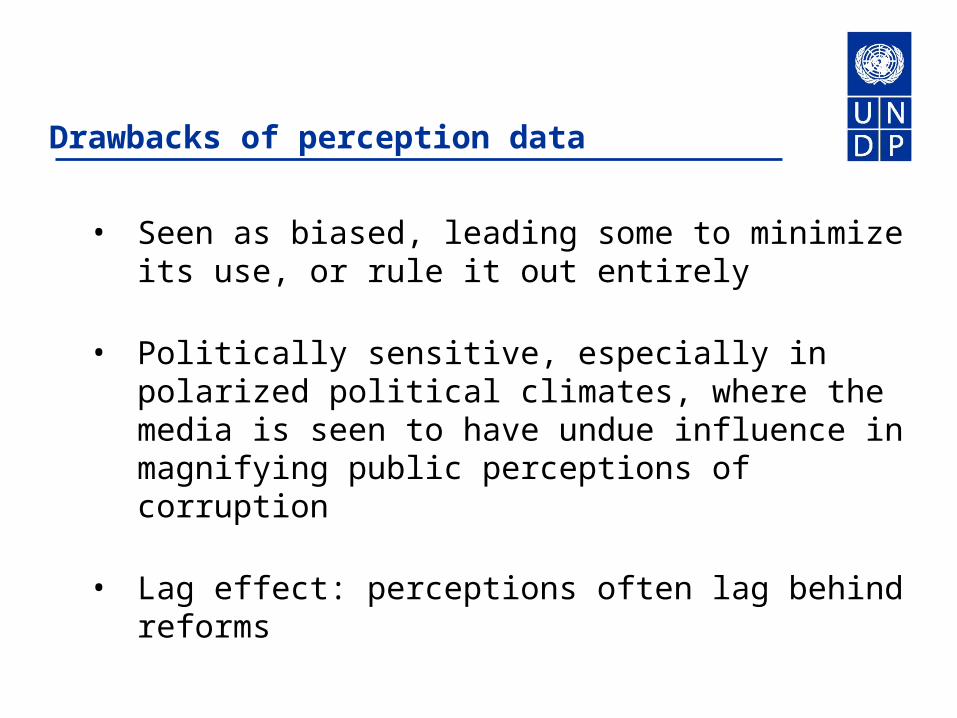
Drawbacks of perception data
• Seen as biased, leading some to minimize its use, or rule it out entirely
• Politically sensitive, especially in polarized political climates, where the media is seen to have undue influence in magnifying public perceptions of corruption
• Lag effect: perceptions often lag behind reforms
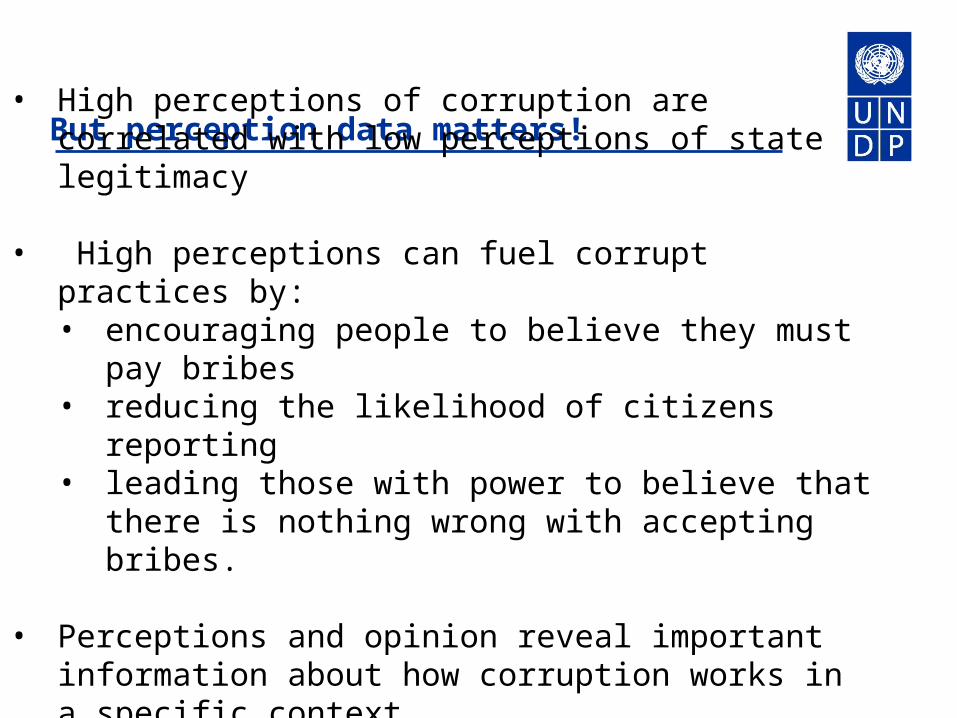
But perception data matters! • High perceptions of corruption are correlated with
low perceptions of state legitimacy
• High perceptions can fuel corrupt practices by:• encouraging people to believe they must pay
bribes• reducing the likelihood of citizens reporting • leading those with power to believe that there
is nothing wrong with accepting bribes.
• Perceptions and opinion reveal important information about how corruption works in a specific context
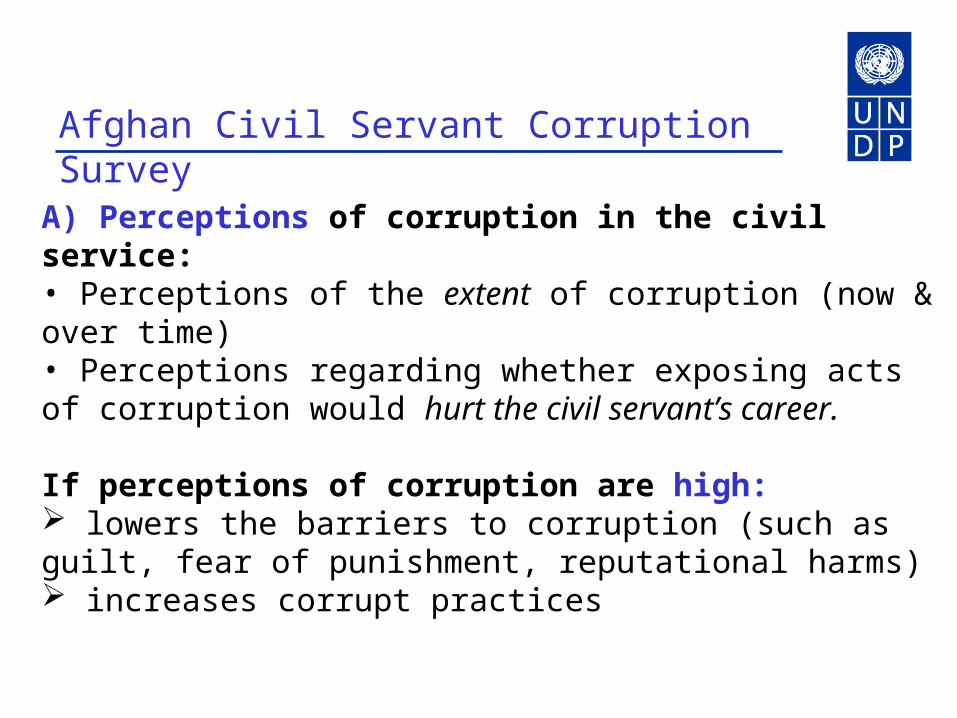
A) Perceptions of corruption in the civil service: • Perceptions of the extent of corruption (now & over time)• Perceptions regarding whether exposing acts of corruption would hurt the civil servant’s career.
If perceptions of corruption are high: lowers the barriers to corruption (such as guilt, fear of punishment, reputational harms) increases corrupt practices
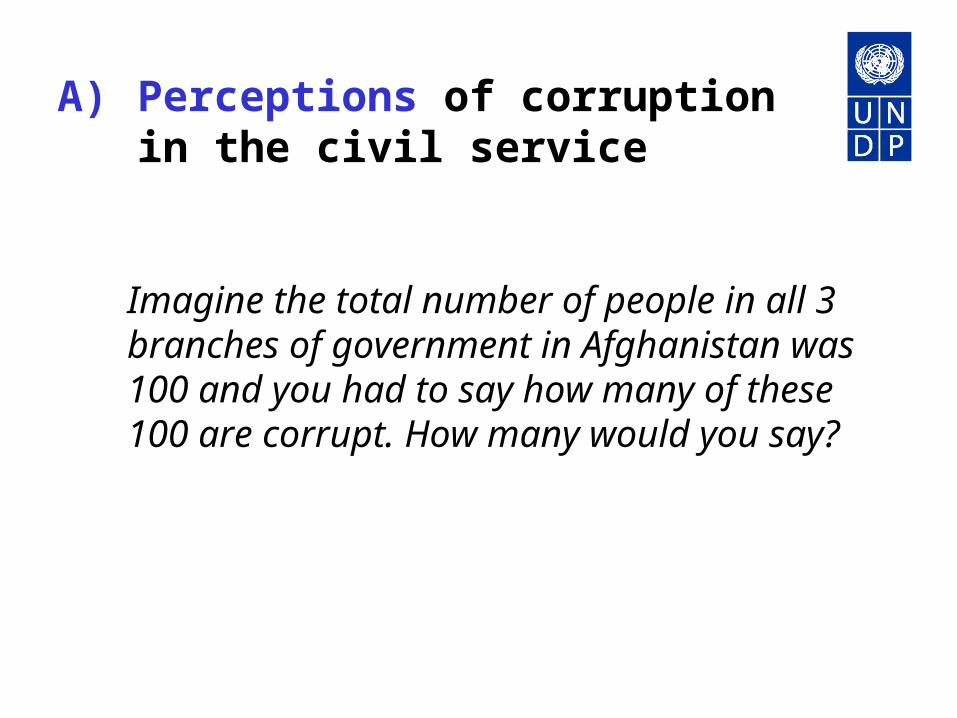
Afghan Civil Servant Corruption Survey
A) Perceptions of corruption in the civil service
Imagine the total number of people in all 3 branches of government in Afghanistan was 100 and you had to say how many of these 100 are corrupt. How many would you say?

B) Conceptions of corruption in the civil service: • Do they align with definition of corruption in AC reforms? (e.g. can civil servants recognize acts of corruption from a given list?) • Personal attitudes and beliefs may dominate legal definitions of “corruption”...
If discrepancy between civil servant conceptions of corruption and the law: promotes transgressions and will undermine reform efforts.
Afghan Civil Servant Corruption Survey

Referring to the public sector, which of the following acts do you consider to be acts of corruption:
• Stealing money from government (embezzlement)• Threatening individuals with harm if they do not
give money (Extortion)• Influencing government contracts in return for
financial or other gains• Bribery• Promotion of unqualified individuals for political
reasons or other gains• Favouring relatives and friends e.g. appointing
them to good positions (nepotism)
B) Conceptions of corruption in the civil service
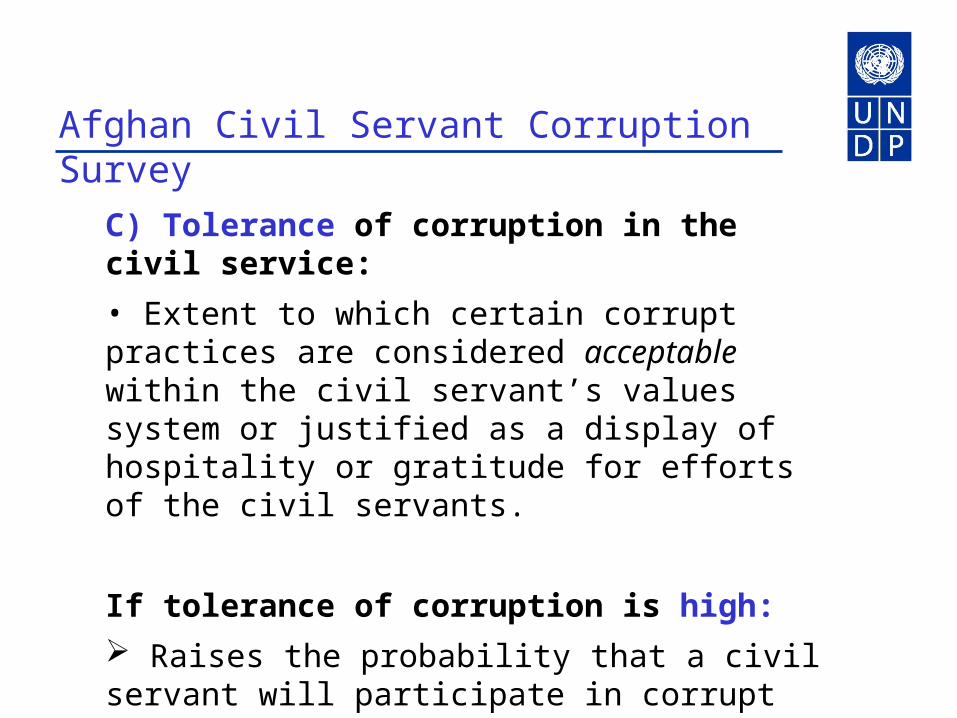
Afghan Civil Servant Corruption Survey
C) Tolerance of corruption in the civil service:
• Extent to which certain corrupt practices are considered acceptable within the civil servant’s values system or justified as a display of hospitality or gratitude for efforts of the civil servants.
If tolerance of corruption is high: Raises the probability that a civil servant will participate in corrupt acts Reduces the probability that corrupt acts will be exposed.
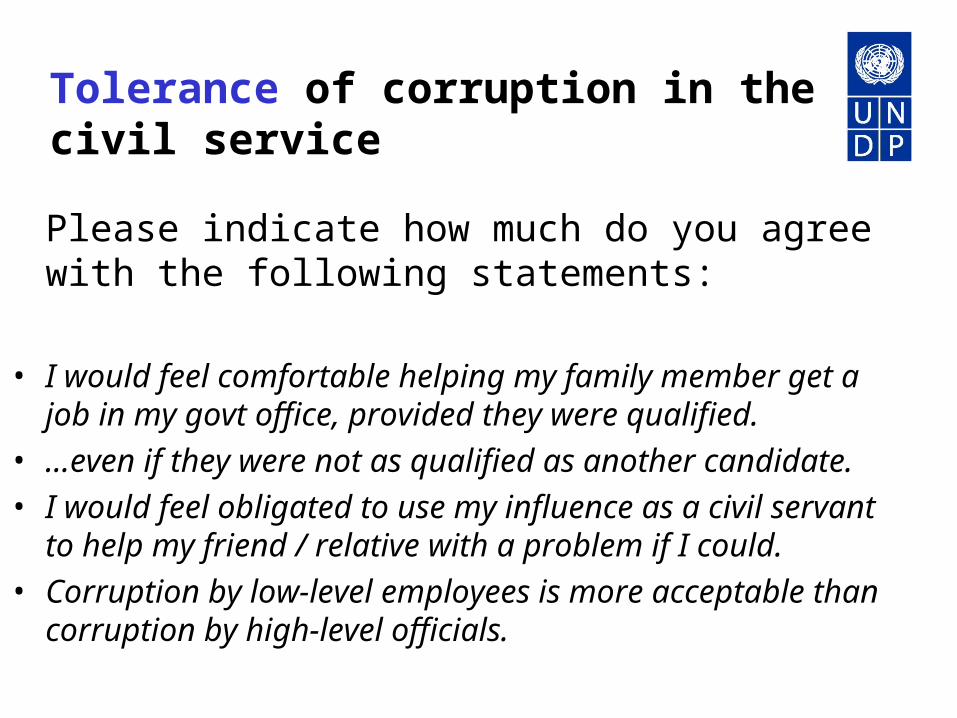
Tolerance of corruption in the civil service
Please indicate how much do you agree with the following statements:
• I would feel comfortable helping my family member get a job in my govt office, provided they were qualified.
• …even if they were not as qualified as another candidate.
• I would feel obligated to use my influence as a civil servant to help my friend / relative with a problem if I could.
• Corruption by low-level employees is more acceptable than corruption by high-level officials.

How would you customize this survey to your own country context?
Which sections are most relevant?
Which sections would need to be revised?
Part fourPro-poor and gender sensitive indicators
Photo by: Konomiho/flickr.

Poverty & gender sensitive indicators• Corruption exacts a higher price on the poor: as an additional “tax”, and by lowering the quality of services
• Gendered forms and dimensions of corruption: men more often tend to be in positions of power, and therefore to be the beneficiaries of corruption
• Need for assessments to be sensitive to the impact of corruption on marginalised groups, and to the effectiveness of anti-corruption mechanisms for these particular groups
• Indicators in this area too often tend to be gender and poverty blind

What makes indicators pro-poor or
gender sensitive?
UNDP proposes 4 ways to make indicators sensitive to vulnerable groups:
1. Disaggregating by poverty/gender2. Specific to the poor/women3. Implicitly poverty/gender
sensitive4. Chosen by the poor/women
Pro-poor and gender sensitive indicators
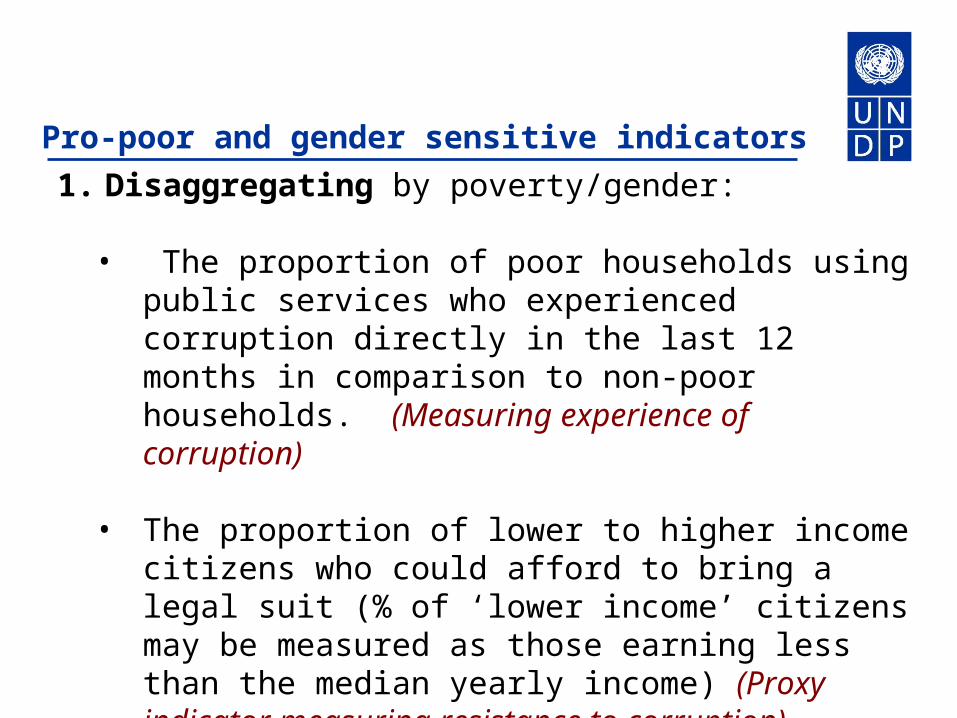
1. Disaggregating by poverty/gender:
• The proportion of poor households using public services who experienced corruption directly in the last 12 months in comparison to non-poor households. (Measuring experience of corruption)
• The proportion of lower to higher income citizens who could afford to bring a legal suit (% of ‘lower income’ citizens may be measured as those earning less than the median yearly income) (Proxy indicator measuring resistance to corruption)

Pro-poor and gender sensitive indicators
2. Specific to the poor/women:
• Size of funds allocated to legal aid in provincial budgets (per capita)
• Amount of money spent on servicing one beneficiary of legal aid (=legal aid budget / number of beneficiaries of legal aid)
• Number of attorneys as % of citizens in need of one
• Average duration of cases processed by the public defenders office compared to average duration of the type of case in question (as %)
Pro-poor and gender sensitive indicators
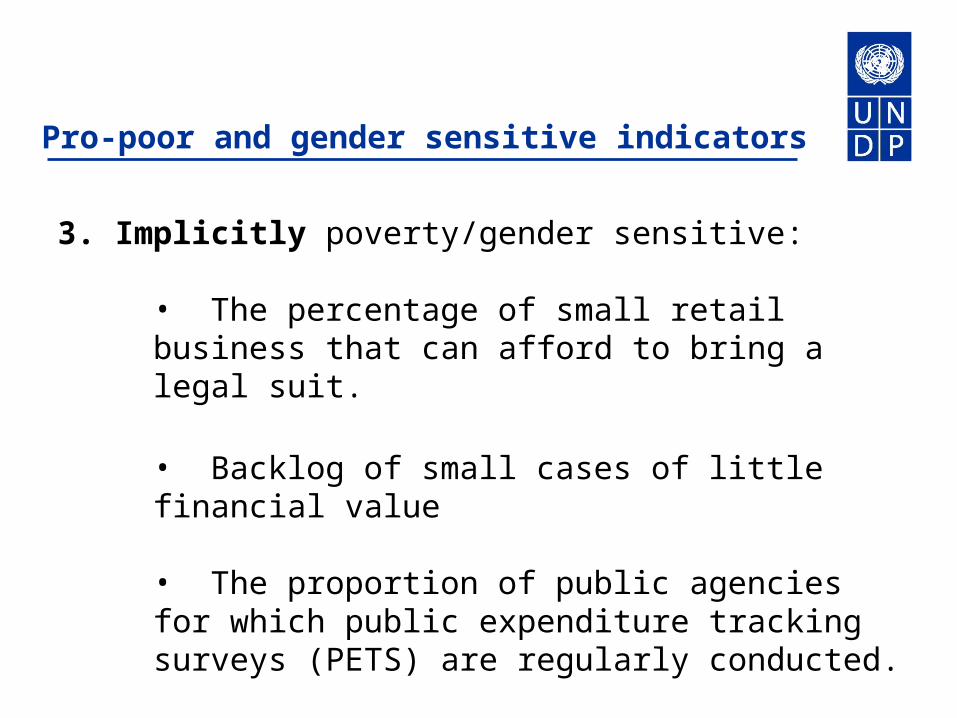
3. Implicitly poverty/gender sensitive:
• The percentage of small retail business that can afford to bring a legal suit.
• Backlog of small cases of little financial value
• The proportion of public agencies for which public expenditure tracking surveys (PETS) are regularly conducted.

Pro-poor and gender sensitive indicators
4. Chosen by the poor/women:
• Level of satisfaction with public services expressed by women in poor households in comparison to men.
• Agencies perceived to be corrupt by low-income households in contrast to higher income households.
• Women’s trust in the police and its ability to provide women with redress if they file a complaint.
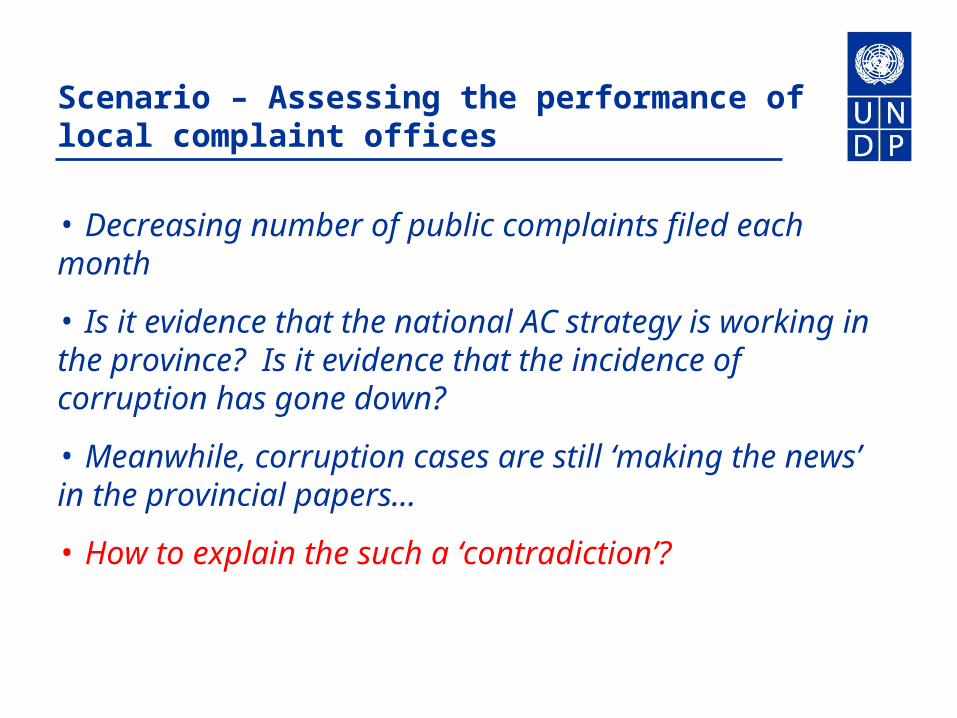
Scenario – Assessing the performance of local complaint offices
• Decreasing number of public complaints filed each month
• Is it evidence that the national AC strategy is working in the province? Is it evidence that the incidence of corruption has gone down?
• Meanwhile, corruption cases are still ‘making the news’ in the provincial papers...
• How to explain the such a ‘contradiction’?

Through interviews with the staff of the office, their clients and a survey of the public, the following findings emerge:
•The office is not easy to access for ethnic minorities living in the periphery of the province
• Fewer respondents from low-income areas know the process for filing reports, and many assume there is a fee for reporting cases• Many respondents do not expect their cases would receive a fair investigation and have little faith in the institution
• Different opinions on what is considered ‘corruption’ amongst staff & the public

What indicators could be used to ‘measure’ the severity of each one of these challenges, especially for vulnerable groups, and progress in tackling these challenges?
?
?
?
?
?
??
?
?
?
?
?

Possible challenges
Possible pro-poor, gender sensitive indicators
Political will (Yearly) change in expression of public confidence that the provincial mechanism is willing and able to act upon complaints (disaggregated by income, gender, ethnicity, etc.)
Independence
Change in public perception of independence of the provincial mechanism (e.g. do you think that members staffing the complaint mechanism are independent from political and private powers in your community?) (disaggregated by income, gender, ethnicity, etc.)
Change in perception of equal treatment (disag.)
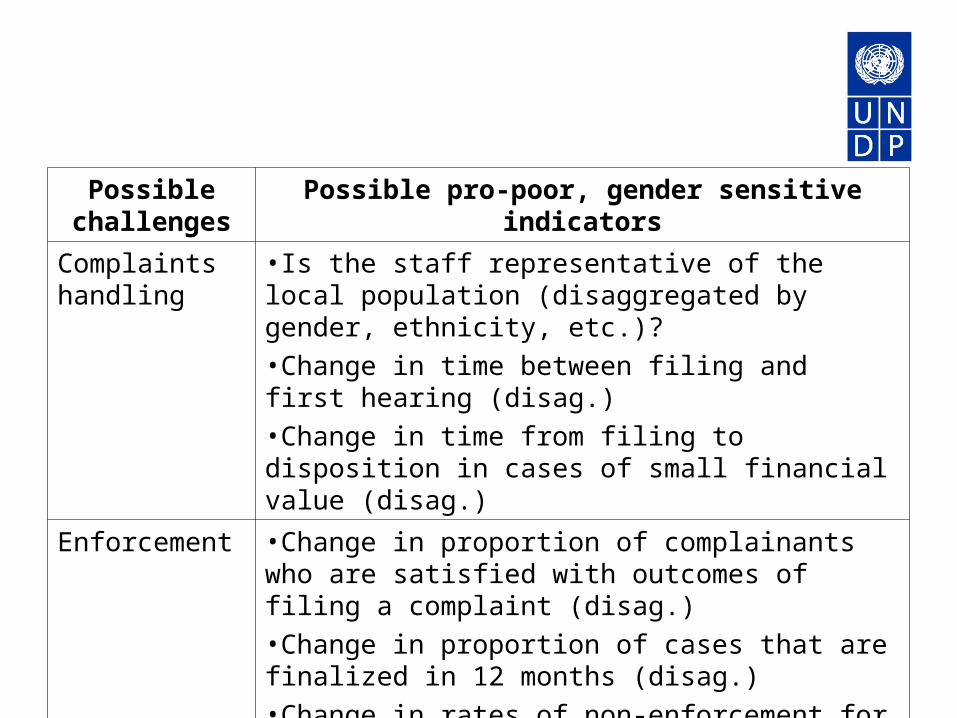
Proposed framework of indicators for assessing the ‘performance’ of the office, especially in servicing vulnerable populations

Possible challenges
Possible pro-poor, gender sensitive indicators
Whistle-blower protection
•Change in the spectrum of small claims poor complainants file•Change in ratio of perception of problems solved to problems exacerbated among litigants (disag.)
Accessibility •% citizens who have access to a phone connection (if complaint mechanism is a “hotline”) (disag.) •% citizens who believe that complaint boxes are placed in strategic and sufficient locations in the province (disag.)•% citizens who know the process for filing a complaint (disag.)•% responses to a request for information provided for a fee (e.g. photocopying fee)
Possible challenges
Possible pro-poor, gender sensitive indicators
Complaints handling
•Is the staff representative of the local population (disaggregated by gender, ethnicity, etc.)?•Change in time between filing and first hearing (disag.)•Change in time from filing to disposition in cases of small financial value (disag.)
Enforcement •Change in proportion of complainants who are satisfied with outcomes of filing a complaint (disag.)•Change in proportion of cases that are finalized in 12 months (disag.)•Change in rates of non-enforcement for poor/vulnerable vs. different groups of (wealthy or otherwise privileged) defendants

Part fiveIntegrity indicators (to measure the ‘opposite’ of corruption, i.e. resistance to corruption)
Photo by: Konomiho/flickr.
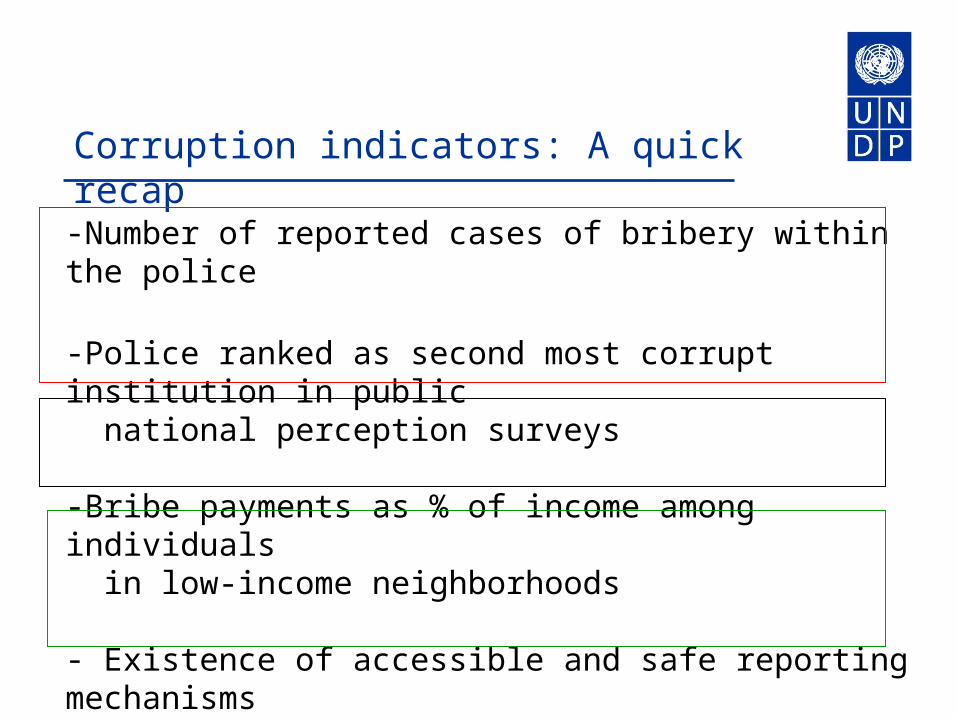
Corruption indicators: A quick recap
-Number of reported cases of bribery within the police
-Police ranked as second most corrupt institution in public national perception surveys
-Bribe payments as % of income among individuals
in low-income neighborhoods - Existence of accessible and safe reporting mechanisms - Proportion of sanctions to registered complaints
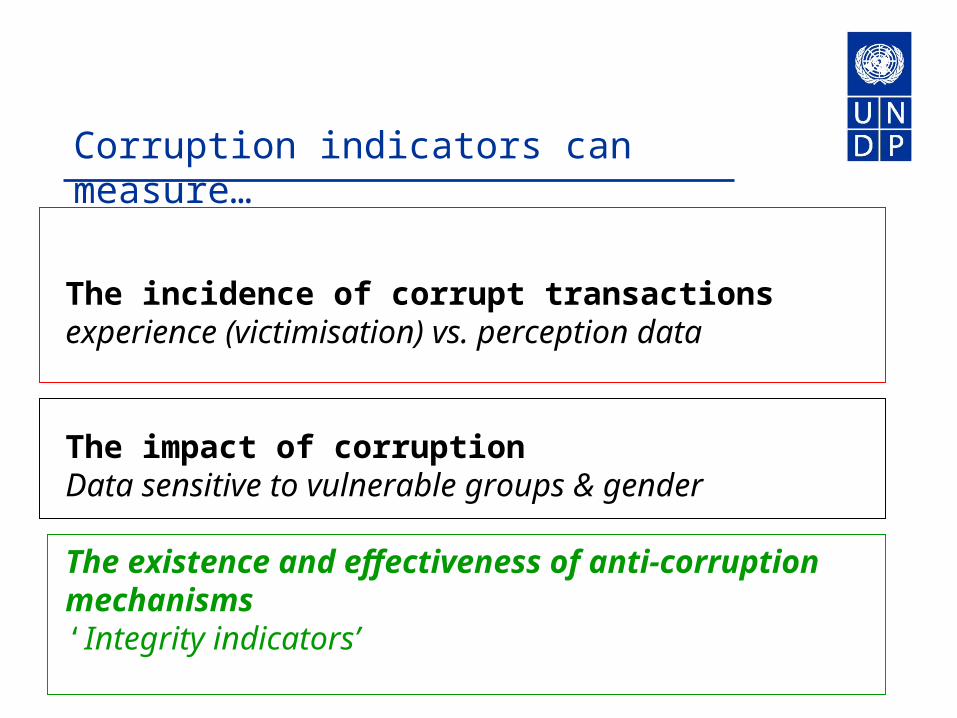
Corruption indicators can measure…
The incidence of corrupt transactions experience (victimisation) vs. perception data
The impact of corruptionData sensitive to vulnerable groups & gender
The existence and effectiveness of anti-corruption mechanisms‘Integrity indicators’

‘Integrity indicators’
•Also called ‘transparency’ or ‘accountability indicators’
•Focus on the effectiveness of anti-corruption mechanisms which are within the control of policy makers
• Therefore tend to be ‘actionable’
•How can we design such ‘integrity indicators’?
•Can they capture the particular experiences of women and vulnerable groups in using anti-corruption mechanisms?
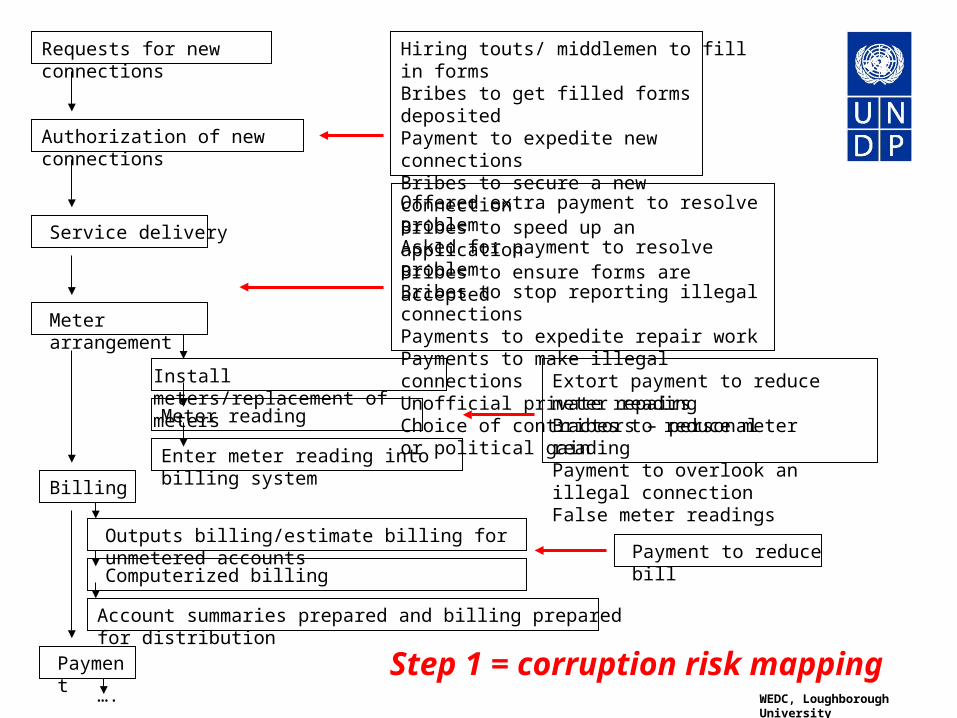
Requests for new connections
Authorization of new connections
Hiring touts/ middlemen to fill in formsBribes to get filled forms depositedPayment to expedite new connectionsBribes to secure a new connectionBribes to speed up an applicationBribes to ensure forms are accepted
Service delivery
Offered extra payment to resolve problemAsked for payment to resolve problemBribes to stop reporting illegal connectionsPayments to expedite repair workPayments to make illegal connectionsUnofficial private repairsChoice of contractors – personal or political gain
Meter arrangement
Install meters/replacement of meters
Meter reading
Enter meter reading into billing system
Billing
Payment
Outputs billing/estimate billing for unmetered accounts
Computerized billing
Account summaries prepared and billing prepared for distribution
….
Extort payment to reduce meter readingBribes to reduce meter readingPayment to overlook an illegal connectionFalse meter readings
Payment to reduce bill
WEDC, Loughborough University
Step 1 = corruption risk mapping

The method
2. Identify corruption “hot spots”
3. Identify corresponding anti-corruption mechanisms
4. Design indicators to match
5. Quantify indicators
1. Trace the steps in the delivery of a service
Designing integrity indicators

Example – procurement (Macedonia RTA Index)
Hot spot:Publication of and invitation for bids done in a way that does not inform as many bidders as possible
AC mechanism:Public procurements, particularly those of a larger value, should be published in the daily newspaper with the largest circulation, instead of in newspapers with limited circulation
Indicator (quantitative):Number (as % of total number of procurements) and value (as % of total value of procurements) of procurementrs advertised in papers of large circulation
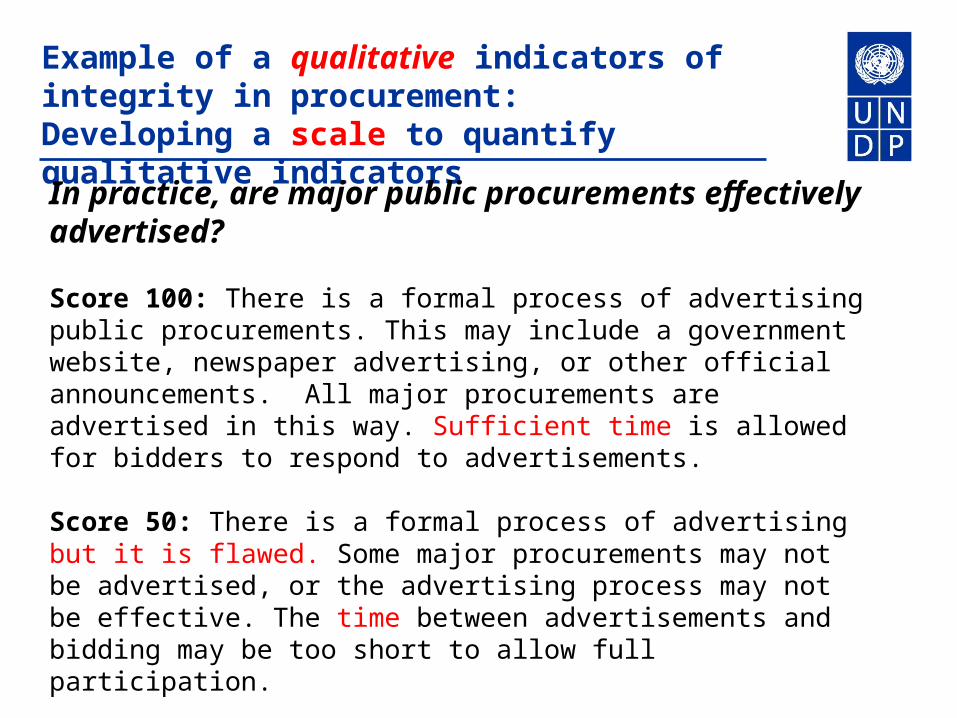
Example of a qualitative indicators of integrity in procurement: Developing a scale to quantify qualitative indicators In practice, are major public procurements effectively advertised?
Score 100: There is a formal process of advertising public procurements. This may include a government website, newspaper advertising, or other official announcements. All major procurements are advertised in this way. Sufficient time is allowed for bidders to respond to advertisements.
Score 50: There is a formal process of advertising but it is flawed. Some major procurements may not be advertised, or the advertising process may not be effective. The time between advertisements and bidding may be too short to allow full participation.
Score 0: There is no formal process of advertising major public procurements or the process is superficial and ineffective.
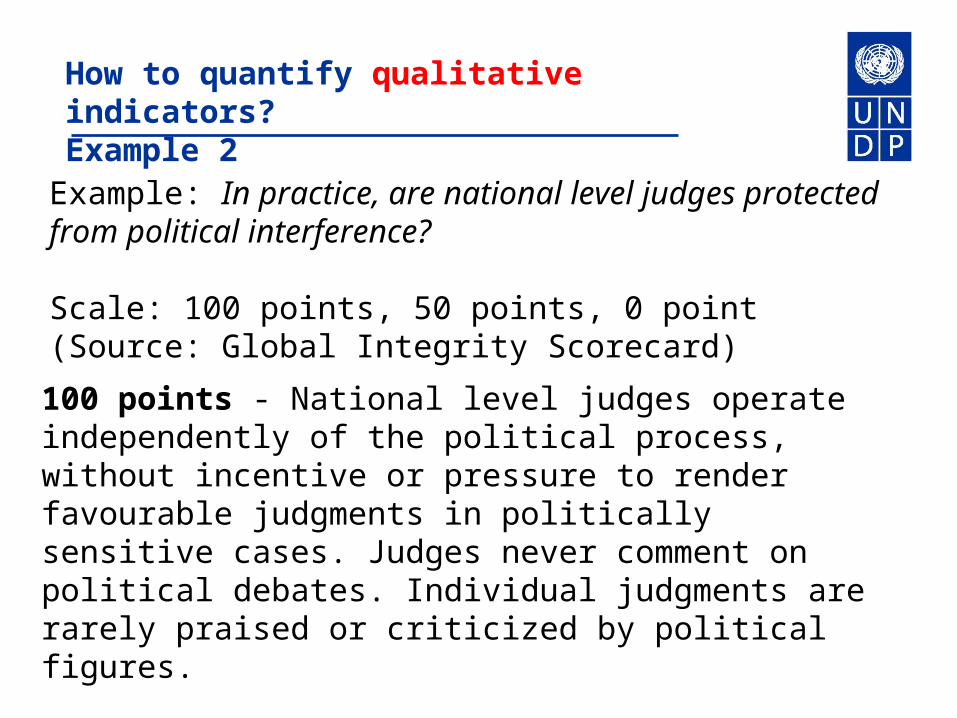
How to quantify qualitative indicators?Example 2
100 points - National level judges operate independently of the political process, without incentive or pressure to render favourable judgments in politically sensitive cases. Judges never comment on political debates. Individual judgments are rarely praised or criticized by political figures.
Example: In practice, are national level judges protected from political interference?
Scale: 100 points, 50 points, 0 point(Source: Global Integrity Scorecard)

How to quantify?
50 points - National level judges are typically independent, yet are sometimes influenced in their judgments by negative or positive political incentives. This may include favourable or unfavourable treatment by the government or public criticism. Some judges may be demoted or relocated in retaliation for unfavourable decisions.
0 point - National level judges are commonly influenced by politics and personal biases or incentives. This may include conflicting family relationships, professional partnerships, or other personal loyalties. Negative incentives may include demotion, pay cuts, relocation, threats or harassment.

Part sixCorruption Assessment Tools
Photos by Adam Rogers/UNCDF
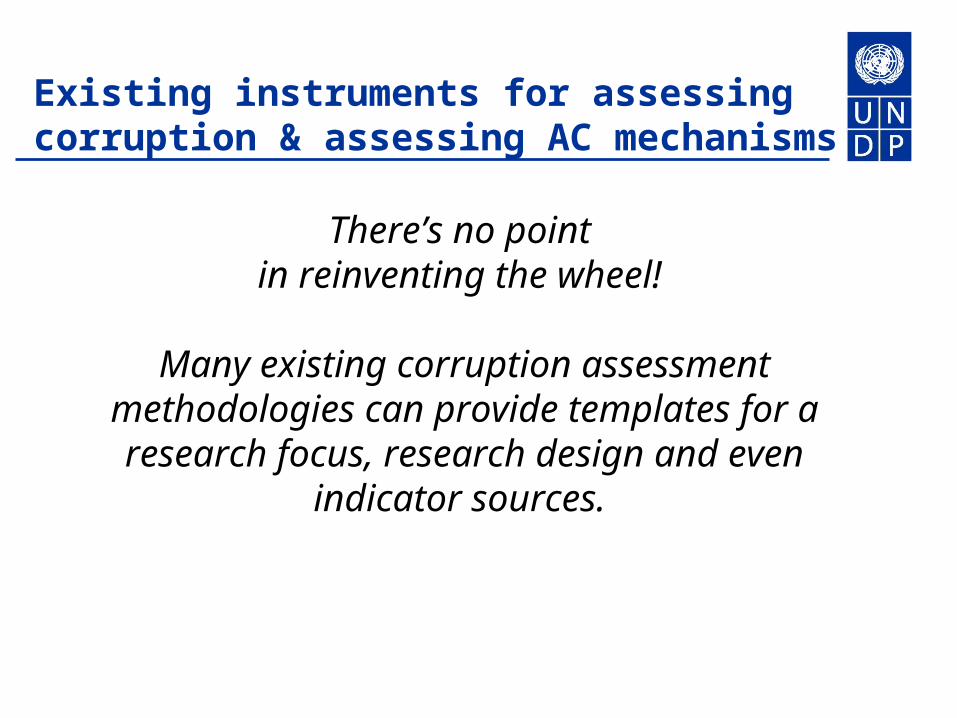
Existing instruments for assessing corruption & assessing AC mechanisms
There’s no point in reinventing the wheel!
Many existing corruption assessment methodologies can provide templates for a research focus, research design and even
indicator sources.

Country-level corruption and Anti-corruption assessment tools
Corruption Transparency/Accountability/Integrity
Diagnostic Assessments
Institutions
Processes
Sectors
Local level
Compliance monitoring
Perception
Experience/ victimisationPublic
opinion
Experts
Public sector
General population / vulnerable groups
Public sector
Private sector
Mapped by Transparency International

www.gaportal.org: Profile for each tool
• Purpose• Type of data used• Methodology• Pro-poor / gender sensitive aspects• Actionability • Complementarity (de jure / de facto;
inputs / outcomes)• Example indicators• URL
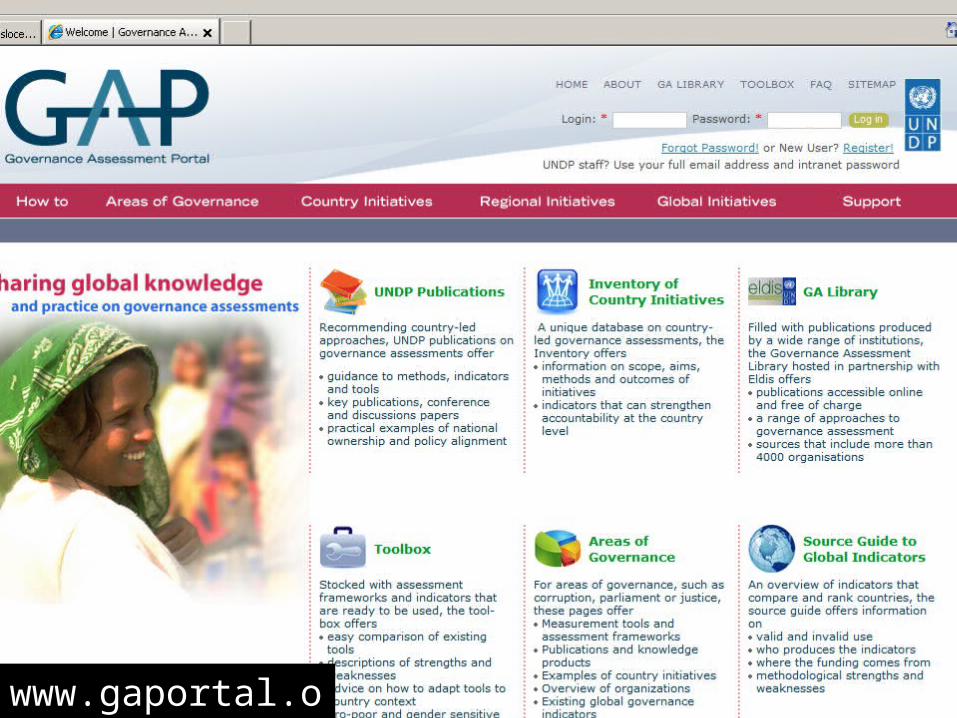
www.gaportal.orgwww.gaportal.org

• Start with a clear objective
• Map out relevant tools, and select a methodology that is suited to your purpose and focus
• Don’t just replicate a generic tool developed by an international organization, or a tool used in another country: adapt it to your setting (method & data sources, country-specific indicators, scales to quantify qualitative indicators)
• Make sure to use indicators that are actionable & action-worthy indicators, and complementary (input vs. outcome; de jure vs. de facto)
• Invest in proper design, testing and initial consultation of stakeholders
Selecting an appropriate assessment tool