Embed Size (px)
Citation preview

Measuring database performance in online services:
a trace-based approach
Swaroop Kavalanekar1 , Dushyanth Narayanan2, Sriram Sankar
1, Eno Thereska2,
Kushagra Vaid1, and Bruce Worthington1
1 Microsoft Corporation, 1 Microsoft Way, Redmond WA 98052, USA
2 Microsoft Research Ltd., 7 J J Thomson Avenue, Cambridge CB3 0FB, United Kingdom [email protected]
Abstract. Many large-scale online services use structured storage to persist
metadata and sometimes data. The structured storage is typically provided by
standard database servers such as Microsoft’s SQL Server. It is important to
understand the workloads seen by these servers, both for provisioning server
hardware as well as to exploit opportunities for energy savings and server
consolidation. In this paper we analyze disk I/O traces from production servers in
four internet services as well as servers running TPC benchmarks. We show using a
range of load metrics that the services differ substantially from each other and from
standard TPC benchmarks. Online services also show significant diurnal patterns in
load that can be exploited for energy savings or consolidation. We argue that TPC
benchmarks do not capture these important characteristics and argue for developing
benchmarks that can be parameterized with workload features extracted from live
production workload traces.
Keywords: online services, TPC, benchmarks, storage traces, storage performance,
data centers, capacity planning.
1 Introduction
Companies such as Microsoft host a variety of large-scale online services in mega-scale
data centers. These services have unique workload attributes that need to be taken into
account for optimal service scalability. Provisioning compute and storage resources to
provide a seamless user experience is challenging, since customer traffic loads vary
widely across time and geographies, and the servers hosting these applications have to be
right-sized to provide performance both within the box and across the services cluster.
These online services typically have a tiered architecture, with stateless higher tiers
above structured and unstructured storage tiers. For the structured storage, Microsoft’s
data centers use SQL Server since it provides a well-understood data model and a mature

server engine. All the tiers present different provisioning and partitioning challenges: in
this paper we focus on analyzing the structured storage tier. In this tier the most important
resource for provisioning is usually I/O, and hence the I/O load at the structured storage
tier is the focus of this paper.
We address the question: what are the I/O characteristics at the structured storage tier
in production environments? We analyze I/O traces from live production servers in
different online services, and compare them to each other and to standard TPC
benchmarks. We compare a range of I/O metrics such as I/O rate, read/write ratio, and
access locality. In addition we also examine the time variation in the online services
workloads on a diurnal time scale. User-facing services often have strong diurnal patterns
since users are not evenly distributed across time zones [1]. It is important to understand
these patterns to improve performance, efficiency and responsiveness. Other opportunities
include server consolidation, e.g., consolidating servers within a service or across services
that have uncorrelated or even anti-correlated patterns.
Based on our analyses, we observe that:
1. When characterized using standard I/O metrics (e.g. IOPS/GB ratio, read/write
ratios), online services workloads differ by orders of magnitude from TPC
benchmarks even during phases of sustained peak activity.
2. Online services workloads also differ from each other on many metrics, again by
orders of magnitude.
3. Some online services show distinct diurnal patterns in load level.
These observations imply that standard TPC benchmarks are not well-suited to
characterizing performance in these environments since they do not match the I/O
characteristics of individual workloads; they do not capture the range and diversity of
these workloads; and they do not model diurnal patterns of variation in load. Production
server traces, on the other hand, accurately capture these workload-specific features. In
previous research[2, 3, 4], we have also seen that a trace-based approach allows
evaluation of system designs and performance metrics that benchmarks alone do not
allow. Based on these experiences we advocate widespread use of tracing to drive server
performance evaluation. We also argue for the development of parameterized benchmarks
that combine the advantages of benchmarks with the realism of live traces.
The rest of the paper is organized as follows. Section 2 presents an analysis of four
online services workloads, and a comparison of these workloads with TPC benchmarks.
Section 3 briefly summarizes our previous research using I/O traces in the form of three
case studies, each of which highlights a different advantage of traces vis-à-vis
benchmarks. Section 4 provides practical guidelines to follow in tracing live production
servers, based on our experiences. Section 5 discusses the challenges and limitations of
traces, and directions for future research including hybrid approaches that could combine
the advantages of traces and benchmarks. Section 6 completes the paper with some
conclusions and recommendations.

2 Online services workload analysis
In this section we analyze and visualize storage workloads from four online services
within Microsoft, comparing the production storage workloads against the storage
workloads from three TPC benchmarks. We first provide some background and
motivation for the core problem: that of right-sizing storage in online services. We then
describe the online services that we analyze in the paper and the low-overhead tracing
technology used to trace production servers. We then present the results of our analysis.
2.1 Right-sizing storage in online services
Online services scale by partitioning and replicating data over a large number of
commodity servers. It is important to optimize both the server design and the number of
servers, since capital acquisition and power costs can quickly add up across a large server
base. Increasingly, the aim is also to consolidate many different services onto a single
infrastructure to improve utilization. Sets of consolidated services must scale across large
deployments measured in hundreds of thousands of servers. Server design and right-
sizing strategies for such environments present a whole new set of challenges in
optimizing performance per dollar and per watt. To implement a data-driven methodology
for server design, we have to ensure that applications are duly characterized and that the
implications for various platform subsystems are well understood.
While CPU processing power continues to increase at a tremendous rate, disk
bandwidth and latency have not kept pace. To bridge this gap, typical enterprise server
solutions are designed with large storage arrays that account for a major portion of server
capital acquisition costs and consume significant power, even when idle. Emerging
technologies such as Solid State Devices (SSDs) can bridge the performance gap, but are
still too expensive (per byte) for broad deployments at datacenter scale[4]. Hence, the first
optimizations for server right-sizing need to focus on the storage subsystem, to ensure
optimal overall performance for a given design. Additionally, customer datasets in online
services environments are usually partitionable. Therefore, it is possible to design each
service tier using commodity single- or dual-CPU socket platforms and then load-balance
the traffic across multiple servers in the service cluster. In such scenarios, the approach is
to disaggregate the customer dataset into small subsets, and to determine the right amount
of capacity and I/O for hosting each subset. Ideally, identical self-contained server
building blocks are used (e.g., a cluster of 2U servers with up to perhaps 24 drives each).
This methodology enables a simpler storage subsystem design for optimal $/GB and
$/IOPS. This also highlights a key difference in the service deployment strategy in an
online services environment versus a typical enterprise where the dataset may be hosted
on a single large server using scale-up platform technologies.

2.2 Workloads traced
We chose four different web services for this analysis. Traces were captured from one
representative database server from the structured storage tier of each service:
1. IM-DB (Windows Live Messenger Database Server): Address Book Database
machines store user profiles and instant messenger buddy lists. They are essential to
several online services related to social networking and interactions.
2. MSN-DB (MSN Content Aggregation Database Server): This database hosts a
content publishing system for the online portal front page and is updated by mainly
editorial tools and feed management systems via web services. Most of the stored
data is actually unstructured in nature, consisting of either raw content or links to
content on other partner sites.
3. EMAIL-DB (Windows Live Email Database Server): This database hosts mail
message metadata which maps online users to file stores. Incoming messages goes
through a lookup process to determine which file server is hosting the receiving
user’s email message store. The message is then deposited in the appropriate message
store, and other metadata corresponding to the user account is updated.
4. BLOB-DB (Windows Live Blob Metadata Server): These metadata lookup servers
hold user account mappings for various blob storage services such as online photos,
videos, social networking updates, etc. Each incoming request is looked up in this
database to determine which back-end file server is hosting the appropriate content,
and the user request is routed to that server for either storage or lookup of the content.
In addition we also ran and traced the TPC-C, TPC-E, and TPC-H benchmarks. In this
paper neither the online services nor the benchmarks correspond to ―e-commerce‖
browsing/shopping applications; although e-commerce is certainly important it is only one
of many possible applications. We are currently looking for block I/O traces from e-
commerce deployments and the corresponding benchmarks (TPC-W and TPC-App).
Workload Trace start (PDT) Trace length RAID arrays Disks
IM-DB 03 Oct 2008, 12:47 25 min 5 x RAID-10 34
MSN-DB 10 Mar 2009, 17:21 24 hrs 10 x RAID-10 46
EMAIL-DB 04 Apr 2008, 00:00 2 hrs 4 x RAID-10 34
BLOB-DB 26 Nov 2008, 14:00 24 hrs 10 x RAID-10 46
TPC-C 19 Oct 2007, 15:52 6 min 14 x RAID-0 392
TPC-E 18 Oct 2007, 17:46 17 min 12 x RAID-0 336
TPC-H 20 May 2009, 17: 31 1.5 hrs 4 x RAID-0 36
Table 1. Workloads traced
Table 1 summarizes the traces and the storage hardware on the traced servers. All the
servers are configured with multiple RAID arrays, with multiple partitions on each array.
The data and log files are then balanced across these partitions. The traces include both
data and log file I/Os: generally the data file I/Os dominate the load. Log I/Os were
11%—12% of the total for BLOB-DB and MSN-DB, and less than 2% for the others.
2.3 Block-level I/O tracing
Windows operating systems have included a built-in tracing capability called Event
Tracing for Windows (ETW) since Windows 2000. Each subsequent Windows release has
increased the breadth and depth of system instrumentation, including instrumentation in
the Windows kernel. ETW provides a high performance, low overhead, and highly
scalable tracing framework. It uses efficient buffering and non-blocking logging
mechanisms with per-CPU buffers written to stable storage by a separate thread. ETW
tracing is extensible and can also be extended to applications by application developers.
Since Windows 2003, ETW tracing can be dynamically enabled or disabled without
requiring a system reboot or an application restart. Typical ETW events are discrete time-
stamped trace points, but sampling and statistical data captures are also possible. Storage
related instrumentation includes, but is not limited to: initiation and completion disk
events for reads, writes, and flushes; and file events for creates, deletes, reads, writes, and
attribute queries and updates.
There are several tools that can use ETW events to capture and correlate information
about system activity. Since Windows 2008, the performance monitor built into Windows
(PerfMon.exe) can capture ETW events. Another powerful tool designed specifically for
system analysis using ETW is the Windows Performance Tools kit (WPT), which is an
extensible performance analysis toolset that provides high level control and decoding of
ETW events. It provides a controller that can be used to enable and disable ETW event
capture. It understands the relationship between different ETW events in the system and
presents a comprehensive visual representation of captured events. This allows detailed
analyses of a wide range of system activities. WPT provides powerful interactive
summary tables and graphs with dynamic grouping, sorting, and aggregation capabilities.
WPT can also dump a trace in a text format that other analysis tools can consume.
The ETW traces referenced in this paper contain ―Disk I/O‖ ETW events from the
Windows kernel. The traces were broken into intervals to reduce the size of individual
traces as well as to make analysis and visualization easier. The interval size was
determined heuristically based on the storage activity of the workload. A post-processing
script library was used to extract the workload characteristics and metrics reported in this
paper. The traces analyzed for this paper contain only events related to the disk subsystem
and do not have any information that can be related to the end-user; i.e., the disk traces
used for our analysis are by definition anonymized from an end-user standpoint.

2.4
Trace analysis results
Given a block-level I/O trace, we summarize the trace by computing a number of standard
metrics. Table 2 shows the most important summary metrics for the different workloads.
The main load metric is IOPS: I/Os per second issued by the workload. IOPS is
computed for each 1-second interval in the trace; we then show the mean over all the
intervals, as well as the peak, defined as the 99th
percentile of load seen during the trace.
In general we use the peak IOPS value to compare workloads, since servers are
provisioned for this load. Further, unlike TPC benchmarks, online services have high
peak-to-mean ratios and hence comparing them to benchmarks using mean IOPS would
be misleading.
R/W is the read/write ratio of the I/Os seen in the workload. Seq is the fraction of I/Os
that were considered sequential, i.e., the logical blocks read or written were contiguous to
the immediately previous I/O. Finally GB is the size of the data set accessed by the
workload, which we estimate as the highest logical block number accessed expressed in
units of GB. Capacity usage (GB) is important because, unlike benchmarks, provisioning
for some online services can be capacity-bound rather than I/O-bound. Further, these
services are scaled out and load-balanced over many servers, and different services have
IM-DB
EMAIL-DB
BLOB-DB
MSN-DB TPC-C
TPC-ETPC-H
0.001
0.01
0.1
1
10
0.1 1 10 100 1000
Sca
led
pe
ak
tra
sfe
r ra
te
(MB
/s/G
B)
Scaled peak I/O rate (IOPS/GB)
IM-DB
EMAIL-DB
BLOB-DBMSN-DB
TPC-C
TPC-ETPC-H
100
1000
10000
100 1000 10000 100000 1000000
Ca
pa
city
(G
B)
Peak I/O rate (IOPS)
Figure 1: Peak IOPS and capacity Figure 2: Scaled IOPS and MB/s
Workload Mean IOPS Peak IOPS R/W Seq GB
IM-DB 3386 4038 6.19 0.02 101
EMAIL-DB 59 610 0.69 0.00 2608
BLOB-DB 299 1030 1.67 0.11 265
MSN-DB 1056 3830 1.91 0.11 399
TPC-C 49757 52800 1.80 0.02 873
TPC-E 112654 186568 8.34 0.02 321
TPC-H 2228 11801 29.94 0.35 260
Table 2: summary of workload metrics
different provisioning (e.g. number of spindles) per server as well as different numbers of
servers. Hence, we cannot directly compare the raw IOPS rate across these servers.
Instead, we use capacity as scaling factor, i.e., we compare ―IOPS per GB of data‖ instead
of ―IOPS per server‖.
In addition to I/O rate we also measured the mean and peak transfer rate (measured in
MB/s). However as we will see later transfer rate is in general highly correlated to I/O rate
due to the fixed transfer sizes used by SQL Server. For simplicity we do not show the
transfer rate in Table 2.
From Table 2, we can already see that the online services workloads differ widely both
among themselves and from the TPC benchmarks. We now show this visually by plotting
the workloads as points in two dimensions, using two workload metrics at a time. Note
that all the graphs use log-log scales to capture the wide variation across workloads.
Figure 1 shows the workloads along the axes of capacity and peak I/O rate. We see
that TPC-C and TPC-E do have much higher I/O rates relative to capacity than the other
workloads, and in general there are order-of-magnitude differences between workloads.
However, the absolute value of I/O rate is affected by the provisioning of the specific
server; as we saw in Table 1, the different servers are provisioned with different numbers
of disks. Hence when a server is part of a scale-out configuration, it is more useful to look
at a scaled metric of load, i.e., I/O rate relative to the amount of data stored on that server.
Figure 2 shows the I/O rate and transfer rate metrics scaled by the data size, i.e. the
capacity in GB. We see here that there is indeed a very wide variation between the online
services workloads, and that they also differ substantially from TPC benchmarks. Thus for
a server storing a given amount of data, for example, IM-DB sees an order of magnitude
less I/O load than TPC-E. We also see that the ratio of transfer rate and I/O rate is similar
for most of the workloads, with the exception of TPC-H. This ratio is just the most
common transfer size used by SQL Server for its I/O request, i.e. 8 KB; for TPC-H large
sequential scans also result in larger transfer sizes for some I/Os.
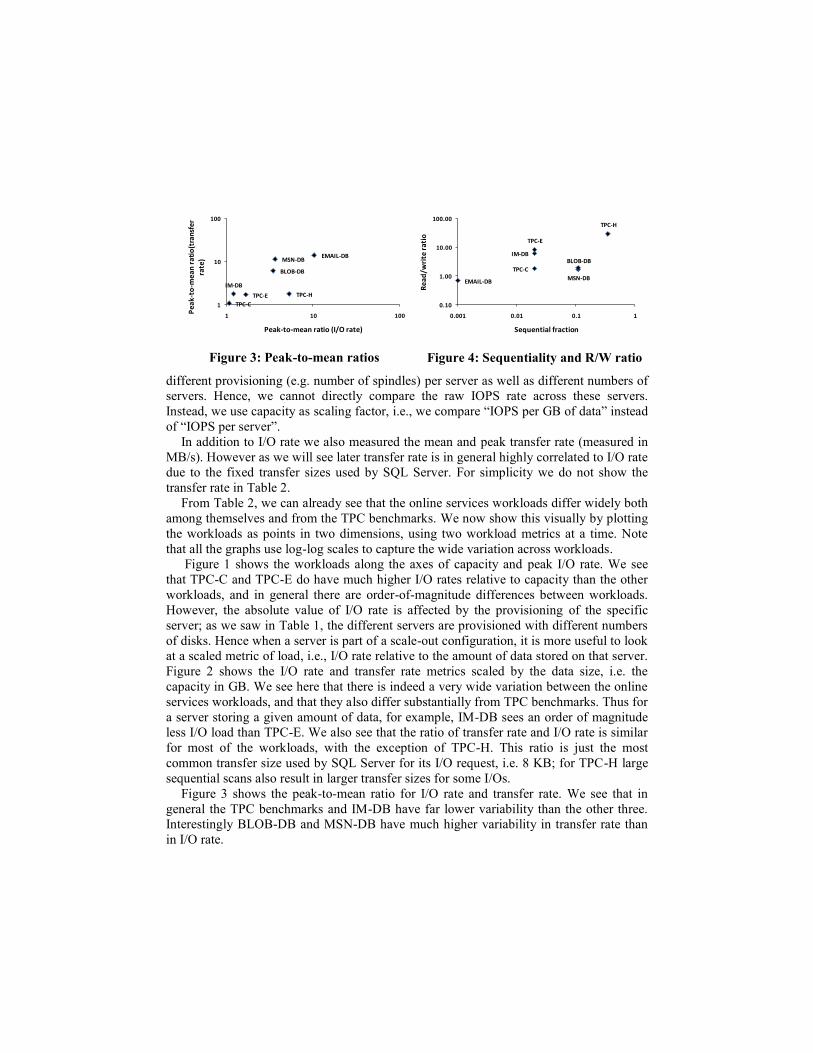
Figure 3 shows the peak-to-mean ratio for I/O rate and transfer rate. We see that in
general the TPC benchmarks and IM-DB have far lower variability than the other three.
Interestingly BLOB-DB and MSN-DB have much higher variability in transfer rate than
in I/O rate.
IM-DB
EMAIL-DB
BLOB-DB
MSN-DB
TPC-C
TPC-E
TPC-H
0.10
1.00
10.00
100.00
0.001 0.01 0.1 1
Re
ad
/wri
te r
ati
o
Sequential fraction
Figure 3: Peak-to-mean ratios Figure 4: Sequentiality and R/W ratio
IM-DB
EMAIL-DB
BLOB-DB
MSN-DB
TPC-C
TPC-E TPC-H
1
10
100
1 10 100
Pe
ak
-to
-me
an
ra
tio
(tra
nsf
er
rate
)
Peak-to-mean ratio (I/O rate)

Figure 4 shows the metrics Seq (fraction of I/Os that are sequential) and R/W
(read/write ratio). Here again we see a wide variation, with most workloads being read-
dominated except EMAIL-DB which is write-dominated. EMAIL-DB stores e-mail
metadata and thus issues several write I/Os for each metadata update. We also see a wide
variation in sequentiality: ranging from TPC-H (35% sequential) to EMAIL-DB. The
latter is 0% sequential (shown as 0.1% sequential to accommodate the data point on a log
scale).
Finally, we are interested in diurnal patterns shown by our workloads, since these are
important for server consolidation and energy savings. Clearly the notion of diurnal
variation is not meaningful for TPC benchmarks, since the benchmarks do not specify any
such variation. However, for two of our online services workloads --- BLOB-DB and
MSN-DB --- we have 24-hour traces and hence can examine them for diurnal patterns.
Figures 5 and 6 show load over time for BLOB-DB and MSN-DB. We see that BLOB-
DB shows a clear variation over a 24-hour period, indicating the concentration of users in
different time zones. It also shows a second periodic behavior with a 1-hour period. For
MSN-DB although there is substantial variation, i.e., burstiness, it is harder to identify any
clear periodic behavior.
2.5 Trace analysis summary
In this section we compared online services workloads with TPC benchmarks across a
range of I/O related metrics. We showed that they workloads vary widely among
themselves --- by orders of magnitude in many cases --- and also differ from the TPC
benchmarks. We also showed that some workloads have periodic variations in load, and
these are not captured by today’s benchmarks.
0
500
1000
1500
2000
2500
3000
3500
4000
4500
5000
0 200 400 600 800 1000 1200 1400 1600
Loa
d (
IOP
S)
Time (min)
0
200
400
600
800
1000
1200
1400
1600
0 200 400 600 800 1000 1200 1400 1600
Loa
d (
IOP
S)
Time (min)
Figure 5: Load over time (BLOB-DB) Figure 6: Load over time (MSN-DB)

3 Research case studies
In the previous section we analyzed I/O traces from live productions servers supporting
online services. These traces were key to understanding these workloads, which differ
considerably from standard benchmark workloads. In addition, traces also allow us to
evaluate new designs, features, and research systems with more realistic workloads. In
this section we summarize briefly the results from three different research projects[2, 3, 4]
at Microsoft Research Cambridge. In each case we highlight how production workload
traces allowed us to evaluate metrics and test hypotheses where benchmark-based
evaluation would not have sufficed.
The research described in this section predates the traces described in Section 2, and
was not specifically focused on online services. It was based on a previously collected set
of traces from small and medium enterprise servers[2, 5]. The traces are ETW disk I/O
traces as described in Section 2.3.
3.1 Disk spin-down for energy savings
In this study we examined the potential for saving energy in enterprise storage by
powering down storage hardware during periods of idleness[2]. Previous work had
claimed that there was little scope for power savings in enterprise storage since server I/O
workloads had little idle time[6]. However, based on I/O traces from a range of
small/medium enterprise servers, there is substantial idle time, mostly at night. This
diurnal pattern reflects the user-driven load on the servers.
During periods of low load, idle times are further lengthened by write off-loading[2]:
temporarily logging writes from several spun-down storage volumes to a single spun-up
volume. With write off-loading, spinning disks down during idle periods saves 45-60% of
the disk power. However, there is a response time penalty for requests to a powered-down
volume, which must be spun up to service read requests. This happens rarely in the
traces, but the penalty is large.
Both the costs and benefits of write off-loading depend on the variation in I/O load
over time, specifically the existence of large amounts of idle time. Standard benchmarks
do not capture this property and would not tell us anything about potential energy savings
for real workloads. For example, TPC-C is a saturation benchmark and hence by design
has little idle time at the storage level[6] (TPC-C’s successor, TPC-E, has a similar, albeit
lighter, steady-state I/O load).
3.2 Burst absorption
Write off-loading can also be used during periods of high load, i.e. bursts[3]. Here the aim
is not energy savings but reducing the high I/O response times seen during such bursts. A
volume under heavy load can temporarily off-load writes to lightly loaded volumes: this

improves performance both for writes (since they are redirected) and for reads (since they
see less contention from writes. When the volume’s load level subsides, the off-loaded
data is reclaimed and subsequently deleted from the remote volumes. If bursts are short
and have sufficient idle time in between, only a small amount of capacity is used on the
remote volumes, and only for a small amount of time.
An evaluation of this technique using disk I/O traces from a large Exchange server with
over 100 spindles, showed a 1.4 to 70 times reduction in response times at peak load. Note
that the evaluation is only meaningful when both bursts in I/O load as well as the idle
periods following them, are correctly captured. Further, the performance benefits depend
on the read/write mix and the access locality of I/O during the burst. Thus the
performance is strongly tied to workload-specific behavior, which is best captured by a
trace.
3.3 Evaluating solid-state disks (SSDs)
We have also used disk I/O traces to drive a cost-benefit analysis of the potential uses of
SSDs in enterprise storage[4]. The analysis is based on a tool that computes the cheapest
storage configuration that will satisfy all the requirements for a given workload: capacity,
random-access I/O, sequential I/O, and fault-tolerance. It considers disk-only
configurations, SSD-only configurations, and hybrid configurations where SSDs are used
as an intermediate tier.
To adequately provision storage for a workload, we must satisfy several requirements:
capacity, random-access I/O rate, and sequential bandwidth. The best configuration is the
one that satisfies all workload requirements at the lowest cost. SSDs score much higher
than disks on some metrics (e.g. IOPS/$) but much lower on others (GB/$). Thus the
provisioning decision depends on the demand for the different metrics, which we
estimated from production workload traces. Thus while a TPC-C benchmark is always
configured to be ―IOPS-bound‖, we found that most real workloads become capacity-
bound when using SSDs, due to the very high cost per GB of SSDs. Overall, we found
that few workloads had a sufficiently high IOPS/GB ratio to warrant replacing disks by
SSDs at current prices.
In this research we also observed one disadvantage of evaluation based on disk I/O
traces. Trace replay relies on an "open loop" assumption, i.e., an assumption that the rate
of I/O requests would be the same no matter what storage was used. From an open-loop
I/O model we cannot compute the effect of alternate storage configurations on higher-
level application performance metrics such as transaction rate. Benchmarks, on the other
hand, can give these higher-level performance metrics, but do not realistically model the
application. Thus we need a hybrid approach that combines the realism of traces with the
"end-to-end" measurement given by benchmarks. We will explore this idea further in
Section 5.

4 Tracing guidelines
The value of tracing production servers is that they provide a very realistic picture of real
user-driven workloads. However this also presents a challenge: the tracing must be done
without impacting the efficient operation of the service. This section provides some
recommended techniques and processes that can be used for collecting traces from
production servers.
The first step in tracing production servers is establishing communication with the
people who can authorize trace collection, demonstrating the value of tracing to them, and
convince them of low impact on the operations team. Also one needs to find a sponsor
with sufficient influence to get past the inevitable initial negative reaction, and convince
the legal group that the rewards outweigh the risks. The primary legal concerns will be
safeguarding company IP and anonymizing any personally identifiable information (PII).
For ETW traces of storage activity, we have already convinced Microsoft Legal that
traces can be sufficiently sanitized to remove PII, and thus have a very useful precedent
for others to reference. Once collection has been authorized, the people gathering the
actual traces must be provided with sufficient detail about the "How-To" and logistics of
tracing (e.g., where to store traces, how to sanitize and transfer them). Having a clear set
of guidelines and instructions as well having an automated process for tracing goes a long
way to smooth this process.
Once you have one or more precedents of successful tracing efforts, convincing the
next set of participants is much easier. However, it takes only one instance of a negative
impact from tracing to make it extremely difficult to obtain future traces. Thus, it is wise
to be very conservative during the initial phases of collecting traces – e.g., by collecting
traces for shorter durations or at lower rates, by directly monitoring the performance
impact of tracing, and by providing precise guidelines to the operations team. Production
environments often run ―stress‖ benchmarks for testing their deployments. Sample traces
from the stress environment can help to estimate the worst case impact of tracing. Also
make sure to be sensitive and responsive to the concerns expressed by the operations staff.
At least initially, tracing is an imposition on their work schedule, perhaps with no proven
upside and a nontrivial potential for a job-threatening downside.
When actually collecting traces there are several factors to consider: here we describe
the most important ones and some guidelines to address each.
Performance impact
Typically, the runtime tracing overhead as well as logistics such as trace size and
available space need to be considered. It is a recommended best practice to take a sample
trace on any production server before deployment. It is also recommended to store the
trace on a separate disk or network share, if available, so tracing activity does not impact
the storage I/O traffic of the real workload. In cases where this is not possible, the tracing-
related I/Os can be filtered out during post processing.

For the worst case scenario, factors to consider include the maximum peak workload,
the possibility of system failures, and the ability to stop trace collection in case of a real or
perceived emergency. For example, ETW tracing can be stopped either programmatically
or from the command line at any time during the trace collection process.
Operations Impact
Providing automated scripts for capturing traces and setting up a process for transferring
the traces from the production environment reduces the actual time an operations engineer
has to spend collecting the traces. The operations engineers will also need to provide
information about the system configuration, especially the storage subsystem hardware,
which may not be available directly to the operating system (e.g., any hardware RAID
configuration, storage cache configuration, and the number of physical spindles). It is
useful to know if a backup, replication, or rebalancing operation is in progress during the
trace capture, or if the workload has innate periodic or phased behavior that can be tagged
during trace post-processing. Long enough traces should be captured since periodic
activity can have a significant impact on the characteristics of the workload.
Security and access
The security of the production servers as well as the trace content must be considered.
Typically kernel level trace collection tools need administrator privileges on servers, and
they should come from a trusted source (e.g. via digital signatures). The traces may
contain personally identifiable information (PII) in the form of filenames, directory paths,
or process names. These same fields could also expose confidential application or
hardware configuration detail. All information captured by the trace events should be
disclosed beforehand and cleared by the appropriate parties. Post processing tools can
sanitize and encrypt the traces or selected portions after they are captured.
Most production servers are insulated from the other systems on the corporate network.
They can be accessed only from dedicated systems such as boundary servers that have
additional access restrictions. If any of the servers along this chain do not have enough
space to store the traces, then transferring them becomes more difficult. In one case we
encountered, a boundary server had no available permanent storage space at all. This was
by design, for security. The transfer of traces had to be done serially from the temporary
drive of the boundary server via an automated script to iteratively check available space
and transfer files one at a time. If systems along the path are under the control of different
administrators with different access rights, coordinating trace transfers can be challenging.
Excessive tracing
Sometimes trace providers can be too aggressive in collecting traces. We encountered one
case where the operations team collected day-long traces from a large number of servers,
exhausting the space on the trace storage server. This experience taught us to carefully
select representative servers to avoid the storage and processing overhead of tracing
servers with basically identical workloads.

5 Challenges
Although block I/O tracing is a very valuable tool for understanding workload
performance as well as server provisioning, it is not a panacea. Here we discuss several
challenges, limitations, and directions for future research.
5.1 End-to-end tracing
Trace replay at the block I/O level is generally performed open-loop. This ignores
feedback effects, e.g., a faster storage system could have higher overall throughput and as
a result receive a higher request rate. Thus while I/O tracing can help to size the storage
layer to avoid overload and give good response times, it cannot predict overall server
throughput. Depending on the provisioning task, traces from other components, such as
the main memory buffer cache, CPU scheduler, and network stack may also be required.
Ideally, all the individual resource utilizations of each request (e.g., SQL statement) are
captured, from the moment the request enters the system until it exits. Such end-to-end
tracing is very useful for holistic system analysis. For example, we built a Resource
Advisor prototype for SQL Server that, given an end-to-end trace, can answer ―what-if‖
questions about upgrading system resources[7]. E.g., "What would be the throughput of
transaction type X if the amount of memory in the system were doubled?"
In general, the idea of end-to-end tracing is that traces be collected simultaneously
from multiple levels of the system. This allows maximum flexibility in characterizing the
workload and its use of different system resources such as CPU, memory, network, and
disk I/O. For example:
1. Traces at the SQL statement level can be used to evaluate the overall throughput of
a proposed configuration.
2. Correlated traces of CPU, network, and disk usage can be used to find out which
of the resources dominates throughput and latency, as well as evaluate ―what-if‖
questions about bottleneck shifts for entire workload or a part of the workload.
3. SQL buffer cache traces can address ―what-if‖ questions about memory sizing.
Our experience indicates that the overhead of collecting large amount of traces varies
widely based on the number of events captured, the hardware configuration, the specific
type of workload, and the workload intensity. The overhead can be reduced arbitrarily
through sampling, i.e. selective enabling of events at runtime.
Much, though not all, of the support for end-to-end tracing on a single machine already
exists today. For example, both Windows and SQL Server can post thread context switch
events to ETS to enable tracking of CPU usage and control flow of concurrent threads.
True end-to-end tracing would also track requests as they move across different tiers and
machines on the network. This could require modification of standard network protocols
to enable matching requests and events across systems, or perhaps a new layer in the
network driver stack to communicate end-to-end metadata for individual requests.

5.2 Scaling and sampling
A second limitation of trace-based evaluation is the difficulty of scaling trace replay up or
down. This limitation is shared by most benchmarks. For example, in the evaluation of
Everest (Section 3.2), our test bed was too small to accommodate the traces from all
volumes collected. Hence, we had to "scale down" the tracing by making a decision as to
which traces to incorporate (three of the volumes were chosen). Scaling up is similarly
difficult. For example, if one collects traces from three volumes and has a testbed of 1000
machines, one might use some mixture or permutation of the traces from the three
volumes and duplicate it 997 times. It is unclear that such scaling reflects reality.
Large-scale online services have a single application that is load-balanced across a
large number of servers. Thus a good approach to scaling would be to apply statistical
tests to capture similarities between traces from many servers. This would ensure that the
traces remain representative. The challenge is to devise the appropriate tests for any given
purpose, e.g., provisioning, simulation of new system design, etc.
5.3 Workload model extraction
Trace replay and simulation is more effective for capturing workload specifics than
benchmarks. However, benchmarks are standardized, simple, and scalable (although
typically only linearly along one dimension). To ideally represent a workload class, we
would extract key features of workloads and use them to construct a parameterized
workload model and hence a representative custom benchmark. The parameter values
may be based actual trace characteristics, or on hypothetical workloads.
A production workload typically contains a variety of asynchronous and synchronous
activities occurring in parallel. Thus a key component of modeling this complex activity is
identifying the sub-workloads. As an example, a workload may consist of periods of
heavy as well as light activity. These may be further divided into regions of read-heavy
versus write-heavy activity, which may be further divided into sequential and random
activity. Time-varying characteristics include not only the well-known concept of
burstiness (i.e., workload intensity variations at short time scales) but also periodicity at
different time scales, e.g. diurnal patterns.
Finer granularity leads to better simulation but also increases the complexity of the
benchmark. It is essential to identify the point of diminishing returns, where the simulated
benchmark is "close enough" to the real workload and provide the necessary level of
accuracy. Tools can be written to automatically extract sub-workloads based on heuristics;
to simulate these workloads through a I/O request generator; and, to compare and contrast
various load metrics produced by the simulated workload against the original trace[8].

6 Conclusion
We analyzed I/O workload trace from the structured storage tier in four online services.
Our analysis shows that real-world workloads have very different characteristics from
TPC benchmarks in terms of basic metrics such as IOPS/GB and read/write ratios, as well
as in time-varying characteristics such as peak-to-mean ratios and diurnal patterns.
We believe there is a need for greater use of traces when designing benchmarks and
also when designing systems for deployment. Benchmarks should derive burstiness
metrics, request mixes, and think times from real traces. They should also mimic the
periodic load variations found in real workloads. This calls for more flexible and tunable
benchmarks. In addition, it would be advantageous for the research community to have
access not only to more realistic benchmarks, but also to the traces upon which such
benchmarks are based. For example, the TPC could create and maintain a database trace
repository similar to that maintained by the Storage Networking Industry Association
(SNIA)[9]]. The traces used for the research described in Section 3 have been contributed
to the SNIA repository. Hence, we call on the TPC to create such a repository and
encourage enterprises to trace their productions systems and to make the traces (suitably
anonymized and obfuscated) available for research purposes.
References
[1] Hamilton, J.: Internet-scale service efficiency.
http://mvdirona.com/jrh/TalksAndPapers/JamesRH_Ladis2008.pdf (September 2008)
[2] Narayanan, D., Donnelly, A., Rowstron, A.: Write off-loading: Practical power management for
enterprise storage. In: Proc. USENIX Conference on File and Storage Technologies (FAST), San
Jose, CA (February 2008) 256–267
[3] Narayanan, D., Donnelly, A., Thereska, E., Elnikety, S., Rowstron, A.: Everest: Scaling down
peak loads through I/O off-loading. In: Proc. Symposium on Operating Systems Design and
Implementation (OSDI), San Diego, CA (December 2008) 15–28
[4] Narayanan, D., Thereska, E., Donnelly, A., Elnikety, S., Rowstron, A.: Migrating enterprise
storage to SSDs: analysis of tradeoffs. In: Proceedings of EuroSys 2009, Nuremberg, Germany,
ACM (March 2009)
[5] Kavalanekar, S., Worthington, B., Zhang, Q., Sharda, V.: Characterization of storage workload
traces from production Windows servers. In: Proc. IEEE International Symposium on Workload
Characterization (IISWC), Austin, TX (October 2008) 119–128
[6] Zhu, Q., Chen, Z., Tan, L., Zhou, Y., Keeton, K., Wilkes, J.: Hibernator: Helping disk arrays
sleep through the winter. In: Proceedings of the ACM Symposium on Operating Systems
Principles (SOSP’05), Brighton, United Kingdom (October 2005)
[7] Narayanan, D., Thereska, E., Ailamaki, A.: Continuous resource monitoring for self-predicting
DBMS. In: Proceedings of IEEE International Symposium on Modeling, Analysis, and
Simulation of Computer and Telecommunication Systems (MASCOTS 2005), Atlanta, GA,
IEEE (September 2005)

[8] Sankar, S., Vaid, K.: Storage characterization for unstructured data in online services
applications. In: Proc. IEEE International Symposium on Workload Characterization (IISWC),
(to appear)
[9] SNIA: IOTTA repository. http://iotta.snia.org/ (January 2009)