Embed Size (px)
DESCRIPTION
Measuring Dynamical Responses of Plants to Environment Change Using Short-lived Radioisotope. Calvin Howell Duke University Physics Triangle Universities Nuclear Laboratory. Measuring Dynamic Biological Responses in Plants using Radioisotopes. Collaboration. C.R. Howell (Physics) - PowerPoint PPT Presentation
Citation preview
C.R. Howell October 2008 1
Measuring Dynamical Responses of Measuring Dynamical Responses of Plants to Environment Change Using Plants to Environment Change Using
Short-lived RadioisotopeShort-lived Radioisotope
Calvin Howell
Duke University Physics
Triangle Universities Nuclear Laboratory
C.R. Howell October 2008 2
C.R. Howell (Physics)C. Reid (Biology)E. Bernhardt (Biology)A.S. Crowell (Physics Postdoc)M. Kiser (Physics graduate student)R. Phillips (Biology Postdoc)
Measuring Dynamic BiologicalResponses in Plants using Radioisotopes
Collaboration
C.R. Howell October 2008 3
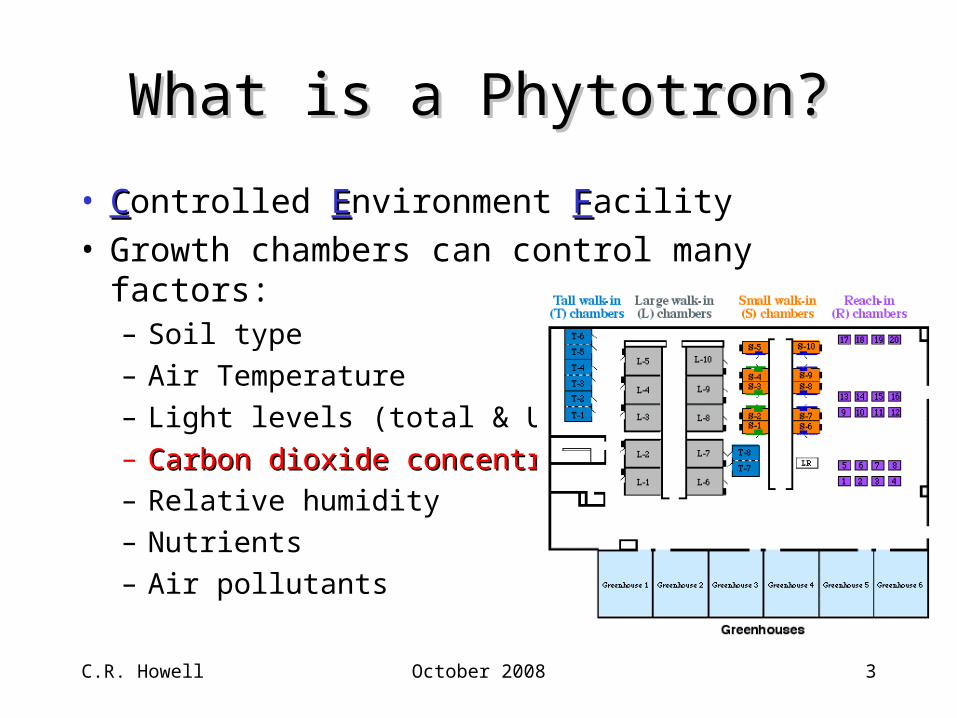
What is a Phytotron?What is a Phytotron?
• CControlled EEnvironment FFacility• Growth chambers can control many factors:
– Soil type
– Air Temperature
– Light levels (total & UV)
– Carbon dioxide concentrationCarbon dioxide concentration
– Relative humidity
– Nutrients
– Air pollutants
C.R. Howell October 2008 4
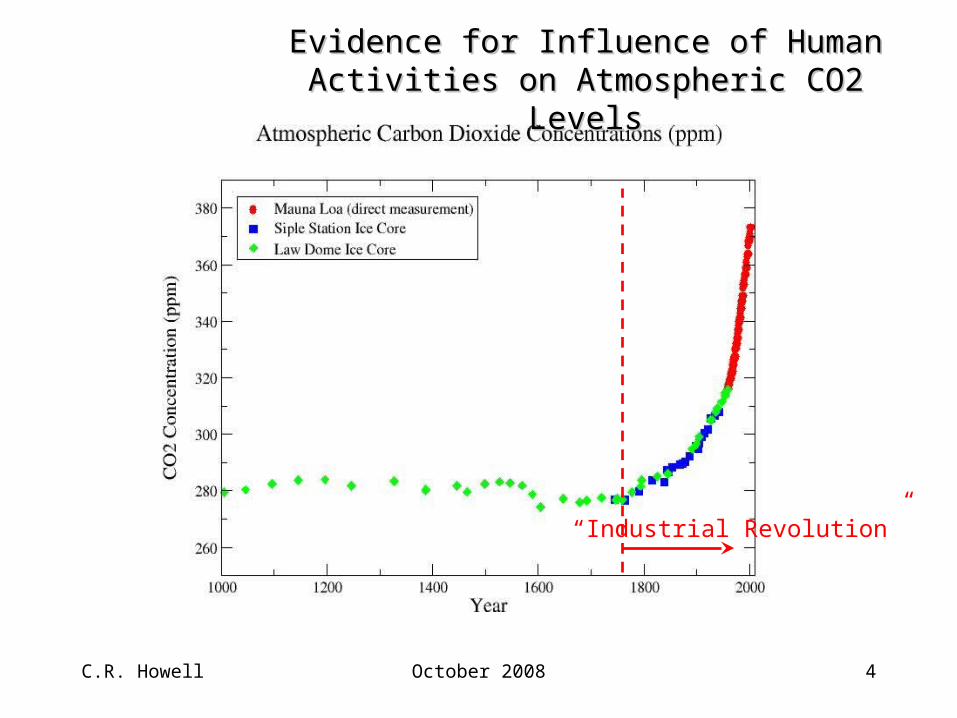
Evidence for Influence of Human Activities on Evidence for Influence of Human Activities on Atmospheric CO2 LevelsAtmospheric CO2 Levels
“Industrial Revolution”
C.R. Howell October 2008 5
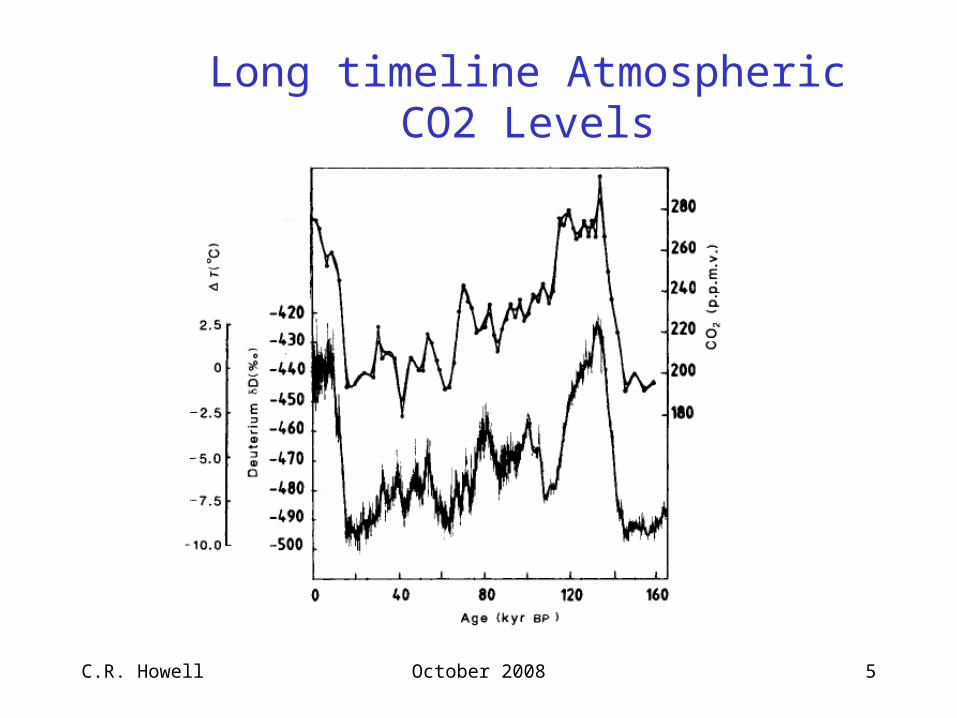
Long timeline Atmospheric CO2 Levels
C.R. Howell October 2008 6
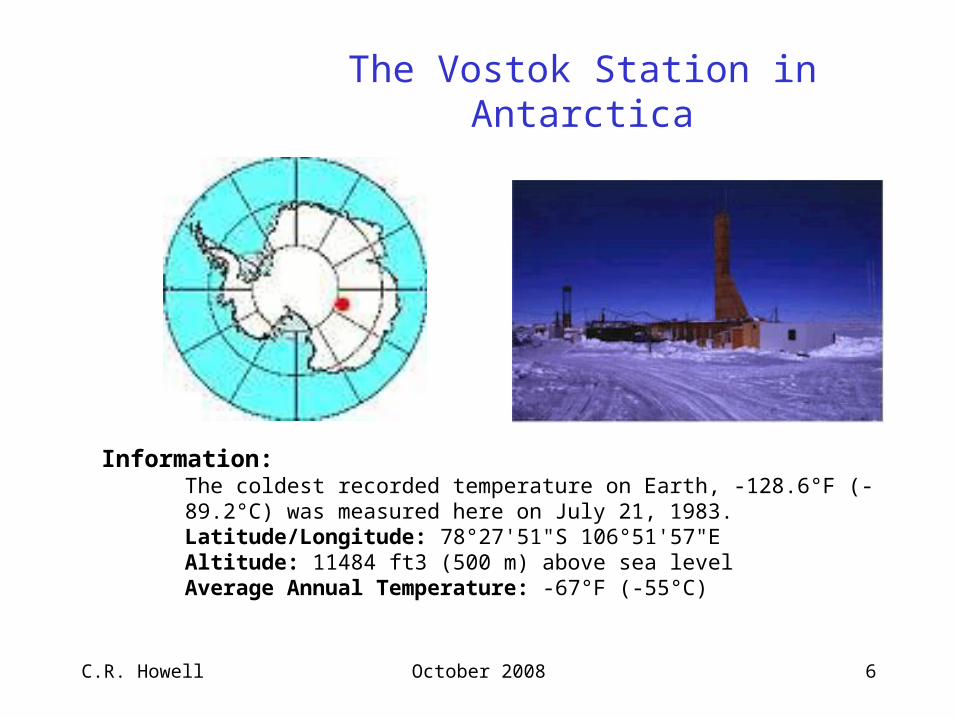
The Vostok Station in Antarctica
Information: The coldest recorded temperature on Earth, -128.6°F (-89.2°C) was measured here on July 21, 1983. Latitude/Longitude: 78°27'51"S 106°51'57"EAltitude: 11484 ft3 (500 m) above sea levelAverage Annual Temperature: -67°F (-55°C)
C.R. Howell October 2008 7
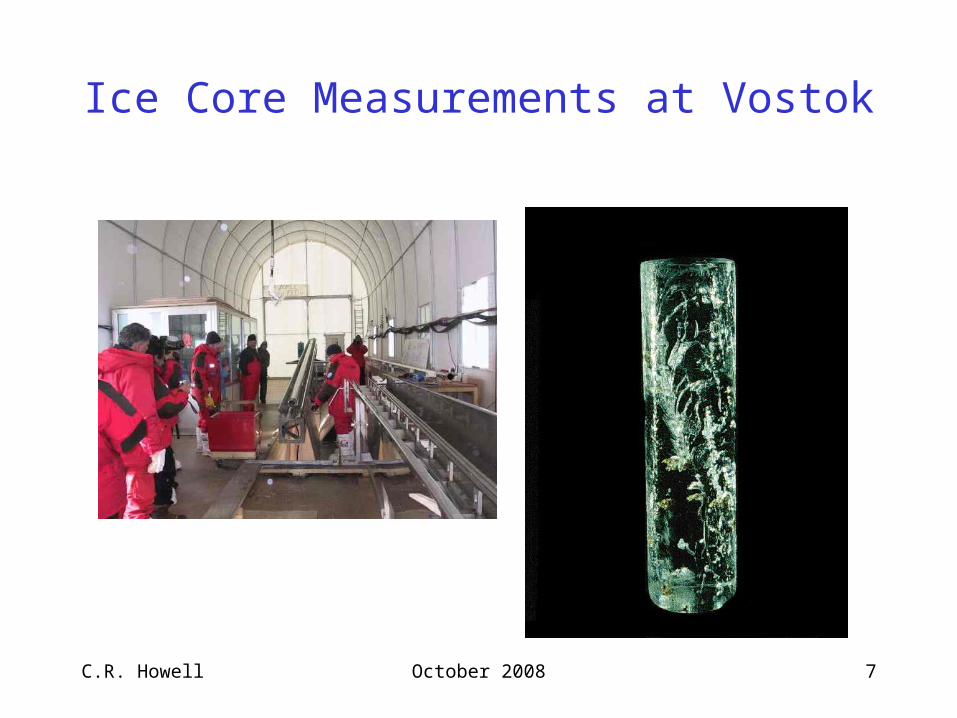
Ice Core Measurements at Vostok
C.R. Howell October 2008 8
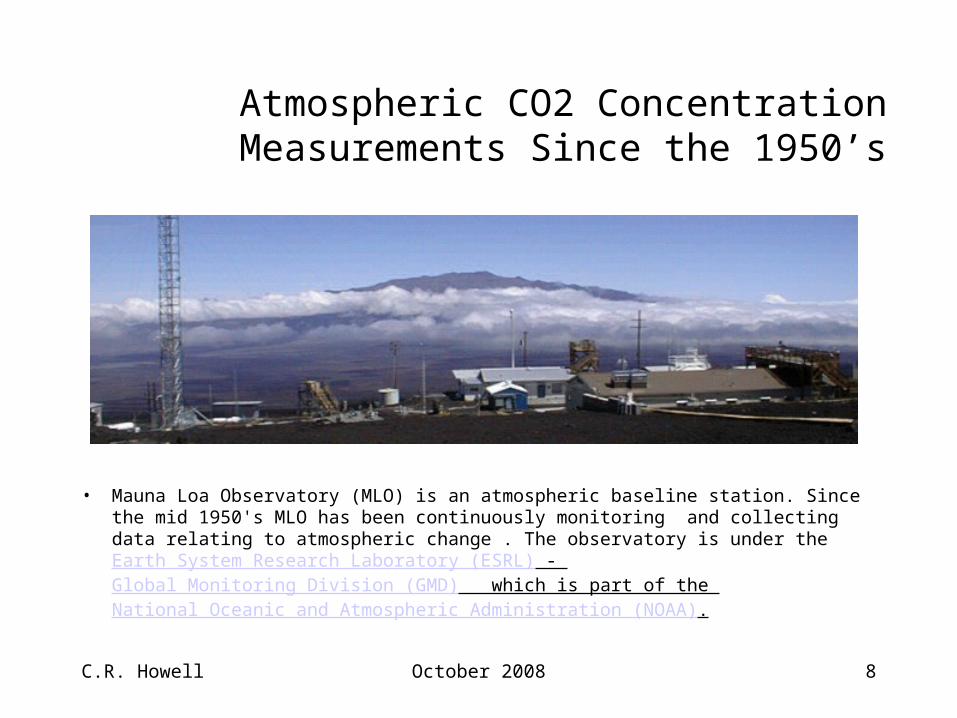
Atmospheric CO2 Concentration Measurements Since the 1950’s
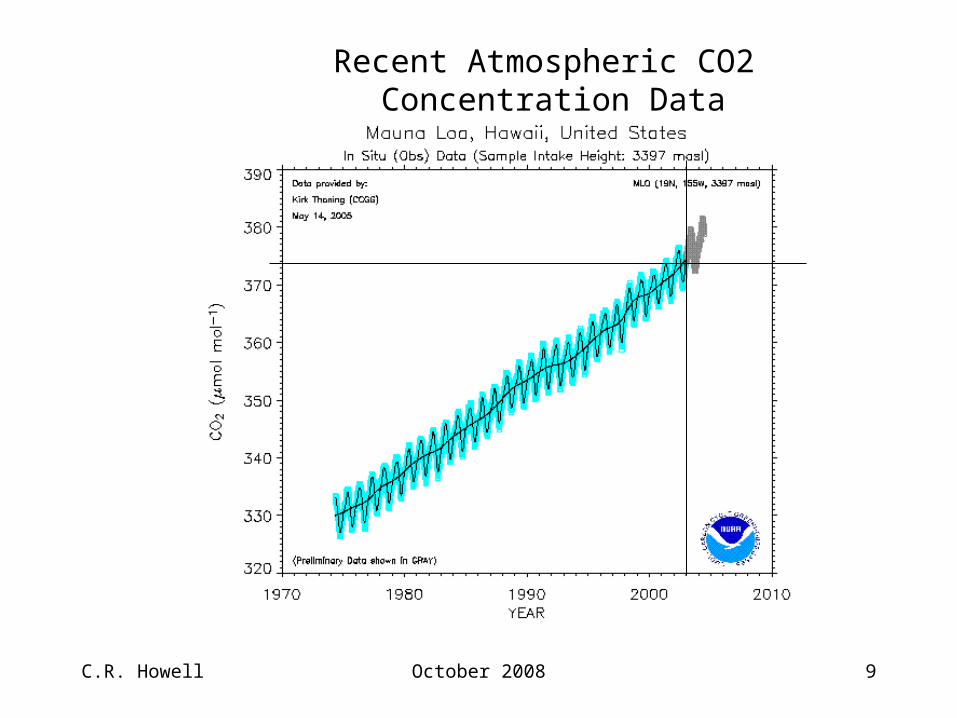
• Mauna Loa Observatory (MLO) is an atmospheric baseline station. Since the mid 1950's MLO has been continuously monitoring and collecting data relating to atmospheric change . The observatory is under the Earth System Research Laboratory (ESRL) - Global Monitoring Division (GMD) which is part of the National Oceanic and Atmospheric Administration (NOAA).
C.R. Howell October 2008 9
Recent Atmospheric CO2 Concentration Data
C.R. Howell October 2008 10
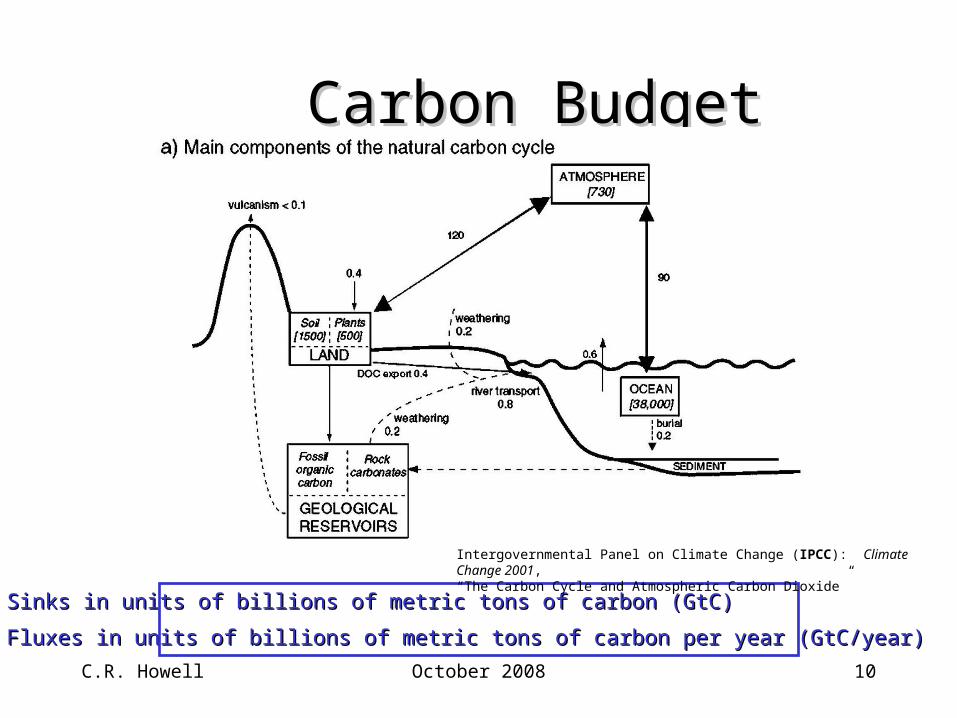
Carbon BudgetCarbon Budget
Sinks in units of billions of metric tons of carbon (GtC)Sinks in units of billions of metric tons of carbon (GtC)
Fluxes in units of billions of metric tons of carbon per year (GtC/year)Fluxes in units of billions of metric tons of carbon per year (GtC/year)
Intergovernmental Panel on Climate Change (IPCC): Climate Change 2001, “The Carbon Cycle and Atmospheric Carbon Dioxide”
C.R. Howell October 2008 11
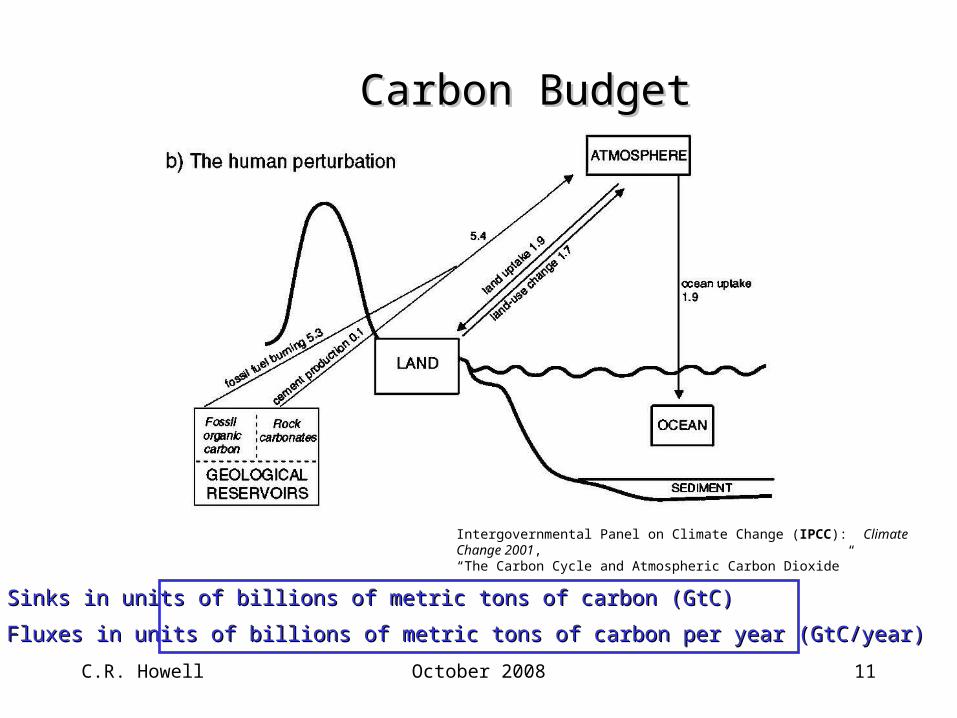
Carbon BudgetCarbon Budget
Sinks in units of billions of metric tons of carbon (GtC)Sinks in units of billions of metric tons of carbon (GtC)
Fluxes in units of billions of metric tons of carbon per year (GtC/year)Fluxes in units of billions of metric tons of carbon per year (GtC/year)
Intergovernmental Panel on Climate Change (IPCC): Climate Change 2001, “The Carbon Cycle and Atmospheric Carbon Dioxide”
C.R. Howell October 2008 12
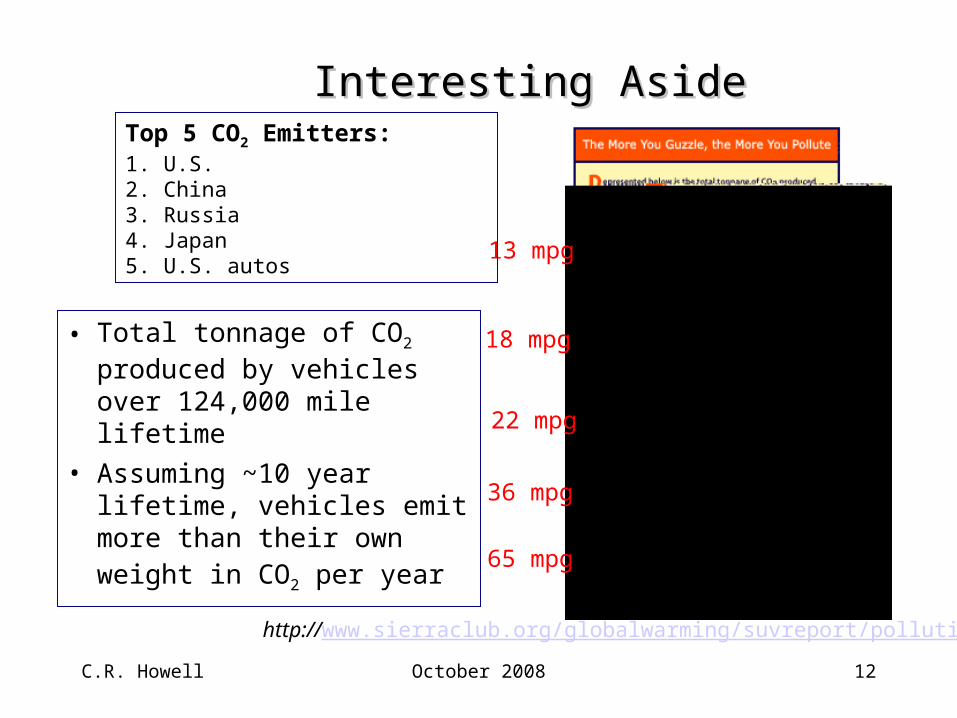
Interesting AsideInteresting Aside
• Total tonnage of CO2 produced by vehicles over 124,000 mile lifetime
• Assuming ~10 year lifetime, vehicles emit more than their own weight in CO2 per
year
13 mpg
36 mpg
22 mpg
18 mpg
65 mpg
http://www.sierraclub.org/globalwarming/suvreport/pollution.asp
Top 5 CO2 Emitters:1. U.S.2. China3. Russia 4. Japan5. U.S. autos
C.R. Howell October 2008 13
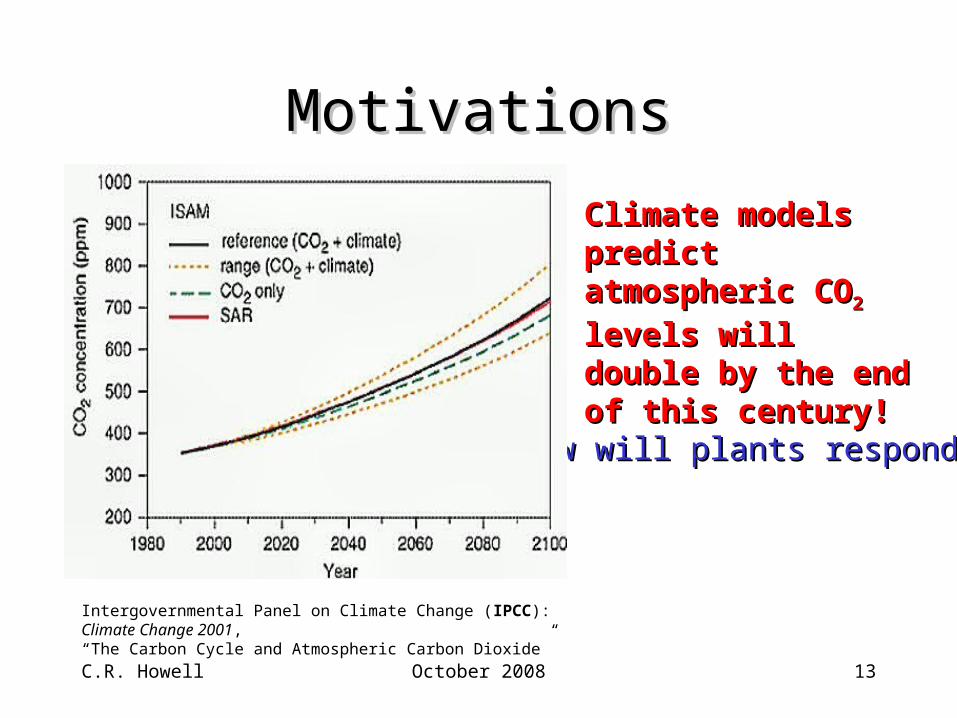
MotivationsMotivations
Intergovernmental Panel on Climate Change (IPCC): Climate Change 2001, “The Carbon Cycle and Atmospheric Carbon Dioxide”
Climate models predict Climate models predict atmospheric COatmospheric CO22 levels levels
will double by the end will double by the end of this century!of this century!
How will plants respond?How will plants respond?
C.R. Howell October 2008 14
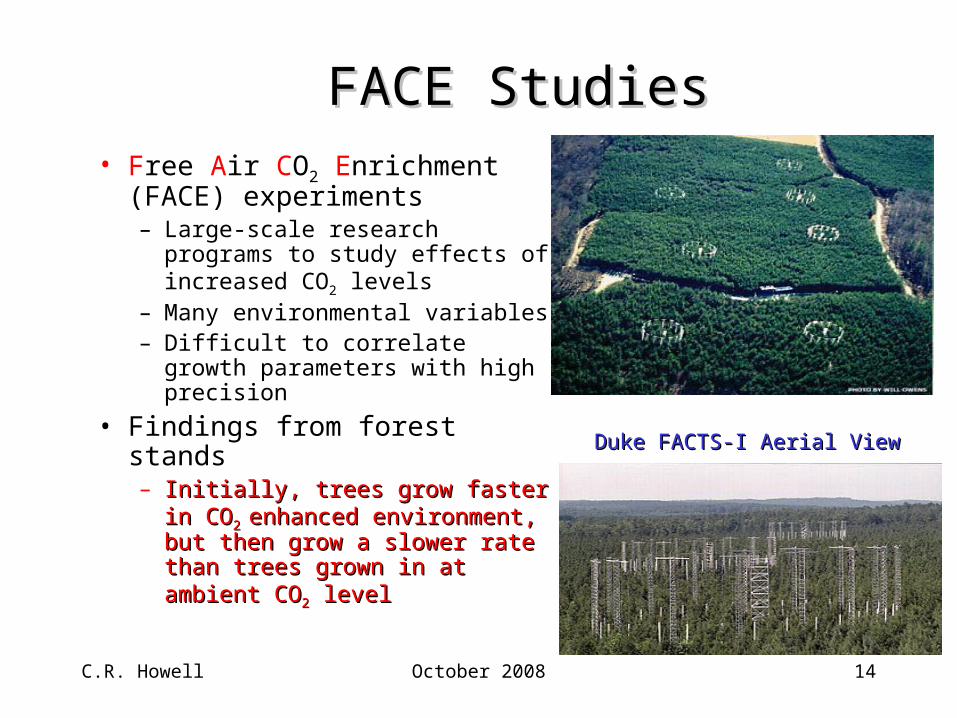
FACE StudiesFACE Studies• Free Air CO2 Enrichment
(FACE) experiments– Large-scale research programs to
study effects of increased CO2 levels
– Many environmental variables– Difficult to correlate growth
parameters with high precision
• Findings from forest stands– Initially, trees grow faster in COInitially, trees grow faster in CO2 2
enhanced environment, but then enhanced environment, but then grow a slower rate than trees grow a slower rate than trees grown in at ambient COgrown in at ambient CO22 level level
Duke FACTS-I Aerial ViewDuke FACTS-I Aerial View
C.R. Howell October 2008 15
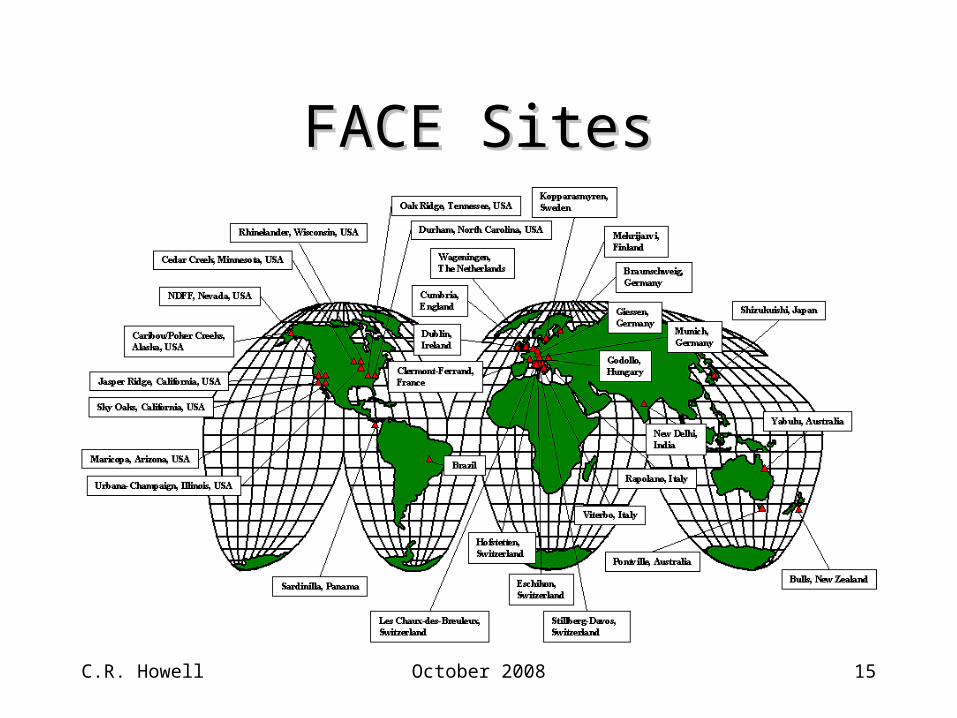
FACE SitesFACE Sites
C.R. Howell October 2008 16
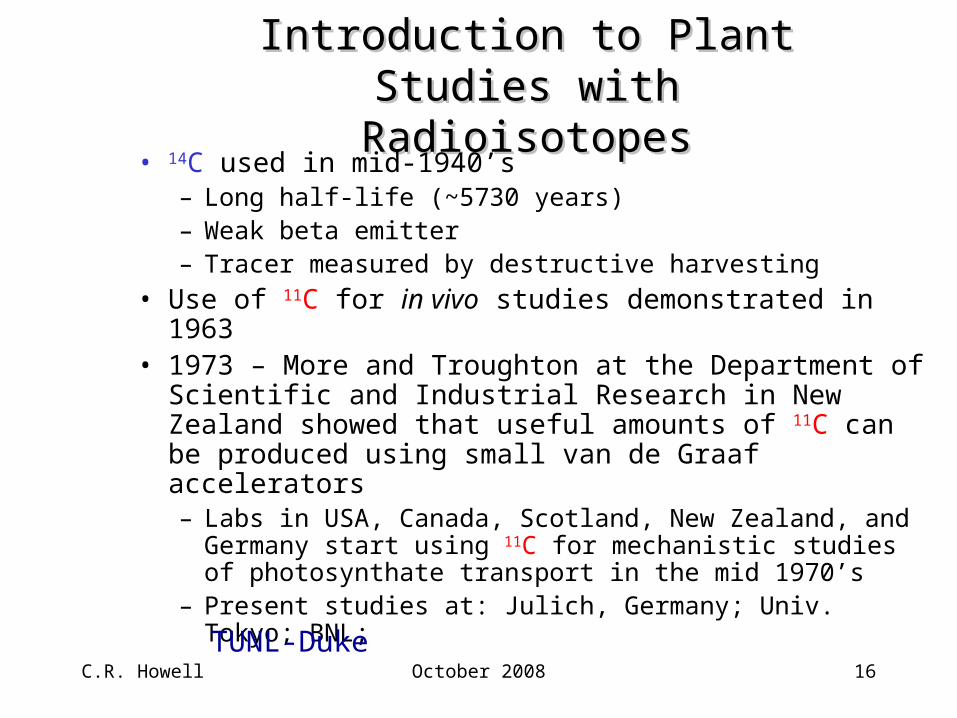
Introduction to Plant Studies with Introduction to Plant Studies with RadioisotopesRadioisotopes
• 14C used in mid-1940’s – Long half-life (~5730 years)– Weak beta emitter– Tracer measured by destructive harvesting
• Use of 11C for in vivo studies demonstrated in 1963• 1973 – More and Troughton at the Department of
Scientific and Industrial Research in New Zealand showed that useful amounts of 11C can be produced using small van de Graaf accelerators– Labs in USA, Canada, Scotland, New Zealand, and Germany
start using 11C for mechanistic studies of photosynthate transport in the mid 1970’s
– Present studies at: Julich, Germany; Univ. Tokyo; BNL; TUNL-Duke
C.R. Howell October 2008 17
Planned Research at the TUNL-Phytotron Facility
1. Studies of CO2 uptake and carbon translation under different environmental conditions
2. Root exudate measurements 3. Nutrient uptake and translocation under different environmental
conditions
C.R. Howell October 2008 18
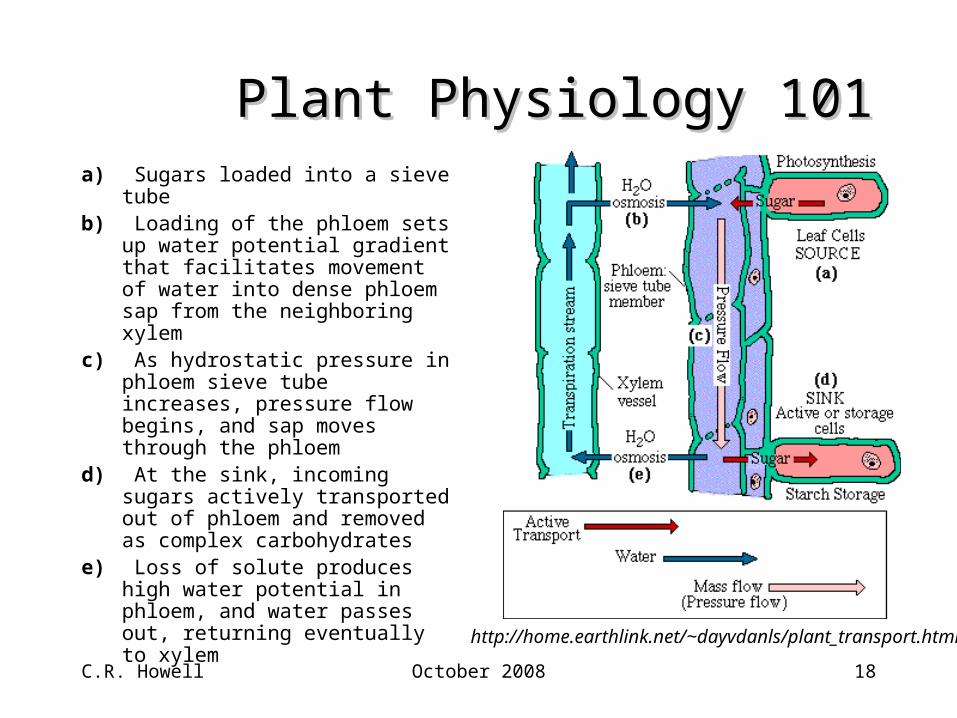
Plant Physiology 101Plant Physiology 101a) Sugars loaded into a sieve tubeb) Loading of the phloem sets up
water potential gradient that facilitates movement of water into dense phloem sap from the neighboring xylem
c) As hydrostatic pressure in phloem sieve tube increases, pressure flow begins, and sap moves through the phloem
d) At the sink, incoming sugars actively transported out of phloem and removed as complex carbohydrates
e) Loss of solute produces high water potential in phloem, and water passes out, returning eventually to xylem http://home.earthlink.net/~dayvdanls/plant_transport.html

C.R. Howell October 2008 19
Carbon-11 ProductionCarbon-11 Production
p + 14N 11C + ++1
5
2 3 4
2
3
1 Produce H- ions in negative ion source
4
5
Accelerate H- ions toward +5MV terminal
Strip off electrons with carbon foil (H- p)
Accelerate protons away from +5MV terminal
Bend p in magnet and collide on 14N target
C.R. Howell October 2008 20
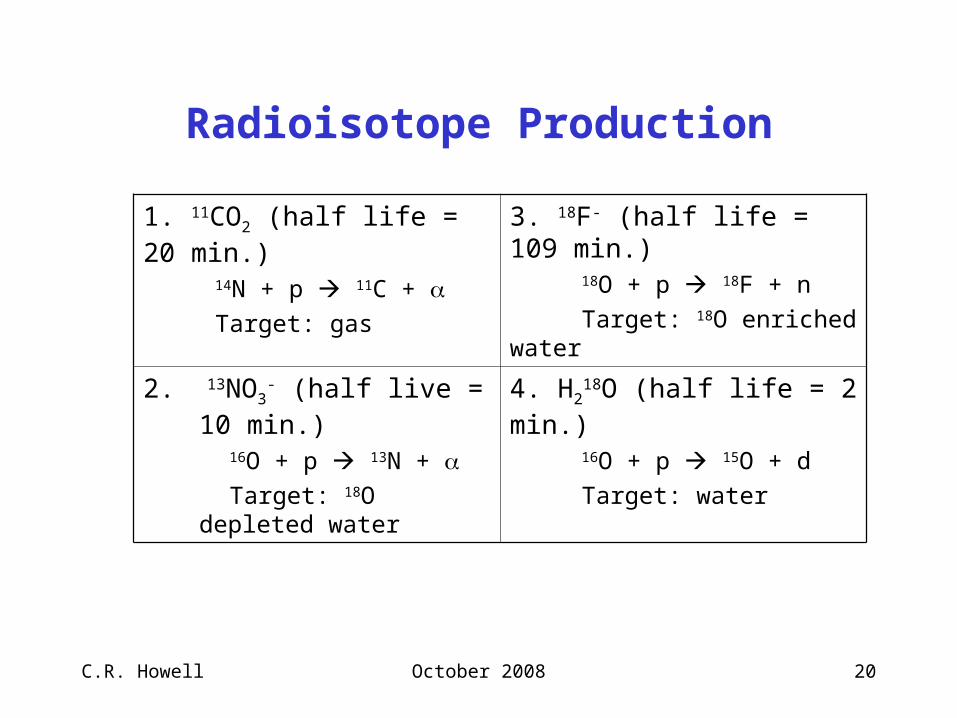
Radioisotope Production
1. 11CO2 (half life = 20 min.)
14N + p 11C + Target: gas
3. 18F- (half life = 109 min.) 18O + p 18F + n
Target: 18O enriched water
2. 13NO3- (half live = 10 min.)
16O + p 13N + Target: 18O depleted water
4. H218O (half life = 2 min.)
16O + p 15O + d
Target: water
C.R. Howell October 2008 21
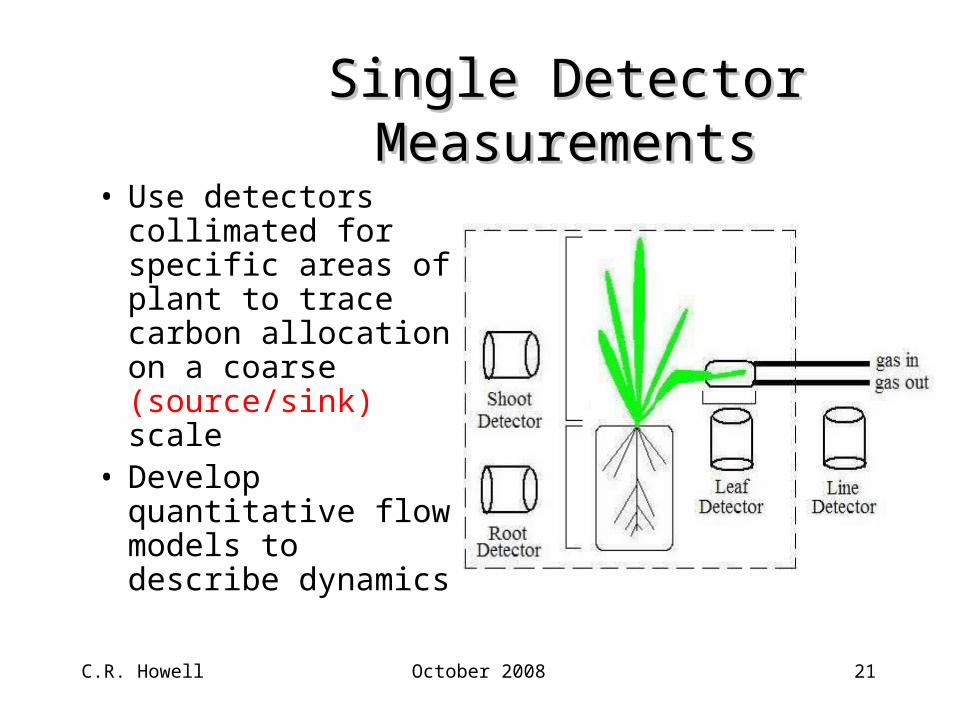
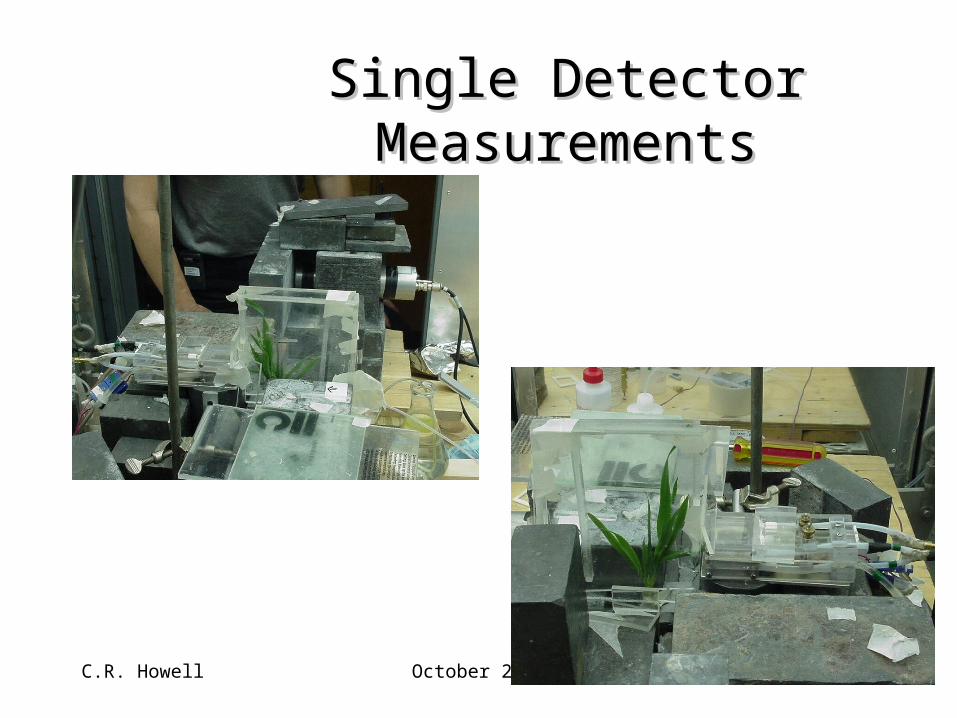
Single Detector MeasurementsSingle Detector Measurements
• Use detectors collimated for specific areas of plant to trace carbon allocation on a coarse (source/sink) scale
• Develop quantitative flow models to describe dynamics
C.R. Howell October 2008 22
Single Detector MeasurementsSingle Detector Measurements
C.R. Howell October 2008 23
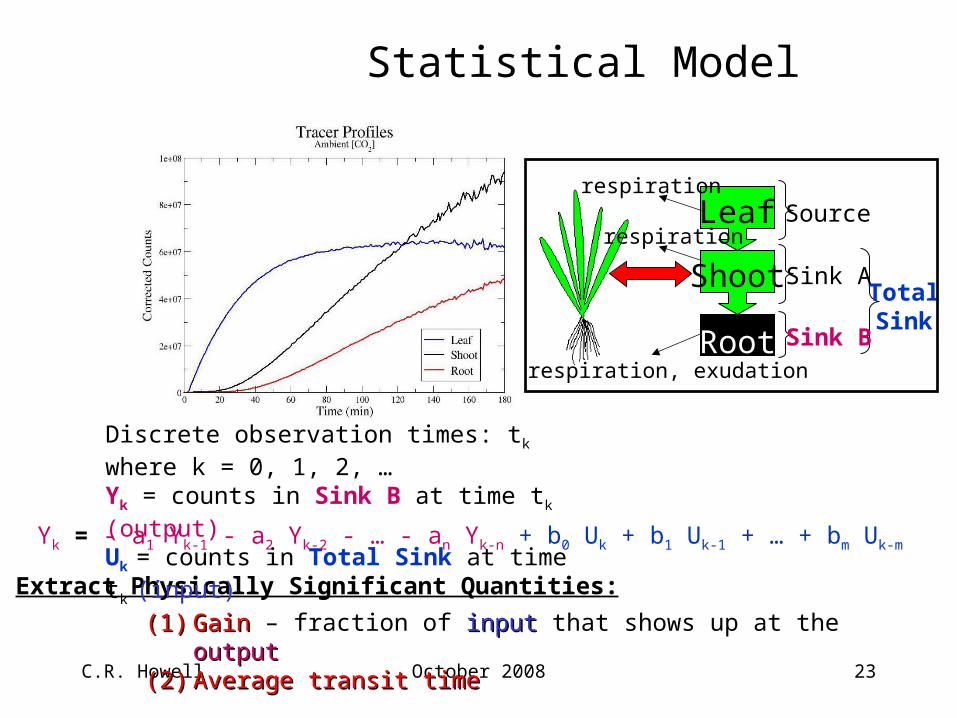
Statistical Model
Extract Physically Significant Quantities:
(1)(1) GainGain – fraction of inputinput that shows up at the outputoutput(2)(2) Average transit timeAverage transit time
Discrete observation times: tk where k = 0, 1, 2, … Yk = counts in Sink B at time tk (output)Uk = counts in Total Sink at time tk (input)
Yk = - a1 Yk-1 - a2 Yk-2 - … - an Yk-n + b0 Uk + b1 Uk-1 + … + bm Uk-m
Leaf
Shoot
Root
Source
TotalSink
Sink A
Sink B
respiration
respiration
respiration, exudation
C.R. Howell October 2008 24
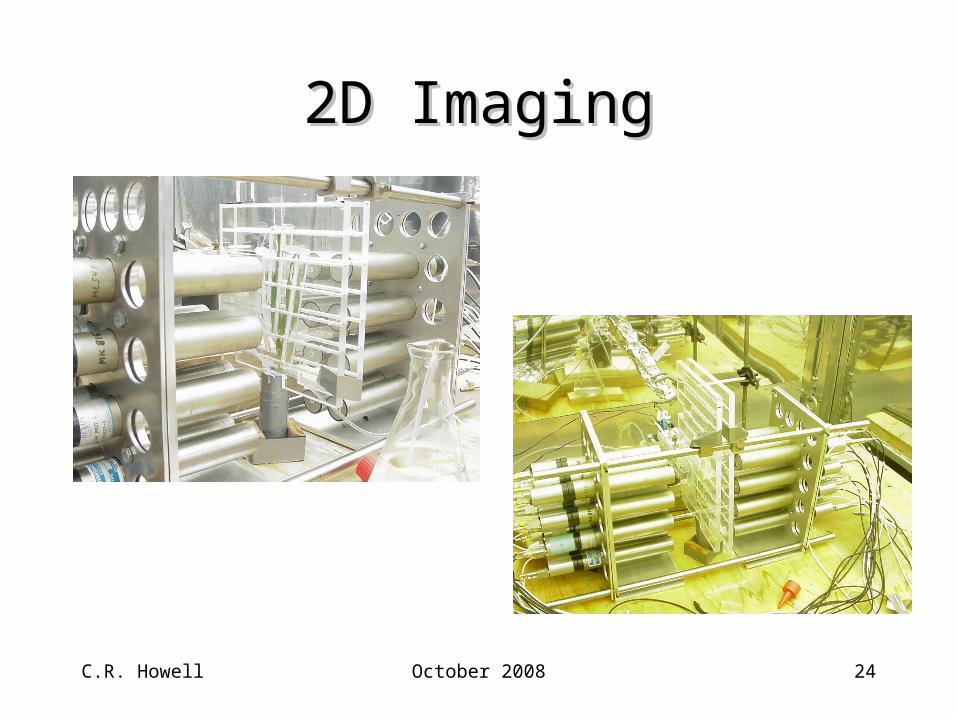
2D Imaging2D Imaging

C.R. Howell October 2008 25
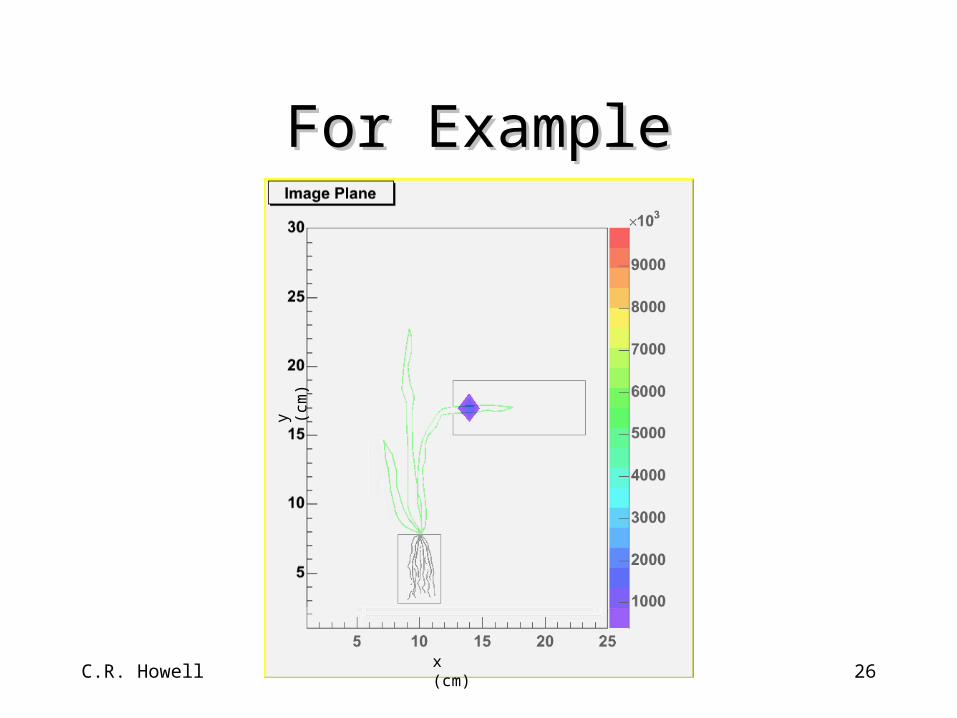
For ExampleFor Example
x (cm)
y (c
m)
C.R. Howell October 2008 26
For ExampleFor Example
x (cm)
y (c
m)
C.R. Howell October 2008 27
Immediate PlansImmediate Plans
• Develop system for continuous loading measurements
• Develop system for nutrient uptake studies
• Continue root exudate experiments
• Develop high-resolution 2D PET imager
C.R. Howell October 2008 28
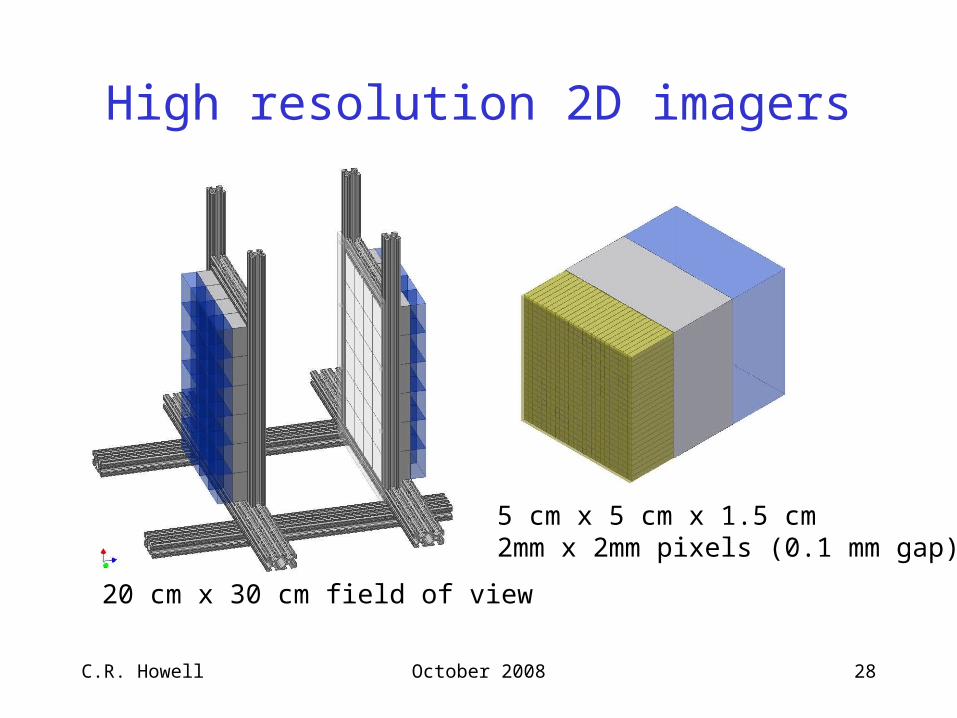
High resolution 2D imagers
5 cm x 5 cm x 1.5 cm2mm x 2mm pixels (0.1 mm gap)
20 cm x 30 cm field of view