Embed Size (px)
Citation preview
Oxford University Press and Journal of Consumer Research, Inc. are collaborating with JSTOR to digitize, preserve and extend access to Journal of Consumer Research.
http://www.jstor.org
Journal of Consumer Research, Inc.
Measuring Emotions in the Consumption Experience Author(s): Marsha L. Richins Source: Journal of Consumer Research, Vol. 24, No. 2 (September 1997), pp. 127-146Published by: Oxford University PressStable URL: http://www.jstor.org/stable/10.1086/209499Accessed: 30-07-2015 01:28 UTC
Your use of the JSTOR archive indicates your acceptance of the Terms & Conditions of Use, available at http://www.jstor.org/page/ info/about/policies/terms.jsp
JSTOR is a not-for-profit service that helps scholars, researchers, and students discover, use, and build upon a wide range of content in a trusted digital archive. We use information technology and tools to increase productivity and facilitate new forms of scholarship. For more information about JSTOR, please contact [email protected].
This content downloaded from 202.130.161.208 on Thu, 30 Jul 2015 01:28:16 UTCAll use subject to JSTOR Terms and Conditions
Measuring Emotions in the ConsumptionExperience
MARSHA L. RICHINS*
Although consumption-related emotions have been studied with increasing fre-quency in consumer behavior, issues concerning the appropriate way to measurethese emotions remain unresolved. This article reviews the emotion measurescurrently used in consumer research and the theories on which they are based;it concludes that the existing measures are unsuited for the purpose of measuringconsumption-related emotions. The article describes six empirical studies thatassess the domain of consumption-related emotions, that identify an appropriateset of consumption emotion descriptors (the CES), and that compare the use-fulness of this descriptor set with the usefulness of other measures in assessingconsumption-related emotions.
T information about the nature of emotions in the consump-tion environment or how best to measure them. Lacking
he role of affective processes is an important subjectof study in consumer behavior (see Cohen and Areni
[1991] for a review). Although most studies of consumer this information, they have tended to rely on precedencewhen choosing measures rather than being guided by anaffect have focused on consumers’ responses to advertis-
ing, research concerning emotions that result from con- informed consideration that matches the measurementmethod to the substantive problem at hand. The presentsumption itself has appeared with increasing frequency
in the literature. Scholars have examined the emotions article attempts to help researchers make better choiceswhen assessing consumption emotions by addressinggenerated by the use of specific products (Holbrook et al.
1984; Mehrabian and Wixen 1986), by services (Oliver three objectives. The first is to examine in a comprehen-sive way the emotional states associated with consump-1994), by one’s favorite possessions (Schultz, Kleine, and
Kernan 1989), or more generally in a variety of consump- tion. The second objective is to assess the usefulness ofexisting emotion measures in assessing consumption-re-tion situations (Derbaix and Pham 1991; Havlena and
Holbrook 1986; Richins, McKeage, and Najjar 1992). lated emotions. Finally, an alternative method for as-sessing consumption-related emotions is proposed andOther research has investigated the relationship between
consumption emotions and satisfaction (e.g., Mano and tested.Oliver 1993; Westbrook 1987; Westbrook and Oliver1991). All of these studies have found emotions to be
MEASURES OF EMOTIONan important component of consumer response, and theimportance of emotions in the sphere of consumer behav-
To assess emotions in the consumption or any otherior has been firmly established.domain, one must be able to characterize emotion andIn their study of consumption-related emotions, con-distinguish it from other states. Unfortunately, this hassumer behavior scholars have based much of their worknot been an easy problem to solve. Plutchik (1980) re-on frameworks of emotion developed in psychology. Al-viewed 28 definitions of emotion. He concluded that therethough the foundation laid by theorists in this field haswas little consistency among the definitions and that manyprovided a useful starting point for investigation, it is notof them were not sufficiently explicit to give a clear ideaclear that the measures of emotion developed by thesewhat an emotion actually is.theorists are appropriate for consumer behavior applica-
Lacking a clear definition, some authors have attemptedtions. At present, consumer behavior scholars have scantto enhance understanding of emotions by more com-pletely specifying their characteristics. One of the clearestexplications of these characteristics, and one that appears*Marsha L. Richins is professor of marketing, College of Businessto be gaining acceptance, was proposed by Ortony, Clore,and Public Administration, University of Missouri, Columbia, MO
65211. She thanks William Havlena for sharing data from his disserta- and their colleagues (Clore, Ortony, and Foss 1987; Or-tion, Kim McKeage for assistance during the early stages of the project, tony, Clore, and Collins 1988). According to their frame-and Chris Allen and Rich Oliver for their insightful comments on an work, an emotion is a valenced affective reaction to per-earlier draft of the manuscript.
ceptions of situations. They exclude from the domain of127
q 1997 by JOURNAL OF CONSUMER RESEARCH, Inc. Á Vol. 24 Á September 1997All rights reserved. 0093-5301/98/2402-0001$03.00
/ 9h0b$$se01 08-11-97 14:51:33 cresa UC: Con Res
This content downloaded from 202.130.161.208 on Thu, 30 Jul 2015 01:28:16 UTCAll use subject to JSTOR Terms and Conditions
128 JOURNAL OF CONSUMER RESEARCH
emotion those descriptors that refer to (1) nonvalenced predominance of negative emotions in Izard’s scale andthe need for a broader sampling of emotions (Laverie,cognitions, such as interest and surprise; (2) bodily states
such as sleepy and droopy; and (3) subjective evaluations Kleine, and Kleine 1993; Mano and Oliver 1993; Oliver1992).of people, such as self-confident or ‘‘feeling abandoned.’’
This characterization of emotion was adopted for pur- Plutchik and Izard have argued that other, more com-plex emotions are the result of mixtures of their ‘‘basic’’poses of the research reported here.
When measuring emotional states that arise during con- emotions. However, the mechanisms by which love, hate,envy, relief, pride, and other everyday emotions can besumption, authors most frequently have used measures
developed by emotion theorists. The measures most com- identified through the use of the DES or Plutchik’s mea-sure have not been well explained. The reliance on basicmonly used for this purpose are described below.1
emotions has been criticized on other grounds as well; aparticularly cogent criticism is offered by Ortony andThe Basic Emotions and Their MeasurementTurner (1990). After an extensive review of the basicemotions literature, these authors conclude that ‘‘there isSome scholars have attempted to order the universe ofno coherent nontrivial notion of basic emotions as theemotions by identifying a set of basic or fundamentalelementary psychological primitives in terms of whichemotions, although there is no widespread agreement con-other emotions can be explained’’ (p. 315). This calls intocerning the number or the nature of basic emotions. Inquestion the validity of measures founded on the notionone approach, basic emotions are viewed as biologicallyof basic emotions.based and universally experienced. The work of two
scholars who take a biological perspective has had partic-ular impact in the field of consumer behavior. The PAD Measure
Both Plutchik (1980) and Izard (1977) place impor-The PAD (pleasure-arousal-dominance) scale devel-tance on the role of emotions in enhancing an organism’s
oped by Mehrabian and Russell (1974) has been used bychances of survival (Darwin [1872] 1979). Plutchik usedmarketing scholars to assess emotional responses to somean evolutionary perspective to identify eight ‘‘primary’’types of marketing stimuli. The objective of this scale isemotions consisting of fear, anger, joy, sadness, accep-quite different from that of measures based on emotiontance, disgust, expectancy, and surprise. According totheory, both in terms of context and content. With respectPlutchik (1980, p. 138), these eight emotions have adap-to context, the PAD scale was designed not to capturetive significance in the struggle for survival and are identi-the entire domain of emotional experience but rather tofiable in some form at all phylogenetic levels in the animalmeasure emotional responses to environmental stimulikingdom. He developed the Emotions Profile Index (Plut-such as architectural spaces. Although the scale may bechik and Kellerman 1974) to measure these emotions insuitable to assess consumers’ responses to store environ-humans. The index contains 62 forced-choice emotionments, for instance, its validity in assessing emotionaldescriptor pairs; responses are transformed into scalesresponses to the interpersonal aspects of shopping andrepresenting each of the eight emotions. Holbrook andconsumption cannot be assumed.Westwood (1989) developed their own shorter measure
A difference in content between the PAD scale andof Plutchik’s primary emotions. Their scale contains threethe other measures is even greater than the differenceadjectives for each emotion, and respondents report thein context. The PAD scale does not purport to measurefelt intensity of each of the adjectives (see also Havlenaemotions per se; instead, it assesses the perceived plea-and Holbrook 1986).sure, arousal, and dominance elicited by a set of environ-Izard examined emotions by focusing on the role facialmental stimuli. It contains 18 semantic differential items,muscle responses associated with emotion play in enhanc-six each for pleasure, arousal, and dominance. One cannoting survival. Based in part on the identification of emo-unequivocally infer the existence of specific emotiontions that are universally associated with and recognizablestates such as joy, guilt, anger, or fear from a person’sin distinctive facial expressions, the 10 fundamental emo-PAD scores. Thus, the PAD scale is best used when ations Izard proposed consist of interest, enjoyment, sur-researcher is interested in measuring the dimensions un-prise, distress (sadness), anger, disgust, contempt, fear,derlying emotion states and does not need to know theshame/shyness, and guilt. Izard’s (1977) Differentialspecific emotions being experienced by study participants.Emotions Scale (DES) measures these 10 emotions and
is available in four forms. The DES-II has been used mostfrequently in consumption emotion research. It contains Measures of Emotion Responses30 adjective items, three to measure each of Izard’s 10 to Advertisingfundamental emotions. Several authors have noted the
Emotion responses to advertising have been investi-gated extensively (see Wiles and Cornwell [1990] for areview of measures). Although research measuring adver-1This article does not attempt a comprehensive review of the emotionstising-induced emotions is useful in its own right, its rele-literature. Interested readers are referred to Cohen and Areni (1991),
Frijda (1986), and Lewis and Haviland (1993). vance to consumption-induced emotions is tangential be-
/ 9h0b$$se01 08-11-97 14:51:33 cresa UC: Con Res
This content downloaded from 202.130.161.208 on Thu, 30 Jul 2015 01:28:16 UTCAll use subject to JSTOR Terms and Conditions
129MEASURING EMOTIONS IN THE CONSUMPTION EXPERIENCE
cause of two important differences between the emotions points are not always clear opposites (e.g., bored andrelaxed; cared for and in control), potentially causing con-induced by advertising and those that occur during con-
sumption. First, many of the emotions elicited by advertis- fusion among respondents. Consumer behavior research-ers have routinely revised or adapted existing emotionsing are vicarious rather than directly experienced and thus
are likely to be of lower intensity. Aaker, Stayman, and measures for use in the consumer context, which suggeststhat they recognize some of these problems.Vezina (1988) have explicitly recognized the low inten-
sity of emotions generated by advertising. Second, many Finally, the appropriateness of using existing measuresto assess emotions elicited in consumption situations isadvertising executions are dramatic enactments that are
capable of representing and perhaps eliciting the entire unknown. Emotions are context specific, and the emotionsthat arise in the context of intimate interpersonal relation-range of feelings available to consumers. The range of
emotions elicited by consumption is probably more re- ships are likely to differ in intensity and quality from theemotions experienced when buying a pair of shoes. Atstricted.
Because of the importance of attention and cognitive its most intense level, love may cause a father to give hislife to rescue his child from a burning building. Intenselyresponse in determining advertising effectiveness, adver-
tising measures frequently assess interest, boredom, skep- experienced anger can result in assault or murder. It isquite unlikely that consumption experiences will result inticism, and other cognitive responses. Although highly
relevant in the advertising context, these reactions are such extremes of emotional intensity.Consumption emotions may also differ in characterprobably less relevant to consumption. Including such
descriptors unnecessarily increases the length and cum- from emotions experienced in other contexts; that is, someemotions experienced in the context of interpersonal rela-bersomeness of a measure when it is used to assess con-
sumption emotions. In addition, many of the advertising tionships may rarely be experienced during consumption.In their desire to represent the full range of emotionalresponse measures were designed for use in a laboratory
setting and are not well suited to use in surveys or field experience, emotion scholars usually examine many pos-sible contexts without focusing on any particular one.studies because of their considerable length. For instance,
Aaker et al. (1988) used 180 feeling descriptors. Whether the measures developed for this larger perspec-tive are efficient and appropriate for the types of emotionsTwo research teams have developed shorter measures.
Batra and Holbrook (1990) describe a scale with 34 emo- experienced in consumption situations has not been sys-tematically investigated. Thus, the validity of the mea-tion descriptors that assesses 12 types of affective re-
sponses to advertising. These measures showed accept- sures for this purpose is unknown.2
It is apparent that existing measures of emotions haveable levels of reliability and evidence of validity whenused to assess responses to advertising. Edell and Burke important shortcomings when used to assess emotions in
the consumption context. The empirical work described(1987) found that the feelings elicited by ads could besummarized by three factors: upbeat feelings, negative below was motivated by the desire to identify a more
appropriate measurement approach. The following objec-feelings, and warm feelings. Their 52-item measure iseffective in assessing the underlying dimensions of the tives guided measure development. First, the measure
should cover the range of emotions most frequently expe-emotion states elicited by advertising; it is not designedto measure the specific emotion states experienced during rienced in a wide range of consumption situations, and it
should measure these emotions with an acceptable levelconsumption.of reliability. Second, the measure should be brief enoughthat it could be used in surveys or field studies. In keepingLimitations of Existing Measureswith these objectives, the resulting measure reflects thediversity of consumption emotions typically experiencedAlthough the emotions measures described above have
proved useful in the contexts for which they were devel- but does not assess every possible consumption emotion.Finally, the emotion descriptors in the measure shouldoped, several limitations in their application to the study
of consumption-related emotions must be recognized. In be words that are familiar to and readily understood byconsumers.addition to the limitations associated with each scale,
mentioned above, the following considerations limit their For purposes of this research, the term ‘‘consumption’’is used broadly to include anticipatory consumption andusefulness. First, all of the scales ignore some of the
emotions that are particularly central in people’s lives. product acquisition, as well as postpurchase possessionand use of the product. Consumption-related emotionsNone of the measures grounded in emotions theory assess
feelings of love, for instance.Second, most of the measures contain some terms not
familiar to many consumers. Words such as ‘‘melan- 2Havlena and Holbrook (1986) compared two emotion theory frame-works in the consumption context and found that the PAD dimensionscholy,’’ ‘‘contemptuous,’’ ‘‘sheepish,’’ ‘‘revulsion,’’ andidentified by Mehrabian and Russell (1974) were better able than Plut-‘‘brooding’’ are not part of the everyday vocabulary ofchik’s (1980) categories of emotions to discriminate among 149 con-most people, yet they appear in the scales described sumption experiences described by consumers. However, the ability of
above. Some measures are also confusing. The PAD scale either of these frameworks to adequately characterize the nature of theconsumption experiences themselves was not studied.uses semantic differential items in which the two anchor
/ 9h0b$$se01 08-11-97 14:51:33 cresa UC: Con Res
This content downloaded from 202.130.161.208 on Thu, 30 Jul 2015 01:28:16 UTCAll use subject to JSTOR Terms and Conditions
130 JOURNAL OF CONSUMER RESEARCH
include directly experienced emotions that result from of 94.8 percent of the respondents. Disagreements wereresolved by the author.the consumption of products. They exclude vicarious (or
‘‘aesthetic’’) emotions associated with artistic works suchas books, plays, and movies or that may be induced by Resultsadvertising. The arts can invoke the entire range of emo-
Positive emotions predominated among the feelings de-tion, and an instrument that covers this broad range wouldscribed by respondents: happiness, relief, and excitementbe unwieldy and inefficient in measuring emotions associ-were mentioned most frequently. Among the negativeated with other consumer products.emotions, worry, sadness, and guilt were most common.
The emotion descriptors from this study were combinedSTUDY 1with emotion-like terms identified in earlier studies ofconsumption emotions (Gardner and Rook 1988; HavlenaAn exploratory study was carried out to identify the1985; Havlena, Holbrook, and Lehmann 1989; Richins etemotions consumers experience during consumption andal. 1992; Schultz et al. 1989), descriptors from standardto develop a preliminary set of descriptors for those emo-emotions measures, and emotion words from Shaver ettions. Open-ended surveys were used because they allowal.’s (1987) study of emotion concepts, yielding a list ofidentification of the emotions experienced in a variety285 words. In line with Ortony et al.’s (1988) criteria forof consumption situations; they also provide informationemotions, this list was reduced by eliminating (1) wordsabout consumers’ own vocabulary for describing emo-that refer to bodily states (e.g., ‘‘sleepy’’), (2) subjectivetional experiences.3
evaluations that become emotion-like only when juxta-posed with the word ‘‘feeling’’ (e.g., ‘‘feeling confident,’’Methods‘‘feeling stupid’’), (3) behaviors (e.g., crying), and (4)action-tendency words (e.g., ‘‘hesitant,’’ ‘‘tempted’’).Questionnaires. Six different survey forms were de-
veloped to elicit reports for six different types of con- Descriptors that have been singled out by prior research-ers as being largely cognitive in nature (e.g., ‘‘inter-sumption situations: use of a favorite possession, a recent
important purchase, or a recent purchase of a clothing ested,’’ ‘‘confused’’)4 or that have been rated as ‘‘notemotions’’ or were unfamiliar to subjects in prior studiesitem, a food item, a durable good, or a service. For the
situations involving purchases, the questionnaire con- were also eliminated (Clore et al. 1987; Shaver et al.1987). Emotion descriptors were phrased in their adjec-tained items about the nature of the object or service
purchased and open-ended questions concerning respon- tive forms.The reduced list contained 175 emotion words and in-dents’ emotions when considering making the purchase,
when actually making the purchase, and when using the cluded descriptors for each major emotion category de-scribed by most theorists except for ‘‘interest,’’ whichproduct. At each stage, there were prompts for both posi-
tive and negative feelings. The ‘‘favorite possession’’ sur- many consider a nonvalenced cognitive state rather thanan emotion (e.g., Morgan and Heise 1988; Ortony et al.vey asked about positive and negative feelings when ‘‘us-
ing or looking at’’ the possession. 1988).
Respondents. Surveys were completed by 49 under-STUDY 2graduate business students during class and by 48 of 180
adult consumers who received a questionnaire by mail. Study 2 was designed to reduce the set of 175 itemsExcept for student subjects who also reported feelings by eliminating emotion descriptors that are unfamiliar toexperienced when disposing of a possession, respondents or rarely used by respondents and to identify which ofreported their feelings for one consumption situation only. several descriptors with similar meanings are least likely
to be used by consumers to describe their own feelings.Analysis. Two coders who had been briefed on thenature of emotions examined written responses to thequestionnaire and independently identified the emotion Data Collectionwords used by each respondent. Coders independently
The 175 emotion descriptors (plus descriptors for satis-identified identical emotion terms in the written protocolsfaction and dissatisfaction) were randomly divided intotwo lists of 88 and 89 descriptors. One hundred twentyundergraduate business students participated in the study;
3Prior to undertaking the surveys, six depth interviews were carried each student responded to only one list of descriptors.out for the same purpose. While the depth interviews were useful inThe research was described to respondents as a studyproviding a wealth of detail about specific consumption situations, they
were not as useful as had been hoped in identifying a broad range of to identify the kinds of words that ordinary people use toconsumption-related emotions. Even though probes were used, in anyone interview only a small number of emotions were spontaneouslymentioned by a particular respondent. Thus, the depth interviews were
4Consistent with Shaver et al. (1987), however, surprise was retainedimpractical for obtaining information about a large variety of consump-tion-related emotions. because it appears in so many taxonomies of emotion.
/ 9h0b$$se01 08-11-97 14:51:33 cresa UC: Con Res
This content downloaded from 202.130.161.208 on Thu, 30 Jul 2015 01:28:16 UTCAll use subject to JSTOR Terms and Conditions
131MEASURING EMOTIONS IN THE CONSUMPTION EXPERIENCE
describe their feelings; they were instructed not to report adults. Surveys were also completed in class by 203 un-dergraduate business students.how likely they were to experience a particular feeling
on the list but to indicate how likely they would be touse a particular word if they did experience that feeling.
ResultsRespondents used a four-point scale (0 Å not at all likely,3 Å very likely) and were provided the option of indicat- Respondents’ frequency ratings were used to eliminateing that a word was unfamiliar. emotions that rarely occur in consumption contexts.
Fewer than 10 percent of respondents reported that theyResults had ever experienced eight of the emotions at some level
in the consumption context they described; these emotionLikelihood of usage ratings, supplemented with infor-descriptors were eliminated. As in study 2, the remainingmation from two word usage lexicons (Francis and Ku-121 words were grouped by emotion subcategory. Whencera 1982; Hindmarsh 1980), were used to eliminate un-subcategories contained several descriptors with similarsuitable items. Ten words that were rated as unfamiliarmeanings (as judged in study 2), descriptors with mark-by more than 5 percent of the sample or that had meanedly lower rates of occurrence were removed from thelikelihood ratings less than 0.5 were eliminated.set. Twenty-four items were eliminated by this procedure,Before making further deletions, the remaining 165leaving 97 emotion descriptors.words were grouped according to the 25 emotion subcate-
gories identified by Shaver et al. (1987, Fig. 2).5 This wasdone to preserve the range of emotions represented in the STUDY 4set of descriptors.
Some of the emotion subcategories contained a large Study 4 was carried out primarily to reduce the numbernumber of nearly synonymous words. When descriptors of items in the emotion descriptor set so it would be morewere close in meaning, as revealed by Storm and Storm’s useful in survey and field research. A second outcome(1987) taxonomic study of emotions and by thesauri, and of the study, necessary to satisfactorily accomplish theone word had a considerably lower likelihood of usage primary goal, was to describe the multidimensional spacerating, the word with the lower likelihood rating was of consumption-related emotions.eliminated. Altogether, 46 emotion descriptors were elim- In studies 2 and 3, redundancy was assessed in termsinated in study 2, leaving 129 for further analysis. of meaning similarity. A second way to assess redundancy
is by co-occurrence; that is, if one emotion tends to beexperienced whenever a second emotion is also experi-STUDY 3enced, and at the same intensity, the two emotion descrip-
The emotion descriptor set covers the range of emo- tors are redundant. Study 4 used this form of redundancytions identified by scholars as well as by consumers. Study to further reduce the emotion descriptor set while still3 examined whether any of the emotions from this broader capturing the diversity of emotions experienced duringdomain rarely occur in the consumption context. Survey consumption.methods were used.
Data CollectionData CollectionMeasures. Separate survey forms were developed toMeasures. Separate survey forms were developed to
elicit reports for four types of consumption situations: aelicit reports for four different consumption situationsrecent important purchase, a recent unsatisfactory pur-similar to those used in study 1. Study participants an-chase, a special possession, or a purchase the respondentswered several open-ended questions concerning the spe-hoped to make in the near future. Respondents answeredcific product or possession and its acquisition, then indi-several open-ended questions concerning the specificcated how often they had experienced various emotionsproduct or possession and indicated to what extent theconcerning the object in question, using the optionsspecified consumption situation made them feel each of‘‘never,’’ ‘‘rarely,’’ ‘‘sometimes,’’ and ‘‘often.’’ Tothe 97 emotion descriptors. A four-point response scaleavoid fatigue, each participant reported on one-third ofwas used (‘‘not at all,’’ ‘‘a little,’’ ‘‘moderately,’’the emotions in the set.‘‘strongly’’). In order to control for possible order effects,
Respondents. Surveys were mailed to a random sam- two versions of the questionnaire were prepared for eachple of 750 households in a northeastern city; a reminder consumption situation: one with emotion descriptors inand a second copy of the questionnaire were mailed two alphabetical order and one with them in reverse alphabeti-weeks later. Usable responses were obtained from 258 cal order.
Respondents. Usable surveys were completed in classor in a laboratory setting by 448 M.B.A. and undergradu-5Fifty-four of the 165 words were not listed in Shaver et al.’s subcate-
gories; judgment and thesauri were used to place them appropriately. ate students from a variety of majors.
/ 9h0b$$se01 08-11-97 14:51:33 cresa UC: Con Res
This content downloaded from 202.130.161.208 on Thu, 30 Jul 2015 01:28:16 UTCAll use subject to JSTOR Terms and Conditions
132 JOURNAL OF CONSUMER RESEARCH
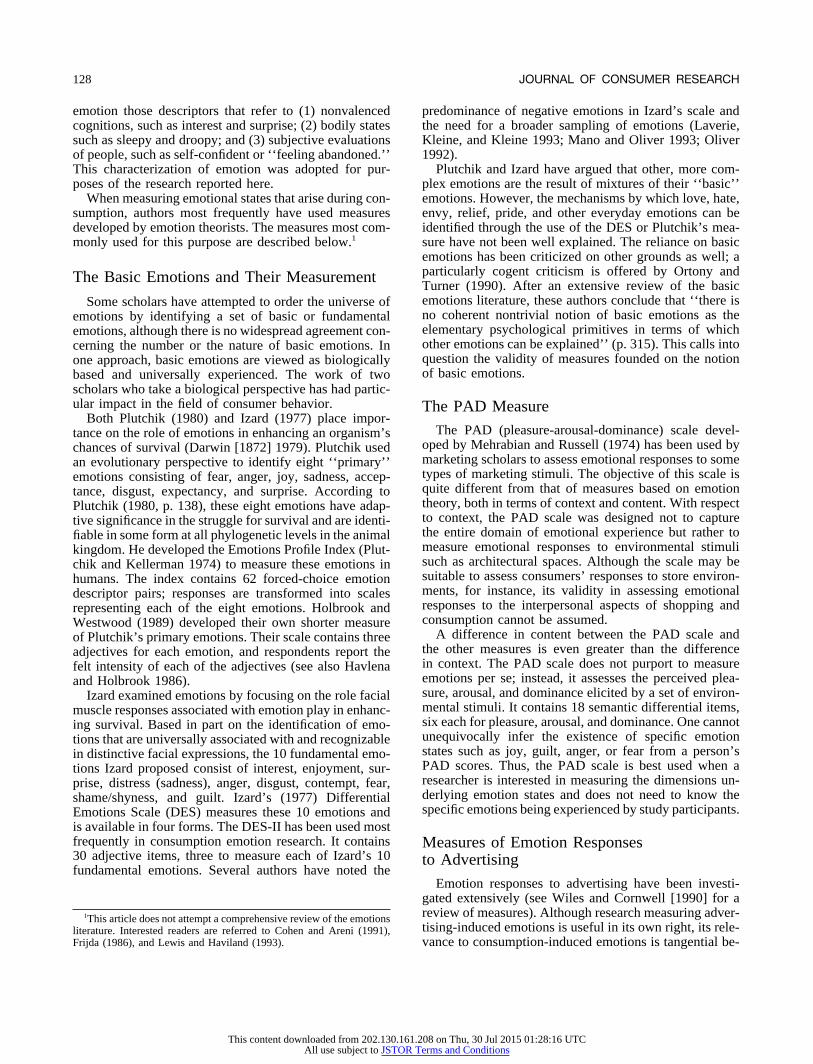
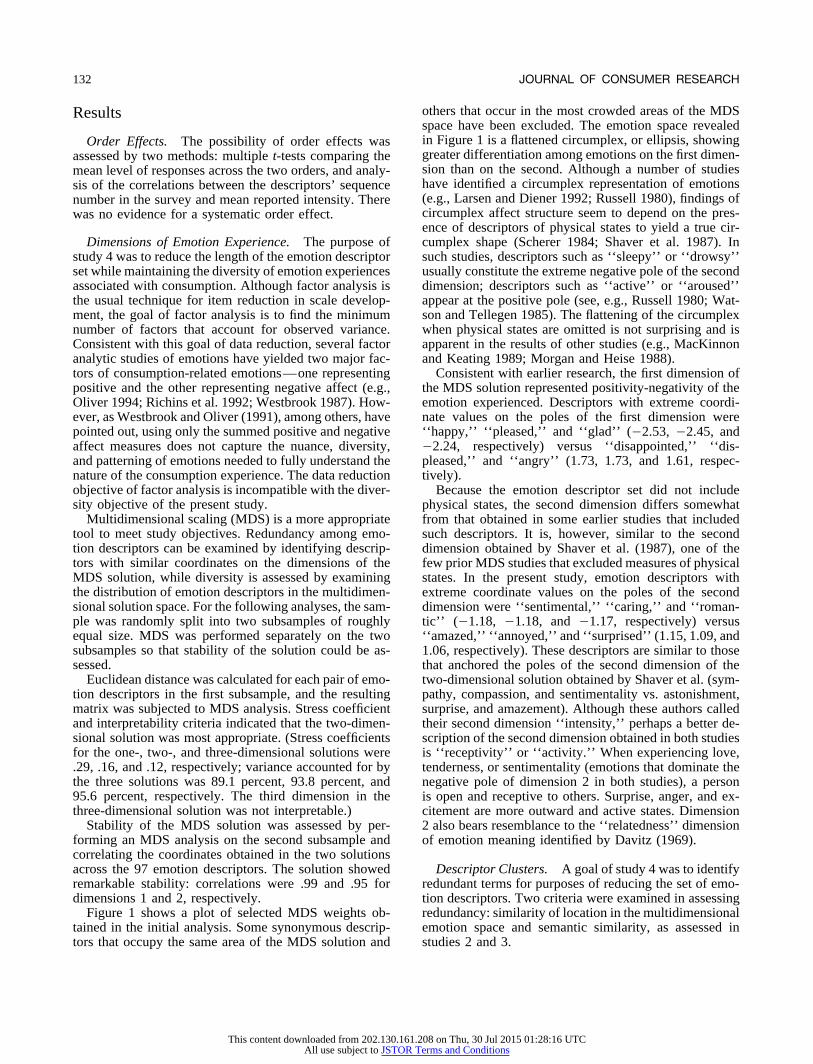
others that occur in the most crowded areas of the MDSResultsspace have been excluded. The emotion space revealedin Figure 1 is a flattened circumplex, or ellipsis, showingOrder Effects. The possibility of order effects wasgreater differentiation among emotions on the first dimen-assessed by two methods: multiple t-tests comparing thesion than on the second. Although a number of studiesmean level of responses across the two orders, and analy-have identified a circumplex representation of emotionssis of the correlations between the descriptors’ sequence(e.g., Larsen and Diener 1992; Russell 1980), findings ofnumber in the survey and mean reported intensity. Therecircumplex affect structure seem to depend on the pres-was no evidence for a systematic order effect.ence of descriptors of physical states to yield a true cir-cumplex shape (Scherer 1984; Shaver et al. 1987). InDimensions of Emotion Experience. The purpose of
study 4 was to reduce the length of the emotion descriptor such studies, descriptors such as ‘‘sleepy’’ or ‘‘drowsy’’usually constitute the extreme negative pole of the secondset while maintaining the diversity of emotion experiences
associated with consumption. Although factor analysis is dimension; descriptors such as ‘‘active’’ or ‘‘aroused’’appear at the positive pole (see, e.g., Russell 1980; Wat-the usual technique for item reduction in scale develop-
ment, the goal of factor analysis is to find the minimum son and Tellegen 1985). The flattening of the circumplexwhen physical states are omitted is not surprising and isnumber of factors that account for observed variance.
Consistent with this goal of data reduction, several factor apparent in the results of other studies (e.g., MacKinnonand Keating 1989; Morgan and Heise 1988).analytic studies of emotions have yielded two major fac-
tors of consumption-related emotions—one representing Consistent with earlier research, the first dimension ofthe MDS solution represented positivity-negativity of thepositive and the other representing negative affect (e.g.,
Oliver 1994; Richins et al. 1992; Westbrook 1987). How- emotion experienced. Descriptors with extreme coordi-nate values on the poles of the first dimension wereever, as Westbrook and Oliver (1991), among others, have
pointed out, using only the summed positive and negative ‘‘happy,’’ ‘‘pleased,’’ and ‘‘glad’’ (02.53, 02.45, and02.24, respectively) versus ‘‘disappointed,’’ ‘‘dis-affect measures does not capture the nuance, diversity,
and patterning of emotions needed to fully understand the pleased,’’ and ‘‘angry’’ (1.73, 1.73, and 1.61, respec-tively).nature of the consumption experience. The data reduction
objective of factor analysis is incompatible with the diver- Because the emotion descriptor set did not includesity objective of the present study. physical states, the second dimension differs somewhat
Multidimensional scaling (MDS) is a more appropriate from that obtained in some earlier studies that includedtool to meet study objectives. Redundancy among emo- such descriptors. It is, however, similar to the secondtion descriptors can be examined by identifying descrip- dimension obtained by Shaver et al. (1987), one of thetors with similar coordinates on the dimensions of the few prior MDS studies that excluded measures of physicalMDS solution, while diversity is assessed by examining states. In the present study, emotion descriptors withthe distribution of emotion descriptors in the multidimen- extreme coordinate values on the poles of the secondsional solution space. For the following analyses, the sam- dimension were ‘‘sentimental,’’ ‘‘caring,’’ and ‘‘roman-ple was randomly split into two subsamples of roughly tic’’ (01.18, 01.18, and 01.17, respectively) versusequal size. MDS was performed separately on the two ‘‘amazed,’’ ‘‘annoyed,’’ and ‘‘surprised’’ (1.15, 1.09, andsubsamples so that stability of the solution could be as- 1.06, respectively). These descriptors are similar to thosesessed. that anchored the poles of the second dimension of the
Euclidean distance was calculated for each pair of emo- two-dimensional solution obtained by Shaver et al. (sym-tion descriptors in the first subsample, and the resulting pathy, compassion, and sentimentality vs. astonishment,matrix was subjected to MDS analysis. Stress coefficient surprise, and amazement). Although these authors calledand interpretability criteria indicated that the two-dimen- their second dimension ‘‘intensity,’’ perhaps a better de-sional solution was most appropriate. (Stress coefficients scription of the second dimension obtained in both studiesfor the one-, two-, and three-dimensional solutions were is ‘‘receptivity’’ or ‘‘activity.’’ When experiencing love,.29, .16, and .12, respectively; variance accounted for by tenderness, or sentimentality (emotions that dominate thethe three solutions was 89.1 percent, 93.8 percent, and negative pole of dimension 2 in both studies), a person95.6 percent, respectively. The third dimension in the is open and receptive to others. Surprise, anger, and ex-three-dimensional solution was not interpretable.) citement are more outward and active states. Dimension
Stability of the MDS solution was assessed by per- 2 also bears resemblance to the ‘‘relatedness’’ dimensionforming an MDS analysis on the second subsample and of emotion meaning identified by Davitz (1969).correlating the coordinates obtained in the two solutionsacross the 97 emotion descriptors. The solution showed Descriptor Clusters. A goal of study 4 was to identify
redundant terms for purposes of reducing the set of emo-remarkable stability: correlations were .99 and .95 fordimensions 1 and 2, respectively. tion descriptors. Two criteria were examined in assessing
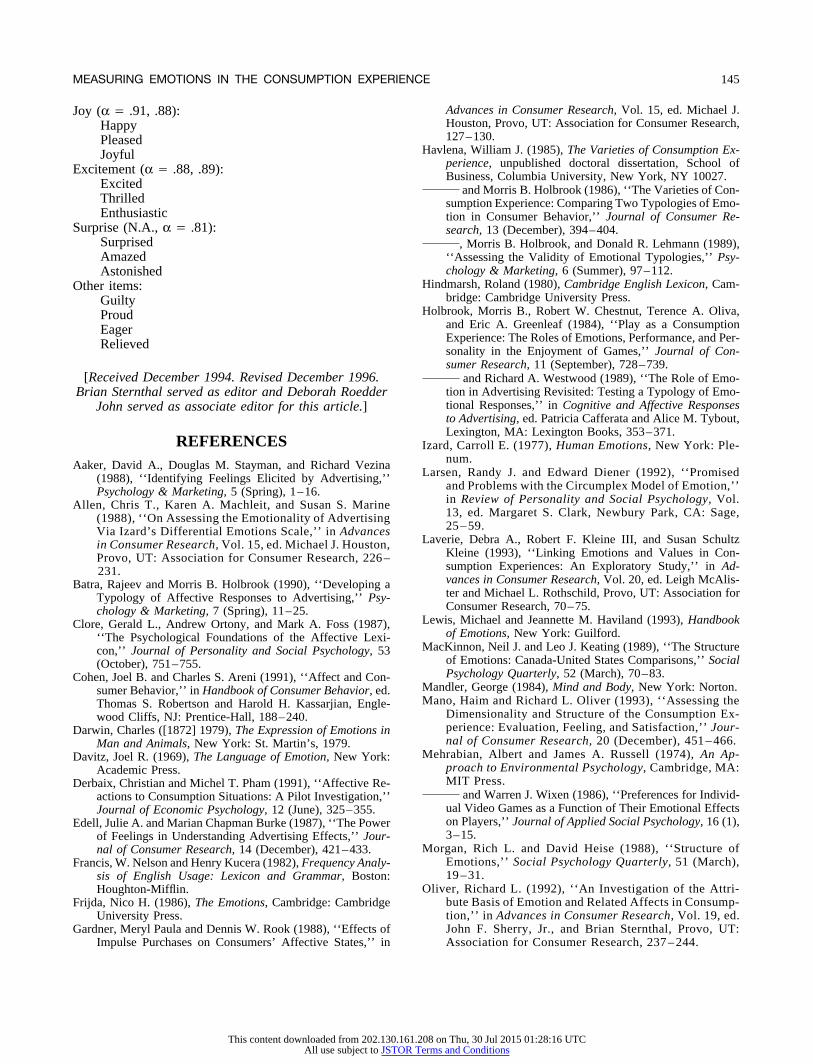
redundancy: similarity of location in the multidimensionalFigure 1 shows a plot of selected MDS weights ob-tained in the initial analysis. Some synonymous descrip- emotion space and semantic similarity, as assessed in
studies 2 and 3.tors that occupy the same area of the MDS solution and
/ 9h0b$$se01 08-11-97 14:51:33 cresa UC: Con Res
This content downloaded from 202.130.161.208 on Thu, 30 Jul 2015 01:28:16 UTCAll use subject to JSTOR Terms and Conditions
133MEASURING EMOTIONS IN THE CONSUMPTION EXPERIENCE
FIGURE 1
PLOT OF MULTIDIMENSIONAL SCALING COORDINATES OF SELECTED EMOTION DESCRIPTORS, STUDY 4
NOTE.—Starting at the upper middle portion of the figure and continuing in a clockwise direction, letters in Figure 1 are defined as follows: A, impatient; B,frustrated; C, irritated; D, angry; E, unfulfilled; F, discontented; G, worried; H, tense; I, disgusted; J, furious; K, grouchy; L, depressed; M, miserable; N, sad; O,panicky; P, threatened; Q, afraid; R, ashamed; S, embarrassed; T, guilty; U, envious; V, jealous; W, lonely; X, homesick; Y, tender; Z, sexy; a, romantic; b, loving;c, sentimental; d, warmhearted; e, calm; f, peaceful; g, comforted; h, relieved; i, hopeful; j, optimistic; k, contented; l, fulfilled; m, proud; n, joyful; o, glad; p,pleased; q, enthusiastic; r, excited; s, eager; t, amazed; u, surprised; v, overwhelmed.
Examination of the MDS space revealed 16 clusters of descriptors make a U-shaped pattern in the space. Theupper-right extremity of the U consists of active negativeemotion descriptors that occupied similar locations and
shared similar meanings (see Table 1). Sample descriptors emotions such as anger; the upper left extremity of theU includes active positive emotions such as joy and ex-from these clusters are circumscribed in Figure 1 to show
their position in the MDS space. The elliptical pattern of citement; the bottom of the U is composed of ‘‘soft’’or receptive emotions such as love, peacefulness, andemotion descriptors in Figure 1 has some sparse areas,
consistent with other studies that excluded physical states loneliness.The locations of emotion descriptor clusters in theand other nonemotion descriptors (e.g., MacKinnon and
Keating 1989; Morgan and Heise 1988). This is particu- MDS space are generally consistent with those obtainedin other studies that have used similar criteria in choosinglarly true if the surprise descriptors are eliminated from
the map, as recommended by several scholars (e.g., Man- emotion descriptors, with one exception. In the presentanalysis, the cluster of variables relating to fear is closerdler 1984; Ortony et al. 1988), in which case the emotion
/ 9h0b$$se01 08-11-97 14:51:33 cresa UC: Con Res
This content downloaded from 202.130.161.208 on Thu, 30 Jul 2015 01:28:16 UTCAll use subject to JSTOR Terms and Conditions
134 JOURNAL OF CONSUMER RESEARCH
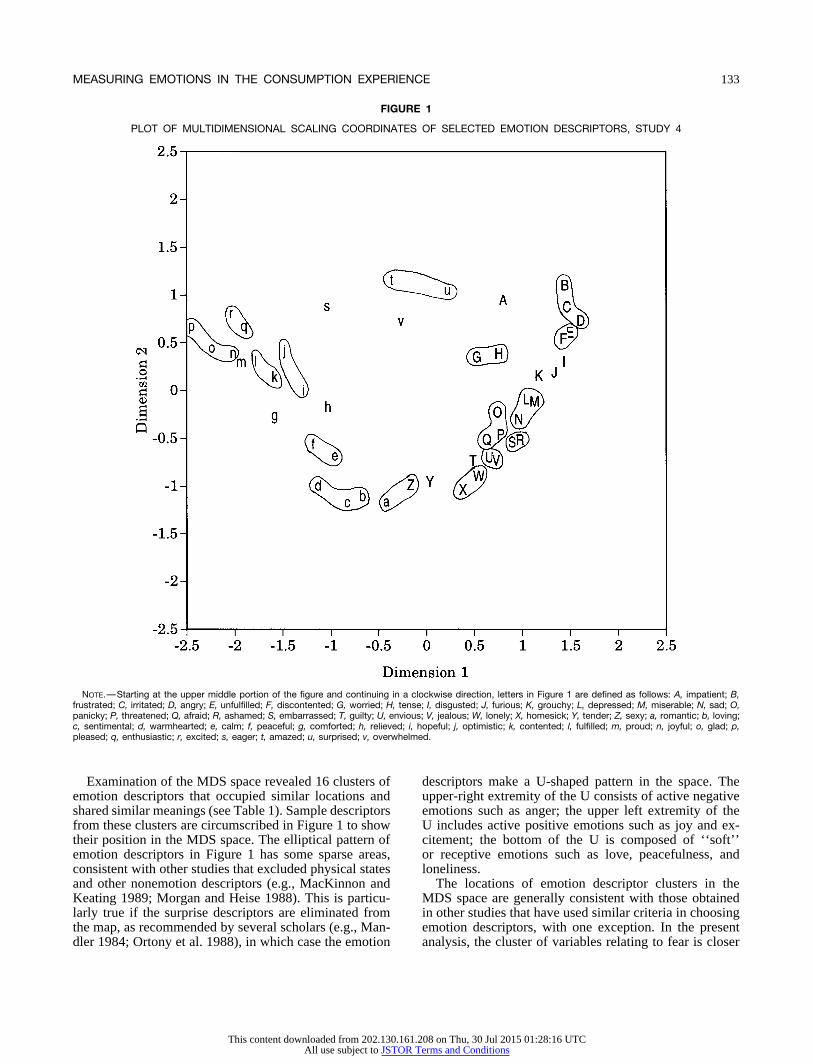
TABLE 1 TABLE 1 (Continued )
CLUSTERS OF EMOTION DESCRIPTORS, STUDY 4Usage Percent Percent
Cluster and ratings, occurrence, occurrence, AverageUsage Percent Percent descriptors study 2 study 3 study 4 r
Cluster and ratings, occurrence, occurrence, Averagedescriptors study 2 study 3 study 4 r Joy:
Happya 2.82 92.8 77.7 .80Anger: Pleaseda 2.25 91.4 74.6 .75
Frustrateda 2.80 45.3 46.7 .74 Joyfula 1.20 73.7 68.5 .76Angrya 2.70 31.7 38.0 .80 Good 2.80 89.4 76.3 .80Irritateda 2.55 26.5 43.5 .78 Glad 2.17 87.4 73.0 .81Annoyed 2.71 41.7 45.5 .77 Delighted 1.48 92.1 69.4 .77Aggravated 2.27 35.1 44.6 .76 Cheerful 1.47 83.4 70.8 .77Upset 2.79 27.3 38.2 .73 Excitement:Mad 2.75 24.5 37.1 .79 Exciteda 2.88 70.9 73.2 .74Furious 2.07 20.1 27.2 .73 Thrilleda 2.33 64.2 65.6 .67
Discontent: Enthusiastica 2.32 82.0 70.3 .73Unfulfilleda 1.02 18.7 34.8 .73 Surprise:Discontenteda .90 18.7 37.1 .73 Surpriseda 2.85 37.4 49.3 .30
Worry: Amazeda 1.98 50.9 55.8 .30Nervousa 2.88 34.5 41.3 .45 Astonisheda 1.57 33.9 40.6b .46b
Worrieda 2.73 27.2 47.8 .48Tensea 2.58 30.9 46.7 .48 aDescriptors included in the Consumption Emotion Set.Concerned 2.67 43.3 50.0 .36 bFrom study 5.Uneasy 1.80 29.2 43.8 .43
Sadness:Depresseda 2.75 26.5 28.4 .56Sada 2.67 26.5 26.3 .53 to the sadness descriptors than it is to more active emo-Miserablea 2.48 15.2 20.5 .57 tions such as anger or worry. One generally thinks of fearBad 2.80 21.1 25.9 .57
as an active state: an individual is threatened in some way,Hopeless 1.93 13.9 14.5 .53perhaps with bodily harm, and fight or flight responses areDefeated 1.00 16.6 22.5 .49
Fear: activated to minimize that harm. However, it is importantScareda 2.77 18.7 24.3 .50 to keep in mind the context of emotion examined in thisAfraida 2.48 21.2 23.9 .52 study. The fear a consumer experiences because s/hePanickya 1.17 23.0 27.2 .48
might make a suboptimal purchase or become confusedThreatened 2.32 12.9 17.4 .44Frightened 2.23 23.7 23.7 .45 when using a newly purchased computer is very differentAlarmed 1.28 21.6 25.9 .33 in kind and intensity from what one might experience
Shame: when facing a mugger in a lonely alley or driving anEmbarrasseda 2.85 15.8 19.0 .64
unfamiliar car over icy, treacherous roads in the dark.Ashameda 1.73 10.1 15.9 .61Humiliateda 2.17 10.0 14.7 .58
Envy: Reducing the Emotion Descriptor SetEnviousa 1.65 23.7 20.5 .39Jealousa 2.52 15.9 13.4 .39 The MDS solution was used to reduce the emotion
Loneliness: descriptor set to a more useful size. This involved twoLonelya 2.55 11.5 15.9 .55activities: determining which descriptors within a clusterHomesicka 2.03 27.2 17.0 .55
Romantic love: should be retained and determining which emotion de-Sexya 2.62 40.3 31.3 .56 scriptors that were not part of a cluster should be retained.Romantica 2.44 40.3 33.9 .64Passionatea 1.95 37.4 34.6 .63 Emotion Clusters. The number of descriptors in a
Love: cluster ranges from two to eight (see Table 1). AlthoughLovinga 2.38 48.2 38.6 .69 reducing each cluster to a single representative emotionSentimentala 2.05 47.5 41.1 .60
descriptor would provide a usefully short instrument,Warm hearteda .92 55.4 46.7 .63Caring 2.28 63.3 37.5 .63 maintaining two or three descriptors per cluster results inCompassionate 1.34 42.4 30.1 .60 less measurement error. The following criteria were usedTender 1.17 38.9 28.6 .64 to determine which descriptors would be retained in each
Peacefulness:cluster. Items retained in each cluster after application ofCalma 2.65 73.4 56.3 .55these criteria are noted by a superscript ‘‘a’’ in Table 1.Peacefula 1.95 67.8 52.5 .55
Contentment:1. Descriptors with higher likelihoods of usageContenteda 1.30 85.4 64.1 .60
Fulfilleda 1.53 80.6 61.2 .60 (study 2) and higher frequencies of occurrenceOptimism: (studies 3 and 4) were favored over those with
Optimistica 2.58 66.2 61.2 .64 lower usage and occurrence rates.Encourageda 2.35 63.7 61.6 .59
2. Descriptors with clear meanings were favoredHopefula 2.13 53.0 55.8 .61
/ 9h0b$$se01 08-11-97 14:51:33 cresa UC: Con Res
This content downloaded from 202.130.161.208 on Thu, 30 Jul 2015 01:28:16 UTCAll use subject to JSTOR Terms and Conditions
135MEASURING EMOTIONS IN THE CONSUMPTION EXPERIENCE
over those that are vague or that refer to multiple greater than .75. The correlations between items in thetwo-descriptor clusters were .55 or greater except for theemotional states (e.g., bad, upset).
3. Clusters should reflect the diversity of experience envious-jealous cluster (r Å .39).within the emotion category. When two descrip-tors within a cluster were extremely similar—in
STUDY 5meaning, in proximity within MDS space, andas measured by the correlation between the two
Studies 1–4 culminated in the CES, a set of emotiondescriptors—one was eliminated.descriptors that represents the range of emotions com-4. Two factors concerning placement within multidi-monly experienced in the consumption context. Study 5mensional space were considered: the descriptorscompares the efficacy of the CES with that of other emo-within a cluster should possess spatial coherence,tion measures in representing the range of consumption-and each cluster should maintain some separationrelated emotions.in the multidimensional space from clusters with
different semantic meanings.5. Correlations among descriptors within a cluster Data Collectionshould be sufficiently high that they can be
summed to form a single variable to represent Two surveys were carried out through similar meth-that cluster (see Table 1). ods. In survey 1, the questionnaires included the CES
and several measures that have been used in prior re-Extracluster Descriptors. Although it is desirable tosearch to measure consumption-related emotions. Inhave at least two descriptors for each emotion measured,survey 2, the questionnaire included the CES measuremany of the descriptors in study 4 did not fall into aand two measures of affective responses to advertis-cluster. A single descriptor emotion was kept if it hasing.an unambiguous meaning and met one of the following
criteria. Measures. Separate survey forms were developed toelicit reports for five different types of consumption situa-A. The emotion was reported as being experiencedtions. Respondents completed a survey based on how theyby at least one-third of the respondents in bothhad felt during one of the following situations: whilestudies 3 and 4, and the descriptor occupies anshopping for a recent important purchase, while using anotherwise sparse area of the MDS space.important product they had recently purchased, in re-B. At least one-third of respondents reported theysponse to a recent unsatisfactory purchase, in response tohad experienced the emotion, and the variance ina special possession, or when thinking about a purchaseconsumers’ responses to the descriptor cannot bethey hoped to make in the near future. Respondents an-well explained statistically by other emotion de-swered several open-ended questions concerning the spe-scriptors retained in the set. In applying this crite-cific product or possession, then indicated how much therion, an emotion was retained if the other descrip-specified consumption situation made them feel varioustors accounted for less than 40.0 percent of theemotions. A four-point response scale was used (‘‘not atvariance in that emotion term.all,’’ ‘‘a little,’’ ‘‘moderately,’’ ‘‘strongly’’).
The Appendix shows the final set of clustered and In survey 1, the emotion descriptors included itemsindividual emotion descriptors that met the above crite- from the CES, Izard’s (1977) DES-II measure, and Hav-ria. This descriptor set, referred to as the Consumption lena and Holbrook’s (1986) adaptation of Plutchik’s mea-Emotion Set (CES), is expected to adequately represent sures. There was some overlap in the items among theconsumers’ emotional reactions to most consumption three lists; subjects completed 89 emotion descriptors.experiences. Researchers desiring a slightly shorter Two versions of the questionnaire were prepared for eachmeasurement instrument may choose to use only two consumption situation: one with emotion descriptors indescriptors from those clusters that contain three. Re- alphabetical order by third letter of the descriptor and onesearchers desiring a somewhat more comprehensive with them in reverse alphabetical order by third letter.measurement instrument may choose to add descrip- After completing the emotion items, respondents com-tors. Accordingly, a footnote to the Appendix shows the pleted Mehrabian and Russell’s (1974) PAD measure fordescriptors that would be added to the list if criterion B the consumption situation.was relaxed to include emotions experienced by only The 107 emotion descriptors in survey 2 included itemsone-quarter of respondents and for which the variance from the CES, Batra and Holbrook’s (1990) scales mea-explained by other emotion descriptors is less than 50 suring affective responses to advertising, and Edell andpercent. Burke’s (1987) measures of feelings induced by adver-
Cronbach’s alpha is reported in parentheses for clusters tising.in the Appendix that contain three descriptors; correlationcoefficients are reported for two-descriptor clusters. All Respondents. In survey 1, usable surveys were com-
pleted in class or in a laboratory setting by 256 undergrad-three-descriptor clusters possessed a reliability coefficient
/ 9h0b$$se01 08-11-97 14:51:33 cresa UC: Con Res
This content downloaded from 202.130.161.208 on Thu, 30 Jul 2015 01:28:16 UTCAll use subject to JSTOR Terms and Conditions
136 JOURNAL OF CONSUMER RESEARCH
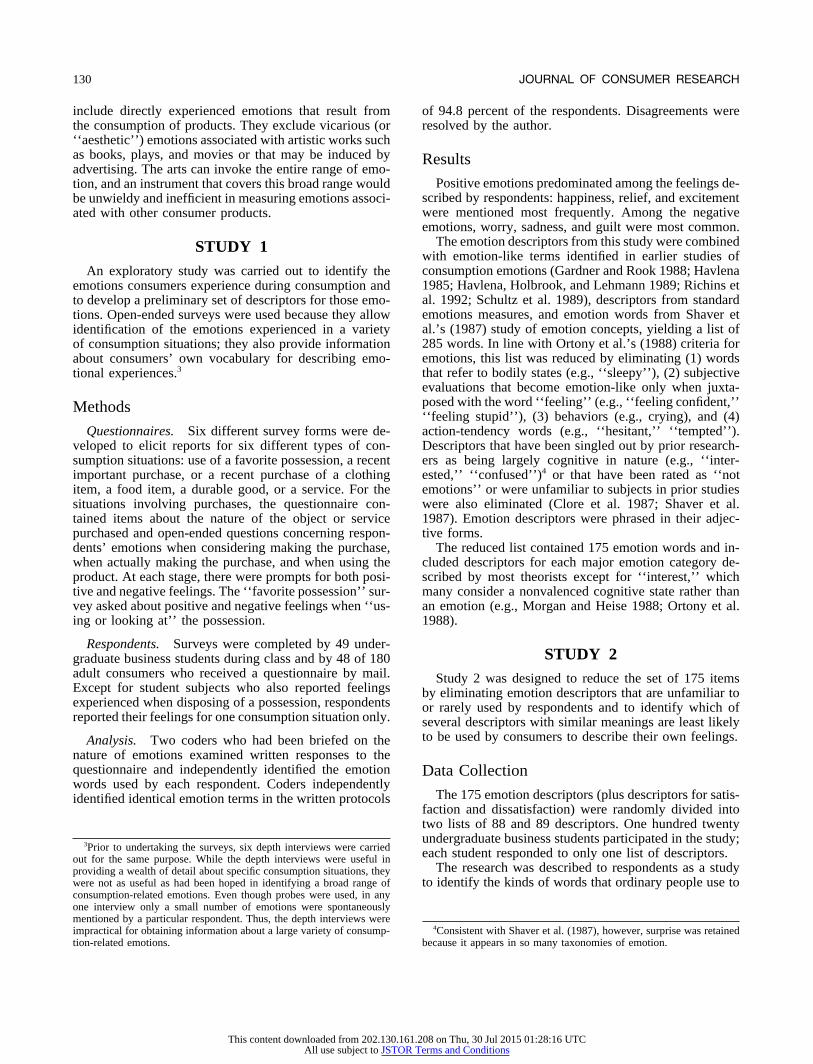
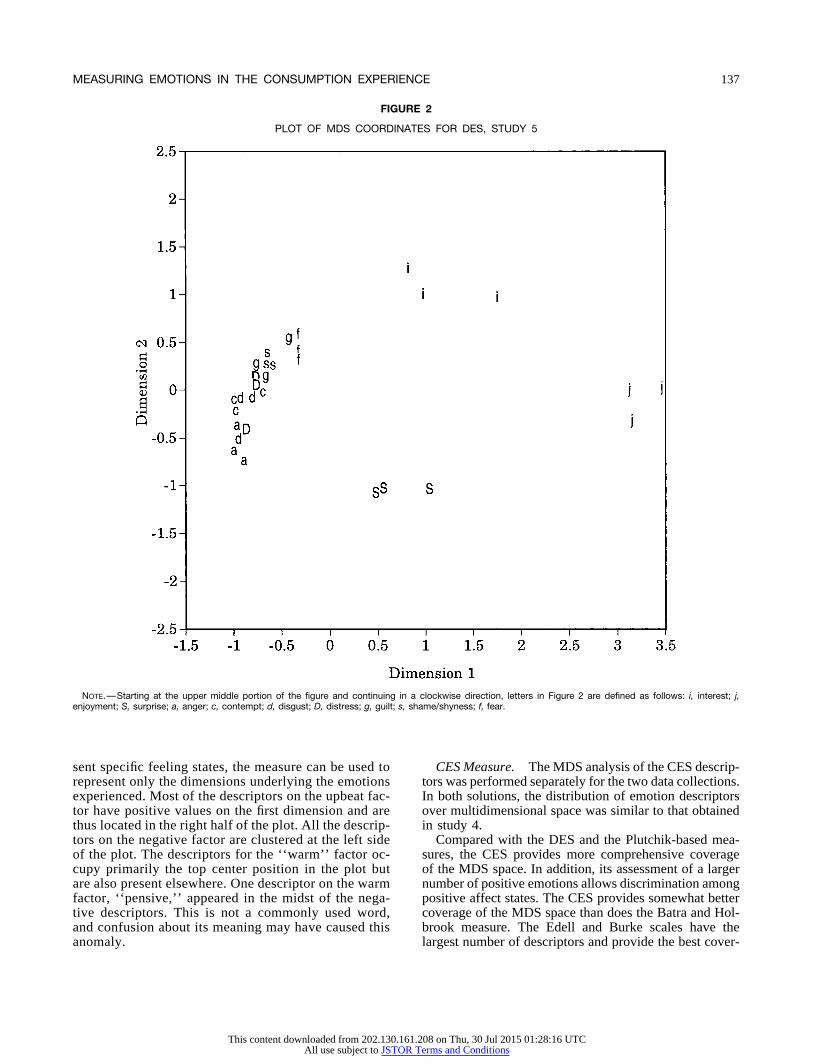
uate and M.B.A. students; there were 194 student respon- again, appears to represent activity or receptivity (seeFig. 3).dents in survey 2.
The MDS plots of Izard’s DES and the items based onPlutchik’s set of emotions are remarkably similar. ThePreliminary Analysestwo plots differ in the location of the cluster of variablesmeasuring surprise (which is operationalized quite differ-Order Effects. Order effects for both data collectionsently in the two measures) and in the larger number ofwere assessed as in study 4. There was no evidence of anegative emotions measured by the DES. Beyond this,systematic order effect.however, the plots are almost identical (allowing for the
Reliability. Cronbach’s alpha was calculated for the reversal of poles for both dimensions). Measures basedsubscales of the various emotion measures. Reliabilities on Plutchik’s work, like the DES, do not identify or dis-for the existing scales were generally comparable to those criminate among the various forms of positive emotions,reported in the literature, although in some cases they and the plots for both measures contain large empty areaswere considerably lower, possibly because scale items in the MDS space.were intermixed rather than grouped by subscale, which
Batra and Holbrook’s Measure. A two-dimensionallowers reliability coefficients (Allen, Machleit, and Ma-MDS solution was also used for the Batra and Holbrookrine 1988). Reliabilities for the CES in the two data col-measure (stress values for the one-, two-, and three-di-lections were about the same as those obtained in studymensional solutions were .26, .15, and .11, respectively;4 (see the Appendix).R2 values were 90.8 percent, 94.5 percent, and 96.0 per-cent, respectively). The solution is shown in Figure 4. TheEmotion Measures in Multidimensional Space first dimension again represents positive versus negativeaffect. The positive end of the second dimension wasTo assess the distribution of the emotion measures inrepresented by variables composing the desire scale andmultidimensional space, the items composing each mea-the descriptors ‘‘active’’ and ‘‘entertained.’’ The negativesure were separately subjected to a multidimensional scal-end was represented by the descriptors ‘‘loving,’’ ‘‘affec-ing analysis.tionate,’’ and ‘‘restful.’’
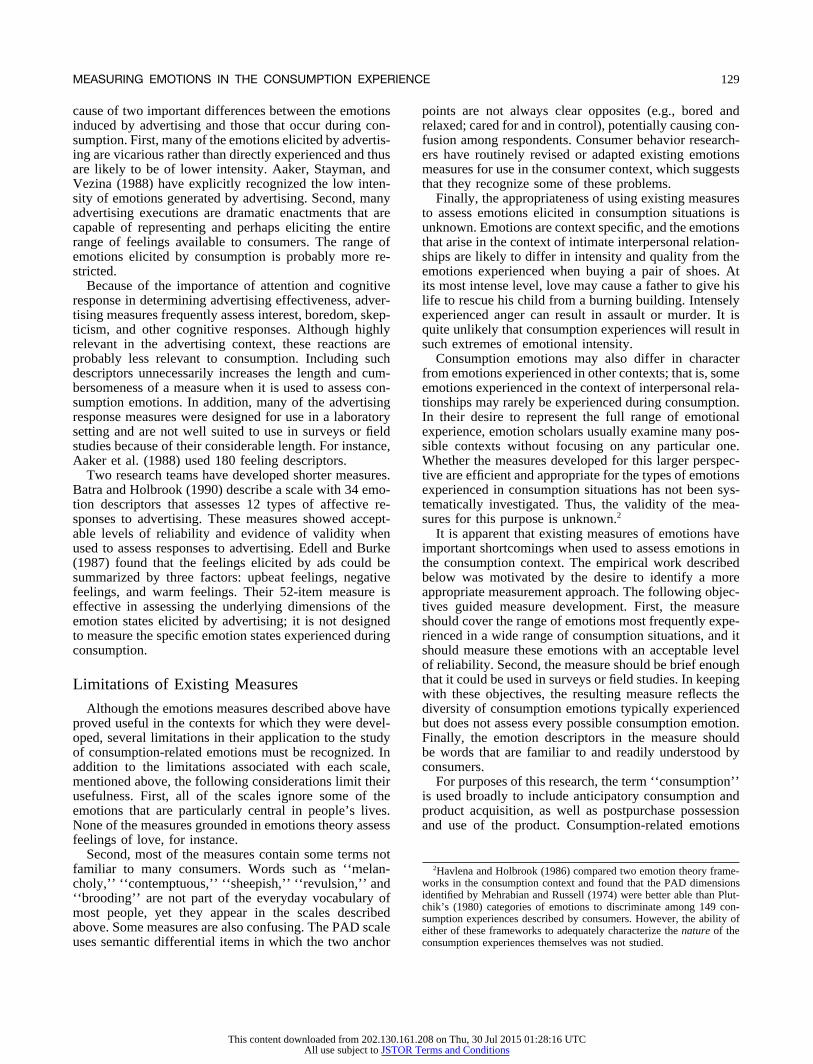
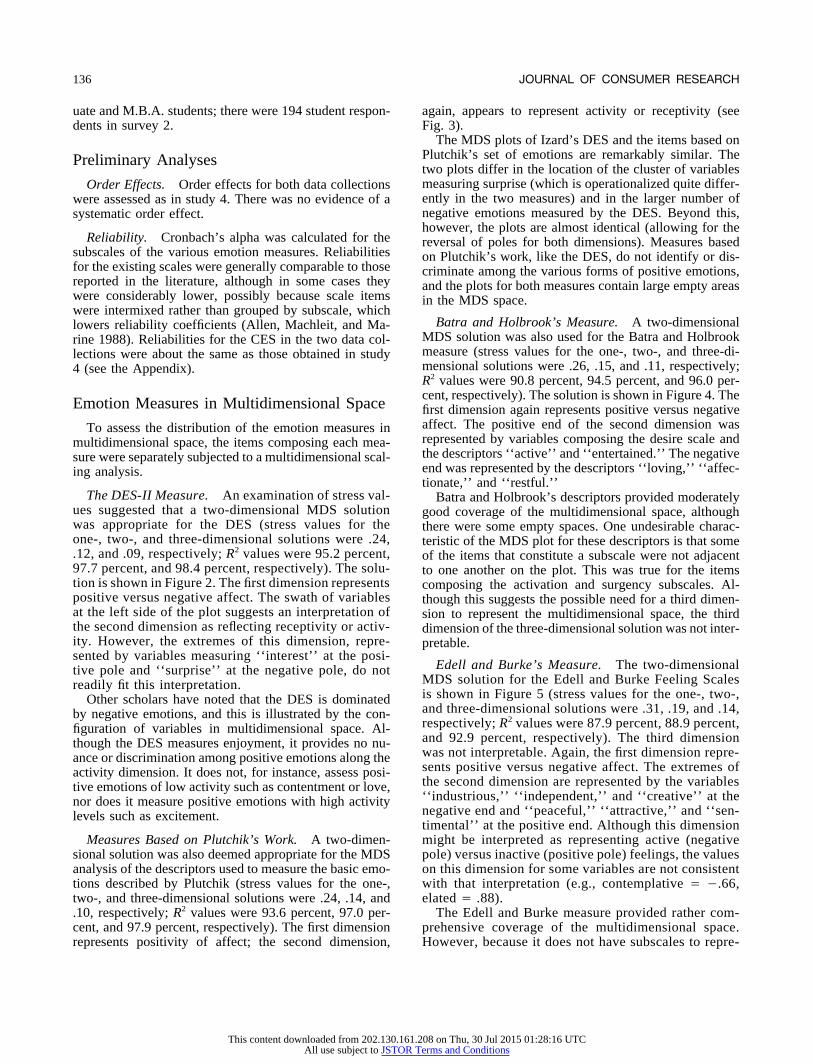
The DES-II Measure. An examination of stress val- Batra and Holbrook’s descriptors provided moderatelyues suggested that a two-dimensional MDS solution good coverage of the multidimensional space, althoughwas appropriate for the DES (stress values for the there were some empty spaces. One undesirable charac-one-, two-, and three-dimensional solutions were .24, teristic of the MDS plot for these descriptors is that some.12, and .09, respectively; R2 values were 95.2 percent, of the items that constitute a subscale were not adjacent97.7 percent, and 98.4 percent, respectively). The solu- to one another on the plot. This was true for the itemstion is shown in Figure 2. The first dimension represents composing the activation and surgency subscales. Al-positive versus negative affect. The swath of variables though this suggests the possible need for a third dimen-at the left side of the plot suggests an interpretation of sion to represent the multidimensional space, the thirdthe second dimension as reflecting receptivity or activ- dimension of the three-dimensional solution was not inter-ity. However, the extremes of this dimension, repre- pretable.sented by variables measuring ‘‘interest’’ at the posi-
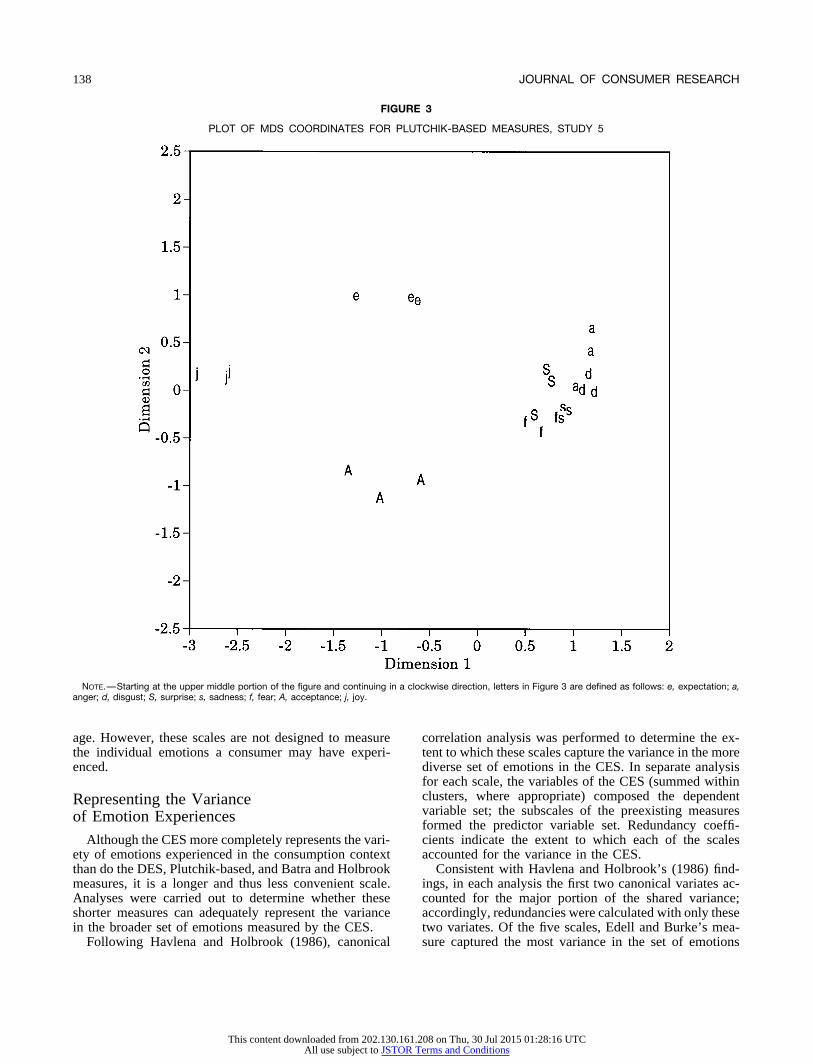
Edell and Burke’s Measure. The two-dimensionaltive pole and ‘‘surprise’’ at the negative pole, do notMDS solution for the Edell and Burke Feeling Scalesreadily fit this interpretation.is shown in Figure 5 (stress values for the one-, two-,Other scholars have noted that the DES is dominatedand three-dimensional solutions were .31, .19, and .14,by negative emotions, and this is illustrated by the con-respectively; R2 values were 87.9 percent, 88.9 percent,figuration of variables in multidimensional space. Al-and 92.9 percent, respectively). The third dimensionthough the DES measures enjoyment, it provides no nu-was not interpretable. Again, the first dimension repre-ance or discrimination among positive emotions along thesents positive versus negative affect. The extremes ofactivity dimension. It does not, for instance, assess posi-the second dimension are represented by the variablestive emotions of low activity such as contentment or love,‘‘industrious,’’ ‘‘independent,’’ and ‘‘creative’’ at thenor does it measure positive emotions with high activitynegative end and ‘‘peaceful,’’ ‘‘attractive,’’ and ‘‘sen-levels such as excitement.timental’’ at the positive end. Although this dimensionmight be interpreted as representing active (negativeMeasures Based on Plutchik’s Work. A two-dimen-
sional solution was also deemed appropriate for the MDS pole) versus inactive (positive pole) feelings, the valueson this dimension for some variables are not consistentanalysis of the descriptors used to measure the basic emo-
tions described by Plutchik (stress values for the one-, with that interpretation (e.g., contemplative Å 0.66,elated Å .88).two-, and three-dimensional solutions were .24, .14, and
.10, respectively; R2 values were 93.6 percent, 97.0 per- The Edell and Burke measure provided rather com-prehensive coverage of the multidimensional space.cent, and 97.9 percent, respectively). The first dimension
represents positivity of affect; the second dimension, However, because it does not have subscales to repre-
/ 9h0b$$se01 08-11-97 14:51:33 cresa UC: Con Res
This content downloaded from 202.130.161.208 on Thu, 30 Jul 2015 01:28:16 UTCAll use subject to JSTOR Terms and Conditions
137MEASURING EMOTIONS IN THE CONSUMPTION EXPERIENCE
FIGURE 2
PLOT OF MDS COORDINATES FOR DES, STUDY 5
NOTE.—Starting at the upper middle portion of the figure and continuing in a clockwise direction, letters in Figure 2 are defined as follows: i, interest; j,enjoyment; S, surprise; a, anger; c, contempt; d, disgust; D, distress; g, guilt; s, shame/shyness; f, fear.
sent specific feeling states, the measure can be used to CES Measure. The MDS analysis of the CES descrip-tors was performed separately for the two data collections.represent only the dimensions underlying the emotions
experienced. Most of the descriptors on the upbeat fac- In both solutions, the distribution of emotion descriptorsover multidimensional space was similar to that obtainedtor have positive values on the first dimension and are
thus located in the right half of the plot. All the descrip- in study 4.Compared with the DES and the Plutchik-based mea-tors on the negative factor are clustered at the left side
of the plot. The descriptors for the ‘‘warm’’ factor oc- sures, the CES provides more comprehensive coverageof the MDS space. In addition, its assessment of a largercupy primarily the top center position in the plot but
are also present elsewhere. One descriptor on the warm number of positive emotions allows discrimination amongpositive affect states. The CES provides somewhat betterfactor, ‘‘pensive,’’ appeared in the midst of the nega-
tive descriptors. This is not a commonly used word, coverage of the MDS space than does the Batra and Hol-brook measure. The Edell and Burke scales have theand confusion about its meaning may have caused this
anomaly. largest number of descriptors and provide the best cover-
/ 9h0b$$se01 08-11-97 14:51:33 cresa UC: Con Res
This content downloaded from 202.130.161.208 on Thu, 30 Jul 2015 01:28:16 UTCAll use subject to JSTOR Terms and Conditions
138 JOURNAL OF CONSUMER RESEARCH
FIGURE 3
PLOT OF MDS COORDINATES FOR PLUTCHIK-BASED MEASURES, STUDY 5
NOTE.—Starting at the upper middle portion of the figure and continuing in a clockwise direction, letters in Figure 3 are defined as follows: e, expectation; a,anger; d, disgust; S, surprise; s, sadness; f, fear; A, acceptance; j, joy.
age. However, these scales are not designed to measure correlation analysis was performed to determine the ex-tent to which these scales capture the variance in the morethe individual emotions a consumer may have experi-
enced. diverse set of emotions in the CES. In separate analysisfor each scale, the variables of the CES (summed withinclusters, where appropriate) composed the dependentRepresenting the Variancevariable set; the subscales of the preexisting measuresof Emotion Experiencesformed the predictor variable set. Redundancy coeffi-cients indicate the extent to which each of the scalesAlthough the CES more completely represents the vari-
ety of emotions experienced in the consumption context accounted for the variance in the CES.Consistent with Havlena and Holbrook’s (1986) find-than do the DES, Plutchik-based, and Batra and Holbrook
measures, it is a longer and thus less convenient scale. ings, in each analysis the first two canonical variates ac-counted for the major portion of the shared variance;Analyses were carried out to determine whether these
shorter measures can adequately represent the variance accordingly, redundancies were calculated with only thesetwo variates. Of the five scales, Edell and Burke’s mea-in the broader set of emotions measured by the CES.
Following Havlena and Holbrook (1986), canonical sure captured the most variance in the set of emotions
/ 9h0b$$se01 08-11-97 14:51:33 cresa UC: Con Res
This content downloaded from 202.130.161.208 on Thu, 30 Jul 2015 01:28:16 UTCAll use subject to JSTOR Terms and Conditions

139MEASURING EMOTIONS IN THE CONSUMPTION EXPERIENCE
FIGURE 4
PLOT OF MDS COORDINATES FOR BATRA AND HOLBROOK’S MEASURE, STUDY 5
NOTE.—Starting at the upper middle portion of the figure and continuing in a clockwise direction, symbols in Figure 4 are defined as follows: d, desire; A,activation; S, surgency; g, gratitude; l, social affection; r, restful; f, fear; b, bored; a, anger; i, irritation; k, skepticism.
measured by the CES (83.0 percent), with the PAD mea- of the descriptors and explained more than 60 percent ofthe variance for only two of the 20 specific emotions. Edellsure a distant second (58.6 percent). Redundancy was
lowest for the DES (47.9 percent). and Burke’s measure was able to explain more than 60percent of the variance for only six of the 20 CES emotions.This analysis shows the relative abilities of the five
measures to account for the variance in consumption- These findings, combined with those from the canonicalcorrelation analysis, suggest that the PAD and Edell andrelated emotions generally, but it provides no information
about their ability to reflect the individual and specific Burke’s measure are better able than the other measures tocapture the underlying dimensions of emotion experience,emotions assessed by the CES. This was tested by a series
of regression analyses. Each of the emotion variables in the purpose for which these measures were designed. Theydo not do an acceptable job, however, of representing spe-the CES was regressed on the summed subscales of each
of the other five measures. The resulting R2 values for cific consumption emotion states.Of the measures studied here, the DES best capturesthe five scales are shown in Table 2.
The PAD measure was least able to represent the variance the variance of the individual emotions. It accounts formore than 20 percent of the variance in each of the CESof the individual emotions measured by the CES. It was
unable to explain even 20 percent of the variance in seven emotions and more than 60 percent of the variance in
/ 9h0b$$se01 08-11-97 14:51:33 cresa UC: Con Res
This content downloaded from 202.130.161.208 on Thu, 30 Jul 2015 01:28:16 UTCAll use subject to JSTOR Terms and Conditions
140 JOURNAL OF CONSUMER RESEARCH
FIGURE 5
PLOT OF MDS COORDINATES FOR EDELL AND BURKE’S MEASURE, STUDY 5
more than half of them. As noted earlier, however, the of emotions present in consumption situations. Study 6DES measures only one positive emotion, enjoyment, and examines the predictive validity of the CES relative tothus does not discriminate among positive emotion states. the other measures. The CES is designed to measure con-The variance in the positive emotions in Table 2 explained sumption-related emotions, and it should be superior toby the DES is due almost solely to these variables’ corre- other emotion measures in differentiating among the com-lations with the enjoyment subscale. plex sets of feelings that occur in different consumption
All of the scales were inadequate in representing the situations.variance of some of the specific emotions in the CES. There are many ways to classify consumption situa-None of the measures accounted for at least 50 percent tions. For purposes of this study, a consumption situationof the variance in five emotions (shame, envy, loneliness, is defined by type of product consumed. Study 6 assesseseagerness, and relief). the ability of the CES, compared with other emotion mea-
sures, to discriminate among different consumption situa-STUDY 6 tions on the basis of emotions experienced. Since emo-
tions are likely to be strongest when a product orStudy 5 demonstrates the superiority of the CES toother measurement instruments in assessing the variety consumption situation is important to a consumer, this
/ 9h0b$$se01 08-11-97 14:51:33 cresa UC: Con Res
This content downloaded from 202.130.161.208 on Thu, 30 Jul 2015 01:28:16 UTCAll use subject to JSTOR Terms and Conditions
141MEASURING EMOTIONS IN THE CONSUMPTION EXPERIENCE
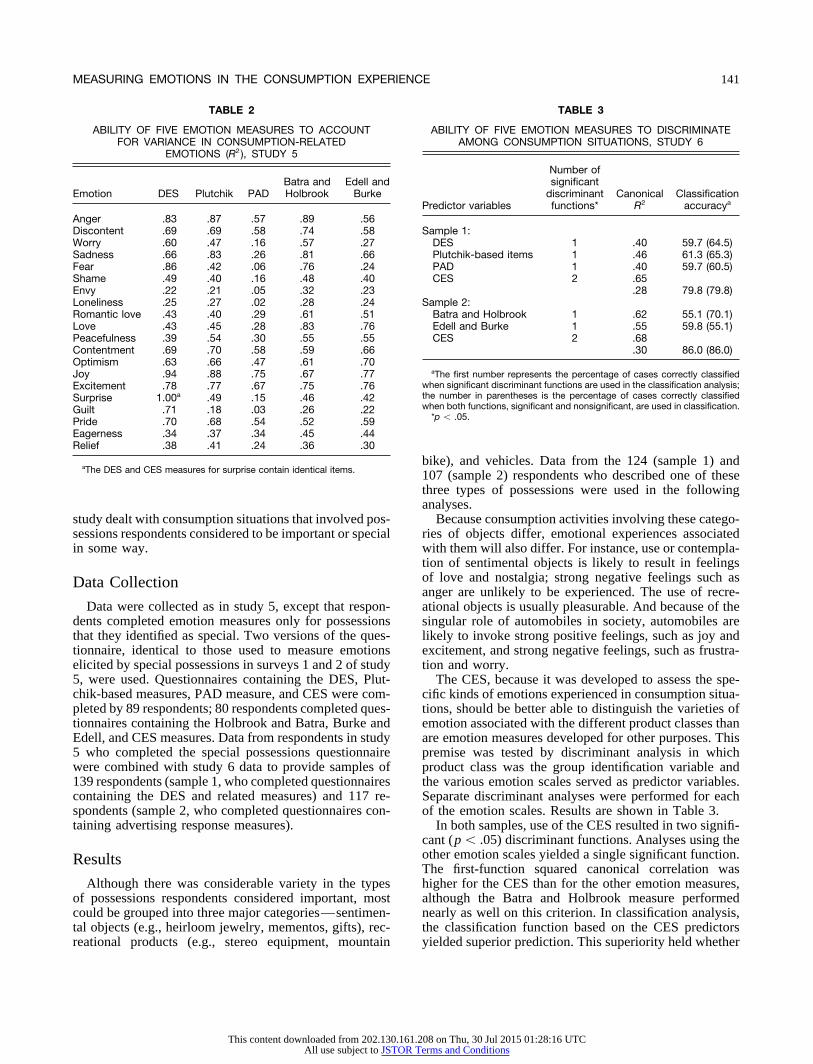
TABLE 2 TABLE 3
ABILITY OF FIVE EMOTION MEASURES TO ACCOUNT ABILITY OF FIVE EMOTION MEASURES TO DISCRIMINATEAMONG CONSUMPTION SITUATIONS, STUDY 6FOR VARIANCE IN CONSUMPTION-RELATED
EMOTIONS (R2 ), STUDY 5
Number ofsignificantBatra and Edell and
Emotion DES Plutchik PAD Holbrook Burke discriminant Canonical ClassificationPredictor variables functions* R2 accuracya
Anger .83 .87 .57 .89 .56Discontent .69 .69 .58 .74 .58 Sample 1:
DES 1 .40 59.7 (64.5)Worry .60 .47 .16 .57 .27Sadness .66 .83 .26 .81 .66 Plutchik-based items 1 .46 61.3 (65.3)
PAD 1 .40 59.7 (60.5)Fear .86 .42 .06 .76 .24Shame .49 .40 .16 .48 .40 CES 2 .65
.28 79.8 (79.8)Envy .22 .21 .05 .32 .23Loneliness .25 .27 .02 .28 .24 Sample 2:
Batra and Holbrook 1 .62 55.1 (70.1)Romantic love .43 .40 .29 .61 .51Love .43 .45 .28 .83 .76 Edell and Burke 1 .55 59.8 (55.1)
CES 2 .68Peacefulness .39 .54 .30 .55 .55Contentment .69 .70 .58 .59 .66 .30 86.0 (86.0)Optimism .63 .66 .47 .61 .70
aThe first number represents the percentage of cases correctly classifiedJoy .94 .88 .75 .67 .77when significant discriminant functions are used in the classification analysis;Excitement .78 .77 .67 .75 .76the number in parentheses is the percentage of cases correctly classifiedSurprise 1.00a .49 .15 .46 .42when both functions, significant and nonsignificant, are used in classification.Guilt .71 .18 .03 .26 .22
*p õ .05.Pride .70 .68 .54 .52 .59Eagerness .34 .37 .34 .45 .44Relief .38 .41 .24 .36 .30
bike), and vehicles. Data from the 124 (sample 1) andaThe DES and CES measures for surprise contain identical items. 107 (sample 2) respondents who described one of these
three types of possessions were used in the followinganalyses.
Because consumption activities involving these catego-study dealt with consumption situations that involved pos-sessions respondents considered to be important or special ries of objects differ, emotional experiences associated
with them will also differ. For instance, use or contempla-in some way.tion of sentimental objects is likely to result in feelingsof love and nostalgia; strong negative feelings such asData Collectionanger are unlikely to be experienced. The use of recre-
Data were collected as in study 5, except that respon- ational objects is usually pleasurable. And because of thedents completed emotion measures only for possessions singular role of automobiles in society, automobiles arethat they identified as special. Two versions of the ques- likely to invoke strong positive feelings, such as joy andtionnaire, identical to those used to measure emotions excitement, and strong negative feelings, such as frustra-elicited by special possessions in surveys 1 and 2 of study tion and worry.5, were used. Questionnaires containing the DES, Plut- The CES, because it was developed to assess the spe-chik-based measures, PAD measure, and CES were com- cific kinds of emotions experienced in consumption situa-pleted by 89 respondents; 80 respondents completed ques- tions, should be better able to distinguish the varieties oftionnaires containing the Holbrook and Batra, Burke and emotion associated with the different product classes thanEdell, and CES measures. Data from respondents in study are emotion measures developed for other purposes. This5 who completed the special possessions questionnaire premise was tested by discriminant analysis in whichwere combined with study 6 data to provide samples of product class was the group identification variable and139 respondents (sample 1, who completed questionnaires the various emotion scales served as predictor variables.containing the DES and related measures) and 117 re- Separate discriminant analyses were performed for eachspondents (sample 2, who completed questionnaires con- of the emotion scales. Results are shown in Table 3.taining advertising response measures). In both samples, use of the CES resulted in two signifi-
cant (p õ .05) discriminant functions. Analyses using theother emotion scales yielded a single significant function.ResultsThe first-function squared canonical correlation washigher for the CES than for the other emotion measures,Although there was considerable variety in the types
of possessions respondents considered important, most although the Batra and Holbrook measure performednearly as well on this criterion. In classification analysis,could be grouped into three major categories—sentimen-
tal objects (e.g., heirloom jewelry, mementos, gifts), rec- the classification function based on the CES predictorsyielded superior prediction. This superiority held whetherreational products (e.g., stereo equipment, mountain
/ 9h0b$$se01 08-11-97 14:51:33 cresa UC: Con Res
This content downloaded from 202.130.161.208 on Thu, 30 Jul 2015 01:28:16 UTCAll use subject to JSTOR Terms and Conditions
142 JOURNAL OF CONSUMER RESEARCH
the classification analysis was based on significant vari- related emotions. However, it omits some emotions thatare important in some consumption situations. Guilt,ates only or on both variates regardless of statistical sig-
nificance. worry, eagerness, and optimism were feeling states im-portant for distinguishing the three consumption situa-In the discriminant analysis using the CES measures,
the first discriminant function had high positive loadings tions analyzed in study 6. The Batra and Holbrook mea-sure does not assess any of these feelings. The Edell andfor the emotions worry, anger, and excitement and a
strong negative loading for love. This function served to Burke measure is also less suited to study consumption-evoked emotions. Although this measure represents theseparate consumption experiences associated with senti-
mental objects from experiences associated with cars and multidimensional space of emotions well, the scale makesno provision for differentiating among specific emotions.recreational possessions. The second discriminant func-
tion had strong negative loadings for guilt and worry It is also the longest of the measures tested but did nobetter than the other, shorter measures in discriminatingand positive loadings for eagerness and optimism. This
function discriminated among all three product-related among the consumption situations examined in study 6.Both advertising-oriented measures contain several itemsconsumption experiences. Respondents describing their
emotional experiences involving recreational objects were that are more relevant to assessing reactions to advertise-ments than to consumption experiences. Such feelingsmost likely to report experiencing eagerness and optimism
and were less likely than the automobile group to report as suspicious, bored, uninvolved, and dull were rarelyreported by respondents in studies 5 and 6.feelings of guilt and worry.
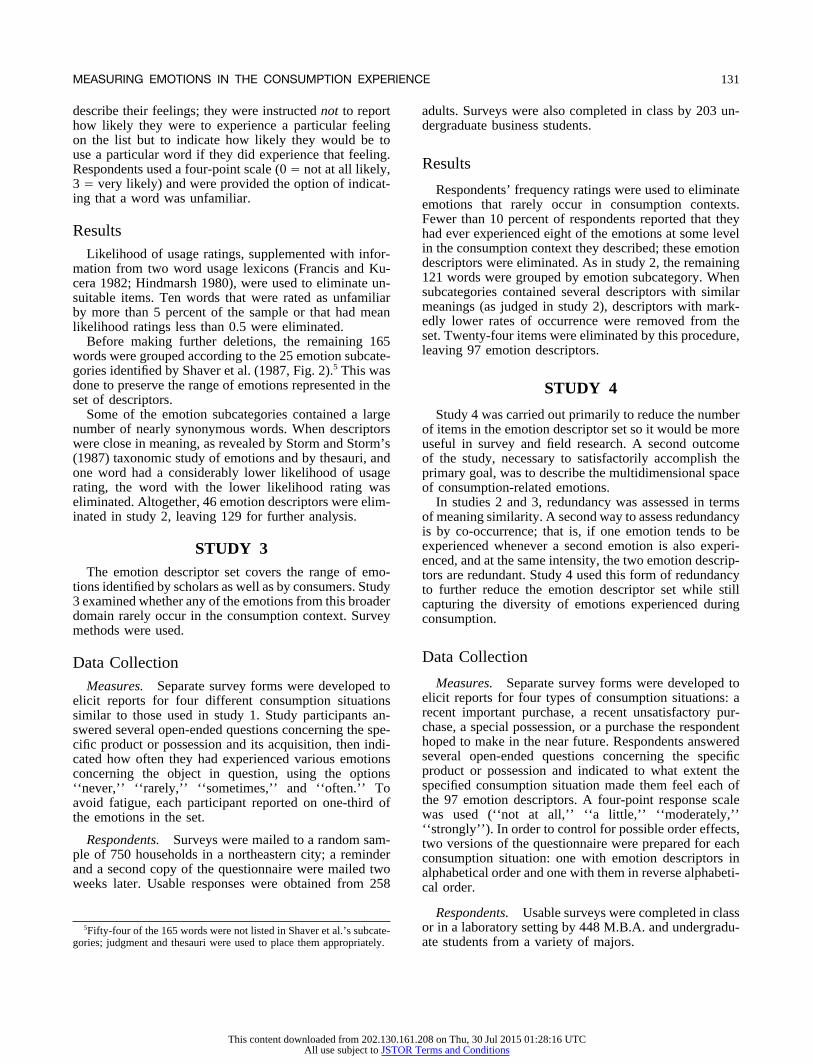
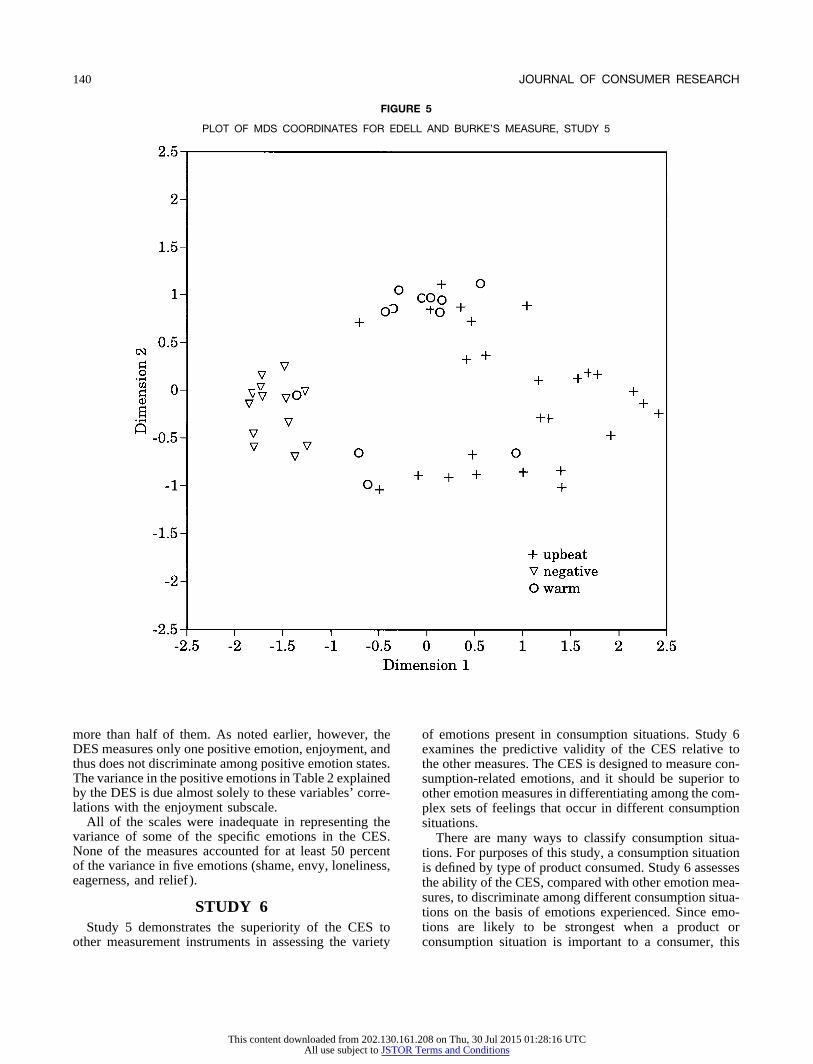
The means for the three consumption situations (sam- The CES described in this article is not intended to bea definitive assessment tool. Rather, it should be consid-ples 1 and 2 combined) are graphed in Figure 6. Means
have been corrected for differences in subscale length. ered as the starting point in determining the proper assess-ment of consumption-related emotions. It aims for a rela-As expected, sentimental objects were the least likely to
evoke negative feelings such as anger and fear and most tively broad, but not exhaustive, coverage of consumptionemotion states. Future research may reveal that somelikely to evoke feelings of love (Scheffe posterior con-
trasts, p õ .01). They were also most likely to create emotion states not present in the set of descriptors areimportant to some aspect of consumer behavior, and somefeelings of loneliness (p õ .01). In all three consumption
situations, the positive emotions of joy, pride, and con- emotion states in the CES are probably irrelevant to someof the phenomena studied in consumer behavior research.tentment were strongly experienced; consumption situa-
tions involving automobiles and recreational objects also Future research that examines the applicability of the CESin different contexts or with respect to different facets ofwere accompanied by significantly higher feelings of ex-
citement (põ .01). Few negative emotions were reported behavior may, and should, suggest revisions to the CES.Neither is it expected that researchers will necessarilyby respondents, but moderate levels of anger and worry
were reported for both automobiles and recreational ob- use the CES in its entirety for a particular study. Forsome contexts, theory or common sense may suggest thatjects. Consumption situations involving automobiles were
the most likely to evoke guilt (p õ .05). These findings certain emotions are unlikely to be experienced; in thesecases, the researcher may choose to omit the descriptorsare in line with the expectation that consumption situa-
tions involving automobiles would involve both positive for those emotions from their measuring instrument. Instudies of emotion, researchers may routinely choose toand negative emotions to a greater extent than the other
consumption situations. omit the descriptors measuring surprise, as many emotionscholars consider it an unvalenced cognitive state ratherthan an emotion. For some purposes, however (in satisfac-DISCUSSIONtion research, for instance), surprise might be considereda useful variable in its own right.The studies reported in this article culminated in the
CES, a set of descriptors that represents the range of In the data collections reported here, four-point re-sponse scales were used for the CES. A four-point scaleemotions consumers most frequently experience in con-
sumption situations. The measures most commonly used was chosen because subjects were responding to ratherlengthy lists of descriptors and the task was less burden-for this purpose in prior research—the DES, the PAD,
and Plutchik-based measures—do not represent the diver- some with a small number of scale points. Other studiesnot reported here have successfully used a five-point scalesity of these emotions and thus may be inadequate for
some research purposes. These earlier measures may be for the CES and a six-point scale may be feasible forsome populations.particularly inappropriate when the researcher desires a
broad assessment of the emotions a consumer might be Although scholars have shown an interest in studyingthe emotional aspects of consumer behavior, limitationsexperiencing or when theory offers little a priori informa-
tion about the kinds of emotional states that may be rele- of the existing measures have hampered progress. Thepresent research was undertaken to help stimulate addi-vant to the behavior under investigation.
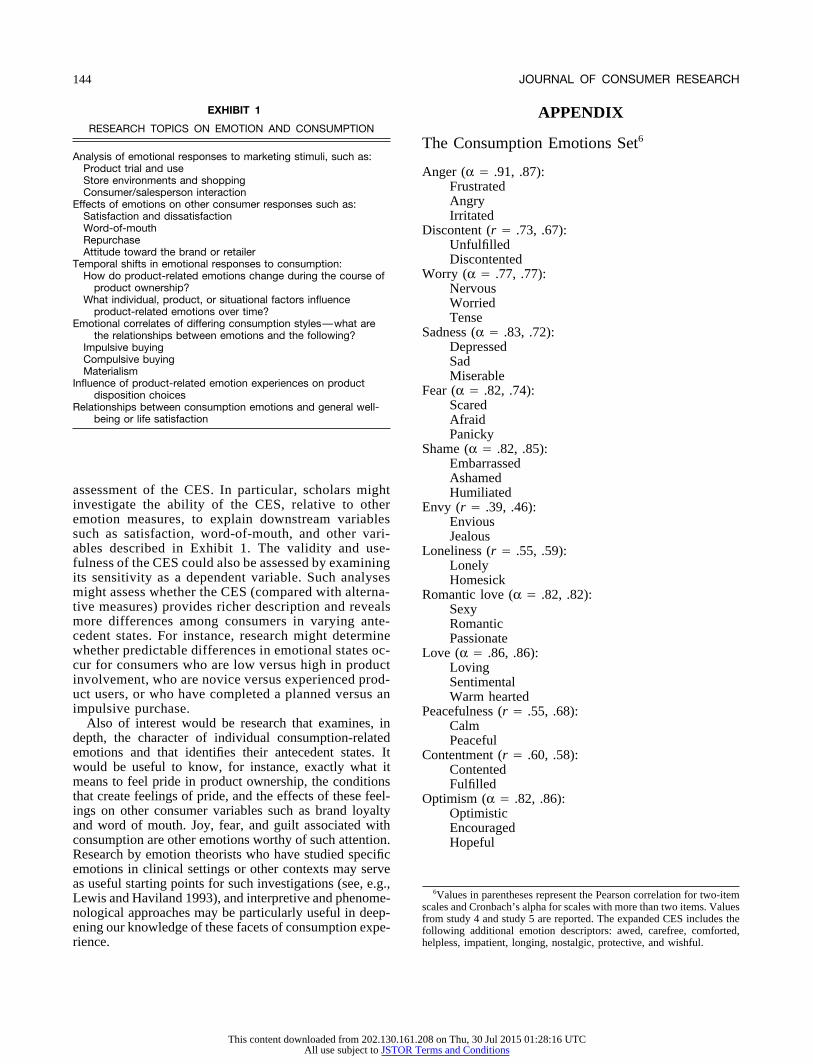
Two measures of emotions elicited by advertising were tional research in this regard. Some of the topics to whichthe CES might be applied are described in Exhibit 1.also studied. The Batra and Holbrook measure was nearly
as comprehensive as the CES in assessing consumption- Future research might also continue the validation
/ 9h0b$$se01 08-11-97 14:51:33 cresa UC: Con Res
This content downloaded from 202.130.161.208 on Thu, 30 Jul 2015 01:28:16 UTCAll use subject to JSTOR Terms and Conditions
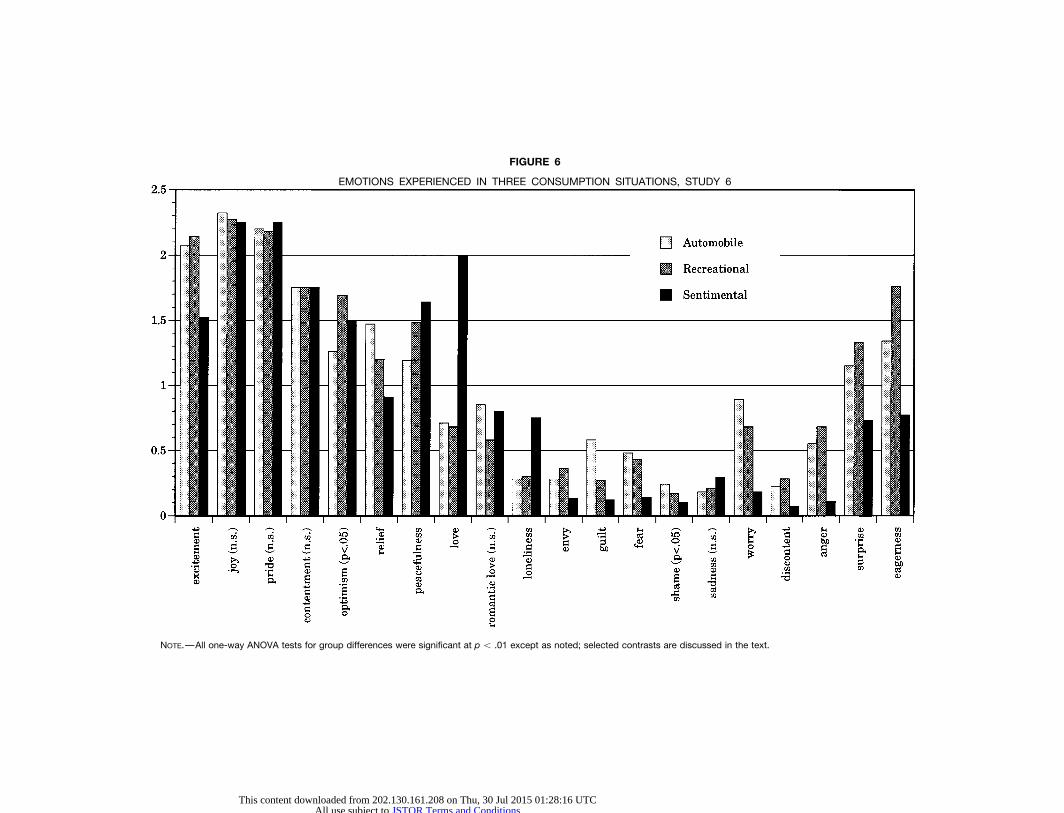
FIGURE 6
EMOTIONS EXPERIENCED IN THREE CONSUMPTION SITUATIONS, STUDY 6
NOTE.—All one-way ANOVA tests for group differences were significant at p õ .01 except as noted; selected contrasts are discussed in the text.
/9h0b$$se0108-11-97
14:51:33cresa
UC
:C
onR
es
This content downloaded from 202.130.161.208 on Thu, 30 Jul 2015 01:28:16 UTCAll use subject to JSTOR Terms and Conditions
144 JOURNAL OF CONSUMER RESEARCH
EXHIBIT 1 APPENDIXRESEARCH TOPICS ON EMOTION AND CONSUMPTION
The Consumption Emotions Set6
Analysis of emotional responses to marketing stimuli, such as:Product trial and use Anger (a Å .91, .87):Store environments and shopping FrustratedConsumer/salesperson interaction
AngryEffects of emotions on other consumer responses such as:Satisfaction and dissatisfaction IrritatedWord-of-mouth Discontent (r Å .73, .67):Repurchase UnfulfilledAttitude toward the brand or retailer
DiscontentedTemporal shifts in emotional responses to consumption:Worry (a Å .77, .77):How do product-related emotions change during the course of
product ownership? NervousWhat individual, product, or situational factors influence Worried
product-related emotions over time? TenseEmotional correlates of differing consumption styles—what areSadness (a Å .83, .72):the relationships between emotions and the following?
Impulsive buying DepressedCompulsive buying SadMaterialism Miserable
Influence of product-related emotion experiences on productFear (a Å .82, .74):disposition choices
ScaredRelationships between consumption emotions and general well-being or life satisfaction Afraid
PanickyShame (a Å .82, .85):
EmbarrassedAshamed
assessment of the CES. In particular, scholars might Humiliatedinvestigate the ability of the CES, relative to other Envy (r Å .39, .46):emotion measures, to explain downstream variables Envioussuch as satisfaction, word-of-mouth, and other vari- Jealousables described in Exhibit 1. The validity and use- Loneliness (r Å .55, .59):fulness of the CES could also be assessed by examining Lonelyits sensitivity as a dependent variable. Such analyses Homesickmight assess whether the CES (compared with alterna- Romantic love (a Å .82, .82):tive measures) provides richer description and reveals Sexymore differences among consumers in varying ante- Romanticcedent states. For instance, research might determine Passionatewhether predictable differences in emotional states oc- Love (a Å .86, .86):cur for consumers who are low versus high in product Lovinginvolvement, who are novice versus experienced prod- Sentimentaluct users, or who have completed a planned versus an Warm heartedimpulsive purchase. Peacefulness (r Å .55, .68):
Also of interest would be research that examines, in Calmdepth, the character of individual consumption-related Peacefulemotions and that identifies their antecedent states. It Contentment (r Å .60, .58):would be useful to know, for instance, exactly what it Contentedmeans to feel pride in product ownership, the conditions Fulfilledthat create feelings of pride, and the effects of these feel- Optimism (a Å .82, .86):ings on other consumer variables such as brand loyalty Optimisticand word of mouth. Joy, fear, and guilt associated with Encouragedconsumption are other emotions worthy of such attention. HopefulResearch by emotion theorists who have studied specificemotions in clinical settings or other contexts may serveas useful starting points for such investigations (see, e.g.,
6Values in parentheses represent the Pearson correlation for two-itemLewis and Haviland 1993), and interpretive and phenome-scales and Cronbach’s alpha for scales with more than two items. Valuesnological approaches may be particularly useful in deep- from study 4 and study 5 are reported. The expanded CES includes the
ening our knowledge of these facets of consumption expe- following additional emotion descriptors: awed, carefree, comforted,helpless, impatient, longing, nostalgic, protective, and wishful.rience.
/ 9h0b$$se01 08-11-97 14:51:33 cresa UC: Con Res
This content downloaded from 202.130.161.208 on Thu, 30 Jul 2015 01:28:16 UTCAll use subject to JSTOR Terms and Conditions
145MEASURING EMOTIONS IN THE CONSUMPTION EXPERIENCE
Advances in Consumer Research, Vol. 15, ed. Michael J.Joy (a Å .91, .88):Houston, Provo, UT: Association for Consumer Research,Happy127–130.Pleased
Havlena, William J. (1985), The Varieties of Consumption Ex-Joyfulperience, unpublished doctoral dissertation, School ofExcitement (a Å .88, .89): Business, Columbia University, New York, NY 10027.
Excited and Morris B. Holbrook (1986), ‘‘The Varieties of Con-Thrilled sumption Experience: Comparing Two Typologies of Emo-Enthusiastic tion in Consumer Behavior,’’ Journal of Consumer Re-
Surprise (N.A., a Å .81): search, 13 (December), 394–404.Surprised , Morris B. Holbrook, and Donald R. Lehmann (1989),Amazed ‘‘Assessing the Validity of Emotional Typologies,’’ Psy-
chology & Marketing, 6 (Summer), 97–112.AstonishedHindmarsh, Roland (1980), Cambridge English Lexicon, Cam-Other items:
bridge: Cambridge University Press.GuiltyHolbrook, Morris B., Robert W. Chestnut, Terence A. Oliva,Proud
and Eric A. Greenleaf (1984), ‘‘Play as a ConsumptionEagerExperience: The Roles of Emotions, Performance, and Per-Relieved sonality in the Enjoyment of Games,’’ Journal of Con-sumer Research, 11 (September), 728–739.
[Received December 1994. Revised December 1996. and Richard A. Westwood (1989), ‘‘The Role of Emo-tion in Advertising Revisited: Testing a Typology of Emo-Brian Sternthal served as editor and Deborah Roeddertional Responses,’’ in Cognitive and Affective ResponsesJohn served as associate editor for this article.]to Advertising, ed. Patricia Cafferata and Alice M. Tybout,Lexington, MA: Lexington Books, 353–371.
REFERENCES Izard, Carroll E. (1977), Human Emotions, New York: Ple-num.Aaker, David A., Douglas M. Stayman, and Richard Vezina
Larsen, Randy J. and Edward Diener (1992), ‘‘Promised(1988), ‘‘Identifying Feelings Elicited by Advertising,’’and Problems with the Circumplex Model of Emotion,’’Psychology & Marketing, 5 (Spring), 1–16.in Review of Personality and Social Psychology, Vol.Allen, Chris T., Karen A. Machleit, and Susan S. Marine13, ed. Margaret S. Clark, Newbury Park, CA: Sage,(1988), ‘‘On Assessing the Emotionality of Advertising25 –59.Via Izard’s Differential Emotions Scale,’’ in Advances
Laverie, Debra A., Robert F. Kleine III, and Susan Schultzin Consumer Research, Vol. 15, ed. Michael J. Houston,Kleine (1993), ‘‘Linking Emotions and Values in Con-Provo, UT: Association for Consumer Research, 226 –sumption Experiences: An Exploratory Study,’’ in Ad-231.vances in Consumer Research, Vol. 20, ed. Leigh McAlis-Batra, Rajeev and Morris B. Holbrook (1990), ‘‘Developing ater and Michael L. Rothschild, Provo, UT: Association forTypology of Affective Responses to Advertising,’’ Psy-Consumer Research, 70–75.chology & Marketing, 7 (Spring), 11–25.
Lewis, Michael and Jeannette M. Haviland (1993), HandbookClore, Gerald L., Andrew Ortony, and Mark A. Foss (1987),of Emotions, New York: Guilford.‘‘The Psychological Foundations of the Affective Lexi-
MacKinnon, Neil J. and Leo J. Keating (1989), ‘‘The Structurecon,’’ Journal of Personality and Social Psychology, 53of Emotions: Canada-United States Comparisons,’’ Social(October), 751–755.Psychology Quarterly, 52 (March), 70–83.Cohen, Joel B. and Charles S. Areni (1991), ‘‘Affect and Con-
Mandler, George (1984), Mind and Body, New York: Norton.sumer Behavior,’’ in Handbook of Consumer Behavior, ed.Mano, Haim and Richard L. Oliver (1993), ‘‘Assessing theThomas S. Robertson and Harold H. Kassarjian, Engle-
Dimensionality and Structure of the Consumption Ex-wood Cliffs, NJ: Prentice-Hall, 188–240.perience: Evaluation, Feeling, and Satisfaction,’’ Jour-Darwin, Charles ([1872] 1979), The Expression of Emotions innal of Consumer Research, 20 (December), 451 – 466.Man and Animals, New York: St. Martin’s, 1979.
Mehrabian, Albert and James A. Russell (1974), An Ap-Davitz, Joel R. (1969), The Language of Emotion, New York:proach to Environmental Psychology, Cambridge, MA:Academic Press.MIT Press.Derbaix, Christian and Michel T. Pham (1991), ‘‘Affective Re-
and Warren J. Wixen (1986), ‘‘Preferences for Individ-actions to Consumption Situations: A Pilot Investigation,’’ual Video Games as a Function of Their Emotional EffectsJournal of Economic Psychology, 12 (June), 325–355.on Players,’’ Journal of Applied Social Psychology, 16 (1),Edell, Julie A. and Marian Chapman Burke (1987), ‘‘The Power3–15.of Feelings in Understanding Advertising Effects,’’ Jour-
Morgan, Rich L. and David Heise (1988), ‘‘Structure ofnal of Consumer Research, 14 (December), 421–433.Emotions,’’ Social Psychology Quarterly, 51 (March),Francis, W. Nelson and Henry Kucera (1982), Frequency Analy-19 –31.sis of English Usage: Lexicon and Grammar, Boston:
Oliver, Richard L. (1992), ‘‘An Investigation of the Attri-Houghton-Mifflin.bute Basis of Emotion and Related Affects in Consump-Frijda, Nico H. (1986), The Emotions, Cambridge: Cambridgetion,’’ in Advances in Consumer Research, Vol. 19, ed.University Press.John F. Sherry, Jr., and Brian Sternthal, Provo, UT:Gardner, Meryl Paula and Dennis W. Rook (1988), ‘‘Effects of
Impulse Purchases on Consumers’ Affective States,’’ in Association for Consumer Research, 237 – 244.
/ 9h0b$$se01 08-11-97 14:51:33 cresa UC: Con Res
This content downloaded from 202.130.161.208 on Thu, 30 Jul 2015 01:28:16 UTCAll use subject to JSTOR Terms and Conditions
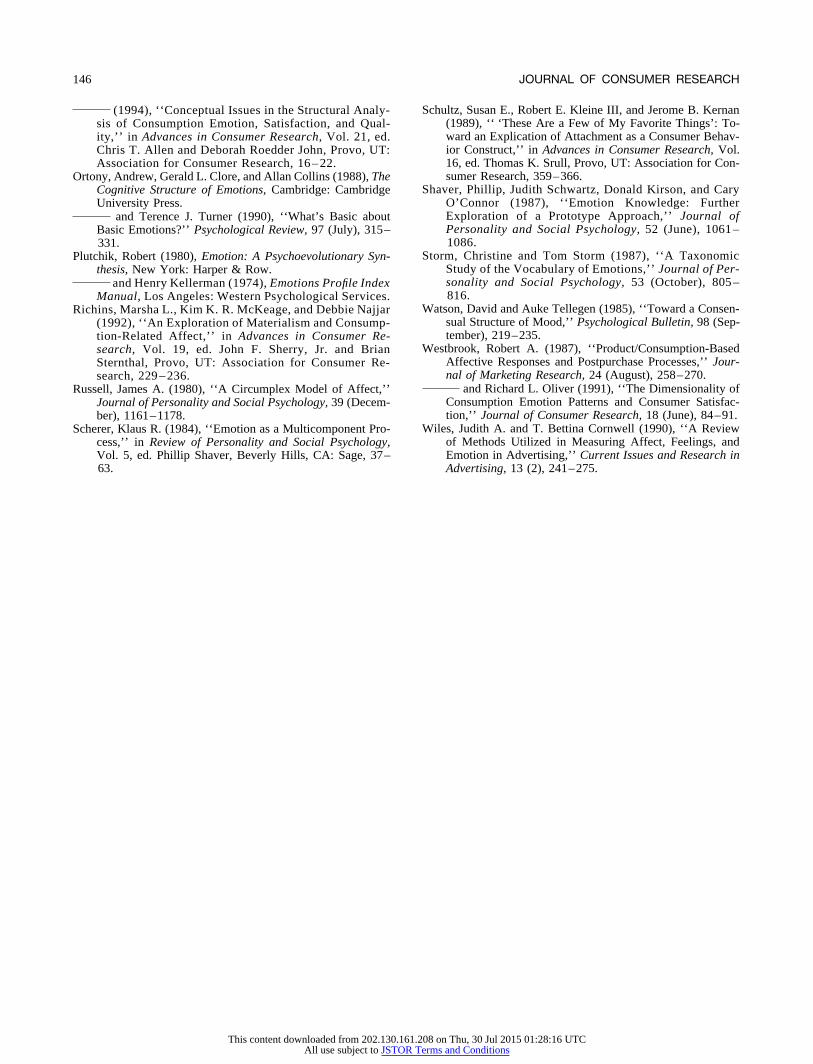
146 JOURNAL OF CONSUMER RESEARCH
Schultz, Susan E., Robert E. Kleine III, and Jerome B. Kernan(1994), ‘‘Conceptual Issues in the Structural Analy-(1989), ‘‘ ‘These Are a Few of My Favorite Things’: To-sis of Consumption Emotion, Satisfaction, and Qual-ward an Explication of Attachment as a Consumer Behav-ity,’’ in Advances in Consumer Research, Vol. 21, ed.ior Construct,’’ in Advances in Consumer Research, Vol.Chris T. Allen and Deborah Roedder John, Provo, UT:16, ed. Thomas K. Srull, Provo, UT: Association for Con-Association for Consumer Research, 16 – 22.sumer Research, 359–366.Ortony, Andrew, Gerald L. Clore, and Allan Collins (1988), The
Shaver, Phillip, Judith Schwartz, Donald Kirson, and CaryCognitive Structure of Emotions, Cambridge: CambridgeO’Connor (1987), ‘‘Emotion Knowledge: FurtherUniversity Press.Exploration of a Prototype Approach,’’ Journal ofand Terence J. Turner (1990), ‘‘What’s Basic aboutPersonality and Social Psychology, 52 (June), 1061 –Basic Emotions?’’ Psychological Review, 97 (July), 315–1086.331.
Storm, Christine and Tom Storm (1987), ‘‘A TaxonomicPlutchik, Robert (1980), Emotion: A Psychoevolutionary Syn-Study of the Vocabulary of Emotions,’’ Journal of Per-thesis, New York: Harper & Row.sonality and Social Psychology, 53 (October), 805 –and Henry Kellerman (1974), Emotions Profile Index816.Manual, Los Angeles: Western Psychological Services.
Watson, David and Auke Tellegen (1985), ‘‘Toward a Consen-Richins, Marsha L., Kim K. R. McKeage, and Debbie Najjarsual Structure of Mood,’’ Psychological Bulletin, 98 (Sep-(1992), ‘‘An Exploration of Materialism and Consump-tember), 219–235.tion-Related Affect,’’ in Advances in Consumer Re-
Westbrook, Robert A. (1987), ‘‘Product/Consumption-Basedsearch, Vol. 19, ed. John F. Sherry, Jr. and BrianAffective Responses and Postpurchase Processes,’’ Jour-Sternthal, Provo, UT: Association for Consumer Re-nal of Marketing Research, 24 (August), 258–270.search, 229 – 236.
and Richard L. Oliver (1991), ‘‘The Dimensionality ofRussell, James A. (1980), ‘‘A Circumplex Model of Affect,’’Consumption Emotion Patterns and Consumer Satisfac-Journal of Personality and Social Psychology, 39 (Decem-tion,’’ Journal of Consumer Research, 18 (June), 84–91.ber), 1161–1178.
Wiles, Judith A. and T. Bettina Cornwell (1990), ‘‘A ReviewScherer, Klaus R. (1984), ‘‘Emotion as a Multicomponent Pro-of Methods Utilized in Measuring Affect, Feelings, andcess,’’ in Review of Personality and Social Psychology,Emotion in Advertising,’’ Current Issues and Research inVol. 5, ed. Phillip Shaver, Beverly Hills, CA: Sage, 37–
63. Advertising, 13 (2), 241–275.
/ 9h0b$$se01 08-11-97 14:51:33 cresa UC: Con Res
This content downloaded from 202.130.161.208 on Thu, 30 Jul 2015 01:28:16 UTCAll use subject to JSTOR Terms and Conditions


![Capturing & Measuring Emotions in UX · The Plutchik Emotion Wheel [1], developed by Plutchik, offered a variety of emotions that were more nuanced than the eight primary emotions](https://img.pdfslide.net/doc/110x75/5e6d7ba926154f67de6b0d4d/capturing-measuring-emotions-in-ux-the-plutchik-emotion-wheel-1-developed.jpg)