Embed Size (px)
Citation preview
MEASURINGENVIRONMENTAL PERFORMANCE:A Primer and Survey of Metrics In Use
Global Environmental Management Initiative
- i -
MEASURING ENVIRONMENTALPERFORMANCE:A Primer and Survey of Metrics In Use
Global Environmental Management Initiative818 Connecticut Ave., N.W.
Second FloorWashington, D.C. 20006
(202) 296-7449E-mail: [email protected]
1998
Printed on recycled paper
- ii -
Table of Contents About the Global Environmental Management Initiative . iv
Preface . . . . . . . . . . . . . . . . . . . . . . . . . . . . . . . . . . v
Acknowledgments . . . . . . . . . . . . . . . . . . . . . . . . . . vii
Executive Summary . . . . . . . . . . . . . . . . . . . . . . . . . ES-1
Chapter 1Survey of Tools (Metrics) for Measuring Environmental Performance . . . . . . . . . . . . . . 1
Chapter 2 Considerations for Designing, Implementing, Evaluating, and Improving a Metrics Program . . . . . . . . . 17
Chapter 3 Trends in Environmental Performance Measurement . . . . . . 31
Bibliography . . . . . . . . . . . . . . . . . . . . . . . . . . . . . . 33
Appendix A Case Study - DuPont: Integrating Environmental with Business Performance Measures . . . . . . . . . . . . . . . . . . . . . . . . . A-1
Appendix B Case Study - Procter and Gamble: A Global, Yet Flexible Approach to HS&E Metrics . . . . . . . . B-1
Appendix C Case Study - Kodak: Development of an Environmental Performance Index . . . . . . . . . . . . . . . . . . . . . . . . . . . C-1
Appendix DCase Study - Stanley’s Environmental Performance Evaluation Program . . . . . . . . . . . . . . . . . . . . . . . . . . . D-1
List of Figures
Figure 1 Management System Performance Measurements Bristol-Myers Squibb Results . . . . . . . . . . . . . . 10
Figure 2 Conoco Environmental Cost-Effectiveness Index . . 16
Figure 3The Plan-Do-Check-Act Cycle . . . . . . . . . . . . . . 17
List of Tables
Table 1Examples of Measures in Use . . . . . . . . . . . . . 2
Table 2Leading vs. Lagging Indicators . . . . . . . . . . . . 3
Table 3 Hughes Electronics SARA Data 1988-1994 . . . . . 5
Table 4Advantages & Disadvantages of Indices . . . . . . . 13
Table 5Development in EPIs from 1993 to 1995. . . . . . . 14
Table 6Reasons for Measuring Environmental Performance 21
- iii -
About the Global Environmental Management Initiative
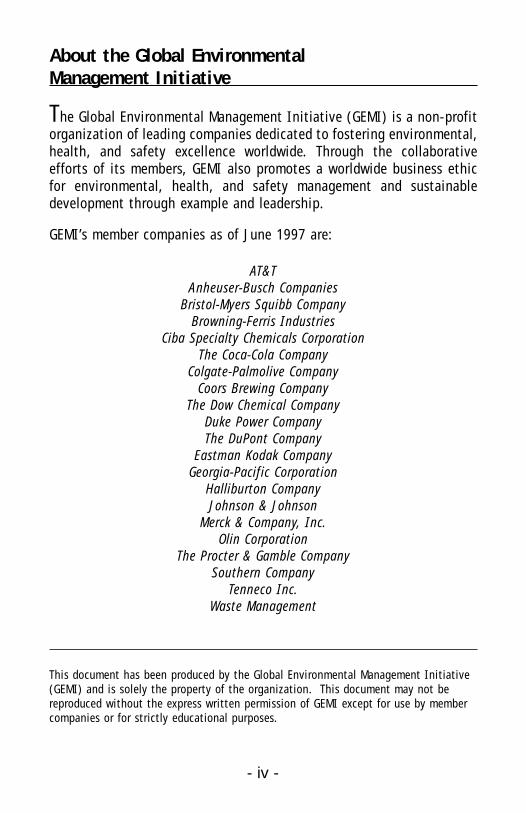
The Global Environmental Management Initiative (GEMI) is a non-profitorganization of leading companies dedicated to fostering environmental,health, and safety excellence worldwide. Through the collaborativeefforts of its members, GEMI also promotes a worldwide business ethicfor environmental, health, and safety management and sustainabledevelopment through example and leadership.
GEMI’s member companies as of June 1997 are:
AT&TAnheuser-Busch Companies
Bristol-Myers Squibb CompanyBrowning-Ferris Industries
Ciba Specialty Chemicals CorporationThe Coca-Cola Company
Colgate-Palmolive CompanyCoors Brewing Company
The Dow Chemical CompanyDuke Power CompanyThe DuPont Company
Eastman Kodak CompanyGeorgia-Pacific Corporation
Halliburton CompanyJohnson & Johnson
Merck & Company, Inc.Olin Corporation
The Procter & Gamble CompanySouthern Company
Tenneco Inc.Waste Management
This document has been produced by the Global Environmental Management Initiative(GEMI) and is solely the property of the organization. This document may not bereproduced without the express written permission of GEMI except for use by membercompanies or for strictly educational purposes.
- iv -
- v -
Preface
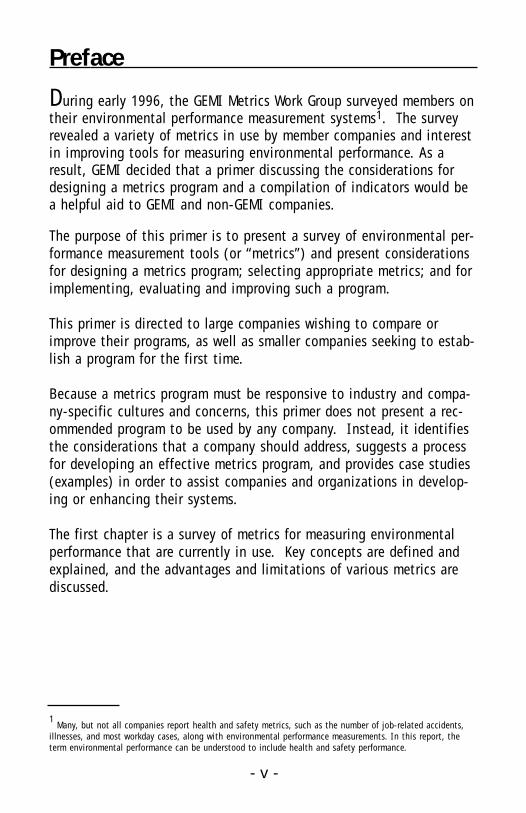
During early 1996, the GEMI Metrics Work Group surveyed members ontheir environmental performance measurement systems1. The surveyrevealed a variety of metrics in use by member companies and interestin improving tools for measuring environmental performance. As aresult, GEMI decided that a primer discussing the considerations fordesigning a metrics program and a compilation of indicators would bea helpful aid to GEMI and non-GEMI companies.
The purpose of this primer is to present a survey of environmental per-formance measurement tools (or “metrics”) and present considerationsfor designing a metrics program; selecting appropriate metrics; and forimplementing, evaluating and improving such a program.
This primer is directed to large companies wishing to compare orimprove their programs, as well as smaller companies seeking to estab-lish a program for the first time.
Because a metrics program must be responsive to industry and compa-ny-specific cultures and concerns, this primer does not present a rec-ommended program to be used by any company. Instead, it identifiesthe considerations that a company should address, suggests a processfor developing an effective metrics program, and provides case studies(examples) in order to assist companies and organizations in develop-ing or enhancing their systems.
The first chapter is a survey of metrics for measuring environmentalperformance that are currently in use. Key concepts are defined andexplained, and the advantages and limitations of various metrics arediscussed.
1Many, but not all companies report health and safety metrics, such as the number of job-related accidents,
illnesses, and most workday cases, along with environmental performance measurements. In this report, theterm environmental performance can be understood to include health and safety performance.
- vi -
Chapter 2 presents considerations for selecting, designing, implement-ing, evaluating, and improving a metrics program. The chapter isdivided into four sections that parallel the Plan-Do-Check-Act formatpresented in the 1992 GEMI Total Quality Environmental ManagementPrimer.2
Chapter 3 presents a brief discussion of emerging trends in environ-mental performance measurement. The appendices contain studies ofsome exemplary GEMI and non-GEMI metrics programs.
2 Total Quality Environmental Management: The Primer, Washington, D.C, 1992.
Acknowledgements
This primer was developed under the auspices of GEMI’s EnvironmentalMetrics Work Group. David Mayer (the Georgia-Pacific Corporation), theChair of the Work Group, directed this project. The primer was writtenby Mark A. Ethridge of Earth Tech, Inc. (a subsidiary of Tyco Inter-national, Inc.) with oversight from Montgomery Lovejoy III, also ofEarth Tech, Inc. The case studies in the appendix and information inthe text of the report were adapted from materials or presentationsprepared by the following GEMI members, who also provided substan-tial oversight and input:
Mike Fisher, Procter & GambleMaria Bober Rasmussen, Eastman Kodak CompanyJerry Schinaman, Bristol-Myers Squibb CompanyBill Sugar, Anheuser-Busch CompaniesDarwin Wika, The DuPont Company
In addition, one case study was provided by a non-GEMI member,Margaret R. Sexton of Stanley Works.
The Work Group also received generous support and input from otherGEMI member company representatives, including:
Bill Farraday, Colgate-Palmolive CompanyChuck Griffin, The Southern CompanyJim Grogan, Duke Power CompanyJohn Hayworth, Browning Ferris IndustriesMichele Malloy, Tenneco Business ServicesVivian Pai, Johnson & JohnsonRobert Vignes, Ciba-Geigy CorporationPatricia Walsh, AT&TLisa Whitetree, Georgia-Pacific Corporation
- vii -

- viii -
- ES-1 -
Executive Summary
Selecting meaningful and effective tools for measuring environmentalperformance is becoming increasingly important due to the increasingcosts of environmental operations; market, regulatory and public pres-sures; voluntary initiatives, such as the International Chamber ofCommerce Business Principles for Sustainable Development; and inter-national standards, such as the International Organization forStandardization (ISO) 14001.
Many metrics are already in use. These include lagging indicators,which measure outputs such as pounds of pollutants emitted or dis-charged; leading indicators, which are in-process measures of perfor-mance; and environmental condition indicators, which measure thedirect effect of an activity on the environment. Each type of indicatorhas its own strengths and weaknesses, and different audiences; mostorganizations use a mixture of them.
Other means of measuring progress include benchmarking against othercompanies or average industry performance; evaluating progressagainst codes of management practices developed by trade associationssuch as the Chemical Manufacturers Association (CMA) or the AmericanPetroleum Institute (API); measuring progress against principles, goals,or corporate management system standards; and development ofindices to evaluate progress from year to year.
Metrics can measure the business value of environmental programs orprogress as well as the environmental performance of business opera-tions. This can be particularly effective in demonstrating the value ofenvironmental efforts to management. It can also provide data withwhich business units can design more efficient processes, decreasingmaterial usage and environmental impacts while at the same timeincreasing yield and profitability.
The last several years have seen the development of several trends inenvironmental metrics. Some of these trends are:
• the globalization of metrics,• increasing emphasis on sustainability in its environ-• mental context (the efficient use of resources) and efforts • to develop sustainability metrics, • increasing use of environmental management systems • as benchmarks of environmental performance, • and emphasis on the integration of environmental per-• formance with business performance with the goal of • reducing costs and material losses, and improving yield,• market share, and profitability.
There are a number of points to consider when designing, implement-ing, evaluating, and improving a metrics program. The single mostimportant consideration, however, is to realize that no single approachis suitable for every organization. Each company has its own particu-lar products and services, organization, financial structure, legal andregulatory requirements, customer demands, data collection and man-agement systems, and environmental impacts. The approach selectedmust also be responsive to a variety of potential audiences such asmanagement, employees, regulators, shareholders, and the public.
Underlying any successful metrics program are the concepts of align-ment, accountability and continuous improvement. Alignment involvesblending environmental performance measurement with business mea-surement, data collection, reporting and management to ensure consis-tency, and to minimize redundancy and incompatibility. It also meansensuring that metrics are appropriate to the needs of the company,business units, and other audiences. Accountability is a two-waystreet; not only must employees and business units be held account-able for environmental performance, but management must clearlydefine expectations and should encourage business unit participationin the development of performance criteria. The third major concept,continuous improvement, is a key link in the plan-do-check-act cycle.It should be remembered that measurement occurs not for the sake ofmeasurement, but to drive performance towards reduced environmentalimpacts, more efficient use of resources, increased profitability and asustainable future.
- ES-2 -
Chapter 1.SURVEY OF TOOLS (METRICS) FOR MEASURING ENVIRONMENTAL PERFORMANCE
Selecting meaningful and effective tools, or metrics, for measuring theenvironmental consequences of a company’s operations and activitiesis becoming increasingly important. This need is being driven by theincreasing environmental costs of business operations; market, regula-tory, and public pressures; and voluntary initiatives, such as the Inter-national Chamber of Commerce’s (ICC) Business Charter for SustainableDevelopment, or international management system standards, such asthe International Organization for Standardization (ISO) 14001, andthe Eco Management and Audit Scheme (EMAS). A variety of metricsare available for measuring environmental performance. This chapterdiscusses the various types of tools that exist to accomplish thisobjective.
Types of Environmental Performance Metrics
Individual metrics can also be referred to as environmental perfor-mance indicators. Some indicators are common to many companies,such as quantities of various government-regulated chemicals emittedto the air, discharged to water, or disposed of as hazardous waste.Other indicators are unique to a certain industry, such as energy usageper gigabyte (computer manufacturers) or number of offshore oil spills(petroleum transportation). To help illustrate the diversity of environ-mental indicators, Table 1 lists some of the most frequently used envi-ronmental, health, and safety measurement criteria used by 41 compa-nies participating in an environmental management survey conductedduring 1995.
- 1 -
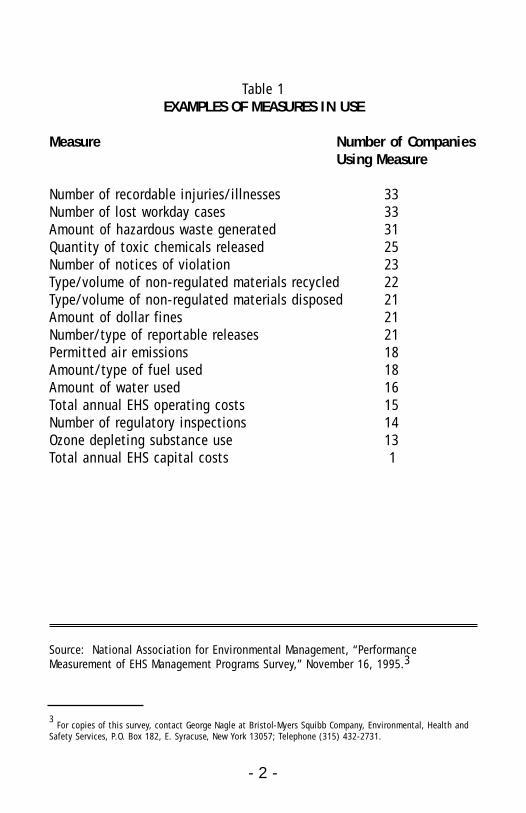
Table 1EXAMPLES OF MEASURES IN USE
Measure Number of CompaniesUsing Measure
Number of recordable injuries/illnesses 33Number of lost workday cases 33Amount of hazardous waste generated 31Quantity of toxic chemicals released 25Number of notices of violation 23Type/volume of non-regulated materials recycled 22Type/volume of non-regulated materials disposed 21Amount of dollar fines 21Number/type of reportable releases 21Permitted air emissions 18Amount/type of fuel used 18Amount of water used 16Total annual EHS operating costs 15Number of regulatory inspections 14Ozone depleting substance use 13Total annual EHS capital costs 1
Source: National Association for Environmental Management, “PerformanceMeasurement of EHS Management Programs Survey,” November 16, 1995.3
- 2 -
3 For copies of this survey, contact George Nagle at Bristol-Myers Squibb Company, Environmental, Health and
Safety Services, P.O. Box 182, E. Syracuse, New York 13057; Telephone (315) 432-2731.
Leading Versus Lagging Indicators
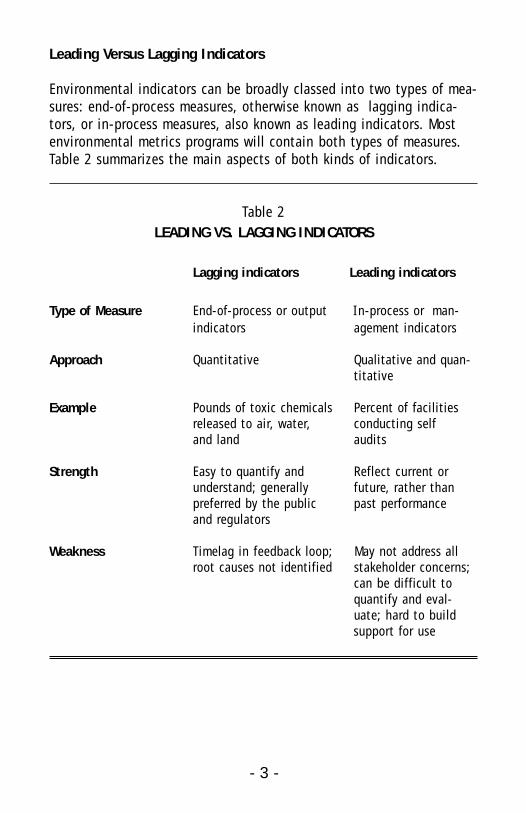
Environmental indicators can be broadly classed into two types of mea-sures: end-of-process measures, otherwise known as lagging indica-tors, or in-process measures, also known as leading indicators. Mostenvironmental metrics programs will contain both types of measures. Table 2 summarizes the main aspects of both kinds of indicators.
Table 2LEADING VS. LAGGING INDICATORS
Lagging indicators Leading indicators
Type of Measure End-of-process or output In-process or man-indicators agement indicators
Approach Quantitative Qualitative and quan-titative
Example Pounds of toxic chemicals Percent of facilities released to air, water, conducting selfand land audits
Strength Easy to quantify and Reflect current or understand; generally future, rather than preferred by the public past performance and regulators
Weakness Timelag in feedback loop; May not address allroot causes not identified stakeholder concerns;
can be difficult toquantify and eval-uate; hard to build support for use
- 3 -
Lagging IndicatorsLagging indicators are the type of metrics most commonly reported.These indicators “lag” or measure the results of environmental prac-tices or operations currently in place. Types of data include tons ofwaste generated, number of fines and violations, number of accidentsor lost work days, or pounds of packaging produced. Frequently thesetypes of data are collected because federal environmental laws requirethat they be reported. For example, since 1988, Section 313 of theSuperfund Amendments and Reauthorization Act (SARA) has requiredgenerators of certain toxic chemicals to report annually releases ofchemicals to air, land, and water. Table 3 presents 1988-1994 SARAdata for Hughes Electronics Corporation.
- 4 -
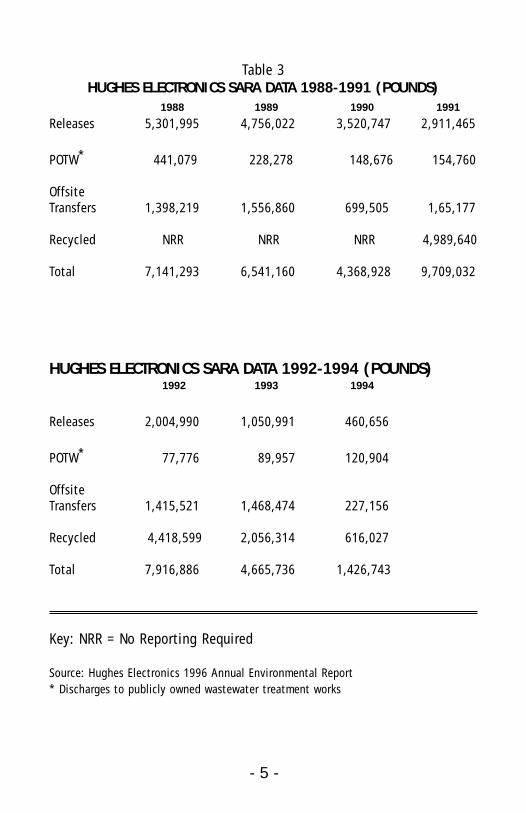
Table 3HUGHES ELECTRONICS SARA DATA 1988-1991 (POUNDS)
1988 1989 1990 1991
Releases 5,301,995 4,756,022 3,520,747 2,911,465
POTW* 441,079 228,278 148,676 154,760
Offsite Transfers 1,398,219 1,556,860 699,505 1,65,177
Recycled NRR NRR NRR 4,989,640
Total 7,141,293 6,541,160 4,368,928 9,709,032
HUGHES ELECTRONICS SARA DATA 1992-1994 (POUNDS)1992 1993 1994
Releases 2,004,990 1,050,991 460,656
POTW* 77,776 89,957 120,904
Offsite Transfers 1,415,521 1,468,474 227,156
Recycled 4,418,599 2,056,314 616,027
Total 7,916,886 4,665,736 1,426,743
Key: NRR = No Reporting Required
Source: Hughes Electronics 1996 Annual Environmental Report* Discharges to publicly owned wastewater treatment works
- 5 -
The principal advantages of using lagging indicators are that they areusually readily quantifiable and understandable, and the data are oftencollected for other business purposes. The main disadvantage is that,as the name implies, they lag or reflect situations where correctiveaction can only be taken after the fact, and often after incurring sometype of cost, whether it be in fines or decreased credibility with regu-lators or the public. Also, these indicators do not identify the rootcause for the deficiency and how its reoccurrence may be prevented.Furthermore, the effects of corrective measures already taken may not show up until next year’s results. Conversely, performance may beoverstated, because underlying factors may have already changed.
Leading Indicators
Leading or in-process indicators measure the implementation of prac-tices or measures which are expected to lead to improved environmen-tal performance. For example, instead of the numbers of fines and vio-lations, a leading indicator would be the number of internal environ-mental or health and safety compliance audits conducted during ayear. If such an audit program is implemented, and root causes areidentified and corrected, it should lead to a decrease in the laggingindicators, fines and violations. The major advantage of such a metricis that corrective actions can often be taken before deficiencies showup in reduced performance. Unfortunately, leading indicators can bedifficult to quantify (some may be qualitative rather than quantita-tive), and the results may not address the concerns of some stakehold-ers (such as the public), who may still want to know the quantities ofchemicals released into the environment, or the number of health andsafety violations. In practice, however, this is not an “either or” situa-tion; companies use both lagging and leading indicators.
- 6 -
- 7 -
The following are examples of leading indicators:
Quantitative:
• Number of purchasing reviews completed • Number of voluntary initiatives participated in• Raw material use• Number of community outreach activities• Number of internal self assessments completed• Number of EHS reviews completed• Regulatory issues identified proactively and resolved4
Qualitative:
• Adoption of a corporate policy on self assessments• Implementation of a program to improve community
outreach efforts• Certification under ISO 14001
The implementation of management practices contained in voluntaryindustry codes of environmental performance represents a type of lead-ing indicator. The Chemical Manufacturers Association (CMA)Responsible Care® and the American Petroleum Institute’s (API)Strategies for Today’s Environmental Partnership (STEP) are examples ofa collection of management practices that cover various areas of envi-ronmental, health and safety performance.
Environmental Condition Indicators
The Draft ISO 14031 standard, “Environmental Performance Evaluation”defines a third general type of indicator, called an environmental con-dition indicator (ECI). It defines an ECI as “a measurement of a quali-ty or property of a component of the environment.” It states further-more that this is not a measure of environmental impact, although val-ues may be used to evaluate impacts. Examples of ECIs as presented inthe Draft ISO 14031 include contaminant concentrations in air, water,groundwater and soil, and changes in crop yield or the size of a popu-lation of a particular species in a given area.
4 These quantitative leading indicators were selected from a presentation given by Bill Sugar of TheAnheuser-Busch Companies at a GEMI Workshop on April 8, 1977.
- 8 -
The advantage of using this type of metric is that it can be used tomeasure direct effect of an activity on the environment (environmentalaspects of operations). However, collecting these data can be timeconsuming and expensive, since the required data often are not rou-tinely collected and may need to be collected over many years in somecases. Also, making a correlation between an organization’s operationsand an effect can be difficult, since there are many variables that canbe contributing to the observed effect.
An example of this type of performance measure is reported inAmerican Electric Power’s annual environmental report. The companycites that a dramatic improvement in air quality (due to reduced elec-tric utility air emissions) in the Ohio River Valley can be corroboratedby a twenty-five year research study of lichens, fungus-like organismsthat grow on rocks and trees.5
Benchmarking
Another way of measuring a company’s performance is to compare itagainst best-in-class companies with similar operations. This measure-ment technique is called benchmarking. Benchmarking is defined as aprocess of comparing and measuring an organization’s businessprocesses against best-in-place operations to inspire improvement inthe organization’s performance.6 A good example of a benchmarkingstudy is the program developed by a group of northeastern utilities ledby Niagara Mohawk Power Corporation from 1992 to 1995.7 A simpletype of benchmarking is to compare an organization’s performanceagainst the average number of events in a particular category for theindustry as a whole. This is the approach often taken by environmentalgroups in ranking companies according to their SARA releases to air,water, and land. A more sophisticated approach is taken by theInvestors Responsibility Research Council (IRRC) which compiles envi-ronmental profiles on various companies and compares their perfor-mance in various areas, e.g. number of oil and chemical spills, remedialactions, toxic chemical releases, and number of penalties to industry averages.
5 American Electric Power’s annual enviornmental report, “Beyond Compliance.” As reported on the company’swebsite: http://www.aep.com.6 As defined in “Benchmarking: The Primer.” GEMI, Washington, D.C., 1994.
7 Center for Economics Research, Research Triangle Institute, “Environmental Benchmarking Program,”December 1994.
- 9 -
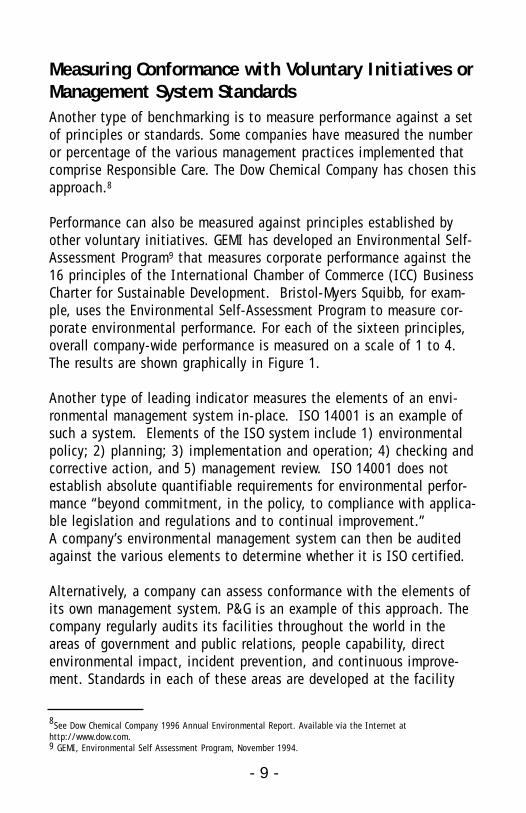
Measuring Conformance with Voluntary Initiatives orManagement System StandardsAnother type of benchmarking is to measure performance against a setof principles or standards. Some companies have measured the numberor percentage of the various management practices implemented thatcomprise Responsible Care. The Dow Chemical Company has chosen thisapproach.8
Performance can also be measured against principles established byother voluntary initiatives. GEMI has developed an Environmental Self-Assessment Program9 that measures corporate performance against the16 principles of the International Chamber of Commerce (ICC) BusinessCharter for Sustainable Development. Bristol-Myers Squibb, for exam-ple, uses the Environmental Self-Assessment Program to measure cor-porate environmental performance. For each of the sixteen principles,overall company-wide performance is measured on a scale of 1 to 4.The results are shown graphically in Figure 1.
Another type of leading indicator measures the elements of an envi-ronmental management system in-place. ISO 14001 is an example ofsuch a system. Elements of the ISO system include 1) environmentalpolicy; 2) planning; 3) implementation and operation; 4) checking andcorrective action, and 5) management review. ISO 14001 does notestablish absolute quantifiable requirements for environmental perfor-mance “beyond commitment, in the policy, to compliance with applica-ble legislation and regulations and to continual improvement.” A company’s environmental management system can then be auditedagainst the various elements to determine whether it is ISO certified.
Alternatively, a company can assess conformance with the elements ofits own management system. P&G is an example of this approach. Thecompany regularly audits its facilities throughout the world in theareas of government and public relations, people capability, directenvironmental impact, incident prevention, and continuous improve-ment. Standards in each of these areas are developed at the facility
8See Dow Chemical Company 1996 Annual Environmental Report. Available via the Internet athttp://www.dow.com.9 GEMI, Environmental Self Assessment Program, November 1994.
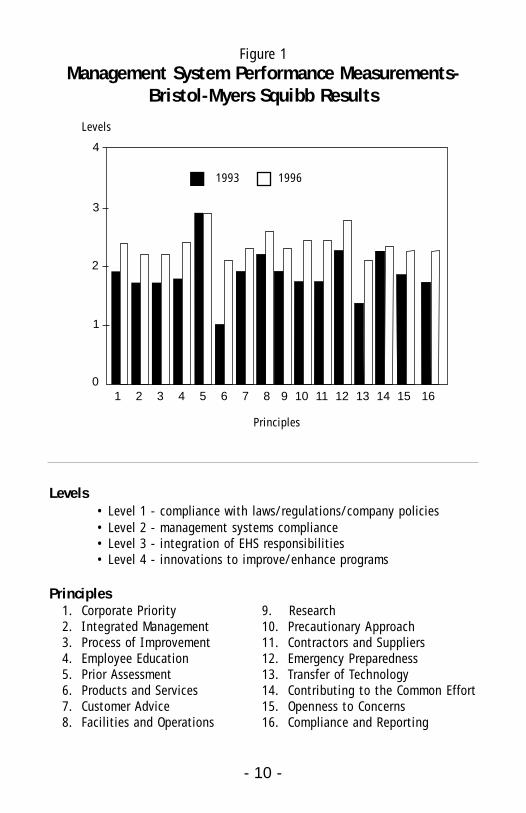
Levels• Level 1 - compliance with laws/regulations/company policies• Level 2 - management systems compliance• Level 3 - integration of EHS responsibilities• Level 4 - innovations to improve/enhance programs
Principles1. Corporate Priority2. Integrated Management3. Process of Improvement4. Employee Education5. Prior Assessment6. Products and Services7. Customer Advice8. Facilities and Operations
Figure 1Management System Performance Measurements-
Bristol-Myers Squibb Results
1 2 3 4 5 6 7 8 9 10 11 12 13 14 15 16
4
Principles
3
2
1
0
Levels
- 10 -
9. Research10. Precautionary Approach11. Contractors and Suppliers12. Emergency Preparedness13. Transfer of Technology14. Contributing to the Common Effort15. Openness to Concerns16. Compliance and Reporting
1993 1996
- 11 -
level ensuring business unit commitment and support, and a score isgenerated for each facility. A more detailed discussion of P&G’s metrics program is included in Appendix B. Baxter has also developeda metric for measuring performance against a series of state-of-the-artmanagement procedures. The system is similar to ISO 14001 in thatthe procedures comprise an environmental management system.Facility, division and corporate office performance is audited against these elements. The company has gone to great effort to eliminatethe subjectivity in defining conformance with the elements by develop-ing a detailed set of protocols.10
Environmental Performance Indices
An environmental performance index (EPI) can be a useful way of mea-suring environmental performance. Companies that have developedEPIs include the Niagara Mohawk Power Corporation, a northeasternelectric utility; Nortel, the Canadian-based telecommunications firm;Rhone-Poulenc, the French chemical and pharmaceutical company; J.M.Huber Corporation, a diversified company; and Polaroid Corporation,the imaging company.
An EPI usually consists of one number or a score that represents anaggregation of the environmental performance of all of a company’soperations. It is benchmarked against a base year. For example, anindex rating of 153 might indicate that corporate performance hasimproved substantially from the base year value of 100. Since EPIs areconstructed in different ways, the concept is best illustrated with anexample. Nortel has developed one of the best-known EPIs. The Nortelsystem considers 25 performance parameters in 4 broad categories:
10 See the Baxter 1995 environmental Performance Report; available via the Internet at http://www.baxter.com
- 12 -
• Compliance: Notices of violation, fines, exceedances, and incidents
• Environmental releases: releases to air, water, land and the global environment
• Resource consumption: thermal energy, electricity, water consumption, and paper purchases
• Environmental remediation: number of remediation sites and risk factors11
Index scores are derived by benchmarking against a base year, withnegative scores awarded for increased environmental impact and posi-tive scores for decreased environmental impact. Each of the four cate-gories is then weighted based on 1) its impact on the environment; 2)how directly the parameter measures environmental performance; 3)what control the company has over the parameter (e.g. use is influ-enced to a large degree by weather); and 4) financial and public riskto the company. Finally, the environmental data are normalized to thecosts of goods and labor.
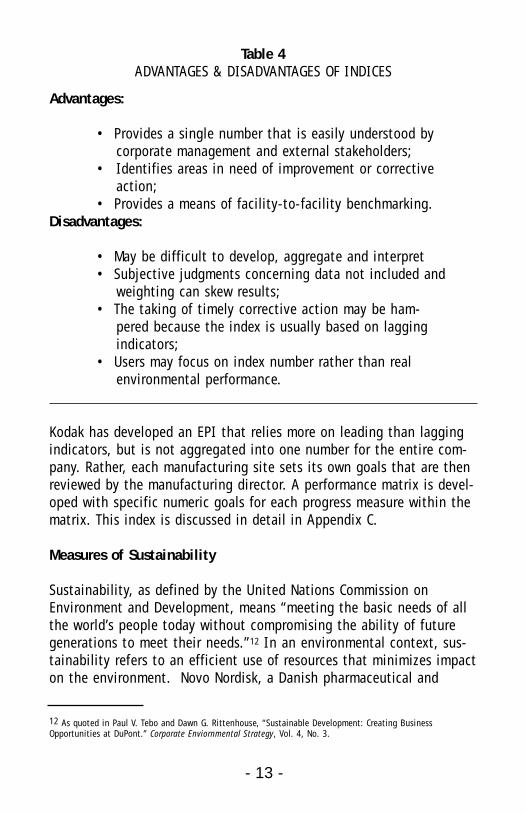
Such a system has its advantages and disadvantages as shown inTable 4:
11 Adapted from an overhead transparency presentation on Nortel’s EPI by Arthur D. Little dated May 20, 1996.
- 13 -
Table 4ADVANTAGES & DISADVANTAGES OF INDICES
Advantages:
• Provides a single number that is easily understood by corporate management and external stakeholders;
• Identifies areas in need of improvement or correctiveaction;
• Provides a means of facility-to-facility benchmarking.Disadvantages:
• May be difficult to develop, aggregate and interpret • Subjective judgments concerning data not included and
weighting can skew results; • The taking of timely corrective action may be ham-
pered because the index is usually based on laggingindicators;
• Users may focus on index number rather than real environmental performance.
Kodak has developed an EPI that relies more on leading than laggingindicators, but is not aggregated into one number for the entire com-pany. Rather, each manufacturing site sets its own goals that are thenreviewed by the manufacturing director. A performance matrix is devel-oped with specific numeric goals for each progress measure within thematrix. This index is discussed in detail in Appendix C.
Measures of Sustainability
Sustainability, as defined by the United Nations Commission onEnvironment and Development, means “meeting the basic needs of allthe world’s people today without compromising the ability of futuregenerations to meet their needs.”12 In an environmental context, sus-tainability refers to an efficient use of resources that minimizes impacton the environment. Novo Nordisk, a Danish pharmaceutical and
12 As quoted in Paul V. Tebo and Dawn G. Rittenhouse, “Sustainable Development: Creating BusinessOpportunities at DuPont.” Corporate Enviornmental Strategy, Vol. 4, No. 3.
- 14 -
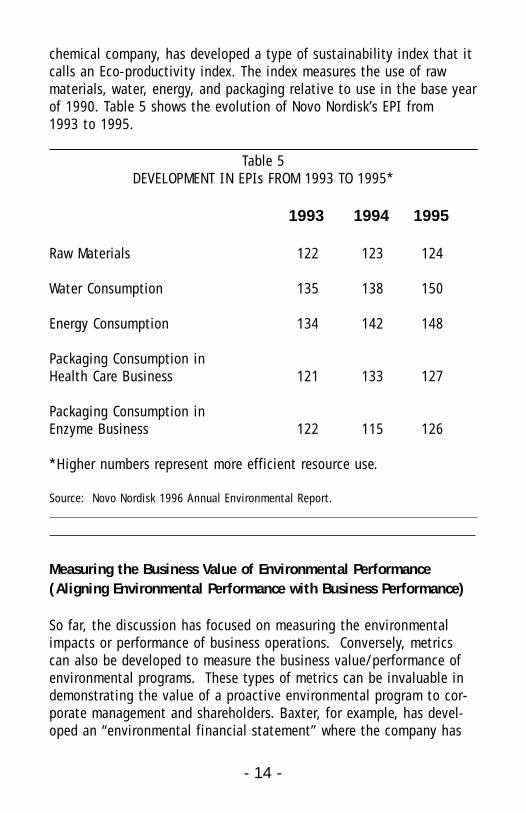
chemical company, has developed a type of sustainability index that itcalls an Eco-productivity index. The index measures the use of rawmaterials, water, energy, and packaging relative to use in the base yearof 1990. Table 5 shows the evolution of Novo Nordisk’s EPI from 1993 to 1995.
Table 5DEVELOPMENT IN EPIs FROM 1993 TO 1995*
1993 1994 1995
Raw Materials 122 123 124
Water Consumption 135 138 150
Energy Consumption 134 142 148
Packaging Consumption in Health Care Business 121 133 127
Packaging Consumption in Enzyme Business 122 115 126
*Higher numbers represent more efficient resource use.
Source: Novo Nordisk 1996 Annual Environmental Report.
Measuring the Business Value of Environmental Performance (Aligning Environmental Performance with Business Performance)
So far, the discussion has focused on measuring the environmentalimpacts or performance of business operations. Conversely, metricscan also be developed to measure the business value/performance ofenvironmental programs. These types of metrics can be invaluable indemonstrating the value of a proactive environmental program to cor-porate management and shareholders. Baxter, for example, has devel-oped an “environmental financial statement” where the company has
- 15 -
estimated the environmental costs of its environmental program andcompared it with the environmental program benefits in terms ofincome, savings and cost avoidance. Savings are generated throughreduced hazardous material usage, decreased hazardous and non-haz-ardous waste disposal costs, energy conservation, and packaging costreductions; income is generated by recycling. Furthermore, the compa-ny has estimated the benefits occurring in the present year from pastyears environmental efforts. Waste reduction initiatives not only pro-duce cost avoidance (savings) in the year initiated, but also in futureyears in which the waste remains eliminated from processes and pack-aging. By this measure, the business value of the company’s environ-mental programs far exceeds their costs ($87.4 million vs. $25.2 mil-lion in 1995).13 Organizations considering such an approach, however,should ensure that their environmental accounting is aligned or com-patible with their financial accounting systems.
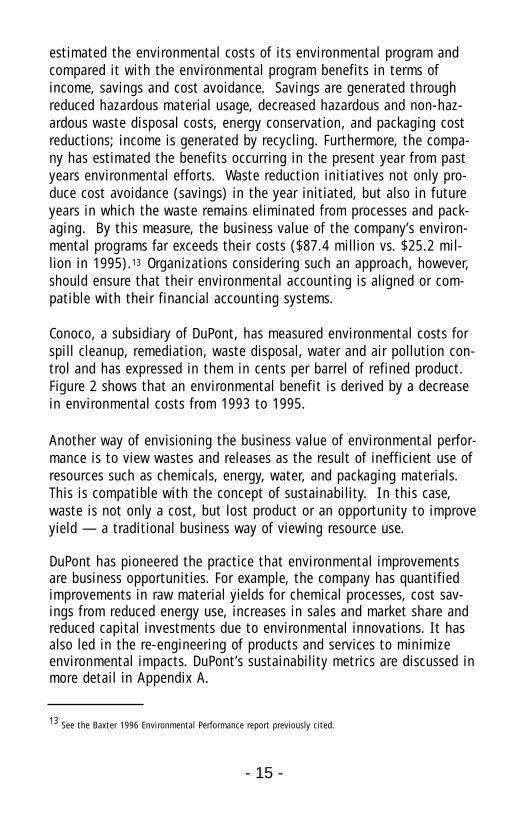
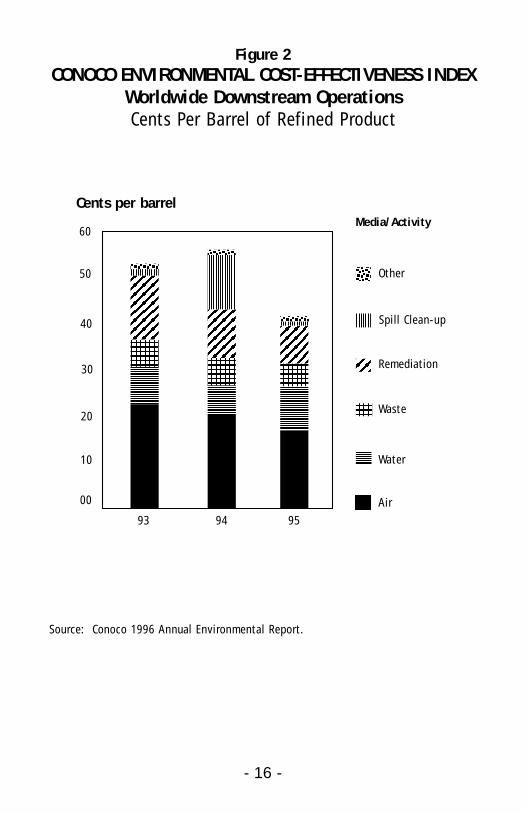
Conoco, a subsidiary of DuPont, has measured environmental costs forspill cleanup, remediation, waste disposal, water and air pollution con-trol and has expressed in them in cents per barrel of refined product.Figure 2 shows that an environmental benefit is derived by a decreasein environmental costs from 1993 to 1995.
Another way of envisioning the business value of environmental perfor-mance is to view wastes and releases as the result of inefficient use ofresources such as chemicals, energy, water, and packaging materials.This is compatible with the concept of sustainability. In this case,waste is not only a cost, but lost product or an opportunity to improveyield — a traditional business way of viewing resource use.
DuPont has pioneered the practice that environmental improvementsare business opportunities. For example, the company has quantifiedimprovements in raw material yields for chemical processes, cost sav-ings from reduced energy use, increases in sales and market share andreduced capital investments due to environmental innovations. It hasalso led in the re-engineering of products and services to minimizeenvironmental impacts. DuPont’s sustainability metrics are discussed inmore detail in Appendix A.
13 See the Baxter 1996 Environmental Performance report previously cited.
- 16 -
Figure 2CONOCO ENVIRONMENTAL COST-EFFECTIVENESS INDEX
Worldwide Downstream OperationsCents Per Barrel of Refined Product
Source: Conoco 1996 Annual Environmental Report.
60
50
40
30
20
10
00
93 94 95
Air
Water
Waste
Remediation
Spill Clean-up
Other
Media/ActivityCents per barrel
- 17 -
Chapter 2CONSIDERATIONS FOR DESIGNING, IMPLEMENTING, EVALUATING, ANDIMPROVING A METRICS PROGRAM
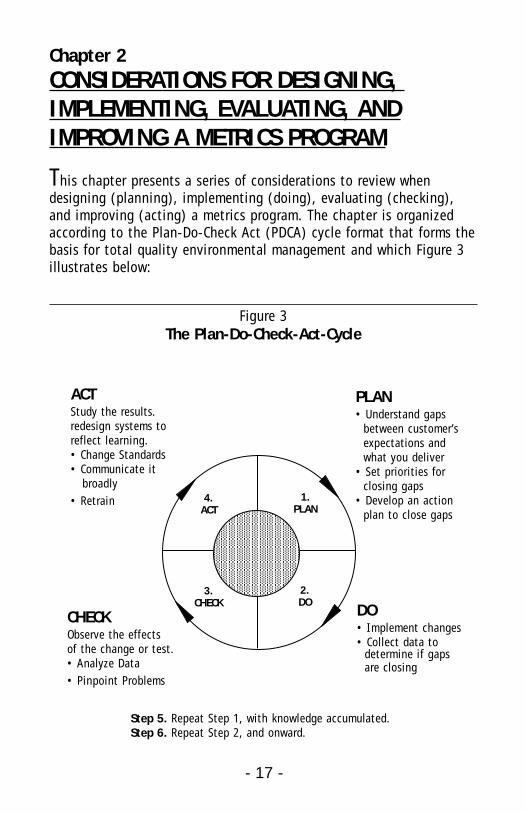
This chapter presents a series of considerations to review whendesigning (planning), implementing (doing), evaluating (checking),and improving (acting) a metrics program. The chapter is organizedaccording to the Plan-Do-Check Act (PDCA) cycle format that forms thebasis for total quality environmental management and which Figure 3illustrates below:
Figure 3The Plan-Do-Check-Act-Cycle
ACTStudy the results.redesign systems toreflect learning.• Change Standards• Communicate it
broadly• Retrain
CHECKObserve the effects of the change or test.• Analyze Data• Pinpoint Problems
PLAN• Understand gaps
between customer’sexpectations andwhat you deliver
• Set priorities forclosing gaps
• Develop an actionplan to close gaps
DO• Implement changes• Collect data to
determine if gaps are closing
Step 5. Repeat Step 1, with knowledge accumulated.Step 6. Repeat Step 2, and onward.
1.PLAN
2.DO
3.CHECK
4.ACT
- 18 -
Underlying the specific considerations presented here, however, areseveral broad concepts that need to be incorporated into all aspects ofa program. These program elements are alignment, accountability, andcontinuous improvement.
With respect to metrics, alignment has several different meanings.First, there is the alignment between environmental metrics and business metrics. This involves blending as much as possible andensuring consistency and compatibility between environmental andbusiness data collection, reporting, and management systems. Second,there is the alignment between the metrics and the organization’soperations and environmental objectives. Are metrics appropriate toand consistent with the organizations operations and goals? Third,there is the alignment between the metrics and the audiences—arethe metrics responsive to the needs of target audiences such as man-agement, business units, employees, regulators and the public?Finally, there is the broadest aspect of alignment — where environ-mental considerations are not separate from the business process butincorporated into all stages of the business process, including strategicplanning, accounting, marketing, sales, product development, and R&D.
Accountability also has more than one meaning. Accountability signi-fies, on the one hand, identifying individuals who are responsible forensuring that environmental performance goals are attained. However,accountability is not just a top-down concept. It is important thatmanagement allows business units to participate in the development oftheir environmental performance criteria, so that management gainstheir buy-in into the environmental performance measurement andgoal-setting process.
Continuous improvement should drive the entire metrics plan-do-check-act cycle. A metrics program should never be established solely tomeasure performance. Rather, the metrics selected should spur environ-mental innovation and improve performance. In an ideal situation, ametrics program will encourage institutional innovation where businessunits compete with each other to improve environmental performance.
Planning a Metrics Program
The reader will notice that considerably more text is dedicated to theplanning of a metrics program than to program implementation, evalu-ation, and improvement. This is because careful planning will elimi-nate many problems in the other stages. Once the system is in place,adjustments become much more difficult.
Consideration #1: One size doesn’t fit all — consider yourcompany’s operations, organization and its unique environ-mental impacts.
The first thing to consider when selecting a metrics program is thatone size doesn’t fit all. Each company has its own particular productsand services, organization, financial structure, legal and regulatoryrequirements, customer demands, data collection and management sys-tems, and environmental impacts. Metrics appropriate to one companymay be of less interest to another. Measuring the reduction in the useof packaging materials may be important to a company that produceshousehold consumer products, whereas emergency management andpollution prevention may be more important to a petrochemical com-pany, and air emissions of special concern to an electric utility.Conforming with international standards such as ISO 14001 may beimportant to companies with global operations, but of lesser impor-tance to a local power company. In addition, corporate management,stockholders, and other internal and external stakeholders will dictatewhat tools are used and how performance is measured.
Furthermore, many companies are conglomerates that provide a widespectrum of products and services, and metrics may vary from onefacility or division of a company to another. For example, in a largemultinational company, the type of metrics may vary according to thetype of operations, e.g. packaging versus manufacturing, or type ofproduct, e.g. personal healthcare versus chemical or pesticide manufac-ture, or from one country to another. Metrics may also vary accordingto the level in the management structure, e.g. division vs. facility vs.corporate.
- 19 -
- 20 -
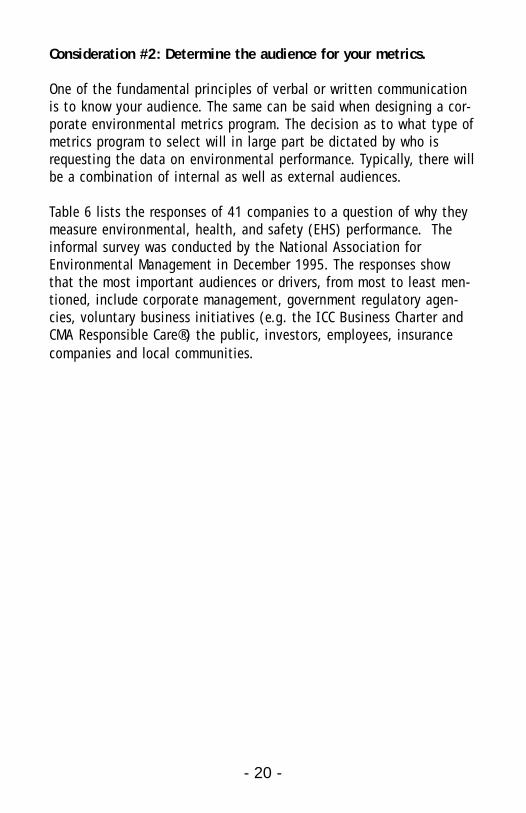
Consideration #2: Determine the audience for your metrics.
One of the fundamental principles of verbal or written communicationis to know your audience. The same can be said when designing a cor-porate environmental metrics program. The decision as to what type ofmetrics program to select will in large part be dictated by who isrequesting the data on environmental performance. Typically, there willbe a combination of internal as well as external audiences.
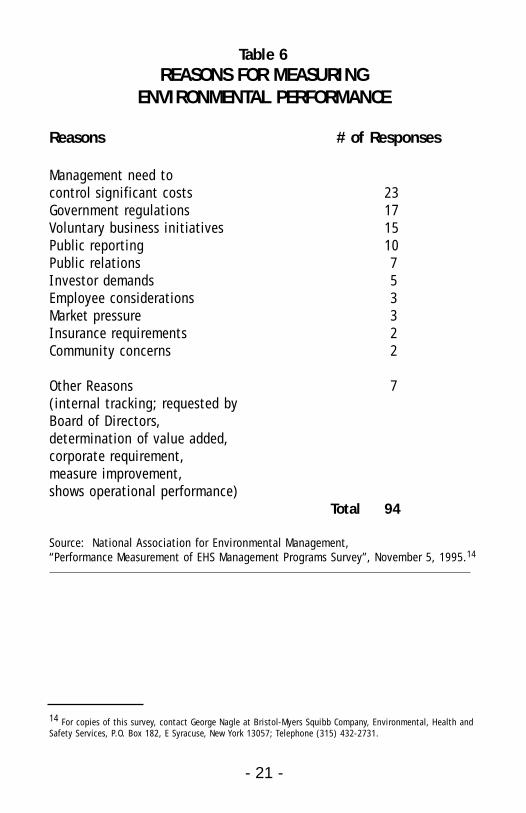
Table 6 lists the responses of 41 companies to a question of why theymeasure environmental, health, and safety (EHS) performance. Theinformal survey was conducted by the National Association forEnvironmental Management in December 1995. The responses showthat the most important audiences or drivers, from most to least men-tioned, include corporate management, government regulatory agen-cies, voluntary business initiatives (e.g. the ICC Business Charter andCMA Responsible Care®) the public, investors, employees, insurancecompanies and local communities.
- 21 -
Table 6REASONS FOR MEASURING
ENVIRONMENTAL PERFORMANCE
Reasons # of Responses
Management need to control significant costs 23Government regulations 17Voluntary business initiatives 15Public reporting 10Public relations 7Investor demands 5Employee considerations 3Market pressure 3Insurance requirements 2Community concerns 2
Other Reasons 7(internal tracking; requested by Board of Directors, determination of value added, corporate requirement, measure improvement, shows operational performance)
Total 94
Source: National Association for Environmental Management, “Performance Measurement of EHS Management Programs Survey”, November 5, 1995.14
14 For copies of this survey, contact George Nagle at Bristol-Myers Squibb Company, Environmental, Health andSafety Services, P.O. Box 182, E Syracuse, New York 13057; Telephone (315) 432-2731.
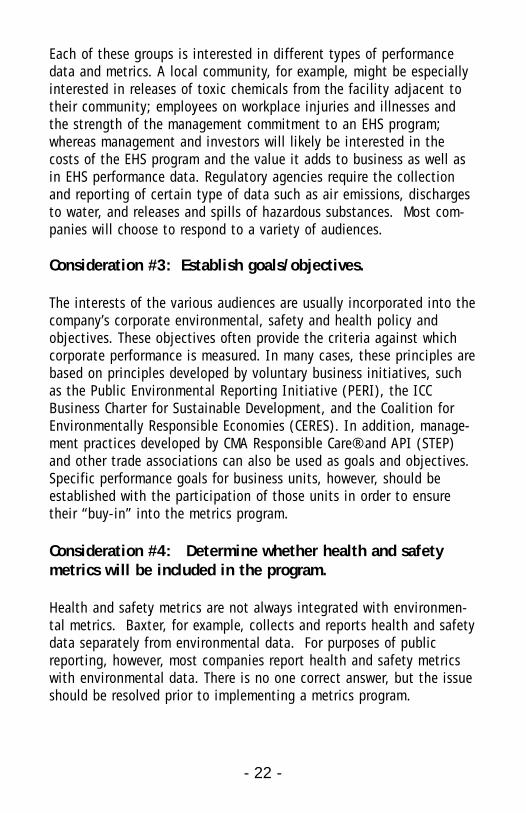
Each of these groups is interested in different types of performancedata and metrics. A local community, for example, might be especiallyinterested in releases of toxic chemicals from the facility adjacent totheir community; employees on workplace injuries and illnesses andthe strength of the management commitment to an EHS program;whereas management and investors will likely be interested in thecosts of the EHS program and the value it adds to business as well asin EHS performance data. Regulatory agencies require the collectionand reporting of certain type of data such as air emissions, dischargesto water, and releases and spills of hazardous substances. Most com-panies will choose to respond to a variety of audiences.
Consideration #3: Establish goals/objectives.
The interests of the various audiences are usually incorporated into thecompany’s corporate environmental, safety and health policy andobjectives. These objectives often provide the criteria against whichcorporate performance is measured. In many cases, these principles arebased on principles developed by voluntary business initiatives, suchas the Public Environmental Reporting Initiative (PERI), the ICCBusiness Charter for Sustainable Development, and the Coalition forEnvironmentally Responsible Economies (CERES). In addition, manage-ment practices developed by CMA Responsible Care® and API (STEP)and other trade associations can also be used as goals and objectives.Specific performance goals for business units, however, should beestablished with the participation of those units in order to ensuretheir “buy-in” into the metrics program.
Consideration #4: Determine whether health and safetymetrics will be included in the program.
Health and safety metrics are not always integrated with environmen-tal metrics. Baxter, for example, collects and reports health and safetydata separately from environmental data. For purposes of publicreporting, however, most companies report health and safety metricswith environmental data. There is no one correct answer, but the issueshould be resolved prior to implementing a metrics program.
- 22 -
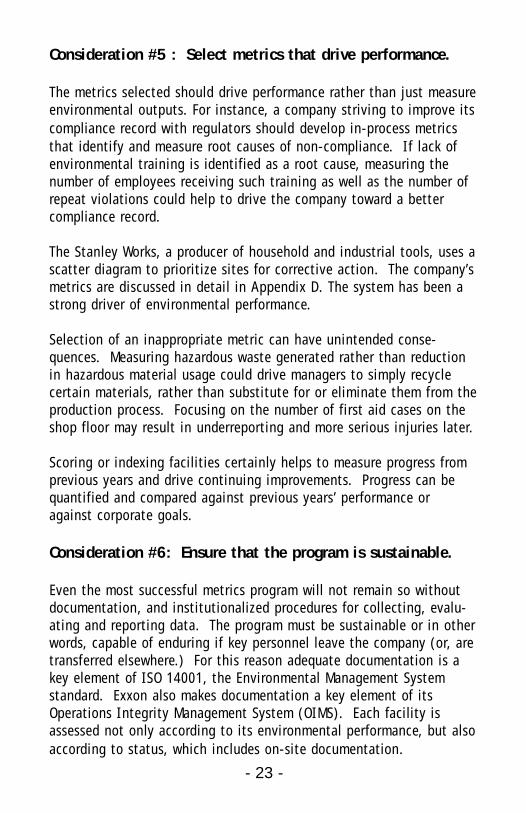
Consideration #5 : Select metrics that drive performance.
The metrics selected should drive performance rather than just measureenvironmental outputs. For instance, a company striving to improve itscompliance record with regulators should develop in-process metricsthat identify and measure root causes of non-compliance. If lack ofenvironmental training is identified as a root cause, measuring thenumber of employees receiving such training as well as the number ofrepeat violations could help to drive the company toward a bettercompliance record.
The Stanley Works, a producer of household and industrial tools, uses ascatter diagram to prioritize sites for corrective action. The company’smetrics are discussed in detail in Appendix D. The system has been astrong driver of environmental performance.
Selection of an inappropriate metric can have unintended conse-quences. Measuring hazardous waste generated rather than reductionin hazardous material usage could drive managers to simply recyclecertain materials, rather than substitute for or eliminate them from theproduction process. Focusing on the number of first aid cases on theshop floor may result in underreporting and more serious injuries later.
Scoring or indexing facilities certainly helps to measure progress fromprevious years and drive continuing improvements. Progress can bequantified and compared against previous years’ performance oragainst corporate goals.
Consideration #6: Ensure that the program is sustainable.
Even the most successful metrics program will not remain so withoutdocumentation, and institutionalized procedures for collecting, evalu-ating and reporting data. The program must be sustainable or in otherwords, capable of enduring if key personnel leave the company (or, aretransferred elsewhere.) For this reason adequate documentation is akey element of ISO 14001, the Environmental Management Systemstandard. Exxon also makes documentation a key element of itsOperations Integrity Management System (OIMS). Each facility isassessed not only according to its environmental performance, but alsoaccording to status, which includes on-site documentation.
- 23 -
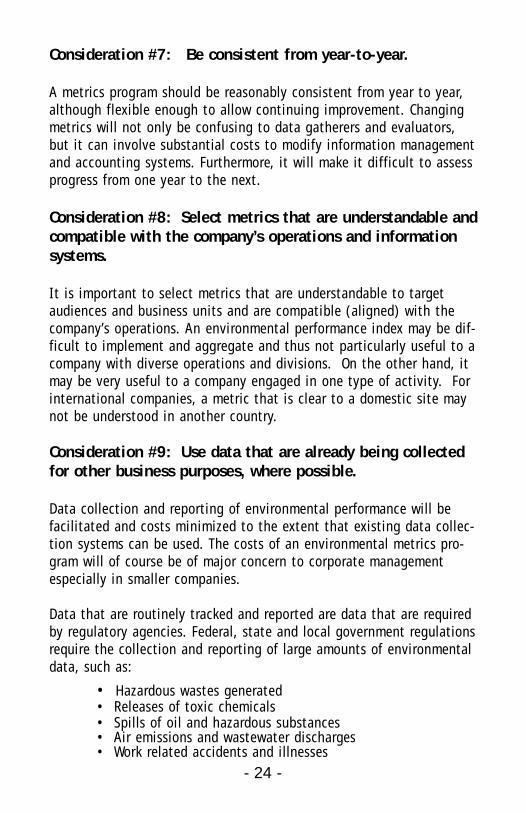
Consideration #7: Be consistent from year-to-year.
A metrics program should be reasonably consistent from year to year,although flexible enough to allow continuing improvement. Changingmetrics will not only be confusing to data gatherers and evaluators,but it can involve substantial costs to modify information managementand accounting systems. Furthermore, it will make it difficult to assessprogress from one year to the next.
Consideration #8: Select metrics that are understandable andcompatible with the company’s operations and informationsystems.
It is important to select metrics that are understandable to targetaudiences and business units and are compatible (aligned) with thecompany’s operations. An environmental performance index may be dif-ficult to implement and aggregate and thus not particularly useful to acompany with diverse operations and divisions. On the other hand, itmay be very useful to a company engaged in one type of activity. Forinternational companies, a metric that is clear to a domestic site maynot be understood in another country.
Consideration #9: Use data that are already being collectedfor other business purposes, where possible.
Data collection and reporting of environmental performance will befacilitated and costs minimized to the extent that existing data collec-tion systems can be used. The costs of an environmental metrics pro-gram will of course be of major concern to corporate managementespecially in smaller companies.
Data that are routinely tracked and reported are data that are requiredby regulatory agencies. Federal, state and local government regulationsrequire the collection and reporting of large amounts of environmentaldata, such as:
• Hazardous wastes generated• Releases of toxic chemicals • Spills of oil and hazardous substances• Air emissions and wastewater discharges• Work related accidents and illnesses
- 24 -
- 25 -
In addition, government enforcement activities may generate noticesof violation, fines and other penalties which are usually tracked closely.
Other data that are tracked for business purposes, but that may alsouseful for environmental metrics, include:
• water usage• energy usage/unit of product• number of internal audit findings• environmental remediation costs• percent of employees trained• amount of materials recycled• raw material usage/unit of product
Consideration #10: Define performance expectations andidentify who is accountable.
It is important to be specific when defining performance expecta-tions, especially if business units and managers are going to be heldaccountable for environmental performance as measured by metrics.Companies with successful performance measurement programs linkcompensation with environmental performance. Most often it is aplant or site manager; in some cases, it is more fully integrated to allemployees. Kodak ties facility managers’ pay to their environmentalperformance. The company has developed performance standards forthe environmental aspects of its operations, and has developed clearexpectations for performance.
Facilities that are supplying data should know the results of theirefforts. An internal survey within Bristol-Myers Squibb indicatedmuch better cooperation if facilities understand why data are collect-ed and how they are used. 15
15 Memorandum from Jerry Schinaman, Bristol-Myers Squibb Company to Mark Ethridge, Earth Tech,May 15, 1997.
Consideration #11: Identify clear data collection processes— when and how will data be collected and reported.
Prior to implementation of a metrics program, it is essential to definewhen and how data will be collected and reported. Data should becollected so that they are supplied to management in time to takeeffective action. In addition, regulatory requirements may dictatewhen certain data are collected and reported, e.g. annually for SARArelease data. Other important considerations are 1) what type ofinformation management system will be used to manage the data, 2)what type of computer software will be used to report data (if it isentered electronically), 3) who will collect what kind of data, 4) howsite personnel will be trained to collect data, 5) and how accuracy ofthe data will be verified.
Consideration #12: Normalize Data.
Normalization of data is an important technique for tracking environ-mental performance. Tying emissions, releases, and resource consump-tion to a unit of production helps clarify whether positive environmen-tal trends are the result of pollution prevention activities or simply theeffect of decreased manufacturing (for example from plant closings ora shift to contract manufacturers).
Implementing a Metrics Program
Once a program has been designed and selected, the following pointsshould be seriously considered:
Consideration #1: Get upper management support.
No metrics program can be successful without the support of uppercorporate management. Strong management support will ensure thatadequate personnel, financial and information management resourcesare dedicated to the task. DuPont and Monsanto are examples of companies where the upper management is firmly committed to an
- 26 -
- 27 -
aggressive environmental metrics program. At Monsanto, CEO RobertShapiro has made sustainability the focus of the company’s strategicthinking. He has organized seven sustainability focus teams, one withthe task of developing metrics by which business units can measure ornot they’re moving toward sustainability.16 DuPont’s CEO, John A. Krol,has also committed the company to an aggressive goal of zero injuries,illnesses, incidents, and emissions.
Consideration #2: Get the support of business units.
Committed upper management alone can not guarantee the successfulimplementation of a metrics program. It is also necessary to get thesupport of business units. One way of securing such support is tohave the business units participate in defining the metrics to whichthey will be held accountable. This is the approach taken by Procterand Gamble, Bristol-Myers Squibb and Kodak. The Procter and Gambleand Kodak metrics programs are discussed in greater detail in theAppendices.
Consideration #3: Consider flexible systems for diverse operations.
If a company has diverse operations or operates in many differentparts of the world with different operating and regulatory environ-ments, it may consider developing metrics that are flexible and adapt-able to the specific situations. A relatively simple facility with fewpotential environmental impacts may be graded on fewer criteria thana large and complex manufacturing facility. Procter & Gamble is anexample of this approach (see Appendix B).
Consideration #4: Avoid using too many metrics.
In terms of metrics, more is not necessarily better. As a general rule,the use of too many metrics should be avoided. Collecting, evaluatingand reporting metrics requires time, personnel and money, and themore metrics that are used, the greater the resource requirements.
16 Monsanto’s CEO Raises the Bar on Sustainable Development.”, Environmental, Health and SafetyManagement, March 3, 1997, p.3.
Furthermore, collecting too many metrics can become confusing andfrustrate staff and managers who may already be stretched thinbecause of other responsibilities. Reporting too many metrics can alsooverwhelm and confuse target audiences. WMX Technologies, for exam-ple, decided against developing quantitative metrics for each of its 14environmental principles stated in its annual external environmentalreport, and instead focused on a smaller number of measures to satisfythe information needs of its stakeholders.17 Polaroid Corporation, apioneer in performance measurement and public reporting, has justsimplified its metrics in order to better drive internal performance andbe more meaningful to external stakeholders.
Evaluating the Effectiveness of Metrics
In order for continuous improvement to occur, metrics should be evalu-ated to determine if they are useful and appropriate. This section dis-cusses some points to consider during this phase.
Consideration #1: Are the right data getting to key peoplein time to take action?
In order for data to be useful, they need to be reported to the appro-priate corporate officials in time for meaningful action to be taken. In addition, the right kind of data need to be reported. Evaluatewhether the metrics selected are accomplishing these objectives.
Consideration #2: Are the metrics consistent with otherreporting measures?
Now is the time to verify whether the metrics chosen are consistentwith other reporting measures. For example, are data reported to thepublic consistent with those reported to government agencies? Areenvironmental data collection efforts duplicating data collection forother business purposes?
- 28 -
17 ”Environmental Reporting in a Total Quality Framework,” GEMI, 1994, p. 21.
- 29 -
Consideration #3: Are the metrics driving the right behavior?
Verify whether the metrics are driving performance and leading to con-tinuous improvement. Also, failure to develop the appropriate metricmay produce a result different from what was intended.
Consideration #4: Get stakeholder feedback—employees,business units, public, stockholders.
In order for continuous improvement to occur, the developers of met-rics should solicit and receive input from the users of metrics.Companies have held workshops to solicit such input. DuPont andMonsanto have established standing committees comprised of externalstakeholders who review and improve metrics programs. Bristol-MyersSquibb and IBM have also invited stakeholders to evaluate their met-rics, and have added new measures to their program to respond tostakeholder concerns.
Improving a Metrics Program
If the metrics collected and reported aren’t providing the type of infor-mation desired by the various target audiences, then it may be appro-priate to consider abandoning or modifying the existing measure andsubstituting another. The results of the evaluation may call in ques-tion what to measure. For example, simply measuring the number ofdeficiencies discovered during corporate self assessments may not givemanagement a measure of the seriousness of these deficiencies. To accurately track compliance a new metric that classifies findingsaccording to their severity may be desirable. In this case, the planningphase of the PDCA cycle will be revisited, and the continuous improve-ment loop will be completed.

- 30 -
- 31 -
Chapter 3TRENDS IN ENVIRONMENTALPERFORMANCE MEASUREMENT
“The green economics and lifestyles of the 21st Century may be con-ceptualized by environmental thinkers, but they can only be actualizedby industrial corporations. Industry has a next century vision of inte-grated environmental performance. Not every company is there yet, butmost are trying. Those that aren’t trying won’t be a problem long term,simply because they won’t be around long term. That is the new compe-titive reality.”
E.S. WOOLARD, JR.Chairman, DuPont
A. The Globalization of Metrics
Environmental performance measurement is becoming increasingly aglobal phenomenon. This is occurring for a number of reasons. Firstthere is widespread recognition that many environmental problems areglobal, such as ozone depletion, acid deposition, the greenhouseeffect, deforestation and species extinction issues. Environmentalissues that would have concerned only local communities are now thefocus of international concern. Second, market forces are driving aglobal approach to metrics. The flow of goods, services, capital, andinformation is accelerating across national boundaries, and many com-panies are competing in more and more markets. Governments, stock-holders, and consumers are also demanding environmentally responsi-ble management. Third, international standards organizations and vol-untary initiatives are spurring the development of environmental man-agement systems and better metrics. These trends are likely to contin-ue into the 21st century, enhancing the importance of global metricsprograms.
B. Emphasis on Sustainability
Although the concept of sustainability is not new, the Rio summit of1992 heightened its visibility. Increasing emphasis on sustainability isreflected in corporate annual environmental reports. As mentioned earli-er, Monsanto has made sustainability a focus of its environmental pro-grams, and has established seven corporate management teams to pro-mote the concept throughout the company. Other companies highlight-ing sustainability include DuPont, Bristol-Myers Squibb, Novo Nordisk,Baxter, and Rhone-Poulenc.
C. Increasing Emphasis on EMS
Many of the larger Fortune 500 companies have environmental manage-ment systems. More and more these systems are viewed as a means ofmeasuring, tracking, documenting, and managing environmental per-formance. They also are an attempt to go beyond merely complyingwith environmental laws and regulations. The development of ISO14001 is encouraging the development of such systems. In addition,EPA is promoting the development of environmental management sys-tems. The EPA Environmental Leadership Program (ELP) has developedan EPA-approved EMS.
D. Integration of Environmental Performance with Business Performance
In today’s environment of corporate downsizing and cost-consciousness,it is becoming more and more important to develop metrics that showthe connection between environmental performance and profitability.Too often environmental programs have been viewed as a necessary bur-den—costs that must be incurred for the public good, but which detractfrom profitability. What is developing is a new mindset that sees envi-ronmental innovations as ways to not only to reduce costs, but actuallyas a means of increasing revenue through the more efficient use ofresources. At the same time, environmental considerations are beingintegrated into other aspects of business such as policy and planning,accounting, product development, life cycle costing, and process design.This blending of environmental with business performance is likely tocontinue. An example of this environmental-business integration isprovided by DuPont in Appendix A.
- 32 -
- 33 -
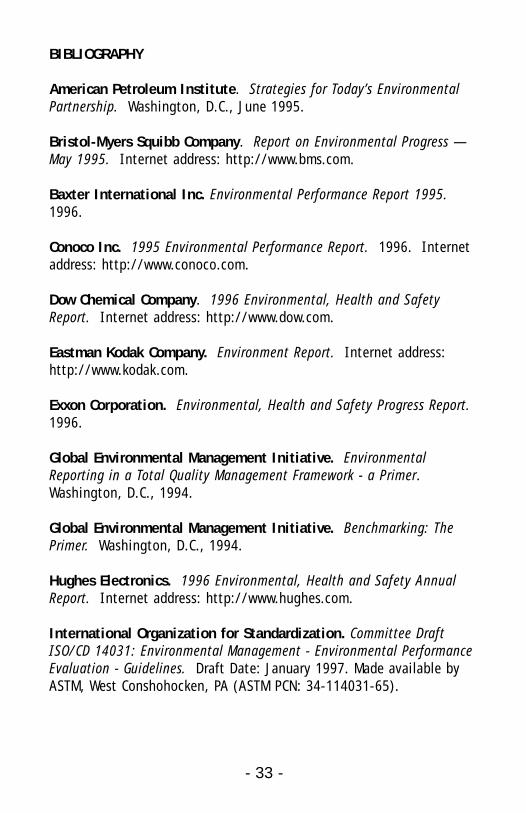
BIBLIOGRAPHY
American Petroleum Institute. Strategies for Today’s EnvironmentalPartnership. Washington, D.C., June 1995.
Bristol-Myers Squibb Company. Report on Environmental Progress —May 1995. Internet address: http://www.bms.com.
Baxter International Inc. Environmental Performance Report 1995.1996.
Conoco Inc. 1995 Environmental Performance Report. 1996. Internetaddress: http://www.conoco.com.
Dow Chemical Company. 1996 Environmental, Health and SafetyReport. Internet address: http://www.dow.com.
Eastman Kodak Company. Environment Report. Internet address:http://www.kodak.com.
Exxon Corporation. Environmental, Health and Safety Progress Report.1996.
Global Environmental Management Initiative. EnvironmentalReporting in a Total Quality Management Framework - a Primer.Washington, D.C., 1994.
Global Environmental Management Initiative. Benchmarking: ThePrimer. Washington, D.C., 1994.
Hughes Electronics. 1996 Environmental, Health and Safety AnnualReport. Internet address: http://www.hughes.com.
International Organization for Standardization. Committee DraftISO/CD 14031: Environmental Management - Environmental PerformanceEvaluation - Guidelines. Draft Date: January 1997. Made available byASTM, West Conshohocken, PA (ASTM PCN: 34-114031-65).
International Standardization Organization. EnvironmentalManagement Systems -Specification with guidance for use, ANSI/ISO14001-1996. West Conshohocken, PA: ASTM,1996. PCN: 34-014023-65.
Lober, Douglas J. “What Makes Environmental Reports Effective:Current Trends in Corporate Reporting.” Corporate EnvironmentalStrategy: Volume 4, Number 2.
Monsanto. Environmental Annual Review 1995. Internet address:http://www.monsanto.com.
Novo Nordisk. Novo Nordisk Environmental Report 1995. Internetaddress: http://www.novo.dk.
Tebo, Paul, and Dawn Rittenhouse. “Sustainable Development:Creating Business Opportunities at DuPont.” Corporate EnvironmentalStrategy: Volume 4, Number 3.
The Environment Group, Inc. “Monsanto’s CEO raises the bar on sus-tainable development.” Environmental Health and Safety Management,March 3, 1997.
WMX Technologies, Inc. 1995 Annual Environmental Report.Internet address: http://www.wmx.com.
- 34 -
- A-1 -
Appendix A.CASE STUDY - DUPONT: INTERGRATING ENVIRONMENTAL WITH BUSINESSPERFORMANCE MEASURES 18
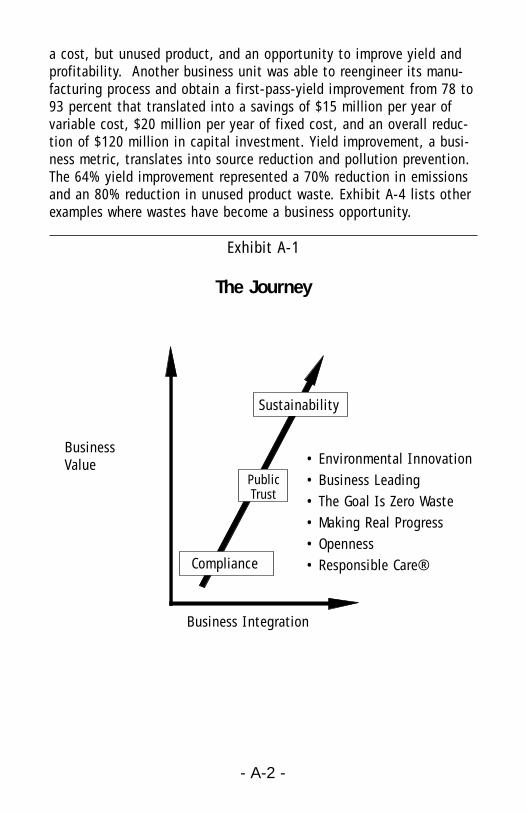
DuPont is a large chemical and energy company serving global mar-kets. Its key achievement in environmental metrics is the integrationof environmental thinking into the business process. The company’svision has gone beyond compliance and environmental outputs bymeasuring environmental innovations in terms of such traditional busi-ness measures as reduced costs, improved product yield, and increasedmarket share and stockholder value. Ultimately, environmentalimprovement is viewed not only as a reduced cost or liability, but as abusiness opportunity. This vision is compatible with the concept ofsustainability: creating economic growth without increasing adverseenvironmental impacts. It is a vision that cuts across all businessfunctions, including operations, sales, R&D, marketing, and finance.Exhibit A-1 illustrates this vision.
Stretch Goals
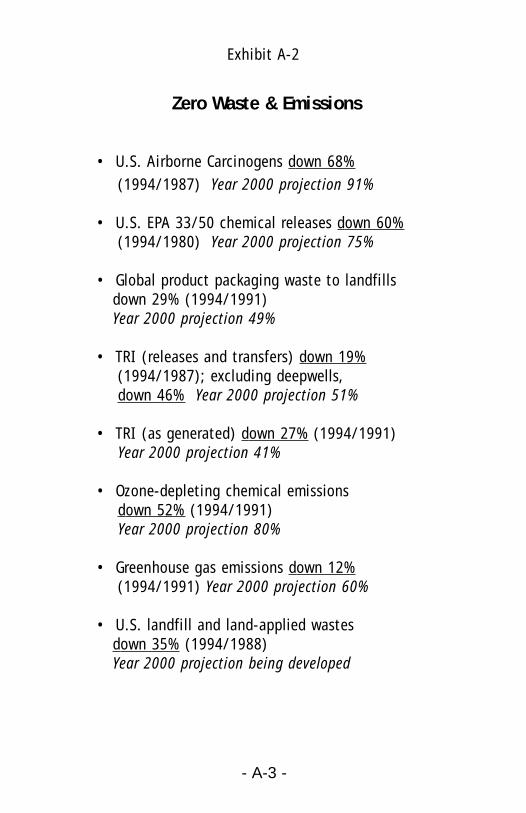
DuPont’s first step toward sustainability was the development of corpo-rate stretch goals. The goals include eliminating all injuries, illnesses,incidents, waste and emissions as a way of improving business perfor-mance. This step has simplified measurement of environmental perfor-mance and stimulated continuous improvement throughout the compa-ny (Exhibit A-2).
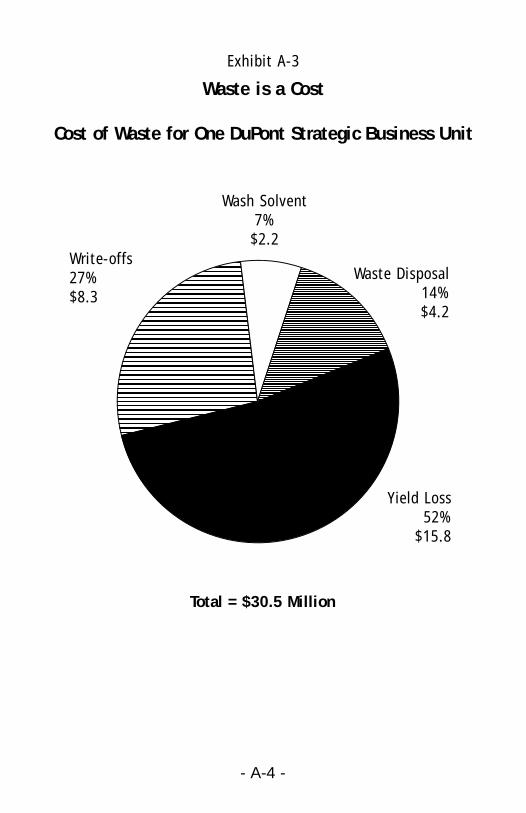
Assessing the Cost of Waste/Improving Yield
Understanding the cost of waste is the first step in helping businessunderstand the link between environmental performance and businessperformance. One business unit at DuPont was able to measure thevalue of their wastes, not only in terms of disposal costs, but alsoingredient costs and lost yield (Exhibit A-3). Thus, a waste is not only
18 This case study borrows extensively from an article by Paul V. Tebo and Dawn G. Rittenhouse titled,“Sustainable Development: Creating Business Opportunities at DuPont, “ published in Corporate EnvironmentalStrategy, Vol. 4, No.3; and from a presentation prepared by Darwin Wika of DuPont.
- A-2 -
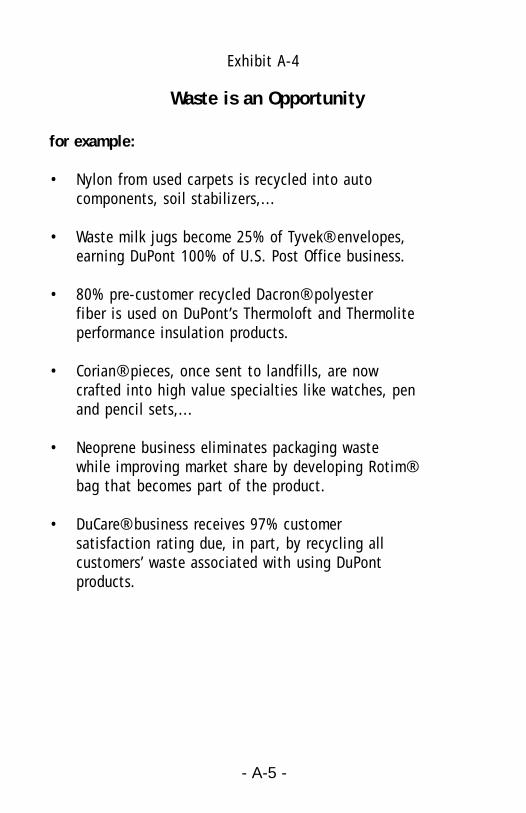
a cost, but unused product, and an opportunity to improve yield andprofitability. Another business unit was able to reengineer its manu-facturing process and obtain a first-pass-yield improvement from 78 to93 percent that translated into a savings of $15 million per year ofvariable cost, $20 million per year of fixed cost, and an overall reduc-tion of $120 million in capital investment. Yield improvement, a busi-ness metric, translates into source reduction and pollution prevention.The 64% yield improvement represented a 70% reduction in emissionsand an 80% reduction in unused product waste. Exhibit A-4 lists otherexamples where wastes have become a business opportunity.
Exhibit A-1
The Journey
Compliance
Sustainability
Compliance
BusinessValue
Business Integration
• Environmental Innovation• Business Leading• The Goal Is Zero Waste• Making Real Progress• Openness• Responsible Care®
Public Trust
- A-3 -
Zero Waste & Emissions
• U.S. Airborne Carcinogens down 68%(1994/1987) Year 2000 projection 91%
• U.S. EPA 33/50 chemical releases down 60%(1994/1980) Year 2000 projection 75%
• Global product packaging waste to landfillsdown 29% (1994/1991) Year 2000 projection 49%
• TRI (releases and transfers) down 19%(1994/1987); excluding deepwells, down 46% Year 2000 projection 51%
• TRI (as generated) down 27% (1994/1991)Year 2000 projection 41%
• Ozone-depleting chemical emissions down 52% (1994/1991)Year 2000 projection 80%
• Greenhouse gas emissions down 12%(1994/1991) Year 2000 projection 60%
• U.S. landfill and land-applied wastes down 35% (1994/1988)Year 2000 projection being developed
Exhibit A-2
- A-4 -
Exhibit A-3
Wash Solvent 7%$2.2
Waste Disposal14%$4.2
Yield Loss52%
$15.8
Write-offs27%$8.3
Total = $30.5 Million
Waste is a Cost
Cost of Waste for One DuPont Strategic Business Unit
- A-5 -
Waste is an Opportunity
for example:
• Nylon from used carpets is recycled into auto components, soil stabilizers,...
• Waste milk jugs become 25% of Tyvek® envelopes,earning DuPont 100% of U.S. Post Office business.
• 80% pre-customer recycled Dacron® polyesterfiber is used on DuPont’s Thermoloft and Thermoliteperformance insulation products.
• Corian® pieces, once sent to landfills, are nowcrafted into high value specialties like watches, penand pencil sets,...
• Neoprene business eliminates packaging wastewhile improving market share by developing Rotim®bag that becomes part of the product.
• DuCare® business receives 97% customer satisfaction rating due, in part, by recycling all customers’ waste associated with using DuPontproducts.
Exhibit A-4
- A-6 -
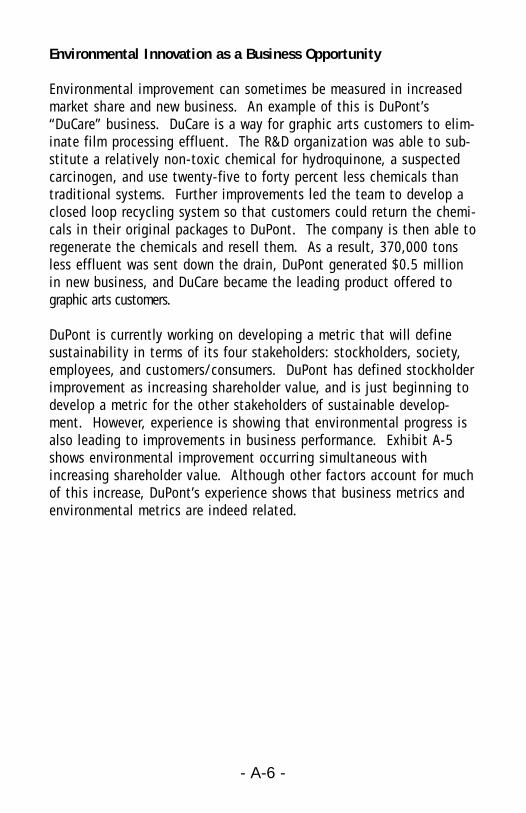
Environmental Innovation as a Business Opportunity
Environmental improvement can sometimes be measured in increasedmarket share and new business. An example of this is DuPont’s“DuCare” business. DuCare is a way for graphic arts customers to elim-inate film processing effluent. The R&D organization was able to sub-stitute a relatively non-toxic chemical for hydroquinone, a suspectedcarcinogen, and use twenty-five to forty percent less chemicals thantraditional systems. Further improvements led the team to develop aclosed loop recycling system so that customers could return the chemi-cals in their original packages to DuPont. The company is then able toregenerate the chemicals and resell them. As a result, 370,000 tonsless effluent was sent down the drain, DuPont generated $0.5 millionin new business, and DuCare became the leading product offered tographic arts customers.
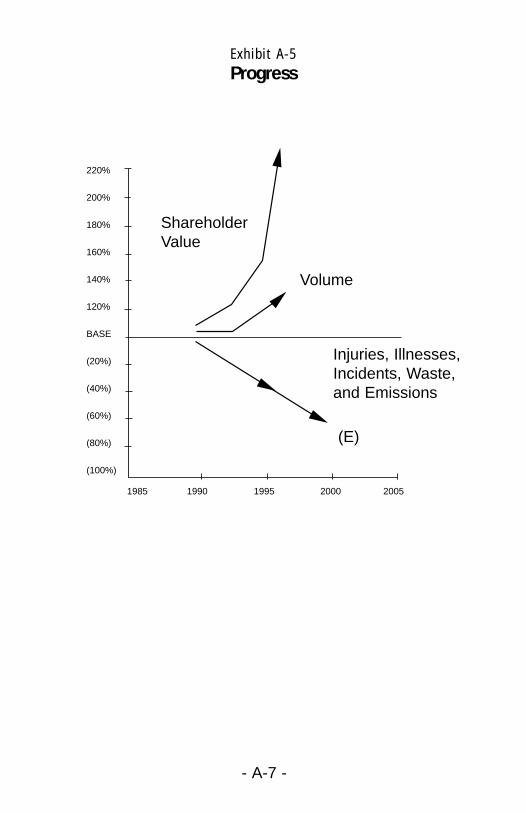
DuPont is currently working on developing a metric that will definesustainability in terms of its four stakeholders: stockholders, society,employees, and customers/consumers. DuPont has defined stockholderimprovement as increasing shareholder value, and is just beginning todevelop a metric for the other stakeholders of sustainable develop-ment. However, experience is showing that environmental progress isalso leading to improvements in business performance. Exhibit A-5shows environmental improvement occurring simultaneous withincreasing shareholder value. Although other factors account for muchof this increase, DuPont’s experience shows that business metrics andenvironmental metrics are indeed related.
- A-7 -
220%
200%
180%
160%
140%
120%
BASE
(20%)
(40%)
(60%)
(80%)
(100%)
1985 1990 1995 2000 2005
ShareholderValue
Volume
(E)
Injuries, Illnesses,Incidents, Waste,and Emissions
Exhibit A-5Progress

- A-8 -
- B-1 -
Senior Management
8
~40
2
200+
Region Management
Global & Regional HS&E Staff
Site Personnel
Appendix B.CASE STUDY - PROCTER & GAMBLE: A GLOBAL, YET FLEXIBLE APPROACH TO HS&E METRICS
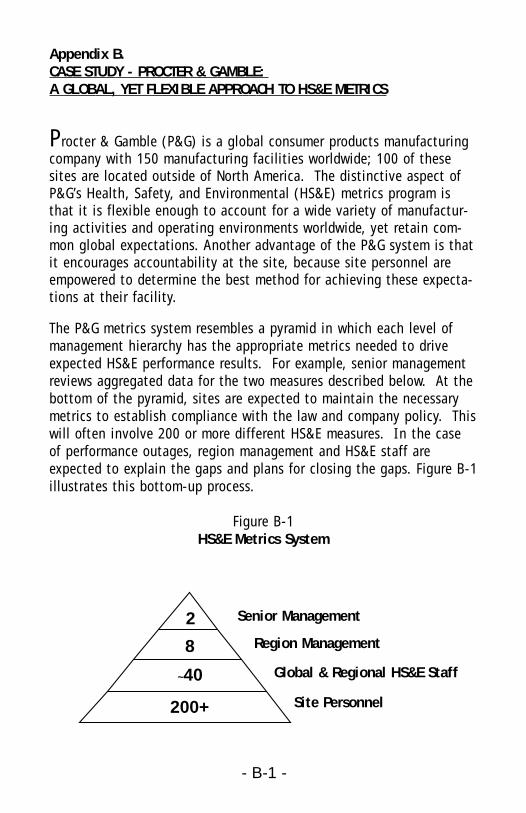
Procter & Gamble (P&G) is a global consumer products manufacturingcompany with 150 manufacturing facilities worldwide; 100 of thesesites are located outside of North America. The distinctive aspect ofP&G’s Health, Safety, and Environmental (HS&E) metrics program isthat it is flexible enough to account for a wide variety of manufactur-ing activities and operating environments worldwide, yet retain com-mon global expectations. Another advantage of the P&G system is thatit encourages accountability at the site, because site personnel areempowered to determine the best method for achieving these expecta-tions at their facility.
The P&G metrics system resembles a pyramid in which each level ofmanagement hierarchy has the appropriate metrics needed to driveexpected HS&E performance results. For example, senior managementreviews aggregated data for the two measures described below. At thebottom of the pyramid, sites are expected to maintain the necessarymetrics to establish compliance with the law and company policy. Thiswill often involve 200 or more different HS&E measures. In the caseof performance outages, region management and HS&E staff areexpected to explain the gaps and plans for closing the gaps. Figure B-1illustrates this bottom-up process.
Figure B-1HS&E Metrics System
- B-2 -
Environmental Management System (EMS) Audit Rating
At the core of the P&G metrics system is a numerical audit rating foreach of the HS&E programs. For its EMS, the company conducts annualsite audits to assess a site’s complexity (i.e., environmental aspectsand issues) as well as its capacity to manage that complexity. Asshown in Exhibit B-1, many environmental aspects are rated includingwastewater, soil/groundwater, air emissions, hazardous waste, solidwaste, and community issues. Management system capability is ratedin the areas of compliance with the law, community relations, staffcapability, system and equipment design, incident management andcontinuous improvement.
Exhibit B-1 shows typical criteria used for rating site complexity andultimately defining the level of management attention required at thesite. The example given is for the category of wastewater discharge.A site with only rainwater and sanitary discharges requiring no on-sitetreatment would be rated low and receive a complexity score of “0”.However, a facility with on-site treatment operating at more than 75%capacity and discharging more than 1000 liters of effluent per hourwould be place in the high category, and assigned a maximum com-plexity score of 20.
Exhibit B-2 shows typical rating criteria for environmental managementof a facility in the area of people capability. The specific rating criteriaare designed to appropriately address the site’s environmental com-plexity and include the certification status of key environmental per-sonnel, support of site management, frequency of environmental train-ing, program documentation, contractor selection and assessment pro-cedures and measures for corrective action. Note that site manage-ment systems are expected to have at least 80% of the maximum possiblescore.
- B-3 -
Significant HS&E Performance Defects
In addition to these key numerical audit ratings, sites are also expect-ed to eliminate significant HS&E performance defects. Significant per-formance defects are:
• Compliance issues unresolved for more than 12 months;• Total injury rates exceeding global targets; and• Key ingredient sensitivities exceeding global targets.
Other Site HS&E Performance Measures
Other measures considered in the facility HS&E assessment are:
• Trained and certified HS&E program leaders;• HS&E resource productivity and costs;• Waste generation, disposal, energy usage, and costs;• Worker’s compensation and costs;• Insurance and property losses; and• Significant HS&E incidents.
Once collected, these performance data are appropriately provided tosite, regional and global personnel for evaluation and corrective action (improvement plans).
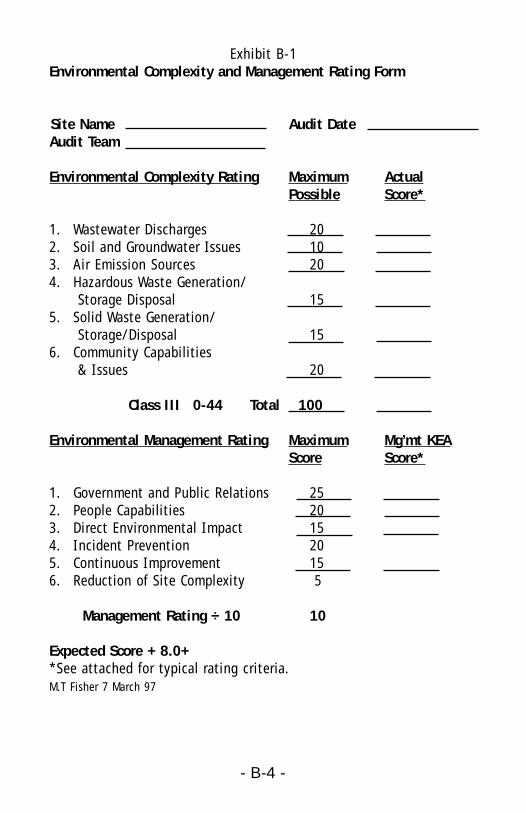
Exhibit B-1Environmental Complexity and Management Rating Form
Site Name Audit DateAudit Team
Environmental Complexity Rating Maximum ActualPossible Score*
1. Wastewater Discharges 202. Soil and Groundwater Issues 103. Air Emission Sources 204. Hazardous Waste Generation/
Storage Disposal 155. Solid Waste Generation/
Storage/Disposal 156. Community Capabilities
& Issues 20
Class III 0-44 Total 100
Environmental Management Rating Maximum Mg’mt KEAScore Score*
1. Government and Public Relations 252. People Capabilities 203. Direct Environmental Impact 154. Incident Prevention 205. Continuous Improvement 156. Reduction of Site Complexity 5
Management Rating ÷ 10 10
Expected Score + 8.0+*See attached for typical rating criteria.M.T Fisher 7 March 97
- B-4 -
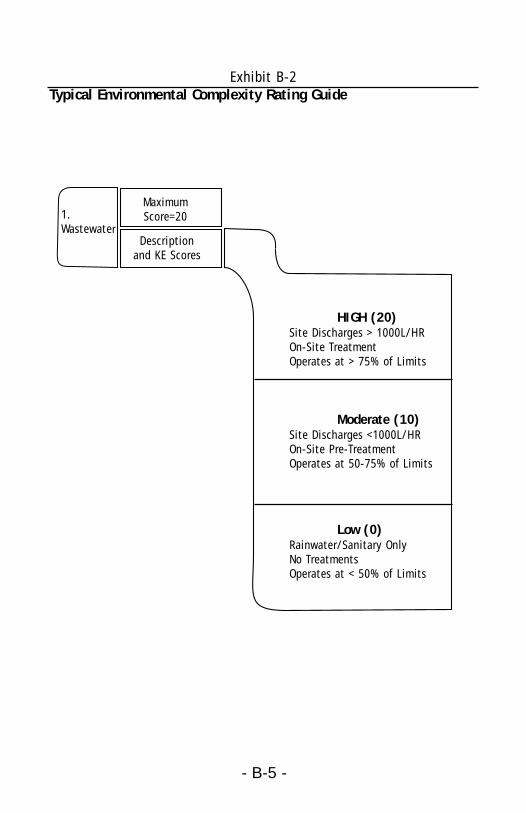
Exhibit B-2Typical Environmental Complexity Rating Guide
- B-5 -
1.Wastewater
MaximumScore=20
Descriptionand KE Scores
HIGH (20)Site Discharges > 1000L/HROn-Site TreatmentOperates at > 75% of Limits
Moderate (10)Site Discharges <1000L/HROn-Site Pre-TreatmentOperates at 50-75% of Limits
Low (0)Rainwater/Sanitary OnlyNo TreatmentsOperates at < 50% of Limits
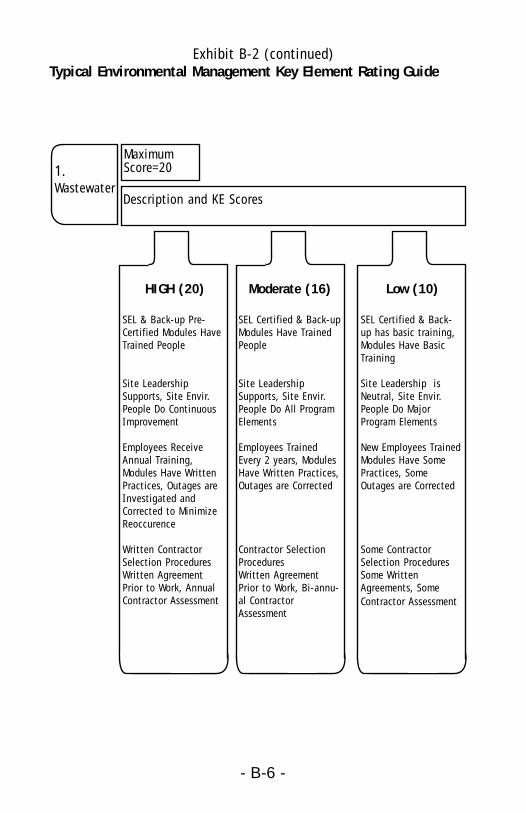
Exhibit B-2 (continued)Typical Environmental Management Key Element Rating Guide
- B-6 -
HIGH (20)
SEL & Back-up Pre-Certified Modules HaveTrained People
Site LeadershipSupports, Site Envir.People Do ContinuousImprovement
Employees ReceiveAnnual Training,Modules Have WrittenPractices, Outages areInvestigated andCorrected to MinimizeReoccurence
Written ContractorSelection ProceduresWritten AgreementPrior to Work, AnnualContractor Assessment
Moderate (16)
SEL Certified & Back-upModules Have TrainedPeople
Site LeadershipSupports, Site Envir.People Do All ProgramElements
Employees TrainedEvery 2 years, ModulesHave Written Practices,Outages are Corrected
Contractor SelectionProcedures Written AgreementPrior to Work, Bi-annu-al ContractorAssessment
Low (10)
SEL Certified & Back-up has basic training,Modules Have BasicTraining
Site Leadership isNeutral, Site Envir.People Do MajorProgram Elements
New Employees TrainedModules Have SomePractices, SomeOutages are Corrected
Some ContractorSelection ProceduresSome WrittenAgreements, SomeContractor Assessment
Description and KE Scores
MaximumScore=201.
Wastewater
- C-1 -
19 The information for this case study has been taken from “Safety Performance Indexing: Metrics for safetyperformance improvement projects” by Eastman Kodak Company, 1994.
Appendix C.CASE STUDY - KODAK: DEVELOPMENT OF AN ENVIRONMENTALPERFORMANCE INDEX19
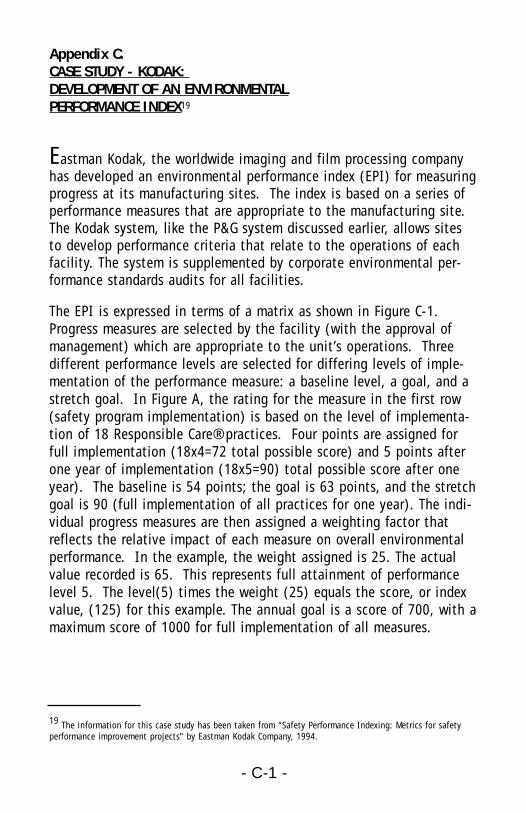
Eastman Kodak, the worldwide imaging and film processing companyhas developed an environmental performance index (EPI) for measuringprogress at its manufacturing sites. The index is based on a series ofperformance measures that are appropriate to the manufacturing site.The Kodak system, like the P&G system discussed earlier, allows sitesto develop performance criteria that relate to the operations of eachfacility. The system is supplemented by corporate environmental per-formance standards audits for all facilities.
The EPI is expressed in terms of a matrix as shown in Figure C-1.Progress measures are selected by the facility (with the approval ofmanagement) which are appropriate to the unit’s operations. Threedifferent performance levels are selected for differing levels of imple-mentation of the performance measure: a baseline level, a goal, and astretch goal. In Figure A, the rating for the measure in the first row(safety program implementation) is based on the level of implementa-tion of 18 Responsible Care® practices. Four points are assigned forfull implementation (18x4=72 total possible score) and 5 points afterone year of implementation (18x5=90) total possible score after oneyear). The baseline is 54 points; the goal is 63 points, and the stretchgoal is 90 (full implementation of all practices for one year). The indi-vidual progress measures are then assigned a weighting factor thatreflects the relative impact of each measure on overall environmentalperformance. In the example, the weight assigned is 25. The actualvalue recorded is 65. This represents full attainment of performancelevel 5. The level(5) times the weight (25) equals the score, or indexvalue, (125) for this example. The annual goal is a score of 700, with amaximum score of 1000 for full implementation of all measures.
- C-2 -
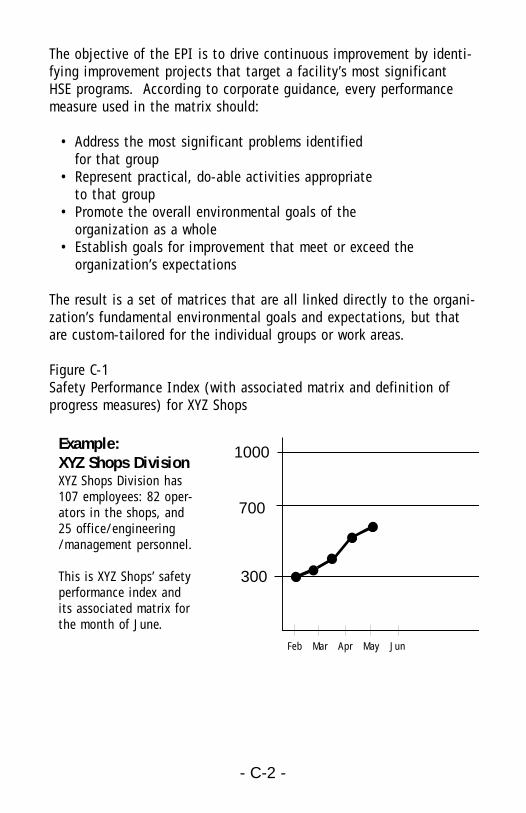
Example: XYZ Shops DivisionXYZ Shops Division has107 employees: 82 oper-ators in the shops, and25 office/engineering/management personnel.
This is XYZ Shops’ safetyperformance index andits associated matrix forthe month of June.
1000
700
300
Feb Mar Apr May Jun
The objective of the EPI is to drive continuous improvement by identi-fying improvement projects that target a facility’s most significantHSE programs. According to corporate guidance, every performancemeasure used in the matrix should:
• Address the most significant problems identified for that group
• Represent practical, do-able activities appropriate to that group
• Promote the overall environmental goals of the organization as a whole
• Establish goals for improvement that meet or exceed the organization’s expectations
The result is a set of matrices that are all linked directly to the organi-zation’s fundamental environmental goals and expectations, but thatare custom-tailored for the individual groups or work areas.
Figure C-1Safety Performance Index (with associated matrix and definition ofprogress measures) for XYZ Shops
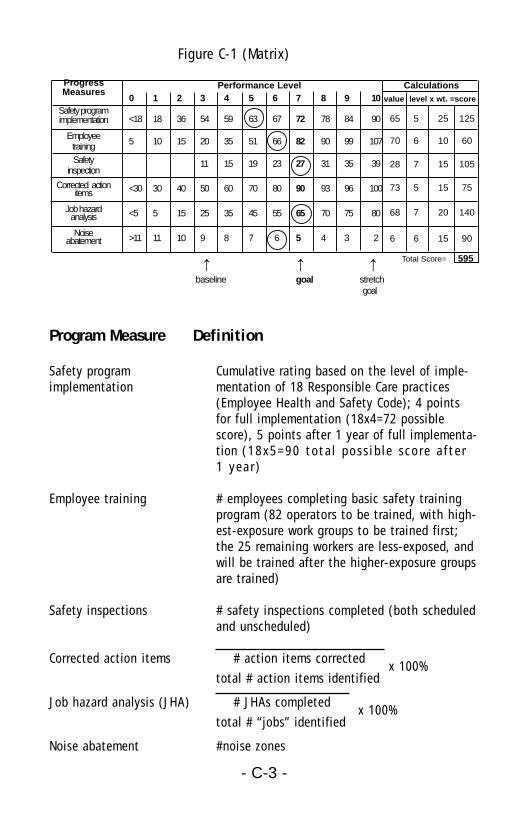
Figure C-1 (Matrix)
Program Measure Definition
Safety program Cumulative rating based on the level of imple-implementation mentation of 18 Responsible Care practices
(Employee Health and Safety Code); 4 pointsfor full implementation (18x4=72 possiblescore), 5 points after 1 year of full implementa-tion (18x5=90 total possible score after1 year)
Employee training # employees completing basic safety trainingprogram (82 operators to be trained, with high-est-exposure work groups to be trained first;the 25 remaining workers are less-exposed, andwill be trained after the higher-exposure groupsare trained)
Safety inspections # safety inspections completed (both scheduledand unscheduled)
Corrected action items # action items correctedx 100%
total # action items identified
Job hazard analysis (JHA) # JHAs completedx 100%
total # “jobs” identified
Noise abatement #noise zones
- C-3 -
Performance Level0 1 2 3 4 5 6 7 8 9 10
<18 18 36 54 59 63 67 72 78 84 90
5 10 15 20 35 51 66 82 90 99 107
11 15 19 23 27 31 35 39
<30 30 40 50 60 70 80 90 93 96 100
<5 5 15 25 35 45 55 65 70 75 80
>11 11 10 9 8 7 6 5 4 3 2
baseline goal stretch goal
Calculationsvalue level x wt. =score
65 5 25 125
70 6 10 60
28 7 15 105
73 5 15 75
68 7 20 140
6 6 15 90
Total Score= 595
� � �
ProgressMeasures
Safety programimplementation
Employee trainingSafety
inspection
Corrected actionitems
Job hazard analysis
Noise abatement

- C-4 -
- D-1 -
20 Compliance management, pollution prevention, best management practices, etc.
Appendix D.CASE STUDY - STANLEY’S ENVIRONMENTAL PERFORMANCEEVALUATION PROGRAM
Stanley’s Environmental Performance Evaluation ProgramJames Erasmus, Kevin Nelson and Margaret Sexton
Environmental AffairsThe Stanley Works1000 Stanley DriveNew Britain, CT 06053860-225-5111
ABSTRACT
Since 1995, The Stanley Works has successfully utilized its EnvironmentalPerformance Evaluation (EPE) program to reduce variability between sites andadvance best management practices throughout the Company. The EPE format— a “road map” — has helped sites achieve cost savings and identify costavoidance opportunities. The EPE/Risk diagrams serve as an excellent tool fordetermining the appropriate allocation of resources to sites. Additionallythese diagrams provide a succinct, simple visual representation of the programperformance and have proven beneficial in presentations to both executivesand line management.
DISCUSSION
In 1995, Stanley’s Company Environmental Council (CEC) began toevaluate the Company’s environmental management systems perfor-mance via the EPE program. The EPE program has three main goals:
• provide an objective measurement “tool” to evaluate performance,
• identify those areas20/sites that require additional resources,• develop a document that would also serve as a “road map”
for those sites striving for environmental excellence.
- D-2 -
21 The EPE should not be confused with a compliance audit. Compliance auditing evaluates a particularmoment in time; The EPE is designed to assess a site’s ability to sustain consistent performance over time.The EPE is a performance based tool.
The EPE program criteria describes best management practices that, ifimplemented, would give The Stanley Works the best environmentalmanagement system for the least cost. A high EPE score correlates tothe optimum compliance management strategy.21
The EPE is formatted to function as a guidance document for thosesites choosing to pursue environmental excellence. In addition, theEPE will be a critical component of any site’s effort to obtain ISO14000 certification.
The EPE Format
The EPE is divided into seven environmental areas—or performancemeasures. In 1997, these performance measures include: (1) manage-ment participation, reporting and recordkeeping, auditing follow-up;(2) compliance management practices — group one; (3) compliancemanagement practices — group two; (4) training and communication;(5) pollution prevention; (6) emergency response preparedness andprevention; and (7) facilities management. Each performance measureis further subdivided into subcategories, or indicators. Every indicatoris composed of five elements, each of which builds on the previousone.
The EPE is designed so that each site will be able to evaluate itself asit progresses through each of the indicator elements. By choosing aprogressive format for the evaluation (indicator elements), each sitewill be able to choose the rate of change it deems necessary.
- D-3 -
22 It is important to note that although the risk measurement is correlated to the activities at a site, it is pos-sible to lower a site’s risk score through reduced emissions and subsequent regulatory disengagement.
Risk Measurement
Additionally, each site’s regulatory risk — a site’s likelihood of regula-tory entanglements — is measured through the use of an environmen-tal exposure evaluation form. This form identifies the environmentalregulations that apply to the site and the volume of emissions releasedfrom the site. The range for this measurement is 0-100 and is estab-lished by the CEC. The risk measurement scale correlates to compli-ance costs. A high “risk score” is indicative of high compliance main-tenance costs.22
EPE/Risk Scatter Diagrams
By graphically plotting a site’s EPE score against its risk score, a scat-ter diagram is produced (the EPE is the y axis and risk is the x axis.)The scatter diagram is further divided into quadrants by using the mid-point risk score (50) and the 1995 mean EPE score. Figures 1 and 2 onthe following page are the EPE/Risk scatter diagrams for 1995 and1996 respectively.
With few exceptions, sites improved their EPE score. In 1995, therewere 35 sites below the mean score of 68.5; in 1996 there are only 6.
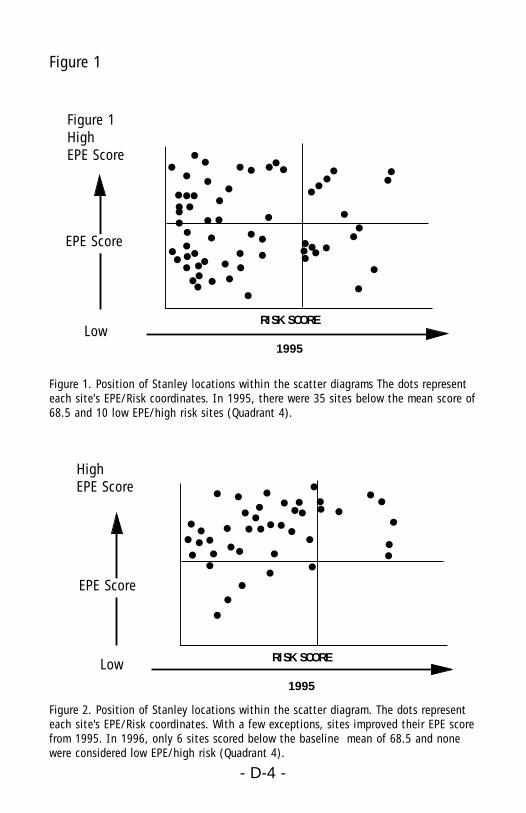
- D-4 -
RISK SCORE
1995
Figure 1
Figure 1HighEPE Score
EPE Score
Low
Figure 1. Position of Stanley locations within the scatter diagrams The dots representeach site’s EPE/Risk coordinates. In 1995, there were 35 sites below the mean score of68.5 and 10 low EPE/high risk sites (Quadrant 4).
Figure 2. Position of Stanley locations within the scatter diagram. The dots representeach site's EPE/Risk coordinates. With a few exceptions, sites improved their EPE scorefrom 1995. In 1996, only 6 sites scored below the baseline mean of 68.5 and nonewere considered low EPE/high risk (Quadrant 4).
RISK SCORE
1995
HighEPE Score
EPE Score
Low
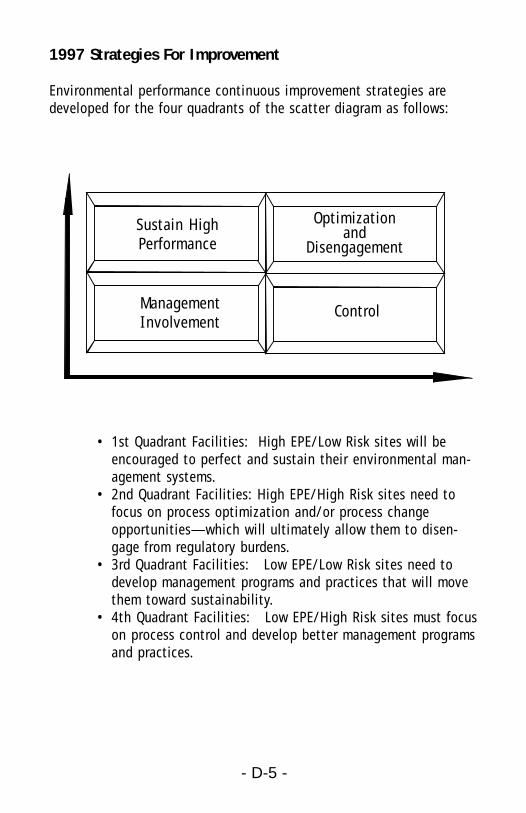
- D-5 -
1997 Strategies For Improvement
Environmental performance continuous improvement strategies aredeveloped for the four quadrants of the scatter diagram as follows:
• 1st Quadrant Facilities: High EPE/Low Risk sites will beencouraged to perfect and sustain their environmental man-agement systems.
• 2nd Quadrant Facilities: High EPE/High Risk sites need to focus on process optimization and/or process change opportunities—which will ultimately allow them to disen-gage from regulatory burdens.
• 3rd Quadrant Facilities: Low EPE/Low Risk sites need to develop management programs and practices that will move them toward sustainability.
• 4th Quadrant Facilities: Low EPE/High Risk sites must focuson process control and develop better management programsand practices.
Sustain HighPerformance
ManagementInvolvement
Control
Optimizationand
Disengagement
SUMMARY
Stanley’s Environmental Performance Evaluation (EPE) program is anannual performance appraisal. It is administered through the CompanyEnvironmental Council (CEC) and is performed at each manufacturinglocation. The EPE produces a numeric (quantitative) evaluation ofeach site’s environmental performance. The numeric scoring aspect ofthe EPE allows each site to gauge its performance against a Companyor Division average and against a known standard—the EPE indicatorcriteria. Additionally, each site is given a “risk score” determinedthrough the environmental exposure evaluation form. By graphicallyplotting a site’s EPE score against its risk score, a scatter diagram isproduced (the EPE is the y axis and risk is the x axis.) Thescatter diagram is further divided into quadrants by using the mid-point risk score (50) and the 1995 mean EPE score. Environmentalcontinuous improvement strategies are developed for the four quad-rants of the scatter diagram.
- D-6 -