Embed Size (px)
Citation preview
Measuring Infrastructure in BEA’s National Economic Accounts
Dave WasshausenAdvisory Committee MeetingNovember 19, 2021
Snapshot: What We’ll Cover
11/19/2021
2
1. Defining infrastructure
2. Data trends and metrics for adequacy
– Including experimental regional estimates
3. New analysis
– Using direct and total requirements
4. Future directions
11/19/2021
3
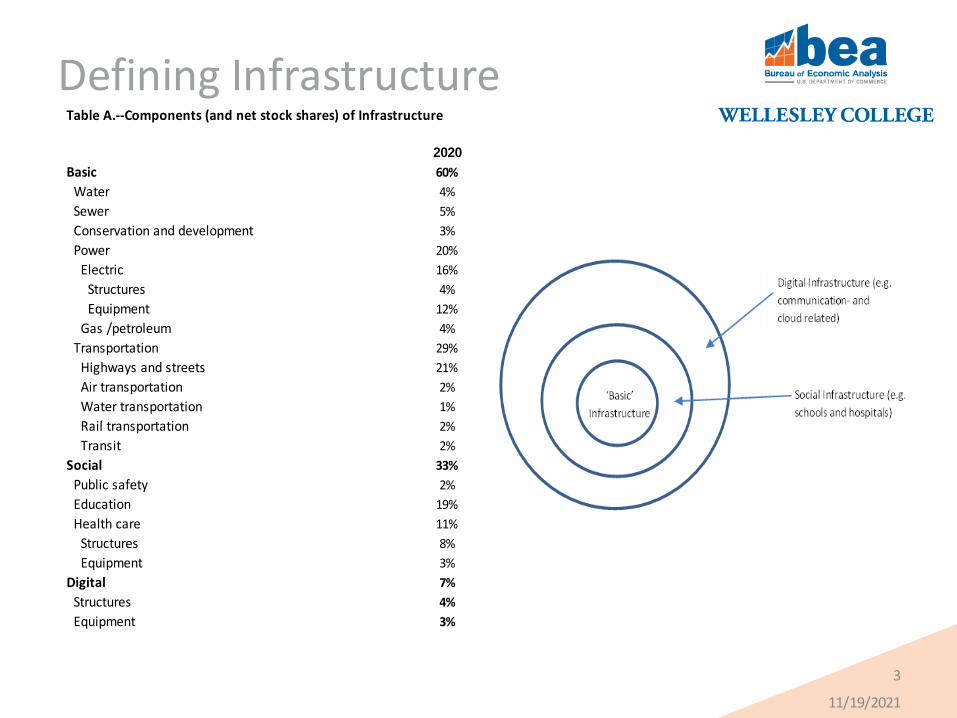
Defining Infrastructure
2020
Basic 60%
Water 4%
Sewer 5%
Conservation and development 3%
Power 20%
Electric 16%
Structures 4%
Equipment 12%
Gas /petroleum 4%
Transportation 29%
Highways and streets 21%
Air transportation 2%
Water transportation 1%
Rail transportation 2%
Transit 2%
Social 33%
Public safety 2%
Education 19%
Health care 11%
Structures 8%
Equipment 3%
Digital 7%
Structures 4%
Equipment 3%
Table A.--Components (and net stock shares) of Infrastructure

Maintenance and Repair -vs.- Improvements
11/19/2021
4

Infrastructure Shares by Type, Investment
11/19/2021
5
Data Trends Overview

Metrics for Analyzing Adequacy
11/19/2021
6

Metrics for Analyzing Adequacy:Real Capital Stock Growth
11/19/2021
7
Real Net Capital Stock per Capita, by type of Infrastructure
(Average Annual Growth Rates)
1997-2007 2007-2019
Total 1.2 1.1
Basic .6 .6 Social 2.2 1.2
Digital 3.7 4.7
Memo:
TFP Growth, Private Business
Real GDP per capita
1.5 2.1
0.5 1.0
Metrics for Analyzing Adequacy: Age of Infrastructure
• Average ages are derived as weighted average of the ages of all depreciated investment remaining in the stock as of yearend.
• Current-cost (i.e. replacement cost) vs historic-cost (i.e. acquisition cost).
• Historic-cost age tends to be lower than current-cost age
11/19/2021
8
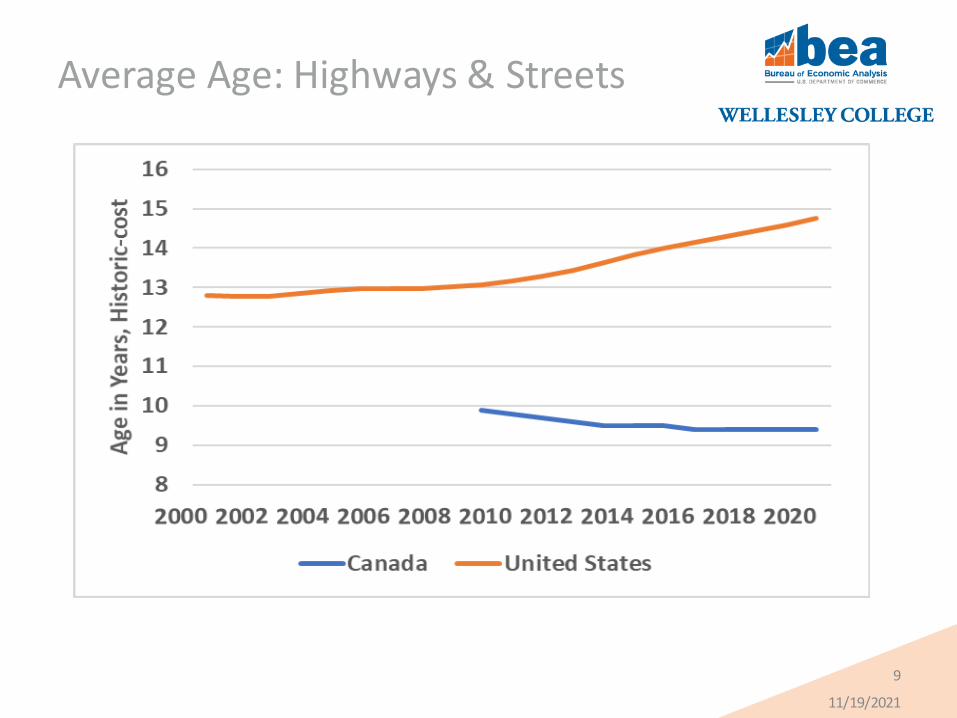
Average Age: Highways & Streets
11/19/2021
9
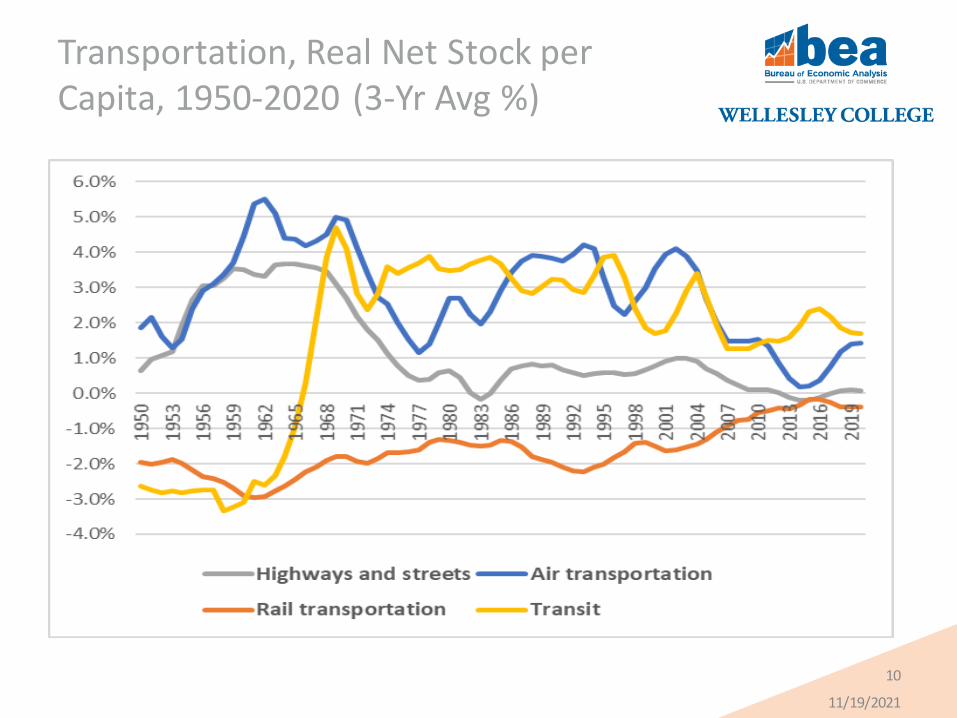
Transportation, Real Net Stock per Capita, 1950-2020 (3-Yr Avg %)
11/19/2021
10
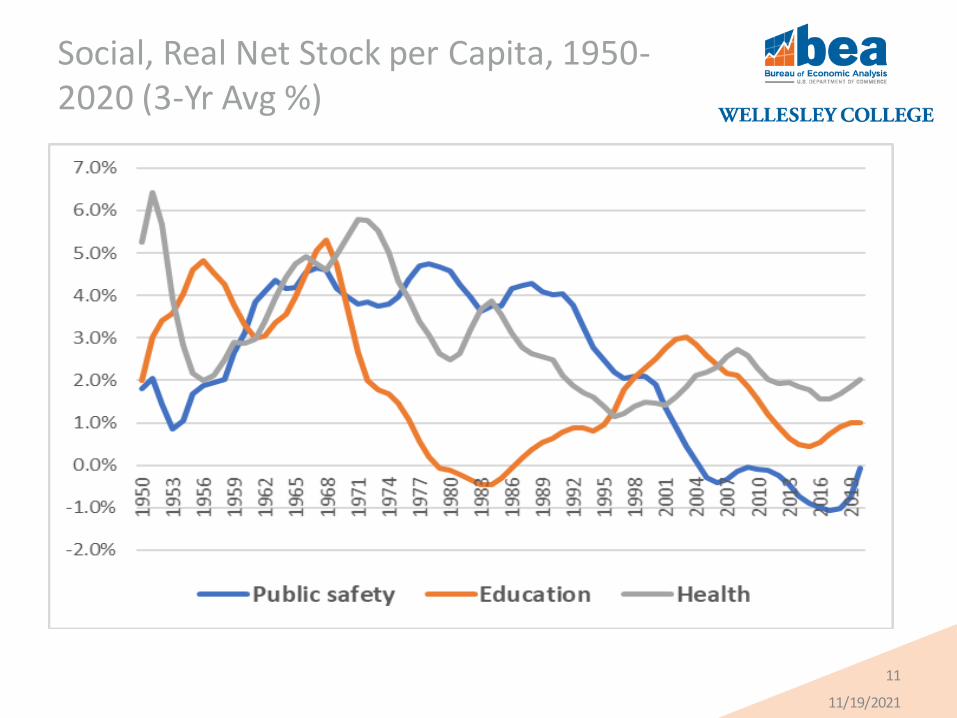
Social, Real Net Stock per Capita, 1950-2020 (3-Yr Avg %)
11/19/2021
11
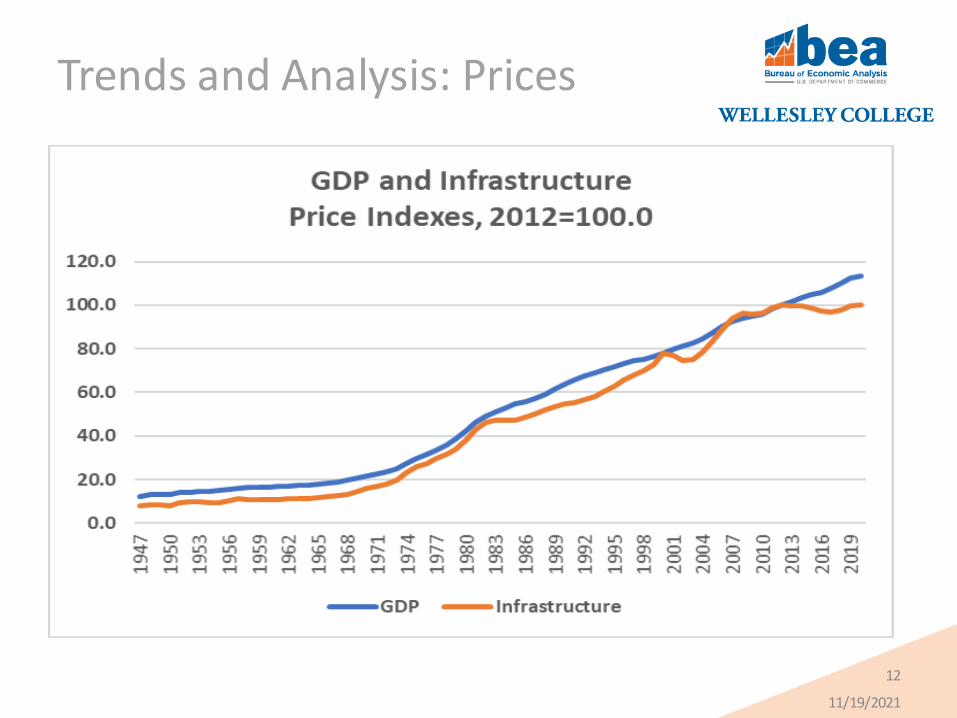
Trends and Analysis: Prices
11/19/2021
12

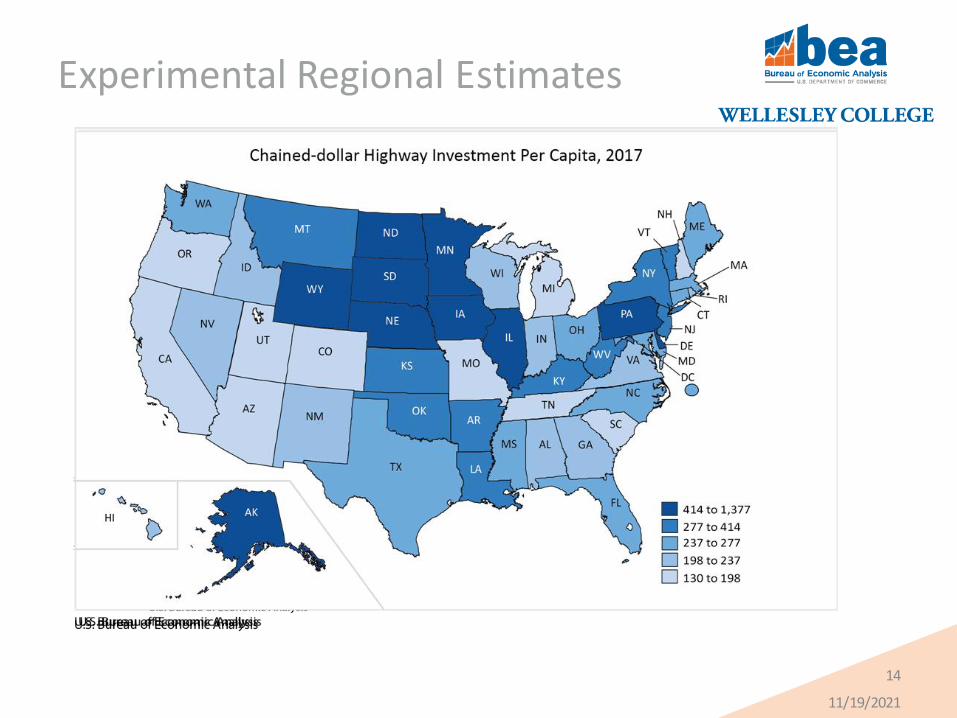
Experimental Regional Estimates
• Developed experimental state-level investment in highways and streets.
– Using results from Census Bureau’s Annual Survey of State and Local Government Finances
– “Heat maps” for highway investment per capita developed for 1992, 2002, 2012, and 2017
11/19/2021
13
Experimental Regional Estimates
11/19/2021
14
Additional Analysis
• Direct requirements– Amount of value added and intermediate inputs that are
required by an industry to produce a dollar of that industry’s output.
• Total requirements– Inputs that are required directly and indirectly to deliver a
dollar of output to final uses
• Employment requirements– Employment supported directly and indirectly per one
million dollars of final demand
11/19/2021
15

Direct Requirements
11/19/2021
16
Compensation of employees $ 363 Compensation of employees $ 399
Gross operating surplus $ 177 Gross operating surplus $ 286
Plate work and fabricated structural product
manufacturing $ 43 Architectural, engineering, and related services $ 33
Petroleum refineries $ 38 Petroleum refineries $ 24
Asphalt shingle and coating materials manufacturing $ 31
Plate work and fabricated structural product
manufacturing $ 21
Ready-mix concrete manufacturing $ 26
Commercial and industrial machinery and equipment
rental and leasing $ 17
Architectural, engineering, and related services $ 22
Building material and garden equipment and supplies
dealers $ 14
Other durable goods merchant wholesalers $ 20 Other durable goods merchant wholesalers $ 14
Commercial and industrial machinery and equipment
rental and leasing $ 19
Turned product and screw, nut, and bolt
manufacturing $ 12
Stone mining and quarrying $ 16 Ready-mix concrete manufacturing $ 7
Top 10 Direct Requirements for Producing Infrastructure Assets(Inputs Required to Produce $1 Billion of Industry Output, 2012)
Transportation structures,
including highways and streets
[Millions of dollars]
Power and communication structures
[Millions of dollars]

Shares of Intermediate Inputs Required for Producing Infrastructure
11/19/2021
17
All other intermediate inputs
Professional services
Petroleum and coal products Fabricated metal products
Nonmetallic mineral products
Wholesale trade
Rental and leasing
Other Infrastructure
Transportation Infrastructure Power and Communication Infrastructure
Education Infrastructure

Total Requirements
11/19/2021
18
Total Commodity Output Requirements 1,991$ Total Commodity Output Requirements 1,648$
Transportation structures and highways and streets 1,000$ Power and communication structures 1,000$
Petroleum refineries 68$ Architectural, engineering, and related services 38$
Oil and gas extraction 57$ Petroleum refineries 34$
Plate work and fabricated structural product manufacturing 46$ Oil and gas extraction 31$
Other durable goods merchant wholesalers 34$ Other durable goods merchant wholesalers 23$
Asphalt shingle and coating materials manufacturing 31$ Plate work and fabricated structural product manufacturing 22$
Architectural, engineering, and related services 30$
Commercial and industrial machinery and equipment rental and
leasing 19$
Ready-mix concrete manufacturing 26$ Iron and steel mills and ferroalloy manufacturing 18$
Iron and steel mills and ferroalloy manufacturing 26$ Other real estate 17$
Truck transportation 23$ Management of companies and enterprises 15$
Top 10 Total Requirements To Deliver $1 Billion of Infrasture Assets, 2012
Transportation structures and highways and streets Power and communication structures

Employment Requirements
11/19/2021
19
All Industries 10,293
Agriculture, mining, and utilities 185
Construction 6,193
Manufacturing 1,216
Wholesale and retail trade 936
Transportation and warehousing 236
Information, finance, real estate and rental and leasing 277
Professional, scientific, and technical services 502
Administrative and support and waste management 409
Other services, including government 338
Employment Supported Directly and Indirectly
Per $1 Billion Construction Investment, 2012
Future Research Directions
• More fully assess data gaps and the need for improved prices and depreciation profiles
• Explore industry/functional dimensions
• More international comparisons
• More regional experimentation
• Explore alternative volume indicators
11/19/2021
20
Future Research Directions:Depreciation Profiles
• Many of BEA’s depreciation profiles were developed 40+ years ago
• Recent BEA / BLS working paper, “Alternative Capital Asset Deprecation Rates for U.S. Capital and Multifactor Productivity Measures” – Statistics Canada’s depreciation rates and other US
studies are based on recent surveys and are higher than BEA’s for many types of structures
• Eurostat-OECD Compilation guide on land estimations (2015)– Several OECD countries have higher depreciation rates
11/19/2021
21
Discussion Questions
1)What additional future directions should we consider?
2) Are there other metrics or dimensions that we should consider?
3) Ideas on alternative volume measures to explore?
4) What uses of this data do you envision?
11/19/2021
22