Embed Size (px)
Citation preview
Measuring Intangible Investment
THE BOUNDARIES OF FINANCIALREPORTING AND HOW TO EXTEND THEM
by
Baruch LevPhilip Bardes Professor of Accounting and Finance
Stern School of Business, New York University
and
Paul ZarowinAssociate Professor of Accounting
Stern School of Business, New York University
© OECD 1998
ORGANISATION FOR ECONOMIC CO-OPERATION AND DEVELOPMENT
2
TABLE OF CONTENTS
THE BOUNDARIES OF FINANCIAL REPORTING AND HOW TO EXTEND THEM.......................... 3
1. The decreasing usefulness of financial information ............................................................................... 42. Business change and the deterioration of usefulness ............................................................................ 133. Intangibles, innovation and change ...................................................................................................... 224. Improving the usefulness of financial information............................................................................... 275. Postcript ................................................................................................................................................ 32
NOTES ......................................................................................................................................................... 33
REFERENCES ............................................................................................................................................. 37
3
THE BOUNDARIES OF FINANCIAL REPORTING AND HOW TO EXTEND THEM*
It is of great use to the sailorTo know the length of his line, though
He cannot with it fathom all the Depths of the ocean.John Locke, An Essay Concerning
Human Understanding (1690)
We investigate in this study the usefulness of financial information to investors (the “length of thesailors line”) by comparison to the total information in the market-place (“the depth of the ocean”).1 Ourevidence indicates that the usefulness of reported earnings, cash flows and book (equity) values has beendeteriorating over the last 20 years. How could such a deterioration take place while demand by investorsfor relevant information increases and regulators persist in their efforts to improve the quality andtimeliness of financial information?
The answer, we hypothesise, is change which increasingly affects business enterprises. Be it drivenby the ever stiffening competition, deregulation or innovation, the impact of change on firms’ operationsand economic condition is not adequately reflected by the accounting measurement and reporting system.The large investments generally associated with change, such as restructuring costs and R&Dexpenditures, are immediately expensed, whereas the benefits of change are recorded in subsequentperiods, unencumbered by the previously expensed investments. Consequently, the fundamentalaccounting measurement process of matching periodically costs with revenues is seriously distorted,adversely affecting the informativeness of financial information.2
We validate our conjecture that business change is an important factor responsible for thedeterioration in the informativeness of financial information, by providing evidence that: i) the rate ofchange experienced by business enterprises has increased over the last 20 years; and ii) the increase in therate of change is associated with the decline in the usefulness of financial information. We thus linkempirically business change with the temporal decline of informativeness of financial information.
We next focus on the innovative activities of business enterprises -- the major initiator of change indeveloped economies. These activities, taking the form of investment in intangible assets, such as R&D,information technology, brands and human resources, constantly change firms’ products, operations,economic condition and market values. Yet, it is in the intangibles domain that accounting fails most
* The authors are, respectively, the Philip Bardes Professor of Accounting and Finance, and associate professor of accounting, the
Stern School of Business, New York University [Tel.: (212) 998-0028; Fax: (212) 995-4004]. Helpful comments and suggestionswere obtained from David Aboody, Mary Barth, William Beaver, Christine Botosan, Amihud Dotan, Dan Givoly, Ron Kasznik,Nahum Melumad, Jim Ohlson, Fernando Penalva, Richard Sansing, Brett Trueman and Gregory Waymire.
4
seriously in reflecting enterprise value and performance, mainly due to the mismatching of costs withrevenues.
We validate our hypothesis concerning the adverse informational consequences of the accountingtreatment of intangibles by documenting: i) the existence of a positive association between the rate ofbusiness change and shifts in R&D spending; and ii) the association between changes in theinformativeness of earnings and changes in R&D spending.
We thus link the increasing role of intangible investments in advanced economies, through the effectof these investments on the rate of business change, to the documented decline in the usefulness offinancial information. This naturally raises the normative question of what can be done to arrest thedeterioration in the usefulness of financial information, which we address in the last section of this study.We advance two proposals -- the capitalisation of intangible investments and a systematic restatement offinancial reports. The first proposal expands on a practice which is currently used only in specialcircumstances (e.g. software development costs), whereas the second proposal is a more radicalmodification of current accounting practices.
1. The decreasing usefulness of financial information
We rely in this study on statistical associations between accounting data and capital market values(stock prices and returns) to assess the usefulness of financial information to investors.3 Such associationsreflect the consequences of investors’ actions, whereas alternative research techniques, such asquestionnaire or interview studies, reflect investor’s opinions and beliefs. Furthermore, empiricalassociations between market values and financial data allow for an assessment of the incrementalusefulness of accounting data relative to other information sources (e.g. managers’ voluntary disclosuresor analysts’ recommendations), whereas interview or prediction studies where information usefulness isassessed in terms of predictive power, such as in Ou and Penman (1989), generally do not compare theusefulness of accounting data with that of other information sources.4
1.1 The weakening returns-earnings association
It has been previously documented (e.g. Lev, 1989) that the association between reported earningsand stock returns is weak. Whether returns are measured over short (e.g. a few days around earningsannouncement) or long (up to a year) intervals, earnings account for only 5 to 10 per cent of thedifferences in stock returns.5 This result holds in cross-section and time-series studies, and applies toreported earnings as well as to earnings surprises. In this study we expand the scope of the examinedinformation to include cash flows and book values, and extend the investigation of usefulness to theintertemporal dimension; that is, determining the changes that occurred over time in the informativenessof financial data. We focus on the last 20 years, since the recent far-reaching economic changes(e.g. globalisation of business operations, advent of many high-tech industries and extensive world-widederegulations) render this period of particular interest for assessing the usefulness of financialinformation.
We start the analysis by examining the usefulness of reported earnings, using the followingcross-sectional regression construct to estimate the association between annual stock returns and the leveland change of earnings:
5
Rit = α0 + α1Eit + α2 ∆Eit + εit, t = 1977 – 1996 (1)
where:Rit = firm i’s stock return for fiscal year t.
Eit = reported earnings before extra ordinary items (COMPUSTAT item No. 58) of firm i in fiscal t.
∆Eit =annual change in earnings: ∆Eit = Eit – Ei,t–1, proxying for the surprise element in reportedearnings.
Both Eit and ∆Eit are scaled (divided) by firm i’s total market value of equity at the beginning offiscal t. Our sources of data are the 1996 versions of the COMPUSTAT (both Current and Research files)and CRSP databases.
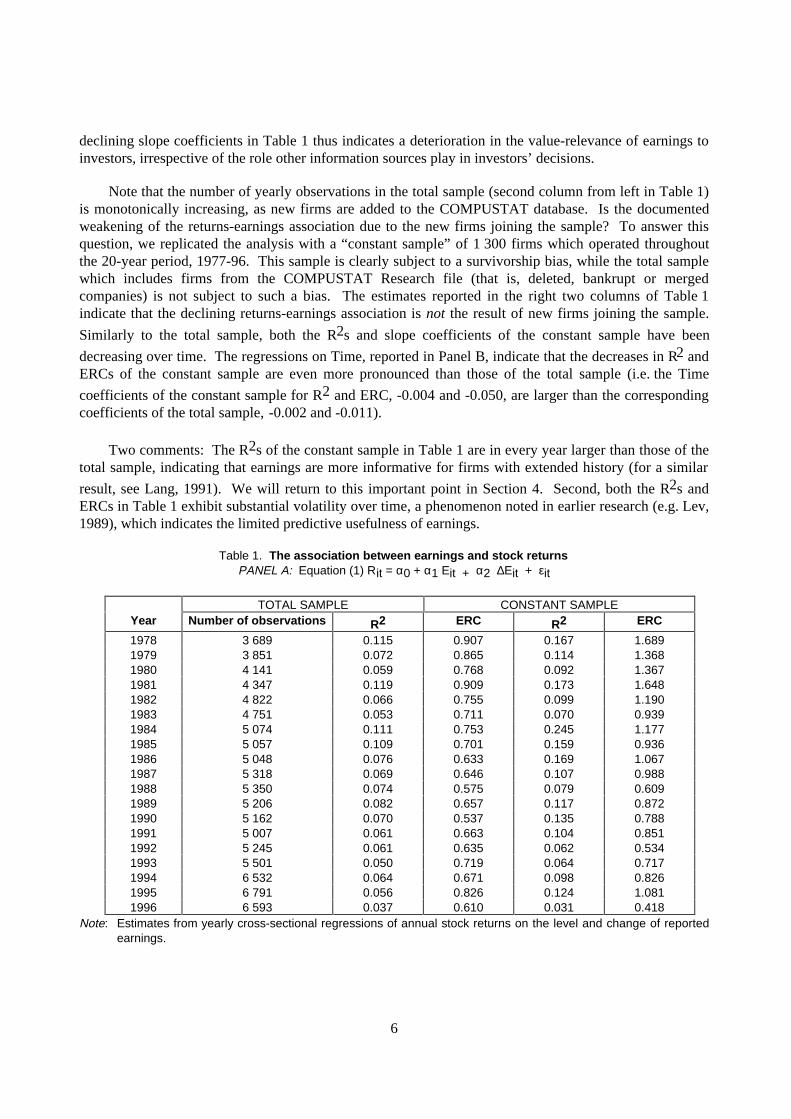
Table 1 presents estimates obtained from running regression (1) for each of the years, 1978-96 (1977is “lost” due to the first differencing of earnings). The three data columns to the left of the table pertain tothe total sample, which ranges in size from 3 700 to 6 800 firms per year. The right two columns reporton a subsample of firms (1 300) with data in each of the 20 years examined (the “constant sample”).
It is evident from Panel A of Table 1 that the association between stock returns and earnings, as
measured by the coefficient of determination, R2, has been declining throughout the 1977-96 period:
from R2s of 6-12 per cent in the first ten years of the sample to R2s of 4-8 per cent in the last ten years.6
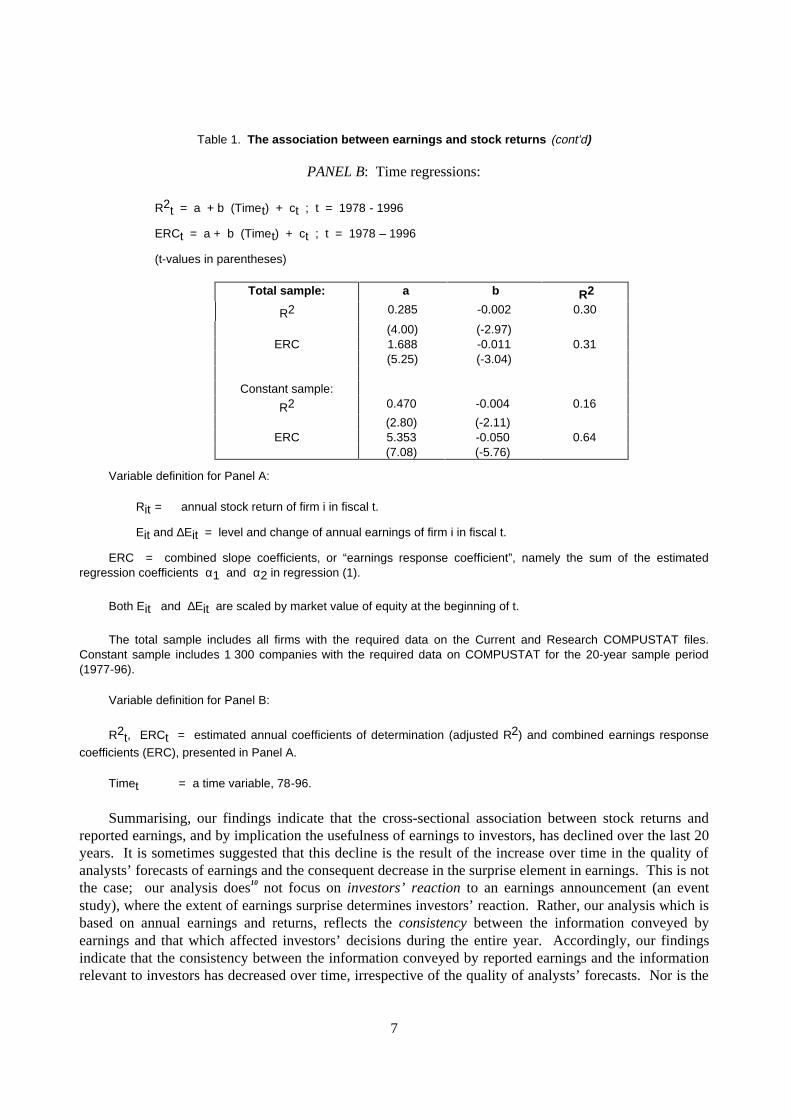
A regression of the annual R2s in Panel A on a Time variable indicates (Panel B) that the R2 decrease isstatistically significant: the estimated Time coefficient is 80.002 (t = –2.97).7
A different perspective on the informativeness of earnings is provided by the combined slopecoefficients of earnings [α1 + α2 in regression (1)]. This measure, dubbed the “earnings responsecoefficient” or ERC, reflects the average change in the stock price associated with a dollar change inearnings. A low slope coefficient, for example, suggests that reported earnings are not particularlyinformative to investors, probably because they are perceived as transitory or subject to managerialmanipulation. In contrast, a high slope coefficient indicates that a large stock price change is associatedwith reported earnings, reflecting investors’ belief that earnings are largely permanent (a reliable indicatorof future profitability).8 It has been shown (e.g. Lev, 1989, Appendix) that the estimated slope coefficientis a function of the precision of earnings.
The estimated slope coefficients (ERCs) in Table 1 (fourth column from left) have been decreasing
over 1977-96, similarly to the R2s: from a range of 0.75 – 0.90 in the first five years of the sample, to0.60 – 0.80 in the last five years. A regression of the yearly ERCs on Time (Panel B) confirms that theERC’s decline is statistically significant: the estimated coefficient of Time is –0.011 (t = -3.04).9
The evidence on the declining slope coefficients of earnings complements the inferences based on
declining R2s. The R2 measure indicates the value-relevance of earnings relative to other sources of
information. Accordingly, the temporally declining R2s in Table 1 may be explained by an increase overtime in the relative importance of non-accounting information (e.g. voluntary disclosures by managers oranalysts’ recommendations), even if the informativeness of earnings on a stand-alone basis remainedunchanged. However, the regression slope coefficients (ERCs) are unaffected by the existence of otherinformation items because the slope coefficients focus on the valuation impact of earnings. The pattern of
6
declining slope coefficients in Table 1 thus indicates a deterioration in the value-relevance of earnings toinvestors, irrespective of the role other information sources play in investors’ decisions.
Note that the number of yearly observations in the total sample (second column from left in Table 1)is monotonically increasing, as new firms are added to the COMPUSTAT database. Is the documentedweakening of the returns-earnings association due to the new firms joining the sample? To answer thisquestion, we replicated the analysis with a “constant sample” of 1 300 firms which operated throughoutthe 20-year period, 1977-96. This sample is clearly subject to a survivorship bias, while the total samplewhich includes firms from the COMPUSTAT Research file (that is, deleted, bankrupt or mergedcompanies) is not subject to such a bias. The estimates reported in the right two columns of Table 1indicate that the declining returns-earnings association is not the result of new firms joining the sample.
Similarly to the total sample, both the R2s and slope coefficients of the constant sample have been
decreasing over time. The regressions on Time, reported in Panel B, indicate that the decreases in R2 andERCs of the constant sample are even more pronounced than those of the total sample (i.e. the Time
coefficients of the constant sample for R2 and ERC, -0.004 and -0.050, are larger than the correspondingcoefficients of the total sample, -0.002 and -0.011).
Two comments: The R2s of the constant sample in Table 1 are in every year larger than those of thetotal sample, indicating that earnings are more informative for firms with extended history (for a similar
result, see Lang, 1991). We will return to this important point in Section 4. Second, both the R2s andERCs in Table 1 exhibit substantial volatility over time, a phenomenon noted in earlier research (e.g. Lev,1989), which indicates the limited predictive usefulness of earnings.
Table 1. The association between earnings and stock returnsPANEL A: Equation (1) Rit = α0 + α1 Eit + α2 ∆Eit + εit
TOTAL SAMPLE CONSTANT SAMPLEYear Number of observations R2 ERC R2 ERC
1978 3 689 0.115 0.907 0.167 1.6891979 3 851 0.072 0.865 0.114 1.3681980 4 141 0.059 0.768 0.092 1.3671981 4 347 0.119 0.909 0.173 1.6481982 4 822 0.066 0.755 0.099 1.1901983 4 751 0.053 0.711 0.070 0.9391984 5 074 0.111 0.753 0.245 1.1771985 5 057 0.109 0.701 0.159 0.9361986 5 048 0.076 0.633 0.169 1.0671987 5 318 0.069 0.646 0.107 0.9881988 5 350 0.074 0.575 0.079 0.6091989 5 206 0.082 0.657 0.117 0.8721990 5 162 0.070 0.537 0.135 0.7881991 5 007 0.061 0.663 0.104 0.8511992 5 245 0.061 0.635 0.062 0.5341993 5 501 0.050 0.719 0.064 0.7171994 6 532 0.064 0.671 0.098 0.8261995 6 791 0.056 0.826 0.124 1.0811996 6 593 0.037 0.610 0.031 0.418
Note: Estimates from yearly cross-sectional regressions of annual stock returns on the level and change of reportedearnings.
7
Table 1. The association between earnings and stock returns (cont’d)
PANEL B: Time regressions:
R2t = a + b (Timet) + ct ; t = 1978 - 1996
ERCt = a + b (Timet) + ct ; t = 1978 – 1996
(t-values in parentheses)
Total sample: a b R2
R2 0.285 -0.002 0.30
(4.00) (-2.97)ERC 1.688 -0.011 0.31
(5.25) (-3.04)
Constant sample:
R2 0.470 -0.004 0.16
(2.80) (-2.11)ERC 5.353 -0.050 0.64
(7.08) (-5.76)
Variable definition for Panel A:
Rit = annual stock return of firm i in fiscal t.
Eit and ∆Eit = level and change of annual earnings of firm i in fiscal t.
ERC = combined slope coefficients, or “earnings response coefficient”, namely the sum of the estimatedregression coefficients α1 and α2 in regression (1).
Both Eit and ∆Eit are scaled by market value of equity at the beginning of t.
The total sample includes all firms with the required data on the Current and Research COMPUSTAT files.Constant sample includes 1 300 companies with the required data on COMPUSTAT for the 20-year sample period(1977-96).
Variable definition for Panel B:
R2t, ERCt = estimated annual coefficients of determination (adjusted R2) and combined earnings response
coefficients (ERC), presented in Panel A.
Timet = a time variable, 78-96.
Summarising, our findings indicate that the cross-sectional association between stock returns andreported earnings, and by implication the usefulness of earnings to investors, has declined over the last 20years. It is sometimes suggested that this decline is the result of the increase over time in the quality ofanalysts’ forecasts of earnings and the consequent decrease in the surprise element in earnings. This is notthe case; our analysis does10 not focus on investors’ reaction to an earnings announcement (an eventstudy), where the extent of earnings surprise determines investors’ reaction. Rather, our analysis which isbased on annual earnings and returns, reflects the consistency between the information conveyed byearnings and that which affected investors’ decisions during the entire year. Accordingly, our findingsindicate that the consistency between the information conveyed by reported earnings and the informationrelevant to investors has decreased over time, irrespective of the quality of analysts’ forecasts. Nor is the
8
increase in the availability of non-accounting information solely responsible for the decrease in earningsusefulness, as indicated by the declining earnings response coefficient. 11
1.2 Is cash king?12
Cash flows are often claimed to be more informative than earnings because they are less amenable tosubjective assumptions and managerial manipulation than accrual earnings. Cash flows are also perceivedto be superior to earnings in situations where the latter are of questionable relevance, such as whenearnings are negative due to the excessive expensing of intangibles (e.g. the case with many cellular andbiotechnology companies). It is, therefore, instructive to examine the pattern of association between stockreturns and cash flows. We accordingly run the following cross-sectional regression for each sample year(1977-96):
Rit = β0 + β1CFit + β2 ∆CFit + β3 ACCit + β4 ∆ACCit + εit , (2)
Where:
Rit = firm i’s stock return for fiscal year t.
CFit and ∆CFit = cash flow from operations and the yearly change in cash flows fromoperations, respectively.
ACCit and ∆ACCit = annual reported accruals and the change in annual accruals, whereaccruals equal the difference between reported earnings and cash flows from operations. Thefour independent variables in (2) are scaled by the beginning-of-year market value of equity.Regression (2) thus estimates the association between annual stock returns, on the one hand, andoperating cash flows plus accounting accruals (the difference between earnings and cash flows)on the other hand. Table 2 reports yearly coefficient estimates of this regression.
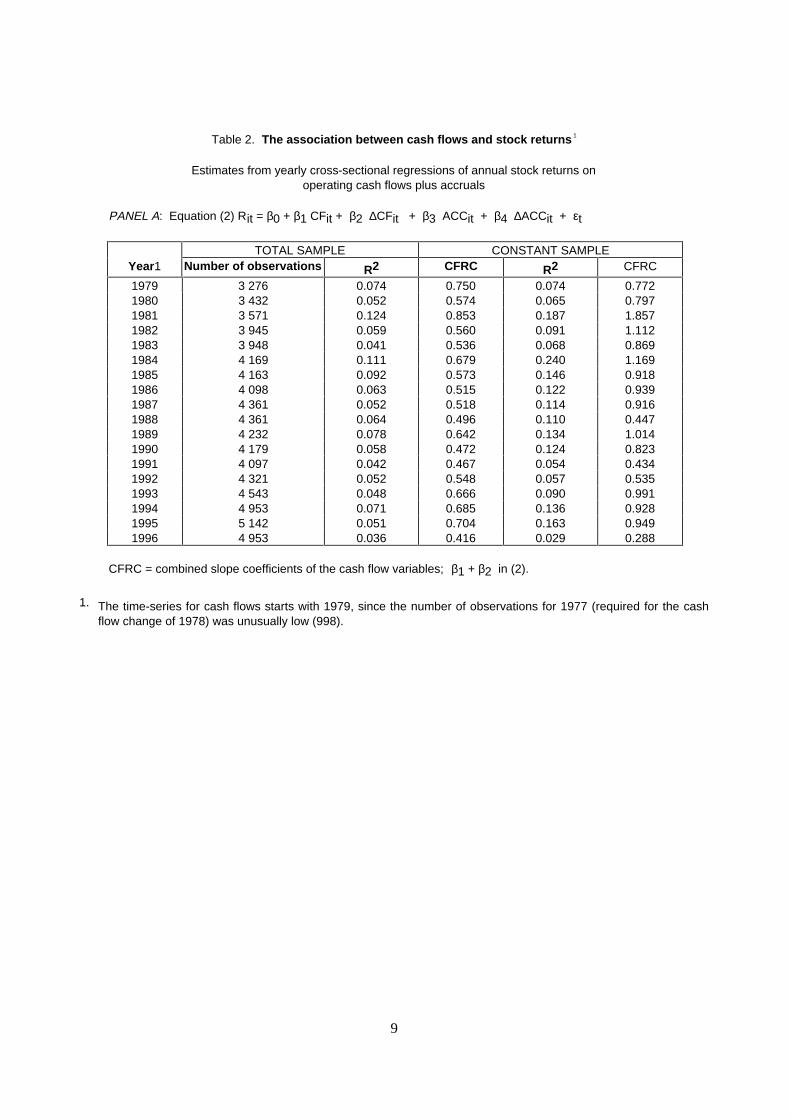
The first notable result in Table 2 is that cash is hardly king: the association between operating cash
flows (plus accruals) and stock returns, as measured by R2, is not appreciably stronger than the
association between earnings and returns (R2s in Table 1).13 As to the time pattern of association, the R2sof both the total and constant samples have decreased over the examined period, although only theformer’s decrease is statistically significant (see Time coefficients in Panel B of Table 2). Similarly, thecombined slope coefficients of the level and change of cash flows [β1 + β2 in expression (2)], denotedas CFRC, tends to decrease over time, although only the decrease of the constant sample is statisticallysignificant, as evidenced by the Time coefficients in Panel B. As was the case with earnings (Table 1), the
R2s of the constant sample are substantially larger than those of the total sample, indicating that operatingcash flows are more informative for firms with a “history”.
9
Table 2. The association between cash flows and stock returns 1
Estimates from yearly cross-sectional regressions of annual stock returns onoperating cash flows plus accruals
PANEL A: Equation (2) Rit = β0 + β1 CFit + β2 ∆CFit + β3 ACCit + β4 ∆ACCit + εt
TOTAL SAMPLE CONSTANT SAMPLEYear1 Number of observations R2 CFRC R2 CFRC
1979 3 276 0.074 0.750 0.074 0.7721980 3 432 0.052 0.574 0.065 0.7971981 3 571 0.124 0.853 0.187 1.8571982 3 945 0.059 0.560 0.091 1.1121983 3 948 0.041 0.536 0.068 0.8691984 4 169 0.111 0.679 0.240 1.1691985 4 163 0.092 0.573 0.146 0.9181986 4 098 0.063 0.515 0.122 0.9391987 4 361 0.052 0.518 0.114 0.9161988 4 361 0.064 0.496 0.110 0.4471989 4 232 0.078 0.642 0.134 1.0141990 4 179 0.058 0.472 0.124 0.8231991 4 097 0.042 0.467 0.054 0.4341992 4 321 0.052 0.548 0.057 0.5351993 4 543 0.048 0.666 0.090 0.9911994 4 953 0.071 0.685 0.136 0.9281995 5 142 0.051 0.704 0.163 0.9491996 4 953 0.036 0.416 0.029 0.288
CFRC = combined slope coefficients of the cash flow variables; β1 + β2 in (2).
1. The time-series for cash flows starts with 1979, since the number of observations for 1977 (required for the cashflow change of 1978) was unusually low (998).
10
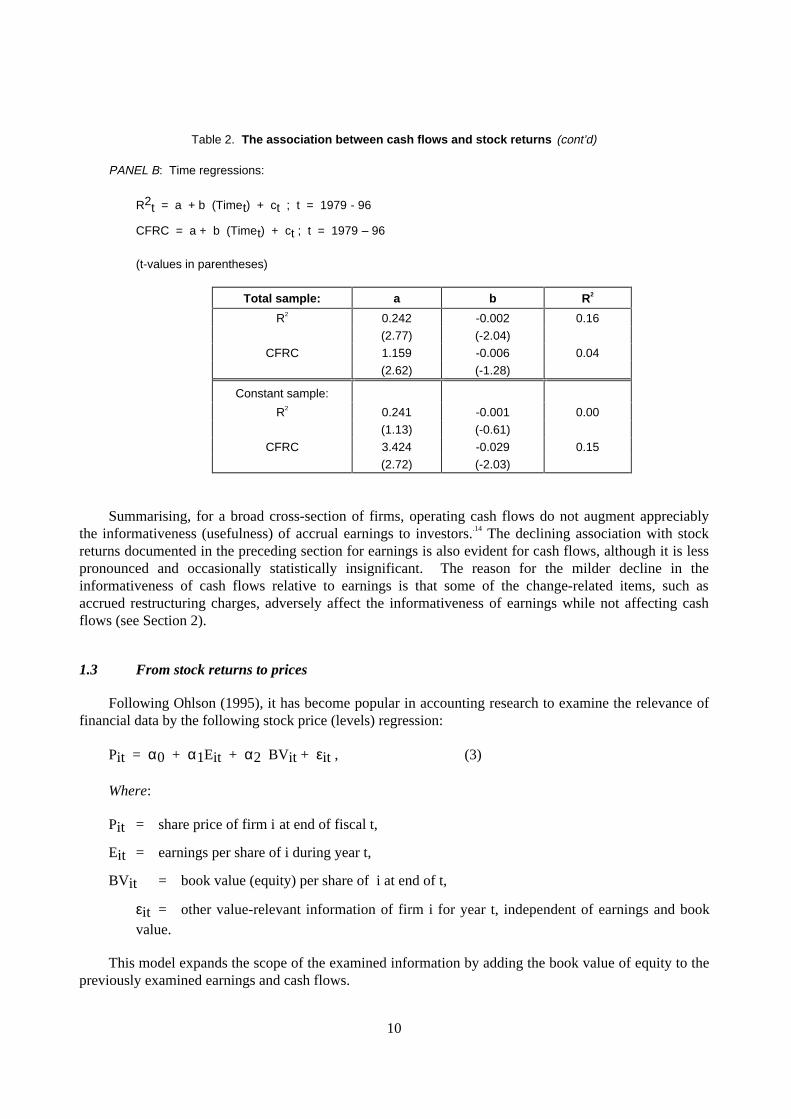
Table 2. The association between cash flows and stock returns (cont’d)
PANEL B: Time regressions:
R2t = a + b (Timet) + ct ; t = 1979 - 96
CFRC = a + b (Timet) + ct ; t = 1979 – 96
(t-values in parentheses)
Total sample: a b R2
R2 0.242 -0.002 0.16
(2.77) (-2.04)
CFRC 1.159 -0.006 0.04
(2.62) (-1.28)
Constant sample:
R2 0.241 -0.001 0.00
(1.13) (-0.61)
CFRC 3.424 -0.029 0.15
(2.72) (-2.03)
Summarising, for a broad cross-section of firms, operating cash flows do not augment appreciablythe informativeness (usefulness) of accrual earnings to investors..14 The declining association with stockreturns documented in the preceding section for earnings is also evident for cash flows, although it is lesspronounced and occasionally statistically insignificant. The reason for the milder decline in theinformativeness of cash flows relative to earnings is that some of the change-related items, such asaccrued restructuring charges, adversely affect the informativeness of earnings while not affecting cashflows (see Section 2).
1.3 From stock returns to prices
Following Ohlson (1995), it has become popular in accounting research to examine the relevance offinancial data by the following stock price (levels) regression:
Pit = α0 + α1Eit + α2 BVit + εit , (3)
Where:
Pit = share price of firm i at end of fiscal t,
Eit = earnings per share of i during year t,
BVit = book value (equity) per share of i at end of t,
εit = other value-relevant information of firm i for year t, independent of earnings and bookvalue.
This model expands the scope of the examined information by adding the book value of equity to thepreviously examined earnings and cash flows.
11
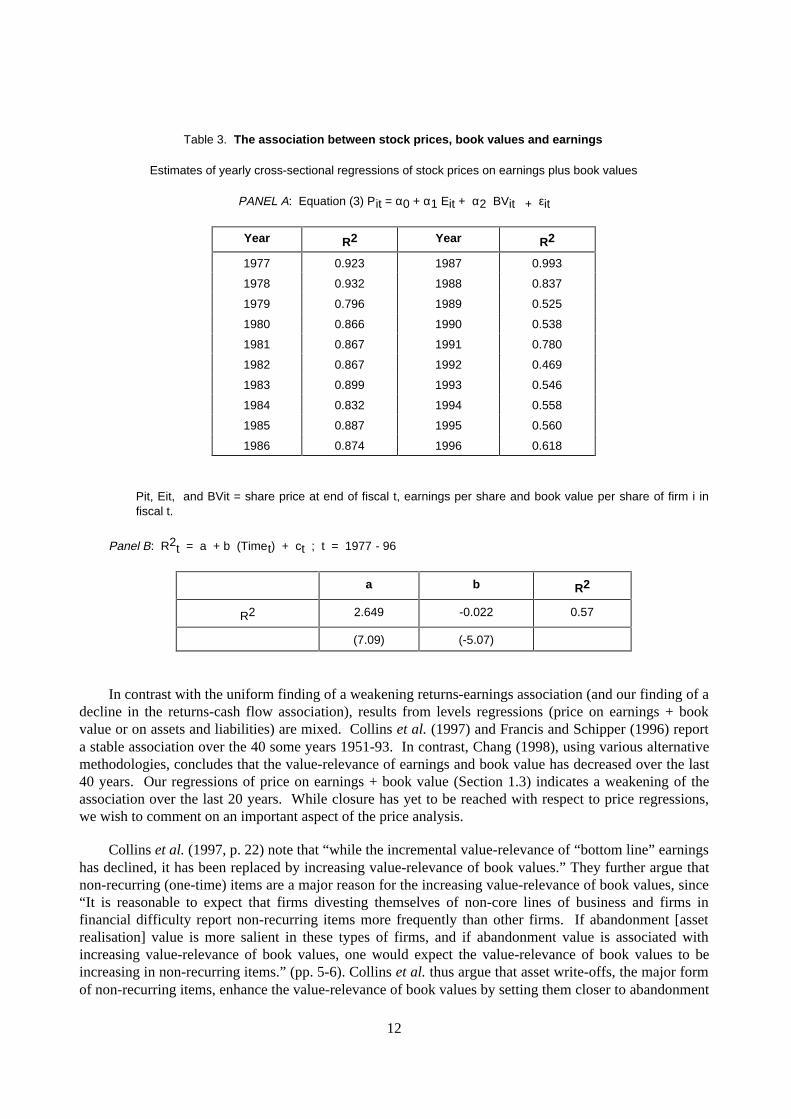
Estimates of regression (3) are presented in Table 3. It is evident that the association between stock
prices and earnings + book value, as measured by R2, decreased during 1977–96, from R2 levels of 0.90
in the late 1970s, to 0.80 in the 1980s and to 0.50 – 0.60 in the 1990s. A regression of the yearly R2s on aTime Variable (Panel B) indeed yields a negative and statistically significant Time coefficient (-0.022, t =-5.07). This finding of decreasing value-relevance of earnings + book value is consistent with ourprevious results derived from the returns-earnings and returns-cash flow relationships. We thus generaliseand conclude that the association between key financial statement variables and both stock returns andprices has been declining over the last 20 years.
Collins et al. (1997), estimating regression (3) over the 1953-93 period, have reached a differentconclusion: “We find that the combined value-relevance of earnings and book values has not declinedover the past 40 years and, in fact, appears to have increased slightly.” (p.2). The source of theinconsistency appears to lie in the length of the examined period. While Collins et al. examine 40 years,our focus is on the last 20 years. In an earlier version of their paper (March 1996), they report yearly
coefficient estimates and R2s of regression (3). We regressed their yearly R2s for the period 1977–93 on
Time and obtained a negative coefficient (-0.0030), indicating decreasing R2s. The coefficient, however,was statistically insignificant (t = -0.53). Our sample period extends Collins et al.’s by three years
(1994-96), each having a particularly low R2 (see Table 3). This may have contributed to the statisticalsignificance of our negative Time coefficient (Panel B, Table 3).15 Thus, while the association betweenstock prices and earnings + book value may have been stable over the last 40 years, our evidence indicatesthat it has decreased over the latter half of that period, which is the focus of our analysis.
1.4 Comparison with related research
The temporal association between capital market variables and financial data has recently receivedconsiderable attention (e.g. Collins et al., 1997; Francis and Schipper, 1996; Ely and Waymire, 1996;Ramesh and Thiagarajan, 1995; Chang, 1998). To achieve some closure, it is important to compare ourresults with those of others.
Ely and Waymire (1996) use a cross-sectional returns-earnings model similar to ours (1). They runthis regression for every year, 1927-93, on a randomly selected sample of 100 companies. A regression of
the highly volatile yearly estimated R2s on time yielded a negative but insignificant time coefficient.However, when a few extreme observations (earnings changes larger than three standard deviations from
the mean earnings change) were removed from the yearly returns-earnings regressions, the decline in R2
over the 75 years examined is statistically significant, and even more so for the recent period, 1951-93.This corroborates our result, based on a much larger sample, of a temporally decreasing returns-earningsassociation. Ely and Waymire also report for subperiods (their Table 2, Panel C) that the mean andmedian coefficients of the earnings variables (level and change) are the lowest in the 1974-93 periodrelative to previous periods (1927-73). Francis and Schipper (1996) also document a statistically
significant decrease in the returns-earnings R2 over the 1951-93 period. However, they report that adifferent approach to assessing usefulness of financial information -- trading on perfect advancedknowledge of earnings -- does not indicate a usefulness decrease. A temporal decrease in thereturns-earnings association is also documented by Chang (1998).
12
Table 3. The association between stock prices, book values and earnings
Estimates of yearly cross-sectional regressions of stock prices on earnings plus book values
PANEL A: Equation (3) Pit = α0 + α1 Eit + α2 BVit + εit
Year R2 Year R2
1977 0.923 1987 0.993
1978 0.932 1988 0.837
1979 0.796 1989 0.525
1980 0.866 1990 0.538
1981 0.867 1991 0.780
1982 0.867 1992 0.469
1983 0.899 1993 0.546
1984 0.832 1994 0.558
1985 0.887 1995 0.560
1986 0.874 1996 0.618
Pit, Eit, and BVit = share price at end of fiscal t, earnings per share and book value per share of firm i infiscal t.
Panel B: R2t = a + b (Timet) + ct ; t = 1977 - 96
a b R2
R2 2.649 -0.022 0.57
(7.09) (-5.07)
In contrast with the uniform finding of a weakening returns-earnings association (and our finding of adecline in the returns-cash flow association), results from levels regressions (price on earnings + bookvalue or on assets and liabilities) are mixed. Collins et al. (1997) and Francis and Schipper (1996) reporta stable association over the 40 some years 1951-93. In contrast, Chang (1998), using various alternativemethodologies, concludes that the value-relevance of earnings and book value has decreased over the last40 years. Our regressions of price on earnings + book value (Section 1.3) indicates a weakening of theassociation over the last 20 years. While closure has yet to be reached with respect to price regressions,we wish to comment on an important aspect of the price analysis.
Collins et al. (1997, p. 22) note that “while the incremental value-relevance of “bottom line” earningshas declined, it has been replaced by increasing value-relevance of book values.” They further argue thatnon-recurring (one-time) items are a major reason for the increasing value-relevance of book values, since“It is reasonable to expect that firms divesting themselves of non-core lines of business and firms infinancial difficulty report non-recurring items more frequently than other firms. If abandonment [assetrealisation] value is more salient in these types of firms, and if abandonment value is associated withincreasing value-relevance of book values, one would expect the value-relevance of book values to beincreasing in non-recurring items.” (pp. 5-6). Collins et al. thus argue that asset write-offs, the major formof non-recurring items, enhance the value-relevance of book values by setting them closer to abandonment
13
values and consequently to market values. We agree with the chain of events, yet question whether thisimplies an increase in the value-relevance of book values as providers of timely information. Thefollowing example demonstrates our argument.
The regional telephone companies (Baby Bells) have gone through a gradual deregulation since thelate 1980s, starting with state deregulations and culminating in the 1996 Federal Telecommunications Act.The old regulatory framework, based on assuring utilities a “fair return on assets” and thereby securing thevalues of these assets, was discarded in favour of incentive-based pricing mechanisms and the opening upof local markets to competition. Such a far-reaching deregulation obviously decreased the asset values ofthe capital-intensive phone companies. Investors recognised the impairment of asset values as thederegulation unfolded, so that when six of the seven regional phone companies and GTE Corp. belatedlywrote off $26 billion of assets during 1993-95, the market reaction to these massive non-recurring itemswas relatively mild.16 Following Collins et al., it is reasonable that the $26 billion asset write-offs broughtthe post-deregulation book values of assets of the regional phone companies closer to abandonment valuesand thereby to market values. But did the write-offs enhance the value-relevance of book values in thesense that they provided the information used by investors in revising the market values of the deregulatedphone companies? Of course not. The value-revision by investors was triggered by information onderegulation, while the asset write-offs trailed that information by years. This example demonstrates thatvalue-relevance, in the sense of timeliness of information release, cannot be inferred from stock price(levels) regressions.
Summarising, the collective evidence clearly indicates a temporally weakening returns-earnings andreturns-cash flow associations, while the evidence from levels regressions regarding changes in theassociation between prices and book values + earnings is still mixed.
2. Business change and the deterioration of usefulness
The accounting measurement and reporting system does not cope well with change. Be it driven bycompetition, deregulation or innovation, change profoundly affects the operations of business enterprisesand their market values, yet such effects are either ignored by the accounting system or reflected in abiased and delayed manner. We contend that the increasing rate of change experienced by businessenterprises, coupled with the ineffectiveness of the accounting system in reflecting the consequences ofchange, are major reasons for the documented decline in the usefulness of financial information.Empirical support for this contention is provided below.
2.1 The increasing rate of business change
It is widely believed that the rate of change of business enterprises has picked up considerably duringthe last 15-20 years. When polled, executives, investors and policy makers generally describe thebusiness environment as changing in an ever increasing rate. For example:
“Virtually all of the business leaders interviewed say that change within their own companieshas increased over the past two to three years. Only 3 per cent say that in one year theircompany will have remained the same with no significant changes. Such change is being drivenby both external and internal factors. A new world economic order that is ushering in a broadercompetitive playing field is driving change from outside the company walls. But there is alsomajor renovation happening within the company structure.” (Deloitte & Touche, 1995).
Empirical support for this view is, however, sparse.
14
To examine the pattern of business change, we used our sample of public companies derived from theIndustrial and Research COMPUSTAT files and the CRSP database, roughly 4 000 to 6 500 publiccompanies per year. For each year, we ranked the sample companies by the following accounting andmarket indicators of value:
− book (balance sheet) value of equity at fiscal year-end;
− market value of equity at year-end (i.e. number of outstanding common shares timesshare price).
We then classified the sample firms for each year and value indicator into ten portfolios of equal size(e.g. the first book value portfolio in 1978 includes the 10 per cent of sample firms with the largest bookvalues, while the tenth portfolio includes the 10 per cent of the sample firms with the lowest book valuesin 1978).
We measure the rate of business change by the frequency and magnitude of portfolio switches,namely firms moving over time from one value portfolio to another. Specifically, for each firm and yearwe measure the “absolute rank change,” reflecting the movement across portfolios experienced by thefirm from the previous to the current year. For example, a firm which was in 1977 in book valueportfolio 1 and shifted in 1978 to portfolio 4, is assigned a rank change measure of three. We thencompute for each year and value indicator the “mean absolute value of rank change,” reflecting theaggregate portfolio switches experienced by all the sample firms in that year.17 Thus, when the portfoliomembership of firms, classified by market or book values, is stable over time, our change measure will below (zero at the limit), whereas when firms bounce a lot from year to year across portfolios, our changemeasure will be high. We allow the number of firms to change over the sample period (due to new firmsbecoming public or existing ones merging or going bankrupt). This approach to measuring the rate ofbusiness change bears similarity to Stigler’s suggestion for estimating optimal firm size by observingshifts in the size distribution of firms in an industry over time (Stigler 1966, pp. 159-160). If a specificsize is optimal (yielding maximum economies of scale), one should observe a convergence over time tothat size. Our approach is also similar in nature to the use of Markov Chains transition matrices to studymobility issues (e.g. Kemeny and Snell, 1967, pp. 191-200).
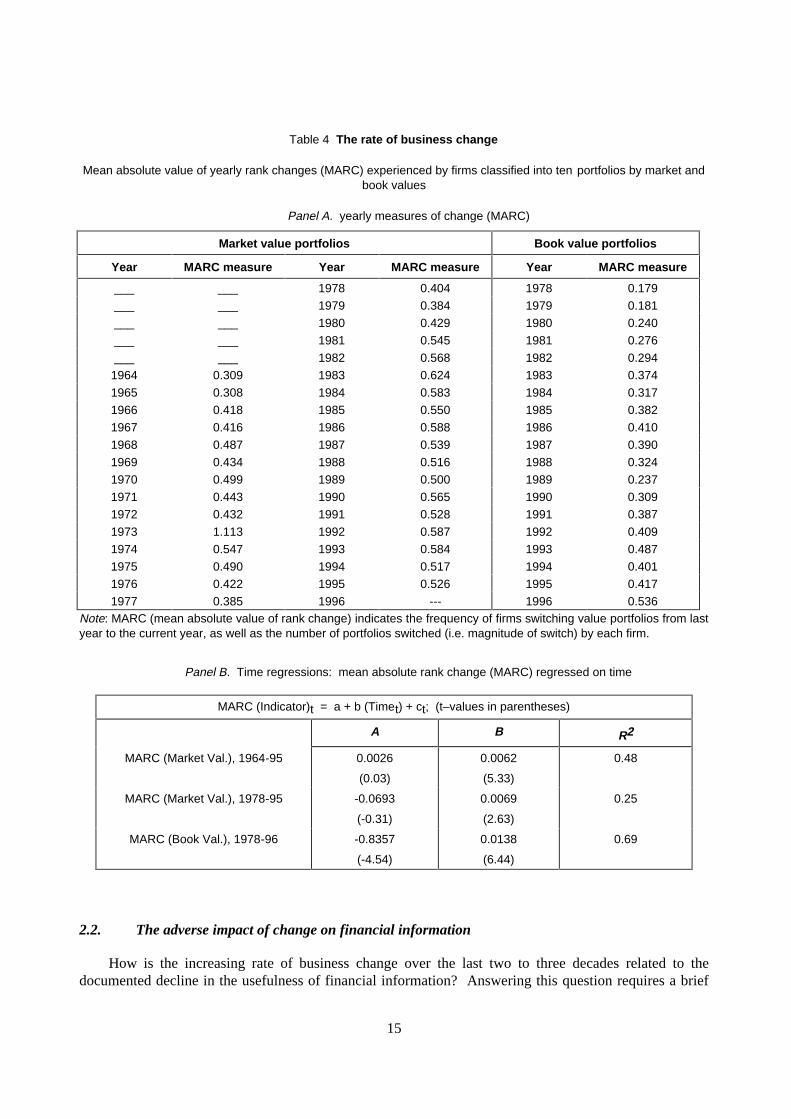
Table 4 presents the yearly “mean absolute value of rank change” measures for the samplecompanies. For market value rankings we used the CRSP database which reports stock prices for theperiod 1963-95. For the book value rankings we used COMPUSTAT, which provides data for 1977-96.It is evident from Panel A that the rate of business change, as measured by the frequency of firmsswitching across portfolio rankings, has increased over the last 20-30 years. The yearly “rank change”measures for both the market and book value indicators are generally increasing over time. For marketvalue ranking, the change measures increased from 0.300-0.400 in the 1960s to 0.500-0.600 in the 1990s.For book value rankings, the change measures increase almost monotonically, from 0.200-0.300 in the late1970s and early 1980s to 0.400-0.500 in the 1990s. These increases are statistically significant asevidenced by the t-values of the three slope coefficients of the Time regressions in Panel B. We thuscorroborate empirically the casual observation of executives and investors concerning the increasing rateof change experienced by business enterprises.
15
Table 4 The rate of business change
Mean absolute value of yearly rank changes (MARC) experienced by firms classified into ten portfolios by market andbook values
Panel A. yearly measures of change (MARC)
Market value portfolios Book value portfolios
Year MARC measure Year MARC measure Year MARC measure
___ ___ 1978 0.404 1978 0.179
___ ___ 1979 0.384 1979 0.181
___ ___ 1980 0.429 1980 0.240
___ ___ 1981 0.545 1981 0.276
___ ___ 1982 0.568 1982 0.294
1964 0.309 1983 0.624 1983 0.374
1965 0.308 1984 0.583 1984 0.317
1966 0.418 1985 0.550 1985 0.382
1967 0.416 1986 0.588 1986 0.410
1968 0.487 1987 0.539 1987 0.390
1969 0.434 1988 0.516 1988 0.324
1970 0.499 1989 0.500 1989 0.237
1971 0.443 1990 0.565 1990 0.309
1972 0.432 1991 0.528 1991 0.387
1973 1.113 1992 0.587 1992 0.409
1974 0.547 1993 0.584 1993 0.487
1975 0.490 1994 0.517 1994 0.401
1976 0.422 1995 0.526 1995 0.417
1977 0.385 1996 --- 1996 0.536Note: MARC (mean absolute value of rank change) indicates the frequency of firms switching value portfolios from lastyear to the current year, as well as the number of portfolios switched (i.e. magnitude of switch) by each firm.
Panel B. Time regressions: mean absolute rank change (MARC) regressed on time
MARC (Indicator)t = a + b (Timet) + ct; (t–values in parentheses)
A B R2
MARC (Market Val.), 1964-95 0.0026
(0.03)
0.0062
(5.33)
0.48
MARC (Market Val.), 1978-95 -0.0693
(-0.31)
0.0069
(2.63)
0.25
MARC (Book Val.), 1978-96 -0.8357
(-4.54)
0.0138
(6.44)
0.69
2.2. The adverse impact of change on financial information
How is the increasing rate of business change over the last two to three decades related to thedocumented decline in the usefulness of financial information? Answering this question requires a brief
16
examination of the accounting treatment of change and its consequences. The accounting system isprimarily based on the recording and reporting of discrete, transaction-based events, such as sales,purchases, investments and cash receipts and disbursements.18 In contrast, the impact of change onbusiness enterprises is rarely triggered by specific transactions and is often continuous rather thandiscrete, affecting enterprise value long before explicit revenue or expense events warrant an accountingrecord. Consider once more the deregulation of the regional phone companies, discussed in Section 1.4(the deregulation of electrical utilities followed shortly that of the phone companies). Naturally, suchfar-reaching deregulation (from the secure “rate base” system to the competitive incentive-basedregulation) profoundly affected the prospects, risks and asset values of telephone and electrical utilitiesand consequently their market values, yet the impact of deregulation on accounting recordable events hasbeen minor for years. The reasons are that the regional phone companies are deeply entrenched,regulators are slow moving and legal battles delay the inevitable -- an opening up of telecommunicationsand energy markets. Thus, while capital markets reflected in the early 1990s the diminished prospects andhigher risk of the deregulated companies, the financial reports of those phone companies reflected onlyminimal revenue and expense consequences of deregulation.19 Not surprisingly, as shown below, thestatistical association between stock returns of the regional phone companies and their reported earningsdeclined in the 1990s.
We ran for the regional phone companies the returns-earnings regression (1) for two periods: thepre-deregulation period, 1984-89, and the deregulation period, 1990-96. The regressions are pooled
time-series and cross-section, with fixed effects for both time (year) and firms. The estimated R2s are:
0.93 for the pre-deregulation period vs. 0.72 for the deregulation period (these R2s are very high becauseof the fixed effects). The estimated combined slope coefficients (ERCs) are: 1.85 for thepre-deregulation period vs. 0.68 for the deregulation period. The former combined slope coefficient (1.85)is significantly different from zero at the 0.02 level, while the latter coefficient (0.68) is insignificantlydifferent from zero. Earnings of telephone companies have clearly become less useful to investors due tothe significant change ushered in by deregulation and the accounting system’s delayed reaction to thederegulation.
In addition to deregulation, change is also driven by increased competition and innovation (frominside and outside the firm). In contrast with the delayed reaction of the accounting system toderegulation described above, in the cases of change driven by competition and innovation the accountingsystem frontloads the costs and postpones the recognition of benefits. For example, competitive pressuresled businesses during the last two decades to profoundly restructure their operations, resulting in massiveasset write-offs and other restructuring charges (e.g. for employee layoffs or production reengineering).These change-related costs were immediately expensed, while the benefits of restructuring, in the form ofenhanced market share and lower production costs, followed over long periods of time. Consequently, thereported financial information fully reflected the cost of restructuring but not its benefits, and weretherefore largely disconnected from market values which reflect the expected benefits along with thecosts, as evident by the frequent positive reaction to restructuring announcements.20 Similarly, productand process innovation, generally ushered in by research and development, constantly changes firms’products and production processes. However, the accounting treatment of investment in innovation -- theimmediate expensing of intangible assets -- is both biased and inconsistent.21 Costs of innovation arerecognised up front, while benefits are recorded in subsequent periods. To complicate things further, theaccounting for intangibles is beset by inconsistencies. For example, software developed for internal use isexpensed, while if similar software was acquired from a vendor it will be capitalised; completedtechnology included in a corporate acquisition is capitalised, while acquired technology-in-process isexpensed (Deng and Lev, 1998).
17
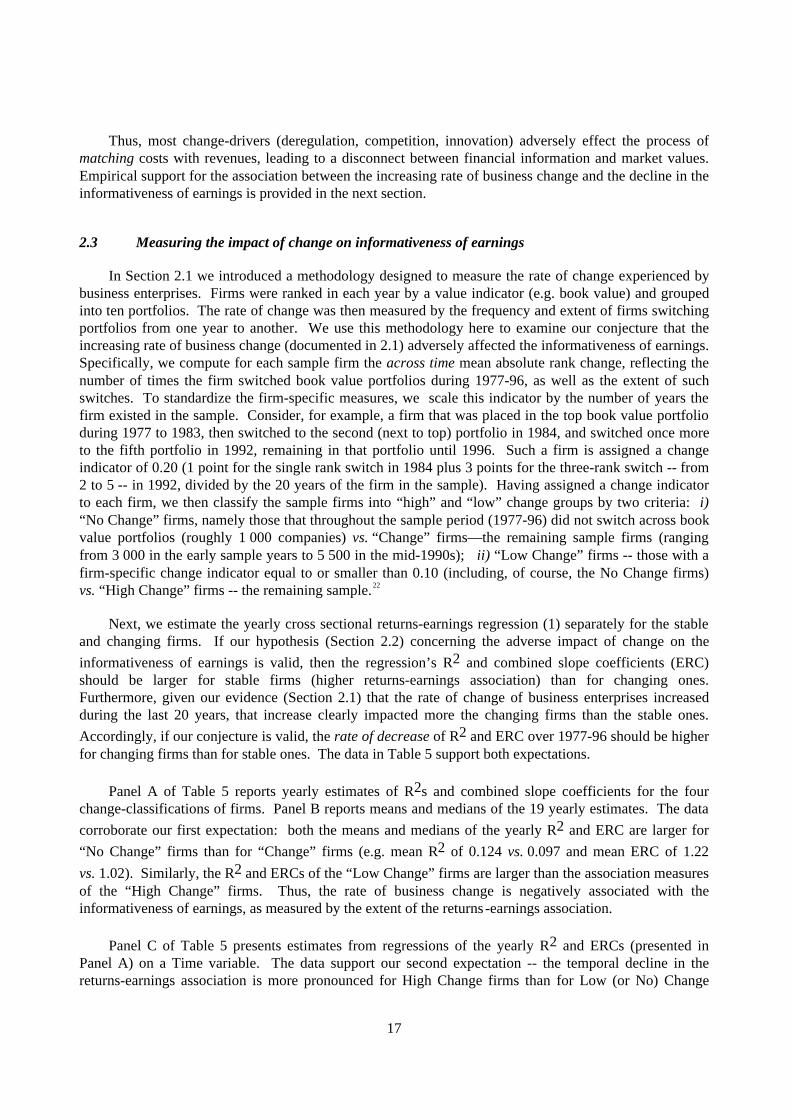
Thus, most change-drivers (deregulation, competition, innovation) adversely effect the process ofmatching costs with revenues, leading to a disconnect between financial information and market values.Empirical support for the association between the increasing rate of business change and the decline in theinformativeness of earnings is provided in the next section.
2.3 Measuring the impact of change on informativeness of earnings
In Section 2.1 we introduced a methodology designed to measure the rate of change experienced bybusiness enterprises. Firms were ranked in each year by a value indicator (e.g. book value) and groupedinto ten portfolios. The rate of change was then measured by the frequency and extent of firms switchingportfolios from one year to another. We use this methodology here to examine our conjecture that theincreasing rate of business change (documented in 2.1) adversely affected the informativeness of earnings.Specifically, we compute for each sample firm the across time mean absolute rank change, reflecting thenumber of times the firm switched book value portfolios during 1977-96, as well as the extent of suchswitches. To standardize the firm-specific measures, we scale this indicator by the number of years thefirm existed in the sample. Consider, for example, a firm that was placed in the top book value portfolioduring 1977 to 1983, then switched to the second (next to top) portfolio in 1984, and switched once moreto the fifth portfolio in 1992, remaining in that portfolio until 1996. Such a firm is assigned a changeindicator of 0.20 (1 point for the single rank switch in 1984 plus 3 points for the three-rank switch -- from2 to 5 -- in 1992, divided by the 20 years of the firm in the sample). Having assigned a change indicatorto each firm, we then classify the sample firms into “high” and “low” change groups by two criteria: i)“No Change” firms, namely those that throughout the sample period (1977-96) did not switch across bookvalue portfolios (roughly 1 000 companies) vs. “Change” firms—the remaining sample firms (rangingfrom 3 000 in the early sample years to 5 500 in the mid-1990s); ii) “Low Change” firms -- those with afirm-specific change indicator equal to or smaller than 0.10 (including, of course, the No Change firms)vs. “High Change” firms -- the remaining sample.22
Next, we estimate the yearly cross sectional returns-earnings regression (1) separately for the stableand changing firms. If our hypothesis (Section 2.2) concerning the adverse impact of change on the
informativeness of earnings is valid, then the regression’s R2 and combined slope coefficients (ERC)should be larger for stable firms (higher returns-earnings association) than for changing ones.Furthermore, given our evidence (Section 2.1) that the rate of change of business enterprises increasedduring the last 20 years, that increase clearly impacted more the changing firms than the stable ones.
Accordingly, if our conjecture is valid, the rate of decrease of R2 and ERC over 1977-96 should be higherfor changing firms than for stable ones. The data in Table 5 support both expectations.
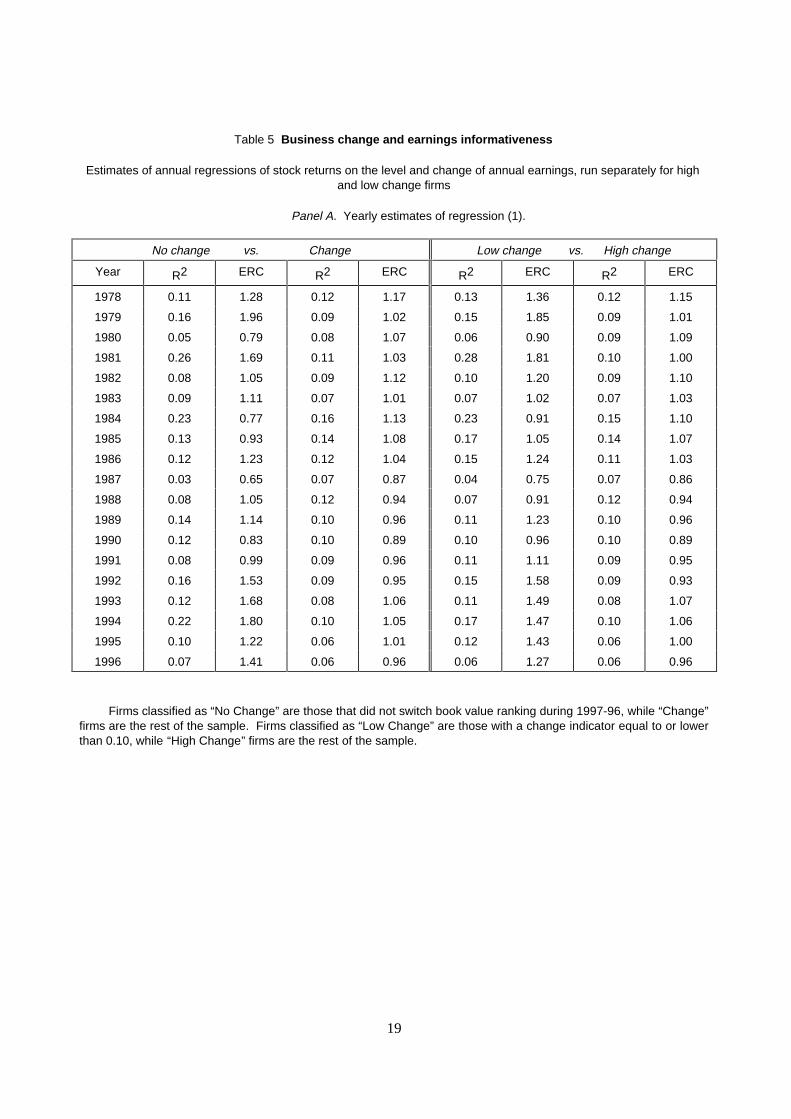
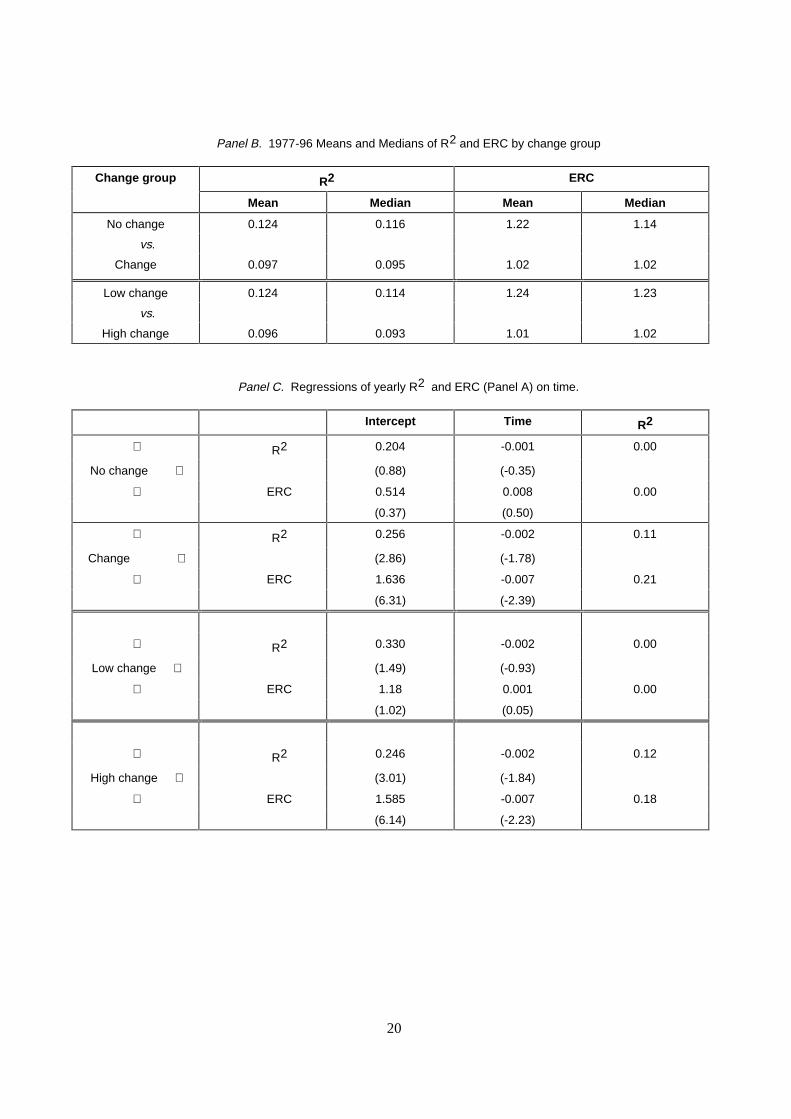
Panel A of Table 5 reports yearly estimates of R2s and combined slope coefficients for the fourchange-classifications of firms. Panel B reports means and medians of the 19 yearly estimates. The data
corroborate our first expectation: both the means and medians of the yearly R2 and ERC are larger for
“No Change” firms than for “Change” firms (e.g. mean R2 of 0.124 vs. 0.097 and mean ERC of 1.22
vs. 1.02). Similarly, the R2 and ERCs of the “Low Change” firms are larger than the association measuresof the “High Change” firms. Thus, the rate of business change is negatively associated with theinformativeness of earnings, as measured by the extent of the returns-earnings association.
Panel C of Table 5 presents estimates from regressions of the yearly R2 and ERCs (presented inPanel A) on a Time variable. The data support our second expectation -- the temporal decline in thereturns-earnings association is more pronounced for High Change firms than for Low (or No) Change
18
ones. The four coefficients of Time in the R2 and ERC regressions for both the No Change and the Low
Change groups are not statistically significant, and the R2 of those four regressions equal zero, indicatingessentially no change over time in the returns-earnings association for stable companies. In contrast, thefour Time coefficients of both the Change and High Change groups are all negative and statistically
significant, and the four R2s of these Time regressions range between 0.11–0.21, indicating that forchanging firms the association between returns and earnings has declined over the last 20 years.
Summarising, we hypothesised in Section (2.2) that the documented decrease in the informativenessof financial information over the last 20 years (Section 1) is at least partially due to the ineffectiveness ofthe accounting system to reflect the consequences of business change in a timely and meaningful manner.We validated this hypothesis by presenting evidence that: i) the rate of change experienced by businessenterprises increased over the 1977-96 period; and ii) the informativeness of earnings is negativelyrelated to the rate of business change.
19
Table 5 Business change and earnings informativeness
Estimates of annual regressions of stock returns on the level and change of annual earnings, run separately for highand low change firms
Panel A. Yearly estimates of regression (1).
No change vs. Change Low change vs. High change
Year R2 ERC R2 ERC R2 ERC R2 ERC
1978 0.11 1.28 0.12 1.17 0.13 1.36 0.12 1.15
1979 0.16 1.96 0.09 1.02 0.15 1.85 0.09 1.01
1980 0.05 0.79 0.08 1.07 0.06 0.90 0.09 1.09
1981 0.26 1.69 0.11 1.03 0.28 1.81 0.10 1.00
1982 0.08 1.05 0.09 1.12 0.10 1.20 0.09 1.10
1983 0.09 1.11 0.07 1.01 0.07 1.02 0.07 1.03
1984 0.23 0.77 0.16 1.13 0.23 0.91 0.15 1.10
1985 0.13 0.93 0.14 1.08 0.17 1.05 0.14 1.07
1986 0.12 1.23 0.12 1.04 0.15 1.24 0.11 1.03
1987 0.03 0.65 0.07 0.87 0.04 0.75 0.07 0.86
1988 0.08 1.05 0.12 0.94 0.07 0.91 0.12 0.94
1989 0.14 1.14 0.10 0.96 0.11 1.23 0.10 0.96
1990 0.12 0.83 0.10 0.89 0.10 0.96 0.10 0.89
1991 0.08 0.99 0.09 0.96 0.11 1.11 0.09 0.95
1992 0.16 1.53 0.09 0.95 0.15 1.58 0.09 0.93
1993 0.12 1.68 0.08 1.06 0.11 1.49 0.08 1.07
1994 0.22 1.80 0.10 1.05 0.17 1.47 0.10 1.06
1995 0.10 1.22 0.06 1.01 0.12 1.43 0.06 1.00
1996 0.07 1.41 0.06 0.96 0.06 1.27 0.06 0.96
Firms classified as “No Change” are those that did not switch book value ranking during 1997-96, while “Change”firms are the rest of the sample. Firms classified as “Low Change” are those with a change indicator equal to or lowerthan 0.10, while “High Change” firms are the rest of the sample.
20
Panel B. 1977-96 Means and Medians of R2 and ERC by change group
Change group R2 ERC
Mean Median Mean Median
No change 0.124 0.116 1.22 1.14
vs.
Change 0.097 0.095 1.02 1.02
Low change 0.124 0.114 1.24 1.23
vs.
High change 0.096 0.093 1.01 1.02
Panel C. Regressions of yearly R2 and ERC (Panel A) on time.
Intercept Time R2
R2 0.204 -0.001 0.00
No change (0.88) (-0.35)
ERC 0.514 0.008 0.00
(0.37) (0.50)
R2 0.256 -0.002 0.11
Change (2.86) (-1.78)
ERC 1.636 -0.007 0.21
(6.31) (-2.39)
R2 0.330 -0.002 0.00
Low change (1.49) (-0.93)
ERC 1.18 0.001 0.00
(1.02) (0.05)
R2 0.246 -0.002 0.12
High change (3.01) (-1.84)
ERC 1.585 -0.007 0.18
(6.14) (-2.23)
21
2.4 Change, negative earnings and non-recurring items
The role of negative earnings and non-recurring items (the two are, of course, related) in theinformativeness of financial data has recently attracted research attention. Thus, Hayn (1995) reports thatnegative earnings account for some of the observed decline in the slope coefficient of the returns-earningsregression (ERC), and Collins et al. (1997, p. 22) conclude: “…much of the shift in value-relevance fromearnings to book values can be explained by the increasing significance of one-time items, [and] theincreased frequency of negative earnings,…”
It is important to note that the two “culprits”-- reported losses and non-recurring items -- are oftenthe symptom rather than the cause of the decline in informativeness of financial information. We arguedabove that this decline is caused by business change which is not adequately reflected by the accountingsystem. It is that failure of the accounting system to reflect change that often manifests itself in reportedlosses and non-recurring items. For example, when firms restructure their operations they incur costs andexpect benefits. Financial reports immediately reflect the former -- resulting in heavy losses -- whilepostponing the latter, whereas investors consider both costs and benefits simultaneously. However, it isthe conservative accounting treatment of corporate restructuring that weakens the returns-earningsassociation, rather than the reported losses.
Cellular phone companies provide another case in point. Most cellular operators report chroniclosses and their financial data (for the period 1987-95) were found to be largely unrelated to stock pricesand returns (Amir and Lev, 1996). But the reported losses of cellular companies were not the cause of thedisconnect between accounting data and market variables. Rather, these losses were a consequence of adeficient accounting procedure expensing all of the heavy customer acquisition costs of cellularcompanies, despite the fact that customers stay with a cellular operator for three or four years on average(i.e. such costs are an investment). Here too, accounting’s failure to reflect change -- franchise growth ofcellular companies -- is the cause of relevance lost, not the reported losses. Similarly, the large losses andfrequent non-recurring items reported by acquiring companies writing off all the acquiredR&D-in-process are a manifestation of an inadequate accounting practice, since these losses obviously donot reflect any decline in firms’ operations (for elaboration, see Deng and Lev, 1998).23 Once more, it’snot the reported losses or non-recurring items that weaken the returns-earnings relation, rather the overlyconservative accounting procedures applied by firms. The difference is not semantic; it becomesimportant when one is concerned with improving the usefulness of financial information.
Given the recent research attention to reported losses, we examined the role of such losses in ourfindings (Section 2.3) concerning the association between the rate of business change and the decline inearnings’ informativeness. Specifically, we added to the Time regressions reported in Panel C of Table 5the yearly percentage of firms with negative EPS. The regressions are thus:
Estimated R2t (or ERCt) = a + b Timet + c (% Losses) + ε, t = 1978 - 1996 (4)
We ran these regressions for both the “Change” and “High Change” companies, which in Panel Chad a negative and statistically significant Time coefficient. Our estimates of regression (4) indicate that
in all four regressions (R2 and ERC for Change and High Change firms) the coefficients of percentagelosses [c in regression (4)] were statistically insignificant. Thus, the facts that the percentage of firmsreporting losses in our sample (as well as in previous research) increases over time, and that changingfirms have a higher frequency of reported losses than stable firms, do not alter our conclusion that firmscharacterised by a fast rate of change experience a decline in the informativeness of earnings.
22
3. Intangibles, innovation and change
Innovation, which is primarily achieved by investment in intangibles, such as R&D, informationtechnology, brands and franchises, and human resources, is a major change-driver.24 It is important tonote, however, that not all intangible investments trigger change; in fact, many such investments are justaimed at preserving the status quo. For example, applied research, defined as “spending aimed atlearning more about the technology process a firm is already using, or about a good that it is alreadyproducing” (Jovanovic and Nyarko, 1995, p. 5, emphasis ours), is generally aimed at securing thesurvival of the firm and sustaining its competitive position, rather than radically changing the firm’soperations. In contrast, basic research, defined as “spending directed towards processes not yet in use, orgoods not yet produced” (Jovanovic and Nyarko, 1995, p. 6, emphasis ours) is aimed at initiatingchange.25 The fact that certain R&D expenditures trigger change while others just preserve the status quosuggests that the level or intensity (intangibles’ spending relative to sales) of a firm’s investment in R&Ddoes not necessarily lead to a loss of informativeness of financial data.
From an accounting perspective, too, the level of R&D expenditures does not necessarily affect theinformativeness of earnings. Specifically, for firms in a steady state, where the rate of R&D spending isconstant over time, reported earnings are invariant to the accounting treatment of R&D -- expensing vs.capitalisation. Such firms may spend considerably on R&D or on other intangibles, yet the immediateexpensing of those intangibles will not detract from the informativeness (usefulness) of reported earnings.These observations, dealing with the nature of and the accounting for R&D have important implicationsfor studies (discussed below) relating intangibles-intensity or membership in a high-tech industry tochanges in the informativeness of earnings.
3.1 Intangibles-intensity and earnings’ informativeness
Several studies on temporal changes in the informativeness of financial information (e.g. Collins etal., 1997; Francis and Schipper, 1996) examined the association between the intensity of intangibles andthe R2 of the returns-on-earnings or the price on earnings + book value associations. The stated reasonwas to examine the widespread belief that the controversial accounting treatment of intangibleinvestments (immediate expensing, irrespective of the expected benefits of such investments) is a majorreason for the low or decreasing informativeness of financial information. The researchers, however,report that firms engaged in intangible investments were not characterised by a lower association betweenstock prices (or returns) and financial data. For example, Collins et al. (1997, p. 13) conclude: “… in oursample the overall explanatory power of earnings and book values [with respect to stock prices] is slightlyhigher for intangible-intensive firms than for non-intensive firms…. Contrary to assertions in thefinancial press, the proportion of firms operating in intangible-intensive industries does not reduce thecombined explanatory power of earnings and book values.”26
We argued above that the mere existence of intangible assets, indicated by a firm’s membership in ahigh-tech industry or by a high intensity of R&D, should not necessarily be associated with low or atemporal decline in the informativeness of financial information. For example, large, maturepharmaceutical companies (e.g. Merck, Ely Lilly, Baxter) are characterised by a relatively high yet stablerate of investment in R&D.27 In such a steady-state environment, immediate expensing of R&D will resultin earnings which are very close to those based on R&D capitalisation; hence no loss of informativenesscan be ascribed to R&D. However, when the investment rate in intangibles changes, the accounting
23
treatment of intangibles matters: reported earnings based on immediate expensing will differ considerablyfrom earnings based on capitalisation of intangibles.
Thus, it is the rate of change of intangible investment which adversely affects the informativeness offinancial information, rather than the mere existence of intangibles. We accordingly conjecture that theexpensing of intangibles (the current GAAP practice) by firms whose investment rate increases leads to adecline in the informativeness of reported earnings.
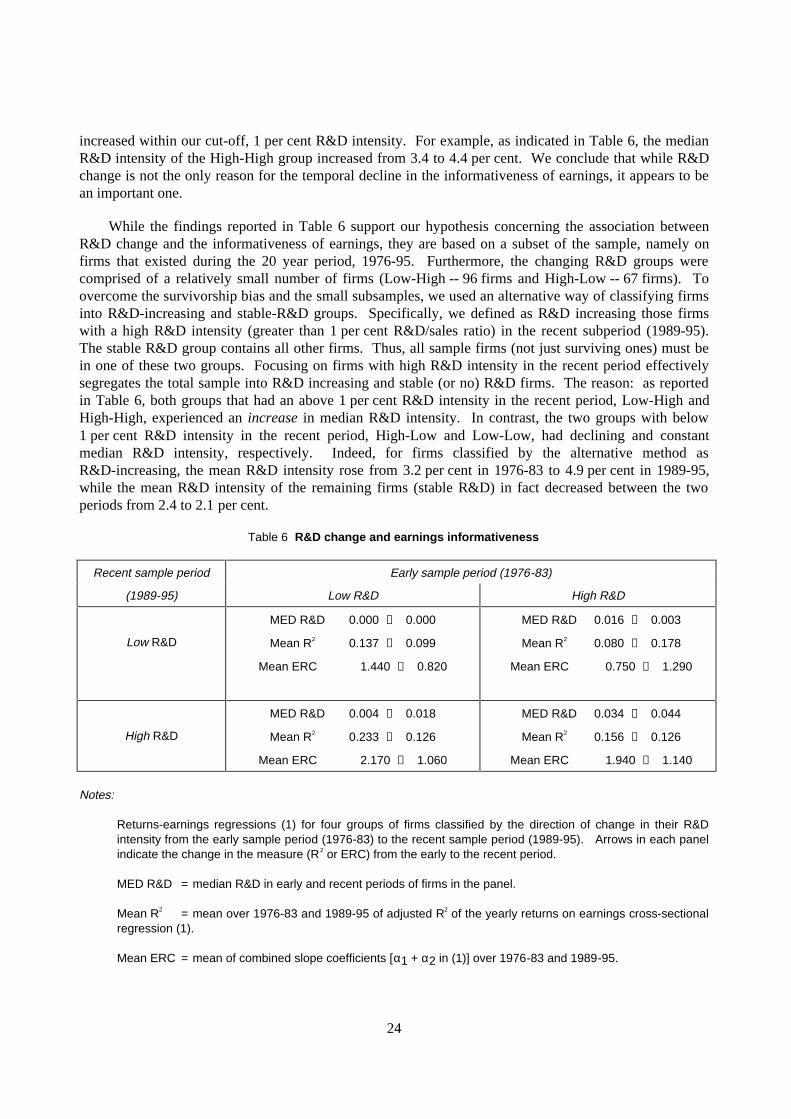
To examine this conjecture, we split our sample period, 1976-95, into three sub-periods, and computefor each sample firm the average R&D intensity (R&D to sales) in the “recent period” (1989-95) relativeto the average R&D intensity in the “early period” (1976-83). The sample firms were then classified bythe direction of change in R&D intensity into four categories: Low–Low, firms with R&D intensity of1 per cent or lower in both the early and recent periods; High-High, firms with R&D intensity exceeding1 per cent in both periods; Low-High, firms with R&D intensity below 1 per cent in the early period andabove 1 per cent in the recent period; and High-Low, the converse of Low-High.28 We then ran thecross-sectional returns on earnings (level and change) regression (1) for each of the four groups of firmsfor every year, 1976-96. We average the yearly regression estimates of R2 and the combined slopecoefficients (ERCs), over the early sample period (1976-83) and the recent period (1989-95) and reportthese average estimates in Table 6.
The main diagonal of Table 6 reports mean regression estimates for stable R&D companies:Low-Low and High-High. The mean R2s of both groups decreased from the early (1976-83) to the late(1989-95) period: from 0.137 to 0.099 for Low-Low and from 0.156 to 0.126 for High-High companies.These decreases in average R2s for both groups, however, are statistically insignificant. The averageERCs of the Low-Low and High-High groups also decreased between the two periods: from 1.44 to 0.820for Low-Low and from 1.94 to 1.14 for High-High. In contrast, the decreases in ERC of both groups arestatistically significant (t = -6.28 for Low-Low, and t = -3.45 for High-High). Note that in conformitywith others’ findings (e.g. Collins et al., 1997), the R2s and ERCs of the High-High companies -- intensivein R&D -- are larger than those of the Low-Low companies, indicating that high, yet stable R&D spendingis not a cause for a weak association between earnings and stock returns.
The lower-left panel of Table 6 presents regression estimates for companies whose R&D intensityincreased -- Low-High. As indicated in the table, the median R&D intensity of these companies increasedfrom 0.4 per cent during 1976-83 to 1.8 per cent in 1989-95 (a 4.5-fold increase). These firms
experienced a sharp decline over the sample period in the returns-earnings R2: from 0.233 to 0.126(a 46 per cent decrease, t-value of difference = -2.03), and an even steeper decline in ERC: from 2.17 to1.06 (51 per cent decrease, t-value of difference = - 2.29). In contrast, firms in the upper-right panel ofTable 6 (High-Low), whose R&D intensity decreased over time (from a median of 1.6 to 0.3 per cent),experienced a significant increase in the association between returns and earnings. Notably, this is the
only group in Table 6 which experienced R2 and ERC increases. The returns-earnings R2 of these firmsincreased from 0.080 to 0.178 (123 per cent, t-value of difference = 1.54), and the average ERC increasedfrom 0.75 to 1.29 (72 per cent, t-value of difference = 1.61).
Thus, while the informativeness of earnings of all the sample firms decreased during the last20 years, that of firms experiencing large changes in R&D intensity behaved differently. Consistent withour hypothesis, an increase in R&D intensity (Low-High) is associated with a steep decrease in earningsinformativeness, while a decrease in R&D intensity is associated with a rise in earnings informativeness.It should be noted that at least part of the weakening of the returns-earnings association of the stable firms(Low-Low and High-High) may also be related to R&D changes, as the R&D intensity of both groups
24
increased within our cut-off, 1 per cent R&D intensity. For example, as indicated in Table 6, the medianR&D intensity of the High-High group increased from 3.4 to 4.4 per cent. We conclude that while R&Dchange is not the only reason for the temporal decline in the informativeness of earnings, it appears to bean important one.
While the findings reported in Table 6 support our hypothesis concerning the association betweenR&D change and the informativeness of earnings, they are based on a subset of the sample, namely onfirms that existed during the 20 year period, 1976-95. Furthermore, the changing R&D groups werecomprised of a relatively small number of firms (Low-High -- 96 firms and High-Low -- 67 firms). Toovercome the survivorship bias and the small subsamples, we used an alternative way of classifying firmsinto R&D-increasing and stable-R&D groups. Specifically, we defined as R&D increasing those firmswith a high R&D intensity (greater than 1 per cent R&D/sales ratio) in the recent subperiod (1989-95).The stable R&D group contains all other firms. Thus, all sample firms (not just surviving ones) must bein one of these two groups. Focusing on firms with high R&D intensity in the recent period effectivelysegregates the total sample into R&D increasing and stable (or no) R&D firms. The reason: as reportedin Table 6, both groups that had an above 1 per cent R&D intensity in the recent period, Low-High andHigh-High, experienced an increase in median R&D intensity. In contrast, the two groups with below1 per cent R&D intensity in the recent period, High-Low and Low-Low, had declining and constantmedian R&D intensity, respectively. Indeed, for firms classified by the alternative method asR&D-increasing, the mean R&D intensity rose from 3.2 per cent in 1976-83 to 4.9 per cent in 1989-95,while the mean R&D intensity of the remaining firms (stable R&D) in fact decreased between the twoperiods from 2.4 to 2.1 per cent.
Table 6 R&D change and earnings informativeness
Recent sample period Early sample period (1976-83)
(1989-95) Low R&D High R&D
Low R&D
MED R&D 0.000 → 0.000
Mean R2 0.137 → 0.099
Mean ERC 1.440 → 0.820
MED R&D 0.016 → 0.003
Mean R2 0.080 → 0.178
Mean ERC 0.750 → 1.290
High R&D
MED R&D 0.004 → 0.018
Mean R2 0.233 → 0.126
Mean ERC 2.170 → 1.060
MED R&D 0.034 → 0.044
Mean R2 0.156 → 0.126
Mean ERC 1.940 → 1.140
Notes:
Returns-earnings regressions (1) for four groups of firms classified by the direction of change in their R&Dintensity from the early sample period (1976-83) to the recent sample period (1989-95). Arrows in each panelindicate the change in the measure (R2 or ERC) from the early to the recent period.
MED R&D = median R&D in early and recent periods of firms in the panel.
Mean R2 = mean over 1976-83 and 1989-95 of adjusted R2 of the yearly returns on earnings cross-sectionalregression (1).
Mean ERC = mean of combined slope coefficients [α1 + α2 in (1)] over 1976-83 and 1989-95.
25
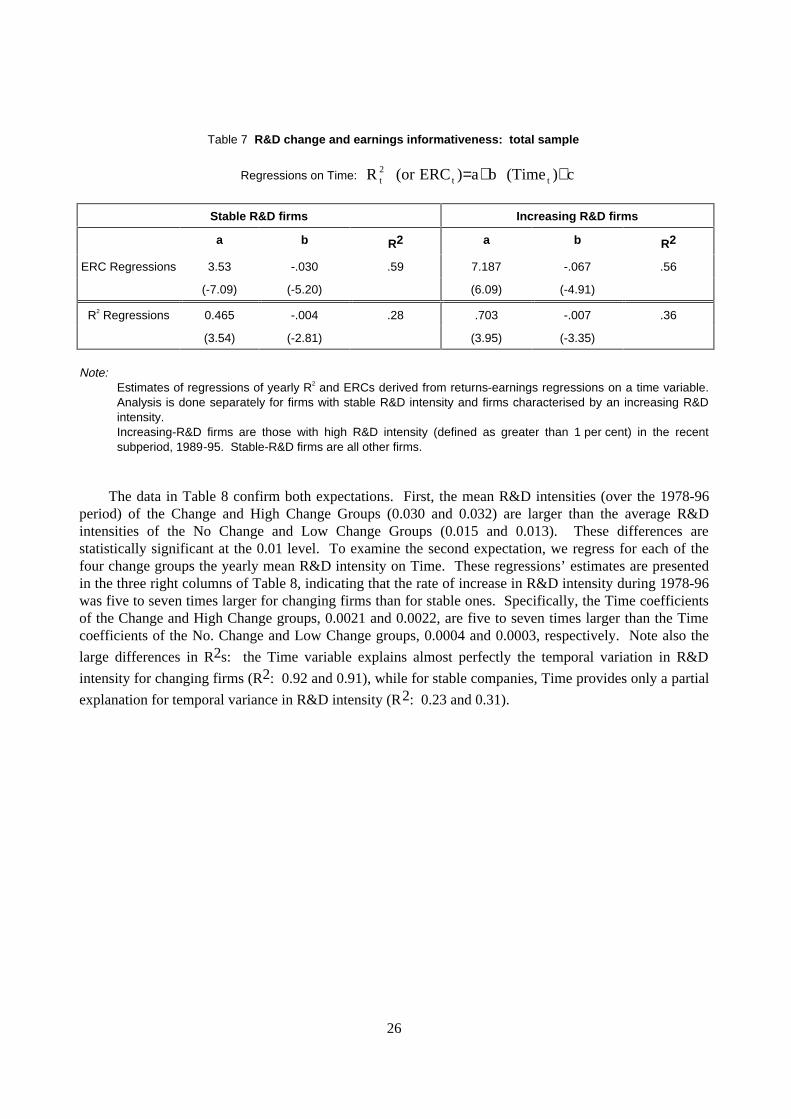
We ran the returns-earnings regressions (1) for each year (1976-95) separately for the
R&D-increasing and stable-R&D groups and derived the yearly R2s and combined slope coefficients. We
then regressed those yearly R2s and ERCs on Time and report the regression estimates in Table 7. It isevident that the estimated Time coefficients of the R&D-increasing group are substantially larger (inabsolute value) than the Time coefficient of the stable-R&D group: -0.067 vs. -0.030 for the ERC
regressions, and –0.007 vs. –0.004 for the R2 regressions.29 We accordingly conclude that the weakeningof the returns-earnings association is more pronounced for firms whose R&D intensity increased over thesample period than for stable-R&D companies. These results, while in the expected direction, aresomewhat weaker than those reported in Table 6. The reason: the segregation of firms intoR&D-increasing and R&D-decreasing companies in Table 6 was more effective in capturing R&D changethan in Table 7. For example, the mean R&D intensity of the Low-High firms in Table 6 (not reported)changed from 0.4 per cent in 1976-83 period to 3.1 per cent in 1989-95 (an eight-fold change), while themean R&D intensity of the R&D increasing firms in Table 7 only changed from 3.2 to 4.9 per cent duringthe corresponding periods.
3.2 Intangibles and business change
Our main thesis is that the increasing pace of business change coupled with the inadequacy of theaccounting system to reflect change is a major reason for the decline in the usefulness of financialinformation. Innovation, in the form of investment in intangibles, is a major change-driver, and as such acontributor to the decline in information usefulness. In the previous section (3.1), we validated this linkby providing evidence that an increasing (decreasing) rate of R&D intensity is associated with a decline(rise) in the informativeness of earnings. To complete the validation of our thesis and close the circle, wenow provide evidence on the association between the rate of business change and the change in intangibleinvestment. Specifically, we show that fast-changing firms experienced a larger increase in R&Dintensity than stable companies. We do this by classifying firms into No Change and Change groups, andalternatively into Low Change and High Change Groups, as was done in Section 2.3 and presented inTable 5. We then measure for each of the four groups and years (1977-96) the average R&D intensity.We expect: i) the average R&D intensity of changing firms to be higher than that of stable firms; and,more importantly; ii) the rate of increase in R&D intensity of changing firms to be higher than that ofstable companies.
26
Table 7 R&D change and earnings informativeness: total sample
Regressions on Time: c)Time(ba)ERCor(R tt2t ++=
Stable R&D firms Increasing R&D firms
a b R2 a b R2
ERC Regressions 3.53 -.030 .59 7.187 -.067 .56
(-7.09) (-5.20) (6.09) (-4.91)
R2 Regressions 0.465 -.004 .28 .703 -.007 .36
(3.54) (-2.81) (3.95) (-3.35)
Note:Estimates of regressions of yearly R2 and ERCs derived from returns-earnings regressions on a time variable.Analysis is done separately for firms with stable R&D intensity and firms characterised by an increasing R&Dintensity.Increasing-R&D firms are those with high R&D intensity (defined as greater than 1 per cent) in the recentsubperiod, 1989-95. Stable-R&D firms are all other firms.
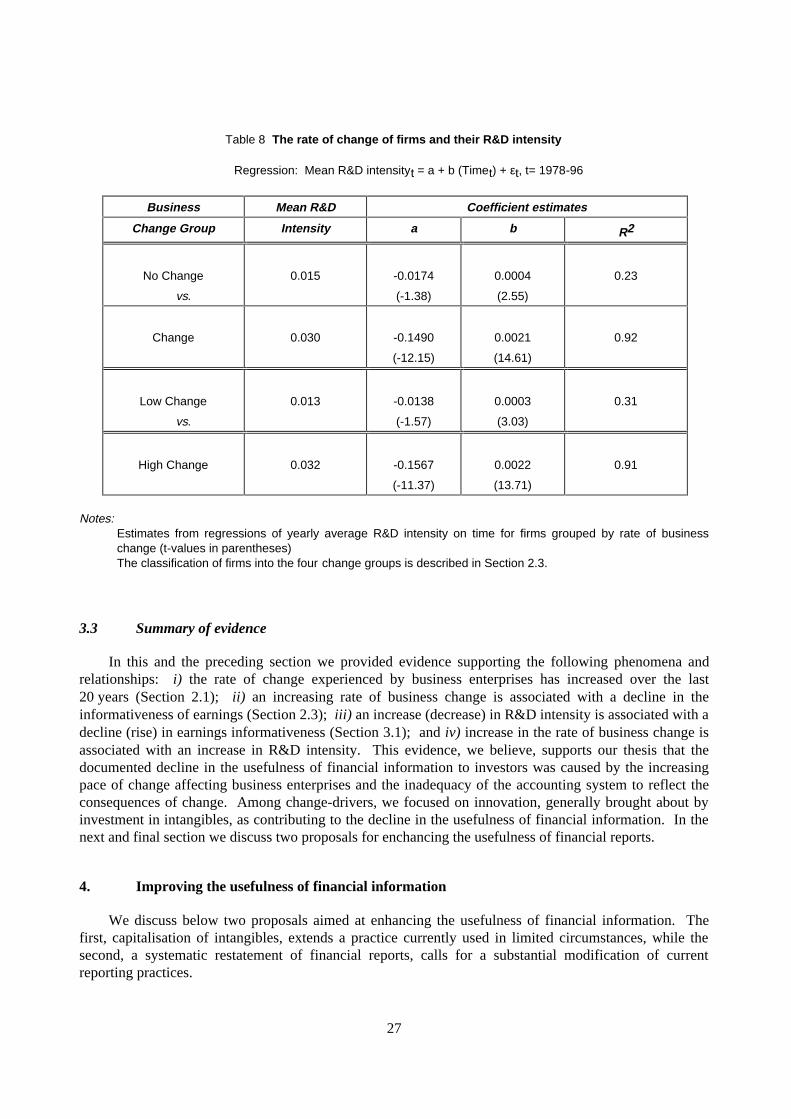
The data in Table 8 confirm both expectations. First, the mean R&D intensities (over the 1978-96period) of the Change and High Change Groups (0.030 and 0.032) are larger than the average R&Dintensities of the No Change and Low Change Groups (0.015 and 0.013). These differences arestatistically significant at the 0.01 level. To examine the second expectation, we regress for each of thefour change groups the yearly mean R&D intensity on Time. These regressions’ estimates are presentedin the three right columns of Table 8, indicating that the rate of increase in R&D intensity during 1978-96was five to seven times larger for changing firms than for stable ones. Specifically, the Time coefficientsof the Change and High Change groups, 0.0021 and 0.0022, are five to seven times larger than the Timecoefficients of the No. Change and Low Change groups, 0.0004 and 0.0003, respectively. Note also the
large differences in R2s: the Time variable explains almost perfectly the temporal variation in R&D
intensity for changing firms (R2: 0.92 and 0.91), while for stable companies, Time provides only a partial
explanation for temporal variance in R&D intensity (R2: 0.23 and 0.31).
27
Table 8 The rate of change of firms and their R&D intensity
Regression: Mean R&D intensityt = a + b (Timet) + εt, t= 1978-96
Business Mean R&D Coefficient estimates
Change Group Intensity a b R2
No Change
vs.
0.015 -0.0174
(-1.38)
0.0004
(2.55)
0.23
Change 0.030 -0.1490
(-12.15)
0.0021
(14.61)
0.92
Low Change
vs.
0.013 -0.0138
(-1.57)
0.0003
(3.03)
0.31
High Change 0.032 -0.1567
(-11.37)
0.0022
(13.71)
0.91
Notes:Estimates from regressions of yearly average R&D intensity on time for firms grouped by rate of businesschange (t-values in parentheses)The classification of firms into the four change groups is described in Section 2.3.
3.3 Summary of evidence
In this and the preceding section we provided evidence supporting the following phenomena andrelationships: i) the rate of change experienced by business enterprises has increased over the last20 years (Section 2.1); ii) an increasing rate of business change is associated with a decline in theinformativeness of earnings (Section 2.3); iii) an increase (decrease) in R&D intensity is associated with adecline (rise) in earnings informativeness (Section 3.1); and iv) increase in the rate of business change isassociated with an increase in R&D intensity. This evidence, we believe, supports our thesis that thedocumented decline in the usefulness of financial information to investors was caused by the increasingpace of change affecting business enterprises and the inadequacy of the accounting system to reflect theconsequences of change. Among change-drivers, we focused on innovation, generally brought about byinvestment in intangibles, as contributing to the decline in the usefulness of financial information. In thenext and final section we discuss two proposals for enchancing the usefulness of financial reports.
4. Improving the usefulness of financial information
We discuss below two proposals aimed at enhancing the usefulness of financial information. Thefirst, capitalisation of intangibles, extends a practice currently used in limited circumstances, while thesecond, a systematic restatement of financial reports, calls for a substantial modification of currentreporting practices.
28
4.1 The capitalisation of intangible investments
We believe that the almost universal expensing of intangible investments in the United States isinconsistent with the FASB’s conceptual framework, with recent theoretical developments in accounting,and contradicts empirical evidence. The conceptual framework defines an asset as:
“probable future economic benefit obtained or controlled by a particular entity as a result of pasttransactions or events (Para. 25). assets...may be intangible, and although not exchangeable theymay be usable by the entity in producing or distributing other goods or services (Para. 26).anything that is commonly used to produce goods or services, whether tangible or intangible andwhether or not it has a market price or is otherwise exchangeable, also has future economicbenefit” (Para. 173). (FASB, Concept No. 6, 1985).
Surely, the recognition of intangible investments with attributable future benefits as assets is withinthe boundaries of GAAP. Objections centre on the uncertainty associated with the benefits of intangibles:
“The uncertainty [e.g. about R&D] is not about the intent to increase future economic benefitsbut about whether and, if so, to what extent they succeeded (sic) in doing so.” (FASB, ConceptNo. 6, 1985, Para. 175).
However, little if any guidance is given by the Conceptual Framework regarding acceptable (for assetrecognition) vs. unacceptable levels of uncertainty. An operational approach to dealing with theuncertainty associated with intangibles was that taken by the FASB in SFAS No. 86 (softwarecapitalisation) and a similar one by the International Accounting Standards Committee (IASC 1997),whereby asset recognition (capitalisation) is conditioned on an objective feasibility test, such as theexistence of a working model for a software product or a successful clinical test for a drug. This approachfor dealing with intangibles’ uncertainty is reasonable, since estimating future benefits of atechnologically feasible software product or a clinically proven drug is not less reliable than estimatingthe future benefits of a new record or a movie whose capitalised costs are recognised as assets by currentaccounting practices (SFAS Nos. 50 and 53).30 Accordingly, we propose the capitalisation of allintangible investments with attributable benefits which have passed certain pre-specified technologicalfeasibility tests.
The proposed capitalisation of intangibles will eliminate disturbing inconsistencies in currentaccounting practices. For example, the R&D associated with software or other products intended forinternal use is expensed, while the cost of acquiring similar products from vendors is capitalised.31
Traditionally, this inconsistency is explained by arguing that prices of acquired products are the result ofarms-length market transactions, which is not the case for internally generated R&D.32 But a requirementfor a market transaction fails to explain the fast-growing practice of immediately expensing acquiredR&D-in-process (Deng and Lev, 1998), which is a result of an arms-length transaction. While the fairmarket value of acquired R&D-in-process is determined by management, so are the market values of allother acquired assets which pass the test of asset recognition.
The proposed capitalisation of intangibles appears consistent with recent empirical evidence andtheoretical developments in accounting. Specifically, it has been proposed (e.g. Dietrich et al., 1997) thatthe “residual earnings” valuation framework developed by Edwards-Bell-Ohlson (e.g. Ohlson, 1995) canbe used in the analysis of accounting principles. This valuation framework stipulates that the marketvalue of the firm equals its current book value plus the present value of residual earnings (e.g. reportedearnings minus a charge for equity capital). Accordingly, accounting measurement and reportingprinciples which improve the alignment of reported book value with the firm’s intrinsic value, and/or
29
improve the prediction of earnings should be preferred over standards which do not measure up to thesecriteria.
Empirical evidence supports the notion that the recognition of intangibles in financial reports mayachieve one or both of the above-stated criteria for a preferred accounting practice. For example, Lev andSougiannis (1996) report that capitalised values of R&D are significantly associated with stock prices,along with reported book values. This implies that R&D capitalisation will improve the alignment ofbook values with stock prices (intrinsic values). Similarly, Aboody and Lev (1998) found that reportedcapitalised values of software development costs are positively and significantly associated with marketvalues, after controlling for reported book values and earnings.33 This evidence too is consistent with thenotion that capitalised software improves the alignment of book values with intrinsic values (the latterproxied by the firm’s market value). Furthermore, Aboody and Lev report that the annual values ofsoftware capitalisation are associated with subsequent changes in earnings, suggesting that suchcapitalisations provide relevant information for the prediction of future earnings (the second desiredelement of a standard according to the residual earnings model).34 Amir and Lev’s (1996) study of cellular(wireless) companies indicates that investors consider customer acquisition costs incurred and expensedby these companies as an asset rather than an expense.35 This implies that the capitalisation of cellulars’customer acquisition costs will improve the alignment of book values with intrinsic value.
In the international arena, Abrahams and Sidhu (1997) report that capitalised R&D values onAustralian companies’ balance sheets are significantly associated with market values, and Barth andClinch (1997) report that revaluations of intangibles by Australian companies are also associated withmarket values. Such evidence is consistent with the argument that the valuation of certain intangibles willimprove the alignment of book values with intrinsic values.
We propose therefore the capitalisation of all intangible investments to which specific future benefitscan be attributed and for which it is probable, in management’s opinion, that the discounted value ofexpected benefits exceeds their cost in current dollars. Such capitalisation will generally apply to R&Dexpenditures, product development costs, investments aimed at brand development and customer-baseenhancement, and restructuring and reorganisation costs. The key capitalisation criterion is the ability toattribute and reasonably estimate the benefits of the intangibles. In contrast with SFAS No. 86 (softwarecapitalisation) and IASC’s exposure draft on intangibles (ISAC, 1997) we see no reason to exclude fromcapitalisation previously expensed costs. More on this issue in the next section.
As is the case with all assets, the amortisation of the capitalised intangibles will be based onmanagement’s estimates of productive lives, guided by industry norms and research findings.36 Theamortisation rates will be revised as the actual benefits of intangibles materialise. A strict annualimpairment test should be applied as a safeguard against overvaluation. Such a test, like the one mandatedfor tangible assets (SFAS No. 121), will be based on the present value of future benefits compared withthe capitalised book values.
How will the reporting deficiencies discussed in previous sections (particularly 2.2) be alleviated bythe proposed capitalisation of intangibles? First, such capitalisation will substantially improve theperiodic matching of costs and benefits (e.g. reorganisation costs will be charged against their futurebenefits, product-development expenditures matched with subsequent revenues, and customer-acquisitioncosts amortised against consequent sales), resulting in reported earnings which will more meaningfullyreflect enterprise performance. Second, the capitalised intangibles will be reported on corporate balancesheets, mitigating the current absurdity that the bricks and mortar of chemical, pharmaceutical,electronics, software, biotechnology and telecommunications companies are presented as assets, while theintangible investments of these companies which generate most of their revenues are nowhere to be found
30
in financial reports. Third, and most importantly, the capitalisation of intangibles is a crucial step inproviding investors data to evaluate the success of the firm’s innovative activities. The capitalised values,classified by homogeneous product/activity groups, coupled with a breakdown of the attributed revenuesand gross margins will enable investors to assess the rates of return on the firm’s investments in research,product development and brand enhancement. This important objective of disclosing cost values-- allowing for the assessment of return on investment -- is overlooked by those who object tocapitalisation because cost of intangibles is in their opinion unrelated to their current value(e.g. Stewart, 1996).
4.2 Restated financial reports
We hypothesise in this study that change and the inadequacy of the accounting system to reflect it ina timely and meaningful manner are mainly responsible for the deterioration in the usefulness of financialinformation. However, the consequences of change (e.g. the benefits of a corporate reorganisation or of asignificant drug development) are admittedly uncertain, and this uncertainty is often invoked to justify theimmediate expensing of most change-related investments. The difficulties of auditing the values of suchuncertain investments (e.g. ascertaining whether expected benefits exceed costs) and the litigationexposure associated with presenting intangibles’ values on balance sheets strengthen the case for theimmediate expensing of intangibles and other change-related investments. How can this change-induceduncertainty be dealt with in financial reports?
A continuous restatement of financial reports may provide a reasonable balance between toinvestors’ information needs and preparers’ concern with uncertainty. Consider, for example, SFASNo. 86 mandating the capitalisation of software development costs. Such capitalisation starts whentechnological feasibility is established, that is at the completion of the programnme design. However, allpreviously expensed development costs incurred during the research stage cannot be included in thecapitalisation. Similarly, the recent exposure draft on intangible assets of the International AccountingStandards Committee (IASC, 1997) calls for the capitalisation of some intangible investments, yet statesin Section 50: “Costs incurred to acquire or generate an intangible item that were initially recognised asan expense by the reporting enterprise should not be recognised as part of the cost of an intangible asset ata later date.”
What justifies the prohibition to recognise as assets previously expensed costs, after resolution ofmuch of the uncertainty concerning the product under development? Surely the capitalised value of theasset is considerably understated absent all the pre-technological feasibility costs. We could not find ajustification in SFAS No. 86 or in IASC, 1997 for the exclusion from capitalisation of previouslyexpensed R&D. Presumably such exclusion is justified by the matching principle: capitalisation in thecurrent period of previously expensed costs requires a recognition of a gain in current income which wasexpensed in previous periods.37
But there is no need to reverse past expenses in the current period, thereby mismatching costs withrevenues. An alternative procedure is to restate past financial statements, namely to adjust the reports ofthe last three to five years by capitalising the pre-feasibility expensed R&D. The main advantage of thisprocedure is that it will portray an improved pattern (e.g. growth) of earnings and book values, where theimprovement results from a better matching of costs with revenues in the previously published reports.Given evidence that the pattern of past earnings is relevant for the interpretation of current earnings(Barth, 1997), an improved reporting of past earnings is obviously desirable.
31
Our proposal for restated financial reports is not restricted to the case of pre-feasibility expensedR&D. We propose a generalised reporting system in which financial statements will be continuouslyrevised as uncertainty about major events is resolved. For example, when a pharmaceutical companyembarks on a significant drug development, all related R&D expenditures should be expensed, given thesignificant uncertainty prevailing at the early stage of drug development. However, if and when the drugsuccessfully passes human clinical tests -- a crucial feasibility hurdle -- cost capitalisation is warranted,given the substantial resolution of uncertainty. Capitalisation should include, of course, the past R&Dwhich was expensed, which will be achieved by a restatement of past reports. Thus, a systematicrestatement of past reports will reflect the continuous resolution of uncertainty which existed when suchreports were released. As with any major accounting overhaul, a set of standards will have to beestablished regarding the events that justify restatements, how far back should the restatement extend andmateriality standards for restatements. These technical issues are obviously beyond the currentdiscussion.
Concerning restatement of prior periods’ results, GAAP draws a sharp distinction between correctionof past errors (warranting a restatement) and changes in estimates, for which restatement is prohibited:
“Errors in financial statements result from mathematical mistakes, mistakes in the application ofaccounting principles, or oversight or misuse of facts that existed at the time the financialstatements were prepared. In contrast, a change in accounting estimates results from newinformation or subsequent developments and accordingly from better insight or improvedjudgement. Thus, an error is distinguishable from a change in estimate.” (SFAS No. 16, 1977,Para. 41).
The FASB, however, concedes that “Some respondents contend that the distinction between acorrection of error and a change in estimate is too vague to be a basis for different accounting.” (SFASNo. 16, Para. 42). We concur. When an R&D project passes a feasibility test, the capitalisation of theR&D expensed in the past appears to us as a legitimate correction of a mistake, given hindsight.Accordingly, our proposal for a systematic revision of financial reports seems compatible with the spiritof GAAP.
More importantly, the systematic revision of past reports is essential, given the contextual role offinancial information (Finger et al., 1996). Financial reports serve two objectives: the provision of newinformation to investors, as well as making available a rich mosaic of data (context) within which currentinformation is interpreted. Empirical evidence indicates that the effectiveness of financial information inmeeting the first objective, namely providing timely information, is declining (e.g. Kothari andSloan,1992). The weak association between earnings and stock returns (see Section 1.1) is also amanifestation of low timeliness of financial reports. The increasing frequency and intensity of managers’voluntary disclosures (e.g. conference calls with analysts, pre-earnings announcements) obviously erodesthe timeliness of financial reports. In contrast, the contextual role of financial reports remains animportant (yet largely unresearched) objective of accounting data, irrespective of the growth of otherinformation sources. Thus, for example, Lev et al., (1998) report that investors’ reaction to an FDA drugapproval depends, among other things, on the past operating success of the developing company.Similarly, the evidence presented above (Sections 1.1 and 1.2) that the returns-earnings R2s of firms withthe full 20-year history are larger than the R2s of firms with shorter historical record is also consistent witha contextual role of financial information. And the evidence in Petroni et al. (1997) that revisions ofreserve estimates of insurance companies extending back as far as ten years are significantly associatedwith investors’ reaction to current information is consistent with both the contextual role of financial dataand value-relevance of revisions of such data.
32
If historical financial data affect the interpretation of new signals, then a continuous improvement ofsuch data, in the form of a better matching of revenues with costs and the reporting of book values whichare better aligned with intrinsic values, will contribute to investors’ decisions. Such improvement ofcontextual data can be achieved by the proposed systematic restatement of past reports.
Summarising, the systematic restatement of past financial reports provides an operational response togenuine concerns about the considerable uncertainty associated with early-stage intangible investments.As such uncertainty is being resolved, past reports will be revised to reflect the capitalisation of thepreviously expensed costs. The major advantage of such revisions is the improvement brought about inthe quality of the contextual information used in the interpretation of current signals. How is therestatement proposed here related to the intangibles’ capitalisation proposed in the preceding section?Restatement may substitute for capitalisation in cases of considerable uncertainty (e.g. basic research).But restatement also complements and extends capitalisation of intangibles to events and decisions whoseuncertainty at inception is being resolved later on.
5. Postcript
We have documented in this study a surprising phenomenon: despite increasing investor demand forinformation (evident, for example, by the expansion of services like Bloomberg and the proliferation ofmanagers-analysts conference calls) and the persistent efforts of regulators (SEC, FASB) to improvecorporate reporting, the usefulness of financial information to investors has been declining over the past20 years. Such usefulness lost is manifested by a weakening association between capital market valuesand key financial variables -- earnings, cash flows and book values. We hypothesised and providedevidence that the increasing rate of business change and the inadequate accounting treatment of changeand its consequences play an important role in the decline of financial information usefulness.Furthermore, we identified innovation, brought about by investment in intangibles, as a majorchange-agent contributing to the decline in the value-relevance of financial information. It is in theintangibles domain that current financial reporting fails most seriously in reflecting enterpriseperformance and value.
What are the social consequences of the decline in the usefulness of financial information? This isstill an open question. If investors are able to supplement from other sources the information increasinglymissing from financial reports at no added cost, then the social consequences of the accounting usefulnessloss may not be serious, except for accountants. Preliminary evidence, however, is inconsistent with sucha smooth, costless information substitution. Thus, for example, Barth et al., (1997) report that the extentof mispricing of firms’ shares is related to their investment in intangibles. Aboody and Lev (1998) findthat gains to insiders in R&D-intensive companies are substantially larger than insider gains in firmswithout R&D. And Boone and Raman (1997) report that R&D intensity is associated with the size ofbid-ask spreads and price sensitivity. These findings suggest that the reporting inadequacies associatedwith intangible investments may adversely affect investors’ and firms’ welfare.
Given that the accounting measurement and reporting system proved by its longevity andsurvivability to be an efficient information source, it seems socially worthwhile to modify it and arrest thedecline in its usefulness. In this vein, we advanced two proposals that may enhance the usefulness offinancial information: an extended capitalisation of intangible investments and a systematic restatementof past financial reports.
33
NOTES
1 We assume that the major objective of financial reporting is the provision of decision-relevant informationto investors, as stated in the FASB’s Statement of Financial Accounting Concepts No. 1,
“Financial reporting should provide information that is useful to present and potential investors andcreditors and other users in making rational investment, credit and similar decisions…. Financial reportingshould provide information to help present and potential investors and creditors and other users in assessingthe amounts, timing, and uncertainty of prospective cash receipts from dividends or interest and theproceeds from the sale, redemption, or maturity of securities or loans.” (FASB, 1978, paras. 34, 37).
2 It is not change per se that distorts financial reporting, rather the increased uncertainty generally associatedwith change (e.g. uncertainty about the consequences of a substantial restructuring, product development orderegulation). If the consequences of change were perfectly predictable, the accounting system would haveno problem matching costs with revenues. The uncertainty ushered in by change provides the justificationor excuse for the immediate expensing of practically all change-related outlays.
3 Since we are concerned with usefulness of financial information to investors, the contractual andstewardship (compensation) functions of such information are not examined here.
4 An important limitation should be noted. Association studies, such as those presented here, indicate anupper bound of usefulness of the examined financial data. The reason: unless the stock return intervalaround announcement is very narrow (e.g. a day), the existence of an association between an informationitem and stock return does not necessarily imply that the information item indeed triggered investors’reaction. It may be that other, more timely information (e.g. a voluntary managerial announcement) wasresponsible for the stock-price change.
5 Non-earnings accounting data (e.g. inventories, R&D, capital expenditures) increase the explanatory powerof financial information with respect to stock returns to 15-25 per cent (Lev and Thiagarajan, 1993; Livnatand Zarowin, 1990).
6 All R2s reported in this study are “adjusted R2s”.
7 All regressions on Time were also run with one- and two-lag autocorrelation corrections, with virtuallyidentical results.
8 In a similar vein, Black (1993, p. 15) writes: “This suggests a definition of ‘earnings quality.’ A firm withhigh quality earnings will have a strong relation between earnings and [market] value.”
9 Ramesh and Thiagarajan (1995) provide similar evidence of a temporal decrease of the returns-earningsslope coefficient (ERC). They subject the data to various statistical and specification tests, concluding thatthe intertemporal decrease in ERCs is both statistically significant and robust to different modelspecifications (e.g. accounting for firm-size effect). Hayn (1995) finds that some, but not all, of thedecrease in ERCs can be attributed to negative earnings whose preponderance increased in the 1980s.Ramesh and Thiagarajan also examine the pattern of firm-specific (time-series) ERCs and find a similar
34
phenomenon of temporally declining response coefficients. The temporal decline in ERC is documentedalso when unexpected earnings relative to analysts’ forecasts are considered (Cheng et al., 1992).
10 Since in the early sample period firms did not report cash flows from operations, we computed this item asfollows: Cash Flow from Operations = Net Income before Extraordinary Items + Depreciation + AnnualDeferred Taxes – Annual Change in Current Assets – Cash + Annual Change in Current Liabilities –Current Maturities of Long-term Debt.
11 An increase in the variability of stock returns may have also contributed to the weakening of thereturns-earnings association. See Francis and Schipper (1996) on this issue.
12 This is derived from a chapter entitled “Cash is King” in a leading book on valuation of business enterprises(Copeland et al., 1996).
13 A similar result was noted by Livnat and Zarowin (1990) and Bowen et al. (1987).
14 It may still be the case that in special circumstances (e.g. financially distressed companies), cash flowsprovide substantial incremental information over earnings.
15 In their published version (Table 3), Collins et al., report an average R2 of expression (3) of 0.754 for the
period 1983-93. The corresponding average R2 of our estimates (our Table 3) is 0.744. It appears,therefore, that our estimates of regression (3) conform closely to those of Collins et al., (not surprisingly,given the identical source of data).
16 Following are the 3-day market-adjusted returns (raw returns minus S&P 500) of the seven phonecompanies around the asset write-off announcements: Bell Atlantic: -1.97%, NYNEX: 6.94%, Bell South:-1.80%, Pacific Telesis: 0.25%, U.S. West: 5.22%, GTE: -2.90%, Ameritech: -1.25%. The average 3-dayreturn is 0.64%.
17 We have also experimented with multi-year changes (e.g. rank changes over three to five years) andobtained similar results to the yearly changes reported below. Accordingly, the analyses reported here arebased on yearly rank changes.
18 The exceptions are end-of-period adjustment entries, such as those reflecting depreciation and doubtfulreceivables, which are not transaction-based.
19 The significant and adverse reaction of investors to the telecommunications’ deregulation is evident by thestock performance of the regional telephone companies which considerably underperformed the marketreturn. The average 5-year (1991-95) cumulative return of the phone companies’ stock was 93.25%, whilethe market return (CRSP value-weighted) over the corresponding period was 119.59%.
20 Indeed, empirical event studies (e.g. Francis et al., 1996) indicate that often investors’ reaction to thereported restructuring losses is in fact positive.
21 While it is generally believed that the expensing of intangibles is conservative, leading to lower reportedprofitability than under capitalisation, for mature firms immediate expensing is in fact aggressive.Specifically, when the growth rate of investment in intangibles is lower than the firm’s return on equity(ROE), the expensing of intangibles results in higher ROE and ROA than if the intangibles were capitalised(see Beaver and Ryan, 1996; and Merck’s example in Lev and Sougiannis, 1996, Appendix).
22 We have experimented with multiple change-cut-offs, such as 0.20, 0.30, and obtained similar results tothose reported in Table 5.
35
23 An example is IBM’s loss of $538 million in the third quarter of 1995 due to the write-off of $1 840 millionacquired R&D-in-process (in the same quarter a year earlier, IBM reported positive earnings of$710 million). Obviously, the $538 million loss does not indicate any deterioration in IBM’s operations;just the application of a questionable accounting procedure.
24 Often investment in intangibles also requires increased tangible investment in equipment and plant, seeLach and Schankerman (1989).
25 The pharmaceuticals industry provides an example of these two types of R&D. The first is aimed atdeveloping New Molecular Entities (NMEs), which are entirely new drugs capable of changing the firm’sproduct mix and competitive position. The second is aimed at modifying existing drugs, or changing theroute of administration, thereby preserving the firm’s competitive position.
26 Collins et al. do, however, find that the increased importance of intangible-intensive firms is associatedwith a shift in value-relevance from earnings to book values.
27 In fact, researchers report that the firm-specific time-series of R&D of most firms are remarkably stable(e.g. Hall, 1993), a fact which creates difficulties in estimating the association between the lag structure ofR&D spending and subsequent benefits.
28 We also experimented with an R&D intensity cut-off of 0.5 per cent and found similar results to those of1 per cent.
29 The difference between the ERCs Time coefficients (-0.067 and -0.030) is statistically significant at the
0.01 level, while the difference in the R2 coefficients (-0.007 and -0.004) is not statistically significant.
30 A different argument for the expensing of intangible investments is that the cost of intangibles is oftenunrelated to their current values (e.g. Schuetze, 1993). First, this argument can be levelled at many tangibleinvestments whose costs are capitalised in financial reports. Second, this argument is inconsistent withempirical evidence which documents high levels of correlation between cost of R&D and its fair marketvalue, or other value measures such as number of patents, innovations and intensity of patent citations(e.g. Deng and Lev, 1998; Audreutsch, 1996). Third, even if the cost of intangibles were unrelated tocurrent value, cost capitalisation is important for the assessment of return on investment in intangibles (as isthe cost of a stock portfolio in a return computation).
31 The expensing of R&D of products for internal use vs. the capitalisation of similar but acquired products isalso inconsistent with Coase’s (1937) classic argument that the reason for the existence of firms is that theycan perform certain functions or do certain things more efficiently than markets. Accordingly, when a firmdecides to develop a product (e.g. a software package) for internal use rather than acquire it, it stands toreason that it can do it more efficiently than vendors (the market). What is then the logic of expensing theinvestment of the more efficient firm while capitalising the less efficient one?
32 This is not really a satisfactory explanation, since the major cost items of internally generated R&D, such assalaries of programmers and scientists and laboratory equipment, are also market-determined.
33 These capitalised values are publicly reported by software companies following SFAS No. 86.
34 It stands to reason that the annual software capitalisation figure improves the prediction of future earnings,since the software capitalisation is predicated on the success of the development programme (e.g. passingsuccessfully feasibility tests, or developing a working pilot), see SFAS No. 86. Developmental successshould be associated with subsequent sales and earnings growth.

36
35 A regression of stock returns on earnings before general expenses (which mainly include customeracquisition costs) and general expenses, finds the latter variable to have a positive, large (relative toearnings) and statistically significant coefficient.
36 For example, the US Bureau of Economic Analysis capitalises aggregate R&D expenditure in a satelliteaccount to the national income and product accounts. This national R&D capital is amortised by 11 per centper year, which is the mid-point of the range of empirical amortisation rates estimated by economists; seeCarson et al. (1994).
37 Of course, the reversing of past R&D expensing could be made against equity or in comprehensive income,thereby leaving current income unaffected.
37
REFERENCES
ABOODY, D. and B. LEV (1998), The Value-relevance of Intangibles: The Case of SoftwareCapitalisation, NYU.
ABRAHAM, T. and B. SIDHU (1997), The Role of R&D Capitalisations in Firm Valuation andPerformance, University of New South Wales.
AMIR, E. and B. LEV (1996), “Value-relevance of Non-Financial Information: The WirelessCommunications Industry”, Journal of Accounting and Economics 22, pp. 3-30.
AUDREUTSCH, D. (1995), Innovation and Industry Evolution, The MIT Press.
BARTH, M., R. KASZNIK and M. MCNICHOLS (1998), Analysts Coverage and Intangible Assets,Stanford University.
BARTH, M. and G. CLINCH (1997), Revalued Financial, Tangible, and Intangible Assets: Associationswith Share Prices and Non Market-Based Value Estimates, Stanford University.
BARTH, M., J. ELLIOTT, and M. FINN (1997), Market Rewards associated with Patterns of IncreasingEarnings, Stanford University.
BEAVER, W. and S. RYAN (1998), Biased Recognition (Conservatism) and Delayed Recognition inAccounting and their Effects on the Ability of the Book-to-Market Ratio to Predict Book Return onEquity, Stanford University.
BLACK, F. (1993), “Choosing Accounting Rules”, Accounting Horizons 7, pp. 1-17.
BOWEN, R., D. BURGSTAHLER, and L. DALEY (1987), “The Incremental Information Content ofAccrual Versus Cash Flows”, The Accounting Review 62, pp. 723-747.
CARSON, C., B. GRIMM and C. MOYLAN (1994), “A Satellite Account for Research andDevelopment,” Survey of Current Business, November, pp. 37-71.
CHANG, J. (1998), The Decline in Value Relevance of Earnings and Book Values, Harvard University.
CHENG, C., W. HOPWOOD and J. McKEOWN (1992), “Nonlinearity and Specification Problems inUnexpected Earnings Response Regression Model”, The Accounting Review 67, pp. 579-598.
COASE, R. (1937), The Nature of the firm, Economica, 4, pp. 386-405.
COLLINS, D., E. MAYDEW and I. WEISS (1997), “Changes in the Value-relevance of Earnings andBook Values over the Past Forty Years”, Journal of Accounting and Economics, forthcoming.
38
COPELAND, T., T. KELLER and J. MURRIN (1996), Valuation: Measuring and Managing the Value ofCompanies, John Wiley & Sons, Inc., New York.
DELOITTE & TOUCHE (1995), Survey of American Business Leaders.
DENG, Z. and B. LEV (1998), Flash-then-Flush: The valuation of Acquired R&D-in-Process, NYU.
DIETRICH, R., R. FREEMAN, T. HARRIS, K. PALEPU, D. LARCKER, S. PENMAN, andK. SCHIPPER (1997), Evaluating Financial Reporting Standards, University of Chicago.
ELY, K. and G. WAYMIRE (1996), Accounting Standard-setting Organizations and Earnings-relevance:Longitudinal Evidence from NYSE Common Stocks, 1927-93, Emory University.
FINANCIAL ACCOUNTING STANDARDS BOARD (1977), Prior Period Adjustments, SFAS No. 16.
FINANCIAL ACCOUNTING STANDARDS BOARD (1978), Statement of Financial AccountingConcepts No. 1, Objectives of Financial Reporting by Business Enterprises .
FINANCIAL ACCOUNTING STANDARDS BOARD (1980), Statement of Financial AccountingConcepts No. 2: Qualitative Characteristics of Accounting Information .
FINANCIAL ACCOUNTING STANDARDS BOARD (1981), Financial Reporting by Producers andDistributors of Motion Picture Films, SFAS No. 53.
FINANCIAL ACCOUNTING STANDARDS BOARD (1985), Accounting for the Cost of ComputerSoftware to be Sold, Leased or otherwise Marketed, SFAS No. 86.
FINANCIAL ACCOUNTING STANDARDS BOARD (1985), Statement of Financial AccountingConcepts No. 6, Elements of Financial Statements.
FINANCIAL ACCOUNTING STANDARDS BOARD (1995), Statement No. 121, Accounting for theImpairment of Long-lived Assets and for Long-lived Assets to be Disposed of.
FINGER, C., B. LEV and A. ROSE (1996), The Contextual Role of Financial Reports, NYU.
FRANCIS, J. and K. SCHIPPER (1996), Have Financial Statements Lost their Relevance?, University ofChicago.
FRANCIS, J., D. HANNA and L. VINCENT (1996), “Causes and Effects of Discretionary AssetWrite-offs”, Journal of Accounting Research Supplement, pp. 117-134.
HALL, B. (1993), “The Stock Market’s Valuation of R&D Investment During the 1980’s,” AmericanEconomic Review, 83, pp. 259-264.
HAYN, C. (1995), “The Information Content of Losses”, Journal of Accounting and Economics 20,pp. 125-154.
INTERNATIONAL ACCOUNTING STANDARDS COMMITTEE (1997), “Proposed InternationalAccounting Standard: Intangible Investments”, Exposure Draft E60.
39
JOVANOVIC, B. and Y. NYARKO (1995), Research and Productivity, Department of Economics,University of Pennsylvania.
KEMENY, J. and L. SNELL (1967), Finite Markov Chains, Van Nostrand Company, Inc., New Jersey
KOTHARI, S. and R. SLOAN (1992), “Information in Prices about Future Earnings”, Journal ofAccounting and Economics, 15, pp. 143-171.
LACH, S. and M. SCHANKERMAN (1989), “Dynamics of R&D and Investment in the ScientificSector”, Journal of Political Economy, 97, pp. 880-904.
LANG, M. (1991), “Time Varying Stock Price Response to Earnings Induced by Uncertainty About theTime-series Process of Earnings”, Journal of Accounting Research, 29, pp. 229-257.
LEV, B. (1989), “On the Usefulness of Earnings and Earnings Research: Lessons and Directions fromTwo Decades of Accounting Research”, Journal of Accounting Research Supplement, 27,pp. 153-192.
LEV, B. and R. THIAGARAJAN (1993), “Fundamental Information Analysis”, Journal of AccountingResearch, Autumn, pp. 190-215.
LEV, B. and T. SOUGIANNIS (1996), “The Capitalization, Amortization, and Value-relevance of R&D”,Journal of Accounting and Economics 21, pp. 107-138.
LEV, B., S. RADHAKRISHNAN and C. SEETHAMRAJU (1998), FDA Drug Approvals and theFormation of Investors’ Beliefs, NYU.
LIVNAT, J. and P. ZAROWIN (1990), “The Incremental Information Content of Cash-flowComponents”, Journal of Accounting and Economics, 13, pp. 25-46.
OHLSON, J. (1995), “Earnings, Book Values and Dividends in Security Valuation”, ContemporaryAccounting Research, 11, pp. 661-687.
OU, J. and S. PENMAN (1989), “Financial Statement Analysis and the Prediction of Stock Returns”,Journal of Accounting and Economics, 11, pp. 295-329.
PETRONI, K., S. RYAN and J. WAHLEN (1998), The Risks and Value Relevance of Revisions of AccrualEstimates: Evidence from Property-casualty Insurers’ Loss Reserves Development Disclosure,Michigan State University.
RAMESH, K. and R. THIAGARAJAN (1995), Inter-temporal Decline in Earnings Response Coefficients,Northwestern University.
SCHUETZE, W. (1993), What is an Asset?, Accounting Horizons, 7, pp. 66-70.
STEWART, T. (1997), Intellectual Capital, Doubleday.
STIGLER, G. (1966), The Theory of Price, MacMillan Publishing Co., Inc., New York.