Embed Size (px)
Citation preview

1
Measuring Logistics PerformanceKarl B. Manrodt, Ph.D.Karl B. Manrodt, Ph.D.
Stephen M. Rutner, Ph.D.Stephen M. Rutner, Ph.D.Georgia Southern UniversityGeorgia Southern University
Mary Collins Holcomb, Ph.D.Mary Collins Holcomb, Ph.D.University of TennesseeUniversity of Tennessee GEORGIA SOUTHERN
UNIVERSITY
1 © Manrodt, Rutner, Holcomb, 2004.
Table of Contents
Page Methodology 2Sufficiency of the Metrics 11Metrics in Use 32Conclusions 46Demographics 50Contact Information 55
2
2 © Manrodt, Rutner, Holcomb, 2004.
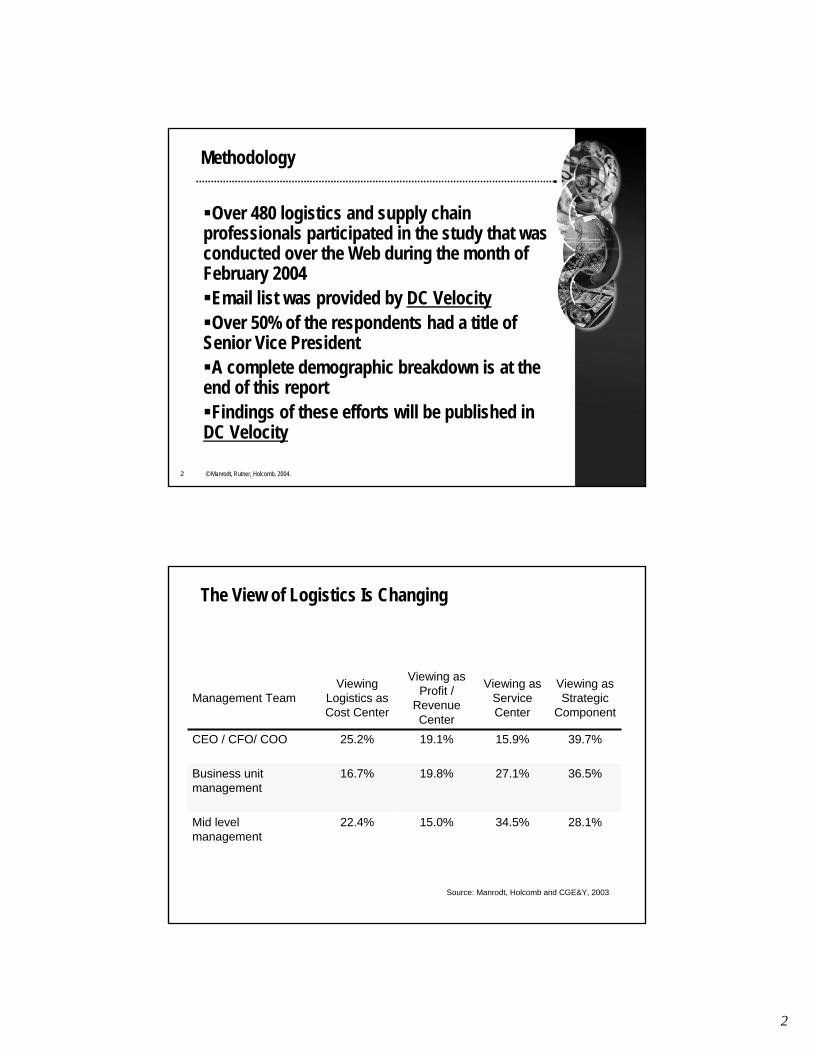
Methodology
Over 480 logistics and supply chain professionals participated in the study that was conducted over the Web during the month of February 2004Email list was provided by DC VelocityOver 50% of the respondents had a title of
Senior Vice PresidentA complete demographic breakdown is at the
end of this reportFindings of these efforts will be published in
DC Velocity
22.4%
16.7%
25.2%
Viewing Logistics as Cost Center
15.0%
19.8%
19.1%
Viewing as Profit /
Revenue Center
34.5%
27.1%
15.9%
Viewing as Service Center
28.1%
36.5%
39.7%
Viewing as Strategic
Component
Mid level management
Business unit management
CEO / CFO/ COO
Management Team
The View of Logistics Is Changing
Source: Manrodt, Holcomb and CGE&Y, 2003
3
4 © Manrodt, Rutner, Holcomb, 2004.
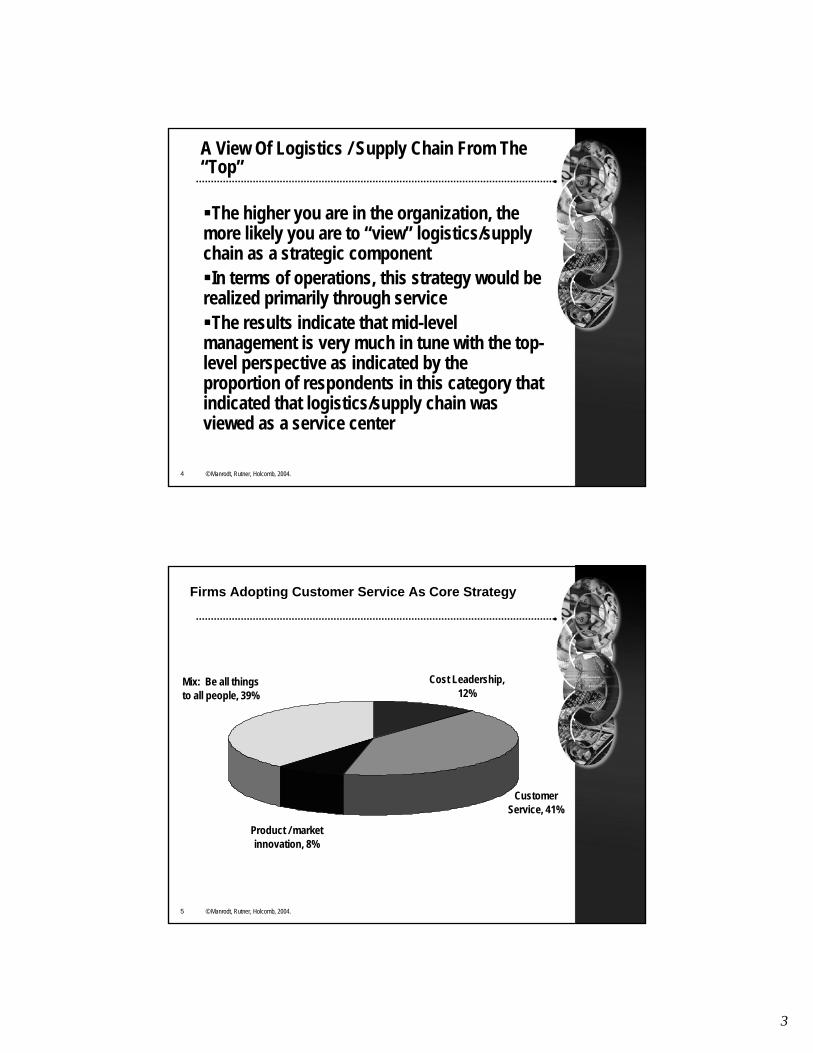
A View Of Logistics / Supply Chain From The “Top”
The higher you are in the organization, the more likely you are to “view” logistics/supply chain as a strategic componentIn terms of operations, this strategy would be
realized primarily through serviceThe results indicate that mid-level
management is very much in tune with the top-level perspective as indicated by the proportion of respondents in this category that indicated that logistics/supply chain was viewed as a service center
5 © Manrodt, Rutner, Holcomb, 2004.
Product / market innovation, 8%
Mix: Be all things to all people, 39%
Customer Service, 41%
Cost Leadership, 12%
Firms Adopting Customer Service As Core Strategy
4
6 © Manrodt, Rutner, Holcomb, 2004.
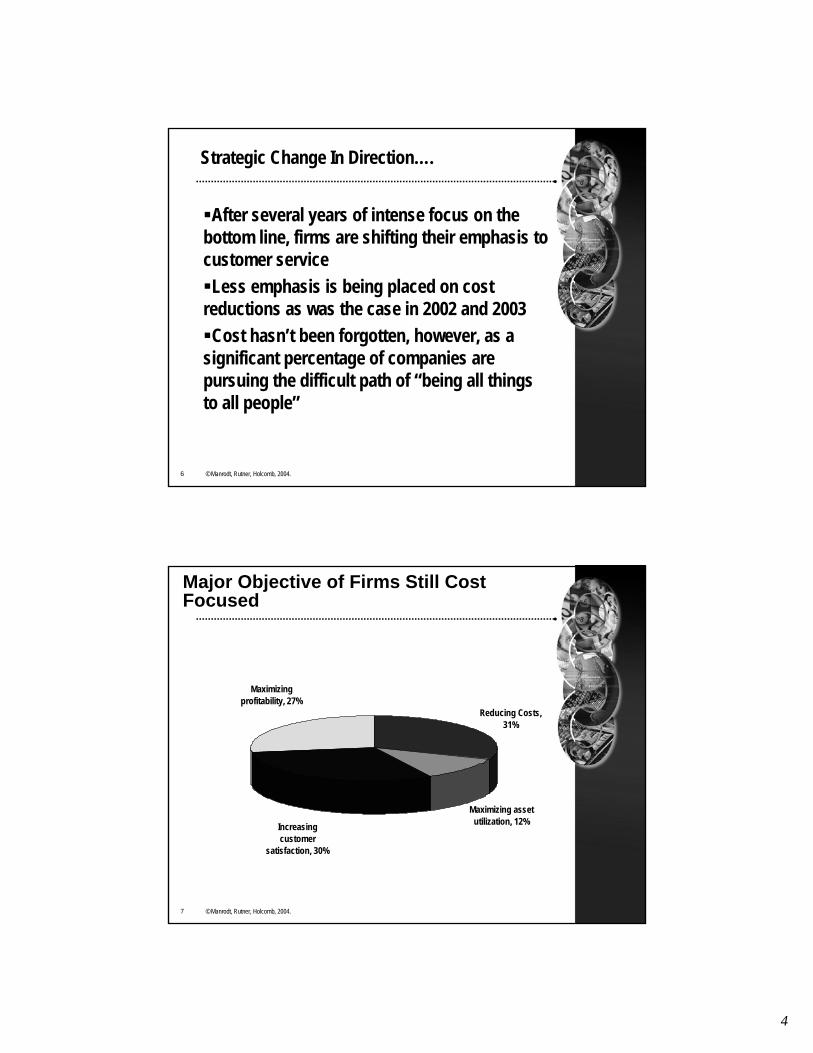
Strategic Change In Direction….
After several years of intense focus on the bottom line, firms are shifting their emphasis to customer serviceLess emphasis is being placed on cost
reductions as was the case in 2002 and 2003Cost hasn’t been forgotten, however, as a
significant percentage of companies are pursuing the difficult path of “being all things to all people”
7 © Manrodt, Rutner, Holcomb, 2004.
Increasing customer
satisfaction, 30%
Maximizing profitability, 27%
Maximizing asset utilization, 12%
Reducing Costs, 31%
Major Objective of Firms Still Cost Focused
5
8 © Manrodt, Rutner, Holcomb, 2004.
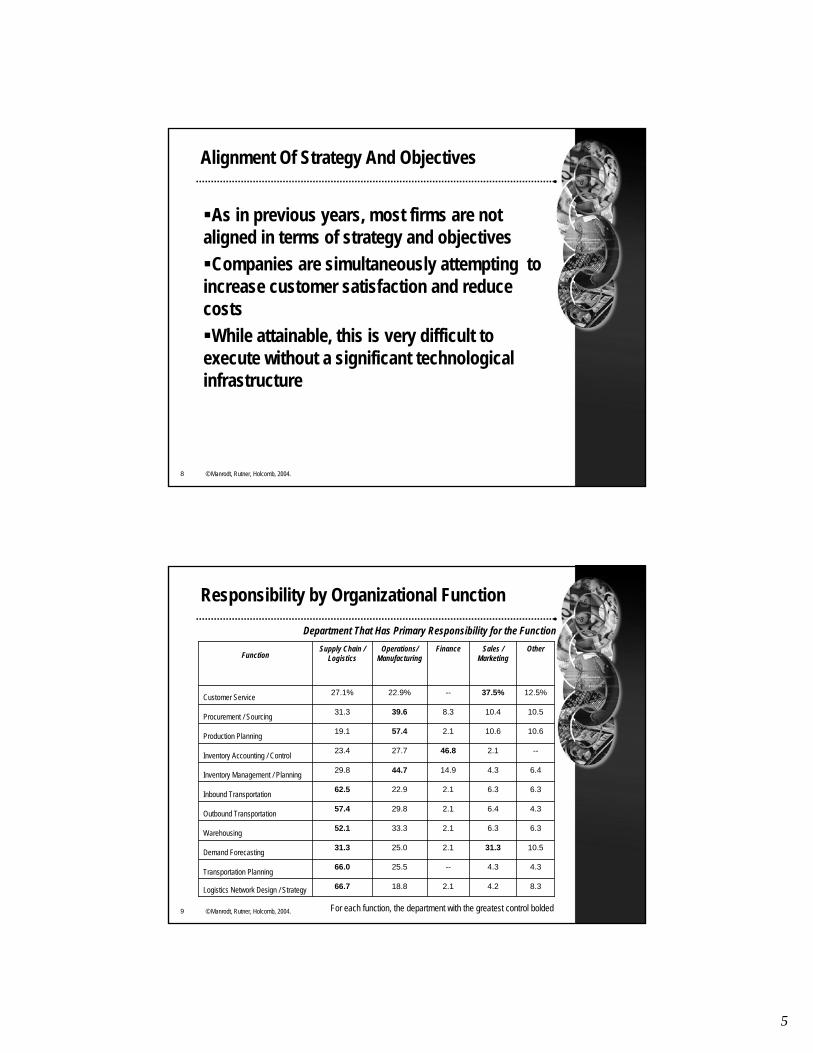
Alignment Of Strategy And Objectives
As in previous years, most firms are not aligned in terms of strategy and objectivesCompanies are simultaneously attempting to
increase customer satisfaction and reduce costsWhile attainable, this is very difficult to
execute without a significant technological infrastructure
9 © Manrodt, Rutner, Holcomb, 2004.
Responsibility by Organizational Function
8.34.22.118.866.7Logistics Network Design / Strategy
4.34.3--25.566.0Transportation Planning
10.531.32.125.031.3Demand Forecasting
6.36.32.133.352.1Warehousing
4.36.42.129.857.4Outbound Transportation
6.36.32.122.962.5Inbound Transportation
6.44.314.944.729.8Inventory Management / Planning
--2.146.827.723.4Inventory Accounting / Control
10.610.62.157.419.1Production Planning
10.510.48.339.631.3Procurement / Sourcing
12.5%37.5%--22.9%27.1%Customer Service
OtherSales / Marketing
FinanceOperations/ Manufacturing
Supply Chain / LogisticsFunction
Department That Has Primary Responsibility for the Function
For each function, the department with the greatest control bolded
6
10 © Manrodt, Rutner, Holcomb, 2004.
Movement and Storage Still Logistics’ Primary Responsibility
When it comes to transportation planning and operations (both inbound and outbound), logistics is clearly in the “driver’s seat”
Unfortunately this cannot be said for two of the most important logistics functions – inventory management and customer service – which are not the primary responsibility of this area
However, both areas are more likely to be managed by supply chain / logistics than five years ago
Surprisingly, logistics and sales/marketing are almost equally involved in demand forecasting
Sufficiency of the Metrics
7
12 © Manrodt, Rutner, Holcomb, 2004.
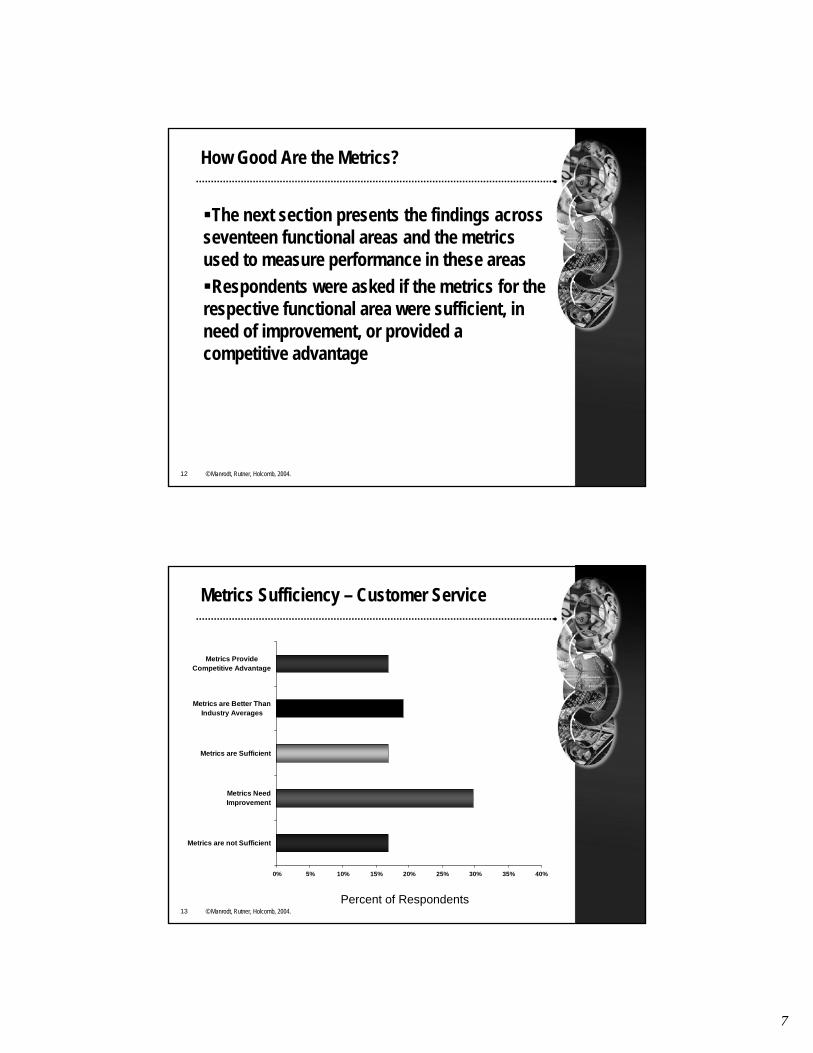
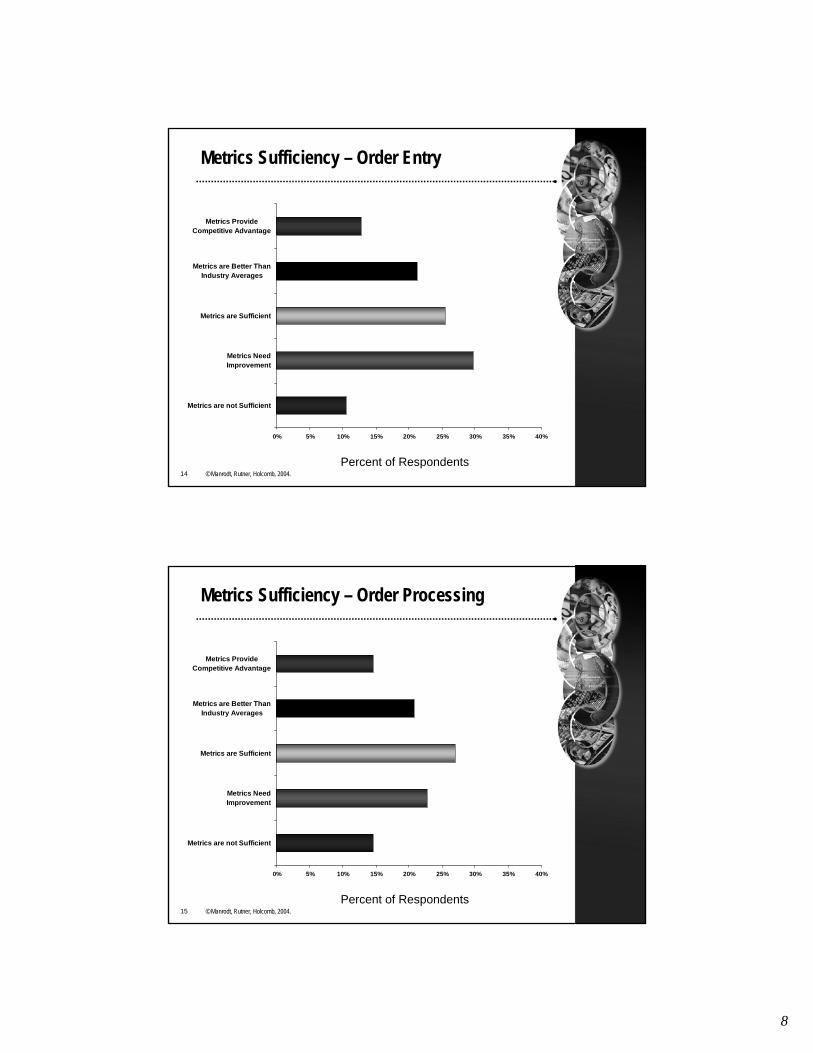
How Good Are the Metrics?
The next section presents the findings across seventeen functional areas and the metrics used to measure performance in these areas Respondents were asked if the metrics for the
respective functional area were sufficient, in need of improvement, or provided a competitive advantage
13 © Manrodt, Rutner, Holcomb, 2004.
Metrics Sufficiency – Customer Service
0% 5% 10% 15% 20% 25% 30% 35% 40%
Metrics are not Sufficient
Metrics NeedImprovement
Metrics are Sufficient
Metrics are Better ThanIndustry Averages
Metrics ProvideCompetitive Advantage
Percent of Respondents
8
14 © Manrodt, Rutner, Holcomb, 2004.
Metrics Sufficiency – Order Entry
0% 5% 10% 15% 20% 25% 30% 35% 40%
Metrics are not Sufficient
Metrics NeedImprovement
Metrics are Sufficient
Metrics are Better ThanIndustry Averages
Metrics ProvideCompetitive Advantage
Percent of Respondents
15 © Manrodt, Rutner, Holcomb, 2004.
Metrics Sufficiency – Order Processing
0% 5% 10% 15% 20% 25% 30% 35% 40%
Metrics are not Sufficient
Metrics NeedImprovement
Metrics are Sufficient
Metrics are Better ThanIndustry Averages
Metrics ProvideCompetitive Advantage
Percent of Respondents
9
16 © Manrodt, Rutner, Holcomb, 2004.
Metrics Sufficiency – Order Fulfillment
0% 5% 10% 15% 20% 25% 30% 35% 40%
Metrics are not Sufficient
Metrics NeedImprovement
Metrics are Sufficient
Metrics are Better ThanIndustry Averages
Metrics ProvideCompetitive Advantage
Percent of Respondents
17 © Manrodt, Rutner, Holcomb, 2004.
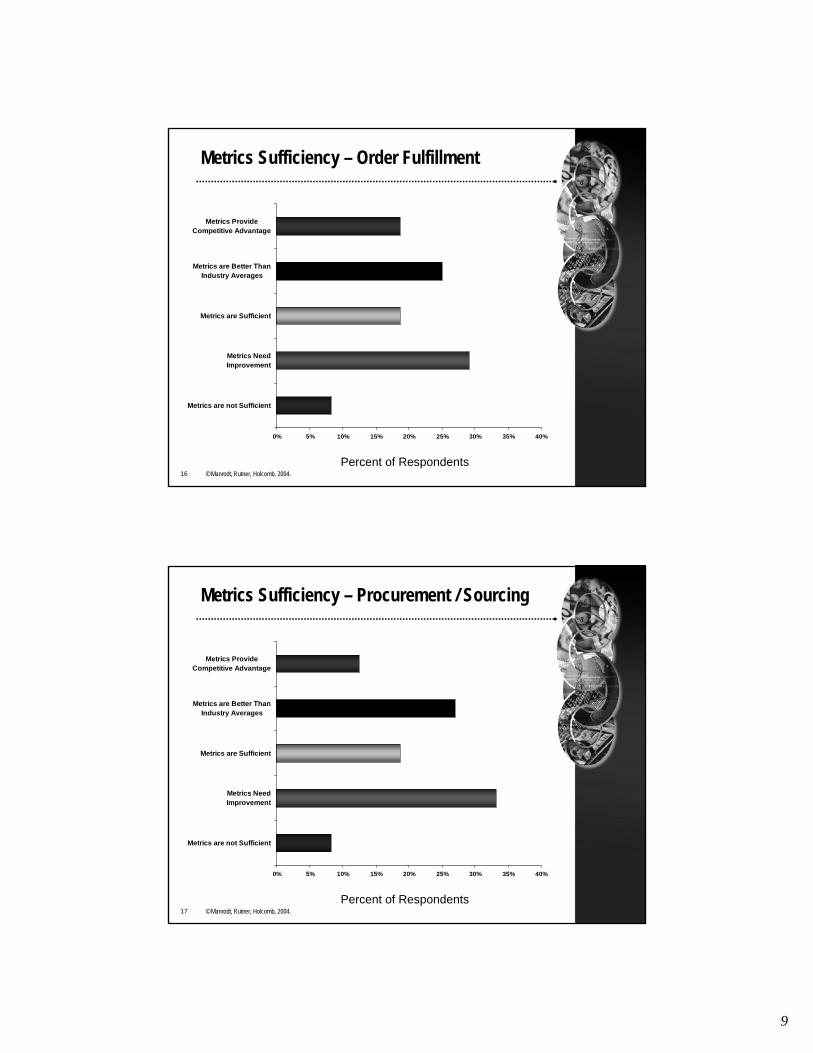
Metrics Sufficiency – Procurement / Sourcing
0% 5% 10% 15% 20% 25% 30% 35% 40%
Metrics are not Sufficient
Metrics NeedImprovement
Metrics are Sufficient
Metrics are Better ThanIndustry Averages
Metrics ProvideCompetitive Advantage
Percent of Respondents
10
18 © Manrodt, Rutner, Holcomb, 2004.
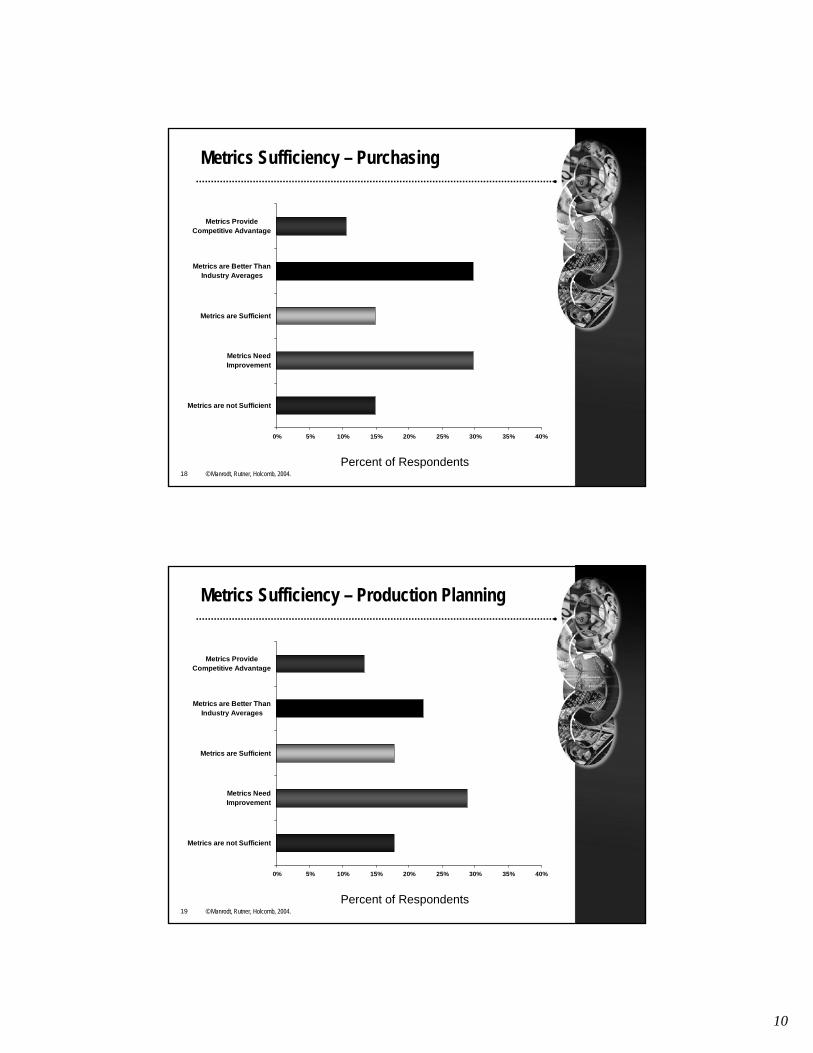
Metrics Sufficiency – Purchasing
0% 5% 10% 15% 20% 25% 30% 35% 40%
Metrics are not Sufficient
Metrics NeedImprovement
Metrics are Sufficient
Metrics are Better ThanIndustry Averages
Metrics ProvideCompetitive Advantage
Percent of Respondents
19 © Manrodt, Rutner, Holcomb, 2004.
Metrics Sufficiency – Production Planning
0% 5% 10% 15% 20% 25% 30% 35% 40%
Metrics are not Sufficient
Metrics NeedImprovement
Metrics are Sufficient
Metrics are Better ThanIndustry Averages
Metrics ProvideCompetitive Advantage
Percent of Respondents
11
20 © Manrodt, Rutner, Holcomb, 2004.
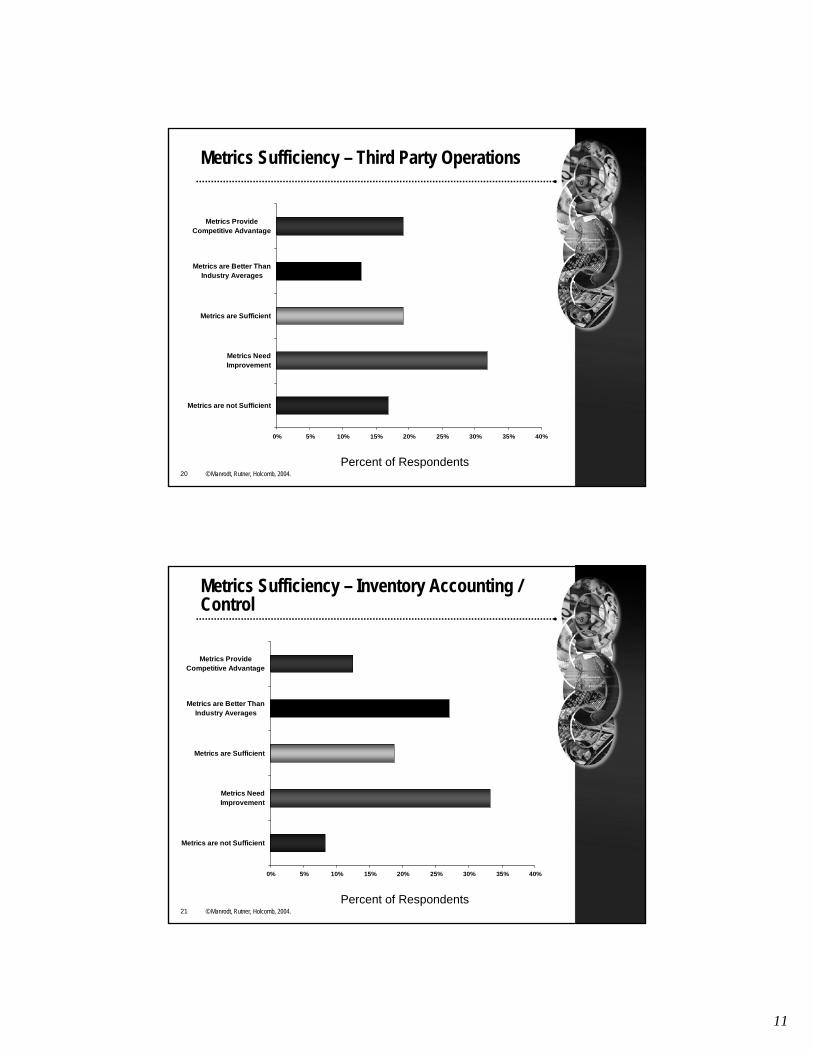
Metrics Sufficiency – Third Party Operations
0% 5% 10% 15% 20% 25% 30% 35% 40%
Metrics are not Sufficient
Metrics NeedImprovement
Metrics are Sufficient
Metrics are Better ThanIndustry Averages
Metrics ProvideCompetitive Advantage
Percent of Respondents
21 © Manrodt, Rutner, Holcomb, 2004.
Metrics Sufficiency – Inventory Accounting / Control
0% 5% 10% 15% 20% 25% 30% 35% 40%
Metrics are not Sufficient
Metrics NeedImprovement
Metrics are Sufficient
Metrics are Better ThanIndustry Averages
Metrics ProvideCompetitive Advantage
Percent of Respondents
12
22 © Manrodt, Rutner, Holcomb, 2004.
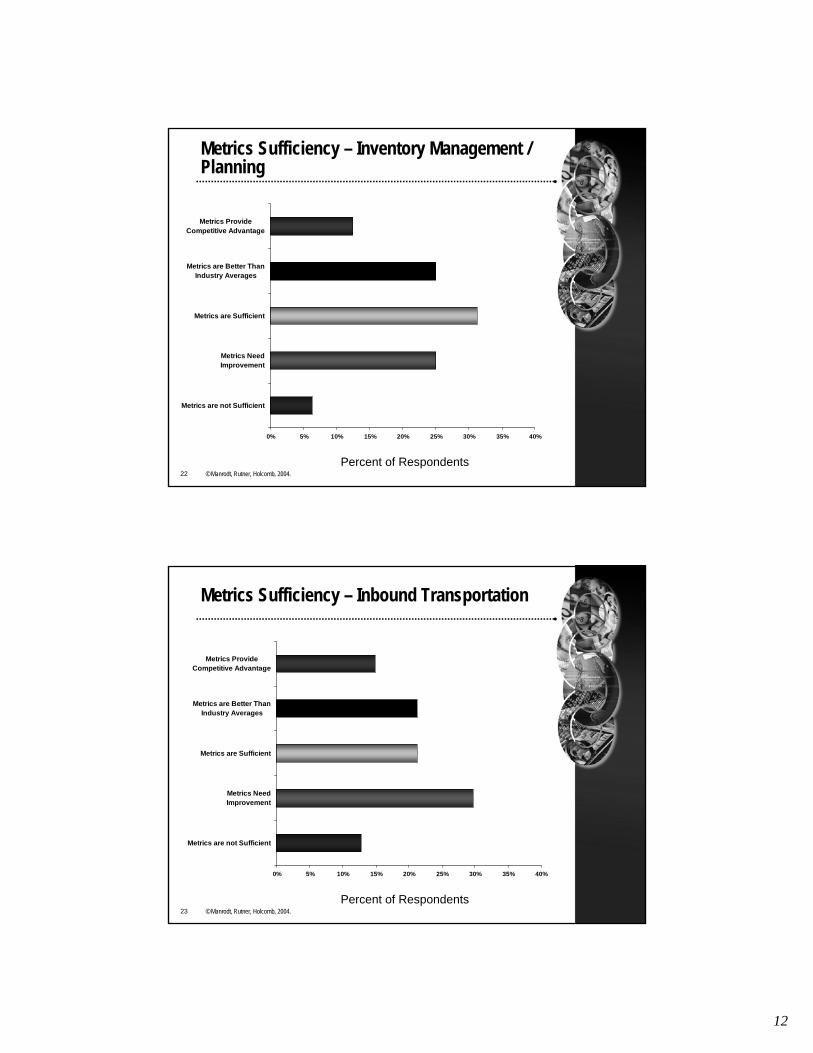
Metrics Sufficiency – Inventory Management / Planning
0% 5% 10% 15% 20% 25% 30% 35% 40%
Metrics are not Sufficient
Metrics NeedImprovement
Metrics are Sufficient
Metrics are Better ThanIndustry Averages
Metrics ProvideCompetitive Advantage
Percent of Respondents
23 © Manrodt, Rutner, Holcomb, 2004.
Metrics Sufficiency – Inbound Transportation
0% 5% 10% 15% 20% 25% 30% 35% 40%
Metrics are not Sufficient
Metrics NeedImprovement
Metrics are Sufficient
Metrics are Better ThanIndustry Averages
Metrics ProvideCompetitive Advantage
Percent of Respondents
13
24 © Manrodt, Rutner, Holcomb, 2004.
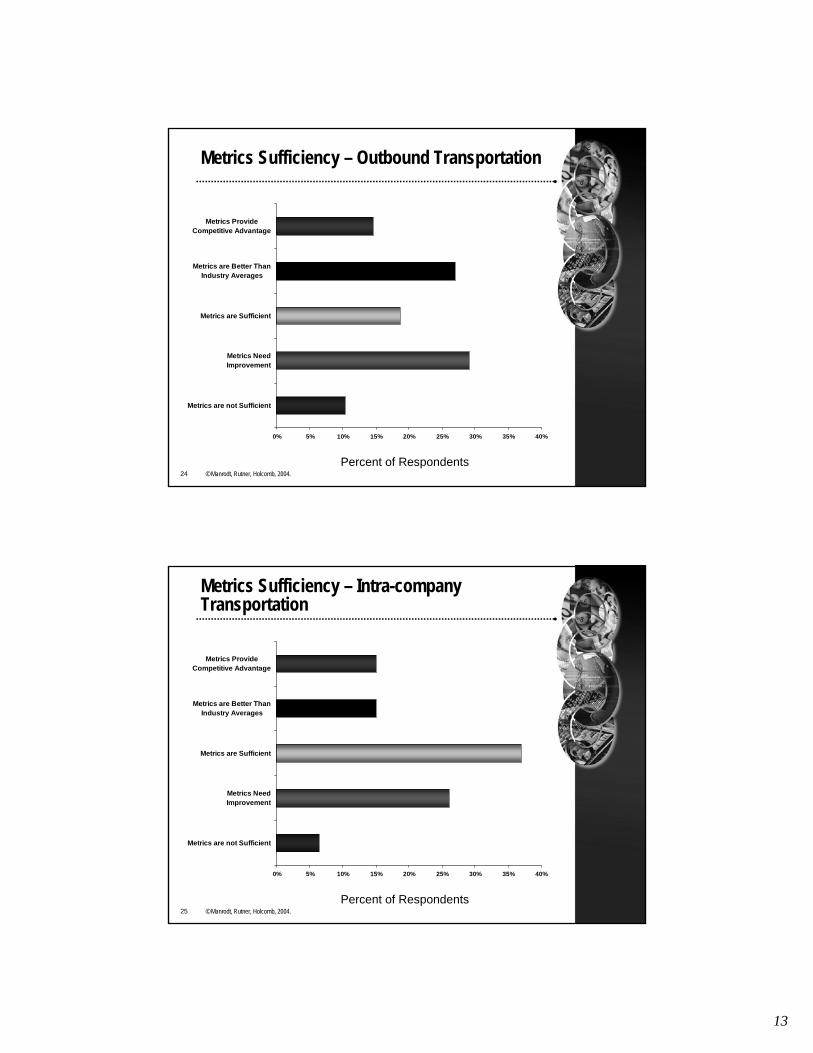
Metrics Sufficiency – Outbound Transportation
0% 5% 10% 15% 20% 25% 30% 35% 40%
Metrics are not Sufficient
Metrics NeedImprovement
Metrics are Sufficient
Metrics are Better ThanIndustry Averages
Metrics ProvideCompetitive Advantage
Percent of Respondents
25 © Manrodt, Rutner, Holcomb, 2004.
Metrics Sufficiency – Intra-company Transportation
0% 5% 10% 15% 20% 25% 30% 35% 40%
Metrics are not Sufficient
Metrics NeedImprovement
Metrics are Sufficient
Metrics are Better ThanIndustry Averages
Metrics ProvideCompetitive Advantage
Percent of Respondents
14
26 © Manrodt, Rutner, Holcomb, 2004.
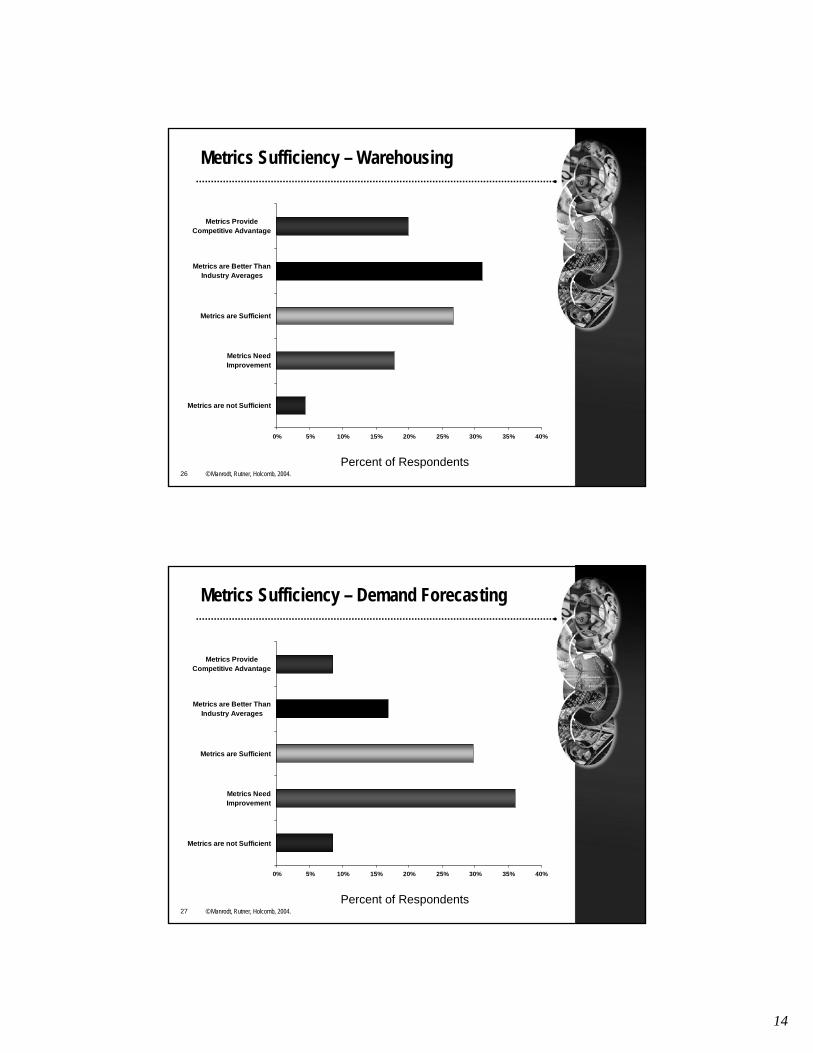
Metrics Sufficiency – Warehousing
0% 5% 10% 15% 20% 25% 30% 35% 40%
Metrics are not Sufficient
Metrics NeedImprovement
Metrics are Sufficient
Metrics are Better ThanIndustry Averages
Metrics ProvideCompetitive Advantage
Percent of Respondents
27 © Manrodt, Rutner, Holcomb, 2004.
Metrics Sufficiency – Demand Forecasting
0% 5% 10% 15% 20% 25% 30% 35% 40%
Metrics are not Sufficient
Metrics NeedImprovement
Metrics are Sufficient
Metrics are Better ThanIndustry Averages
Metrics ProvideCompetitive Advantage
Percent of Respondents

15
28 © Manrodt, Rutner, Holcomb, 2004.
Metrics Sufficiency – Transportation Planning
0% 5% 10% 15% 20% 25% 30% 35% 40%
Metrics are not Sufficient
Metrics NeedImprovement
Metrics are Sufficient
Metrics are Better ThanIndustry Averages
Metrics ProvideCompetitive Advantage
Percent of Respondents
29 © Manrodt, Rutner, Holcomb, 2004.
Metrics Sufficiency – Logistics Network Design / Strategy
0% 5% 10% 15% 20% 25% 30% 35% 40%
Metrics are not Sufficient
Metrics NeedImprovement
Metrics are Sufficient
Metrics are Better ThanIndustry Averages
Metrics ProvideCompetitive Advantage
Percent of Respondents
16
30 © Manrodt, Rutner, Holcomb, 2004.
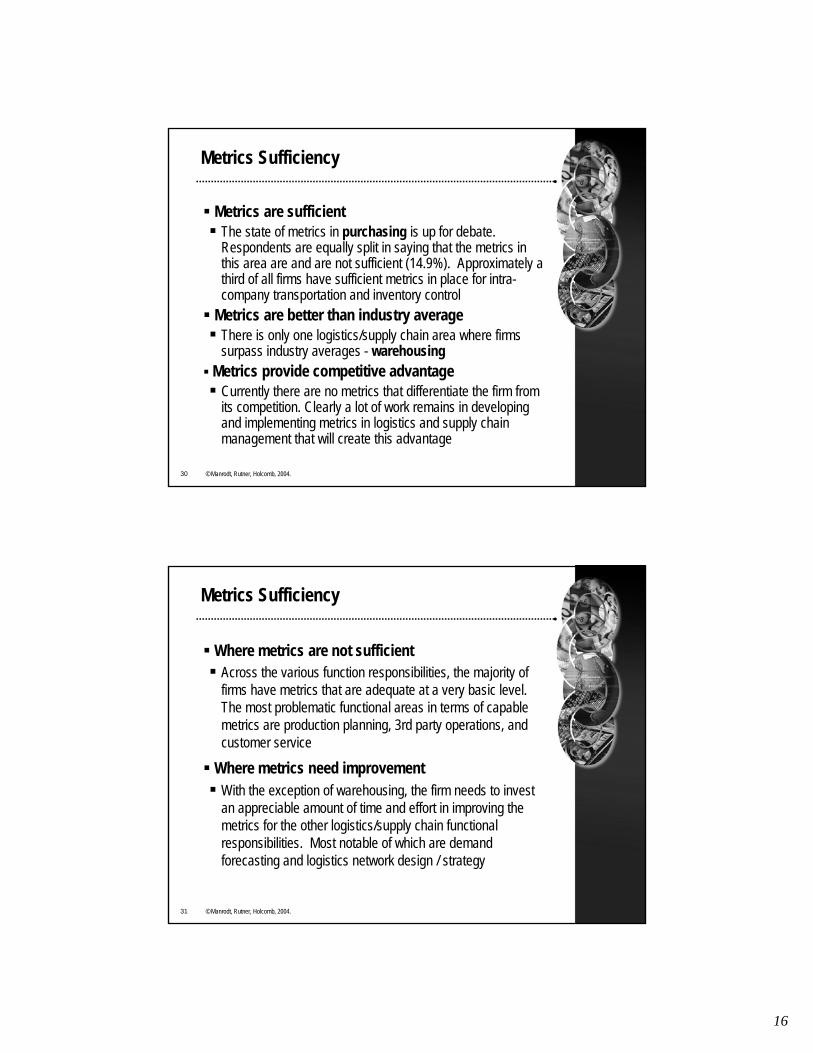
Metrics Sufficiency
Metrics are sufficient The state of metrics in purchasing is up for debate. Respondents are equally split in saying that the metrics in this area are and are not sufficient (14.9%). Approximately a third of all firms have sufficient metrics in place for intra-company transportation and inventory control
Metrics are better than industry average There is only one logistics/supply chain area where firms surpass industry averages - warehousing
Metrics provide competitive advantage Currently there are no metrics that differentiate the firm from its competition. Clearly a lot of work remains in developing and implementing metrics in logistics and supply chain management that will create this advantage
31 © Manrodt, Rutner, Holcomb, 2004.
Metrics Sufficiency
Where metrics are not sufficientAcross the various function responsibilities, the majority of firms have metrics that are adequate at a very basic level. The most problematic functional areas in terms of capable metrics are production planning, 3rd party operations, and customer service
Where metrics need improvementWith the exception of warehousing, the firm needs to invest an appreciable amount of time and effort in improving the metrics for the other logistics/supply chain functional responsibilities. Most notable of which are demand forecasting and logistics network design / strategy
17
Metrics In Use
33 © Manrodt, Rutner, Holcomb, 2004.
What Metrics Are Currently Being Used?
The following data indicate what metrics the study participants are using to measure performancePlease note that the data represent
respondents who use the metricsUsing each of the metrics is not the same as
rating them as being important
18
34 © Manrodt, Rutner, Holcomb, 2004.
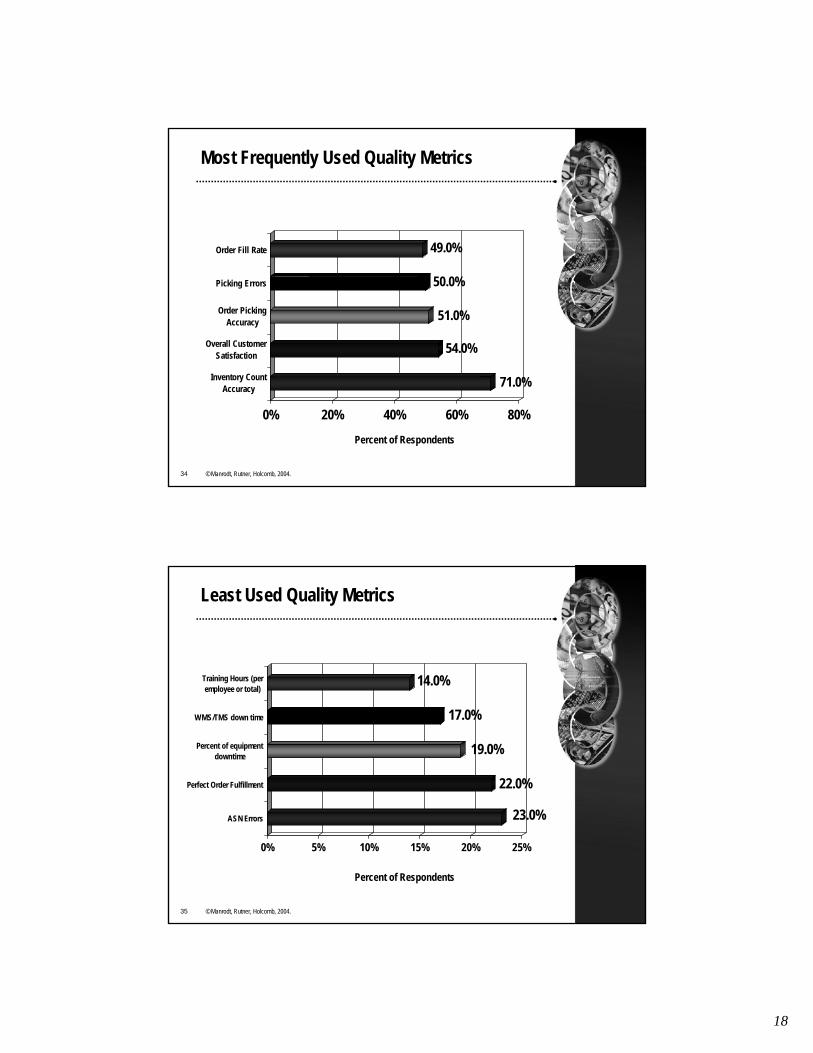
Most Frequently Used Quality Metrics
Percent of Respondents
71.0%
54.0%
51.0%
50.0%
49.0%
0% 20% 40% 60% 80%
Inventory CountAccuracy
Overall CustomerSatisfaction
Order PickingAccuracy
Picking Errors
Order Fill Rate
35 © Manrodt, Rutner, Holcomb, 2004.
Least Used Quality Metrics
Percent of Respondents
23.0%
22.0%
19.0%
17.0%
14.0%
0% 5% 10% 15% 20% 25%
ASN Errors
Perfect Order Fulfillment
Percent of equipmentdowntime
WMS/TMS down time
Training Hours (peremployee or total)
19
36 © Manrodt, Rutner, Holcomb, 2004.
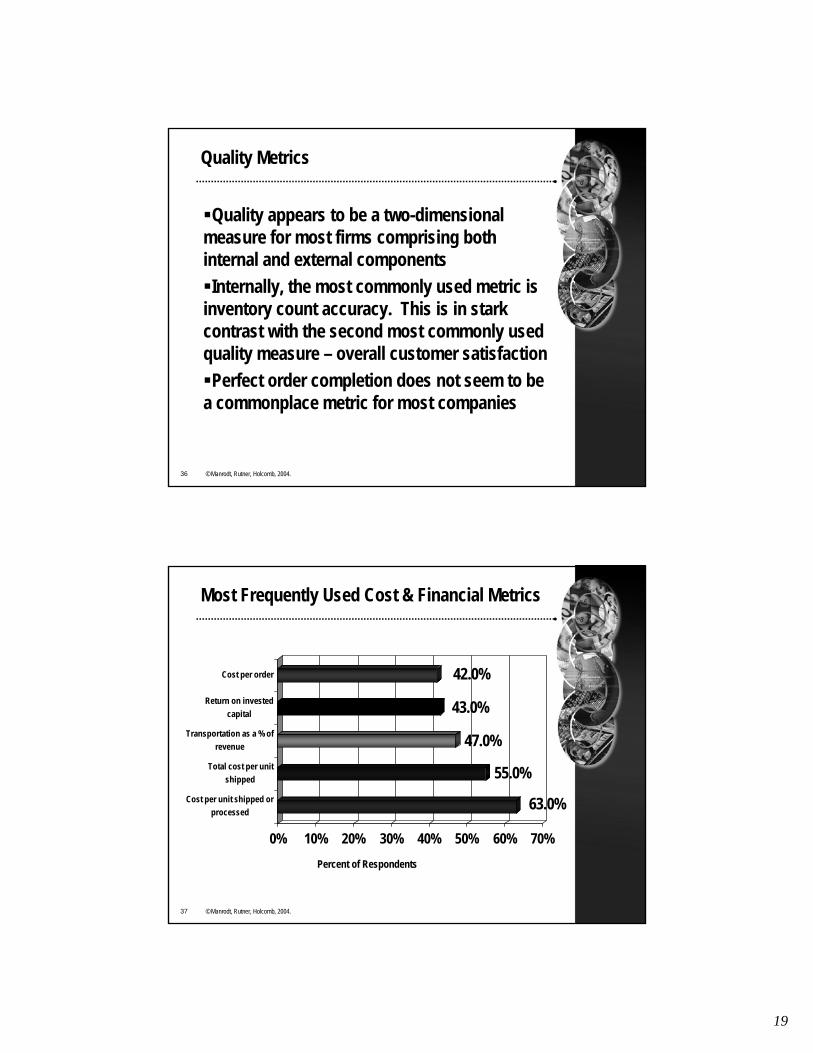
Quality Metrics
Quality appears to be a two-dimensional measure for most firms comprising both internal and external componentsInternally, the most commonly used metric is
inventory count accuracy. This is in stark contrast with the second most commonly used quality measure – overall customer satisfactionPerfect order completion does not seem to be
a commonplace metric for most companies
37 © Manrodt, Rutner, Holcomb, 2004.
Most Frequently Used Cost & Financial Metrics
Percent of Respondents
63.0%
55.0%
47.0%
43.0%
42.0%
0% 10% 20% 30% 40% 50% 60% 70%
Cost per unit shipped orprocessed
Total cost per unitshipped
Transportation as a % ofrevenue
Return on investedcapital
Cost per order
20
38 © Manrodt, Rutner, Holcomb, 2004.
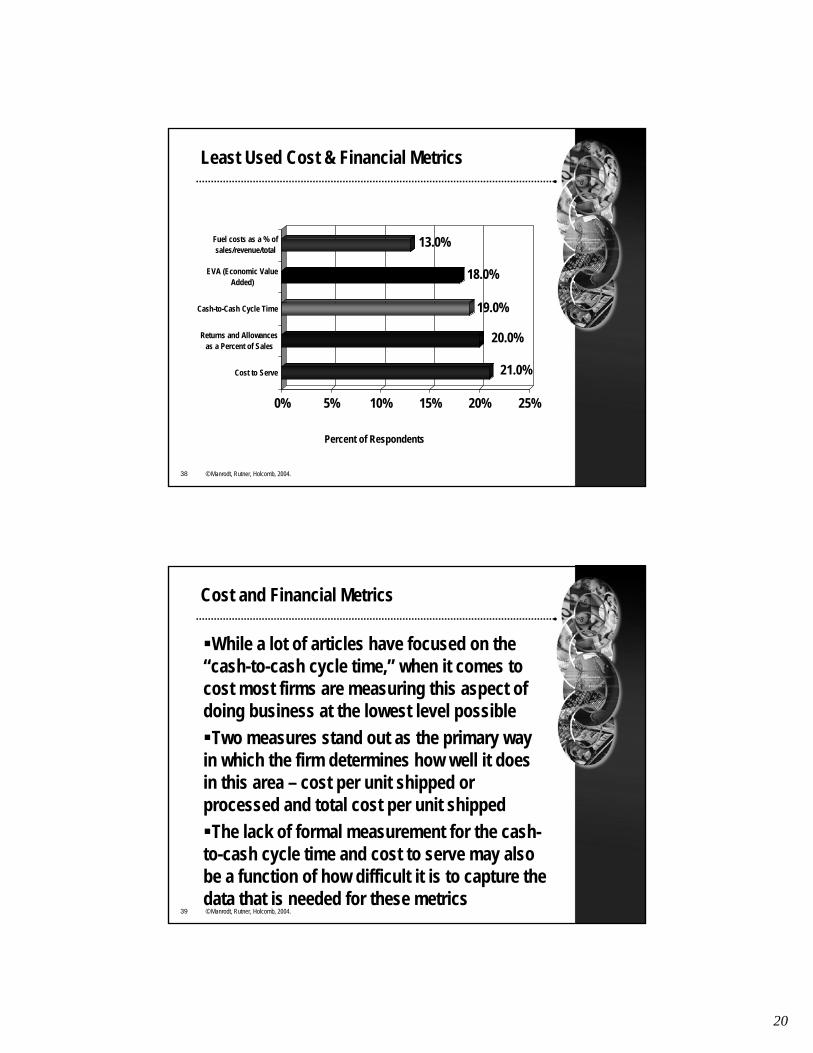
Least Used Cost & Financial Metrics
Percent of Respondents
21.0%
20.0%
19.0%
18.0%
13.0%
0% 5% 10% 15% 20% 25%
Cost to Serve
Returns and Allowancesas a Percent of Sales
Cash-to-Cash Cycle Time
EVA (Economic ValueAdded)
Fuel costs as a % ofsales/revenue/total
39 © Manrodt, Rutner, Holcomb, 2004.
Cost and Financial Metrics
While a lot of articles have focused on the “cash-to-cash cycle time,” when it comes to cost most firms are measuring this aspect of doing business at the lowest level possibleTwo measures stand out as the primary way
in which the firm determines how well it does in this area – cost per unit shipped or processed and total cost per unit shippedThe lack of formal measurement for the cash-
to-cash cycle time and cost to serve may also be a function of how difficult it is to capture the data that is needed for these metrics
21
40 © Manrodt, Rutner, Holcomb, 2004.
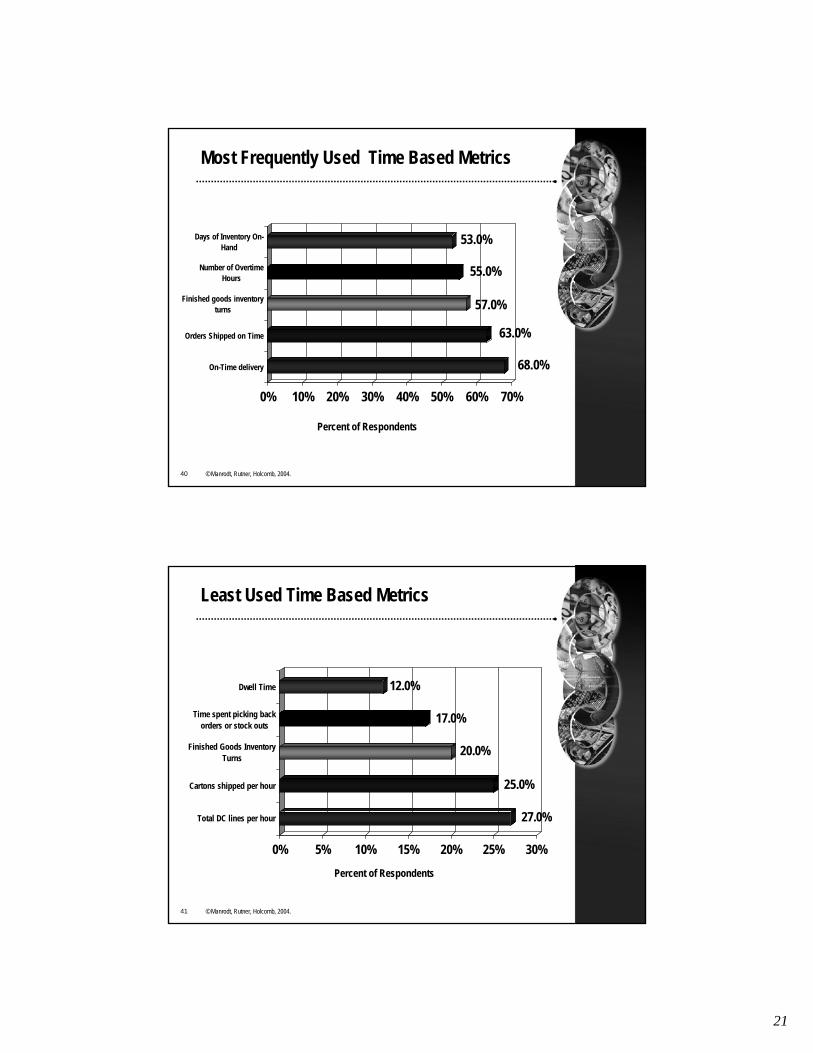
Most Frequently Used Time Based Metrics
Percent of Respondents
68.0%
63.0%
57.0%
55.0%
53.0%
0% 10% 20% 30% 40% 50% 60% 70%
On-Time delivery
Orders Shipped on Time
Finished goods inventoryturns
Number of OvertimeHours
Days of Inventory On-Hand
41 © Manrodt, Rutner, Holcomb, 2004.
Least Used Time Based Metrics
Percent of Respondents
27.0%
25.0%
20.0%
17.0%
12.0%
0% 5% 10% 15% 20% 25% 30%
Total DC lines per hour
Cartons shipped per hour
Finished Goods InventoryTurns
Time spent picking backorders or stock outs
Dwell Time
22
42 © Manrodt, Rutner, Holcomb, 2004.
Time Based Metrics
More than any other group of metrics, time appears to be the most important element that the firm measuresOn-time delivery and percent of orders
shipped on time are the most commonly used metrics in this areaAs shown in the next chart, firms also
understand the time dimension when it comes to inventory. Both finished goods inventory turns and days of inventory on-hand are the top measures used by most companies
43 © Manrodt, Rutner, Holcomb, 2004.
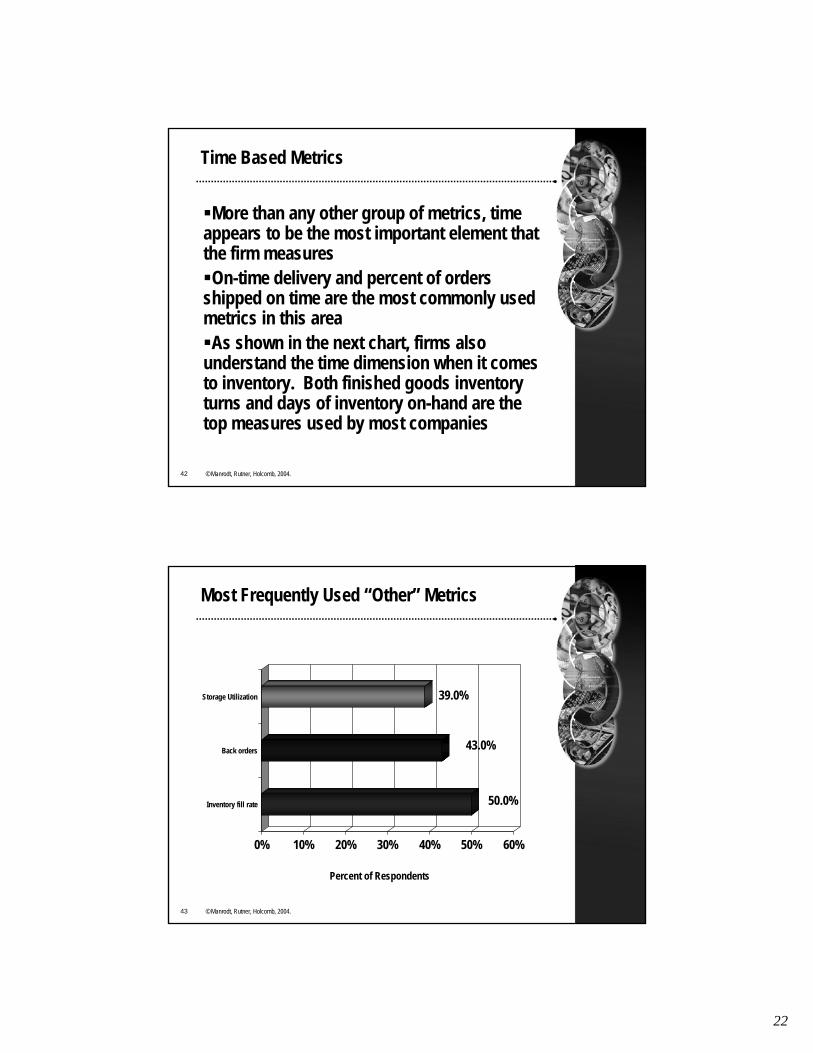
Most Frequently Used “Other” Metrics
Percent of Respondents
50.0%
43.0%
39.0%
0% 10% 20% 30% 40% 50% 60%
Inventory fill rate
Back orders
Storage Utilization
23
44 © Manrodt, Rutner, Holcomb, 2004.
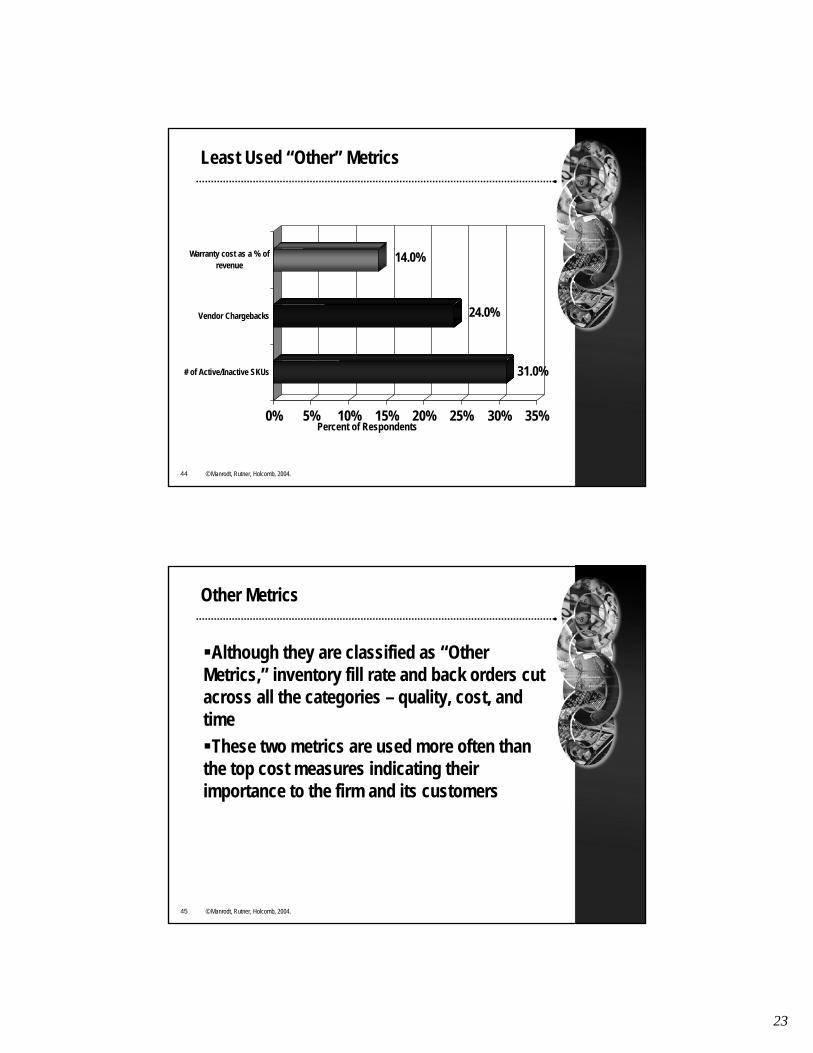
Least Used “Other” Metrics
Percent of Respondents
31.0%
24.0%
14.0%
0% 5% 10% 15% 20% 25% 30% 35%
# of Active/Inactive SKUs
Vendor Chargebacks
Warranty cost as a % ofrevenue
45 © Manrodt, Rutner, Holcomb, 2004.
Other Metrics
Although they are classified as “Other Metrics,” inventory fill rate and back orders cut across all the categories – quality, cost, and timeThese two metrics are used more often than
the top cost measures indicating their importance to the firm and its customers
24
Inventory Management&
Conclusions
47 © Manrodt, Rutner, Holcomb, 2004.
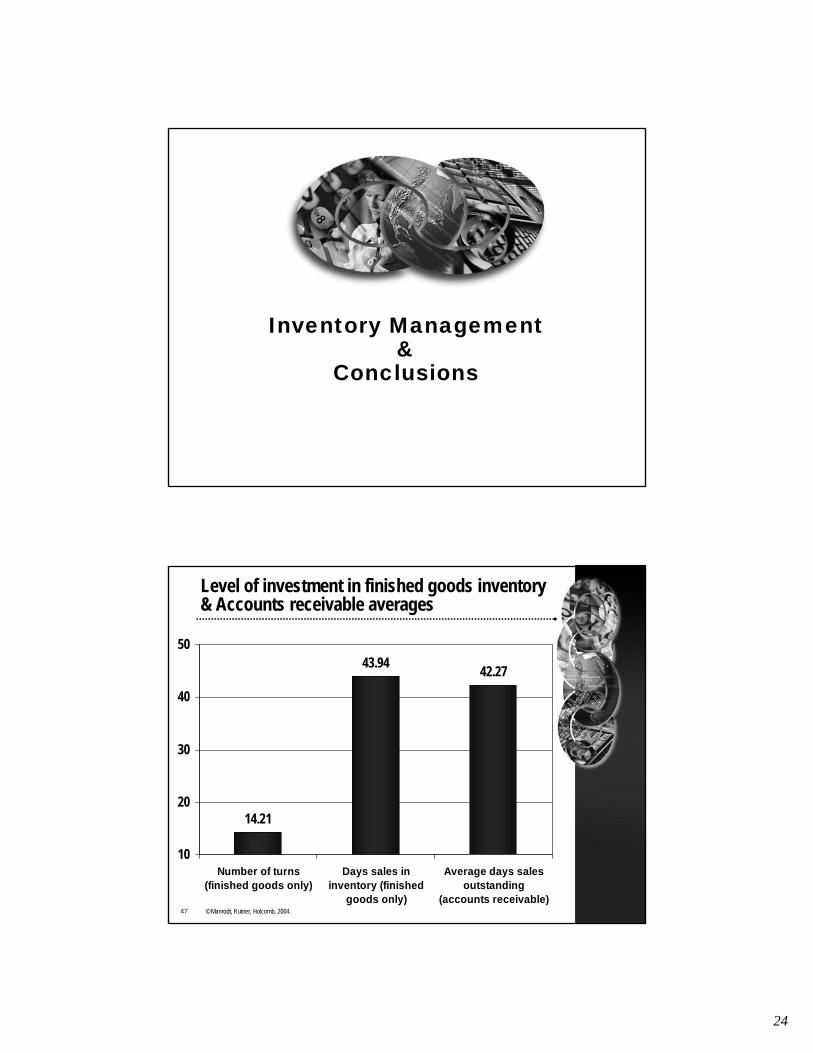
Level of investment in finished goods inventory & Accounts receivable averages
14.21
43.94 42.27
10
20
30
40
50
Number of turns(finished goods only)
Days sales ininventory (finished
goods only)
Average days salesoutstanding
(accounts receivable)
25
48 © Manrodt, Rutner, Holcomb, 2004.
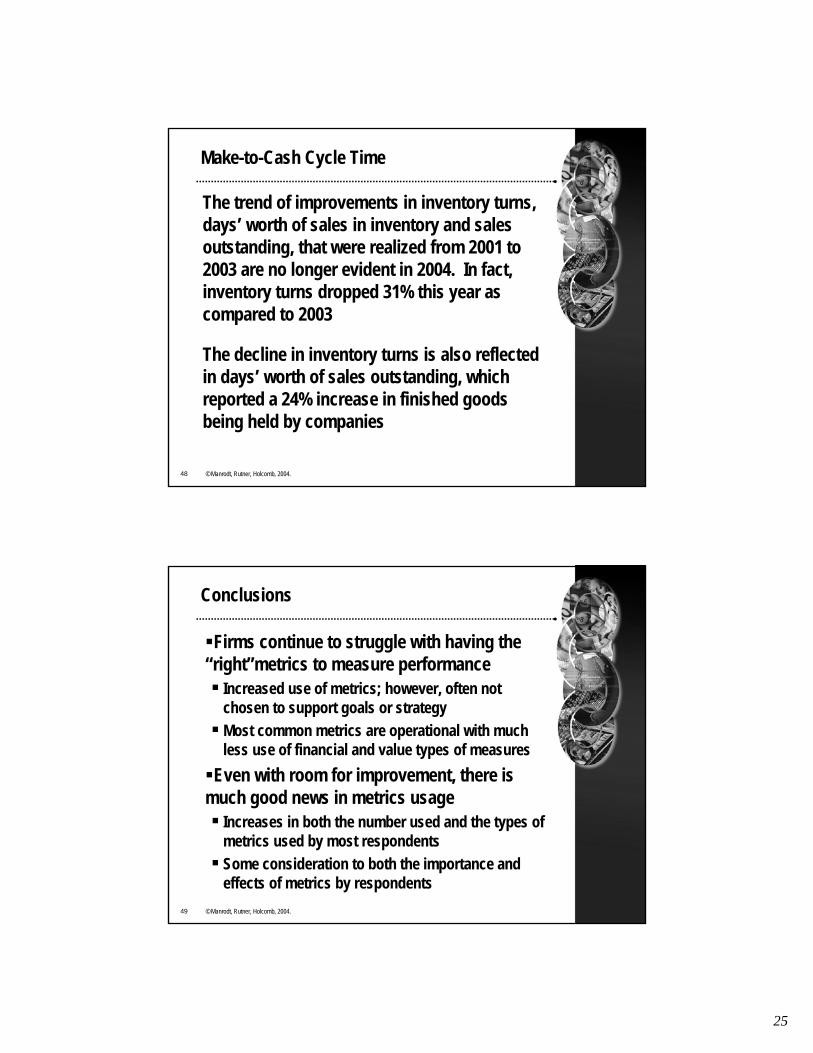
Make-to-Cash Cycle Time
The trend of improvements in inventory turns, days’ worth of sales in inventory and sales outstanding, that were realized from 2001 to 2003 are no longer evident in 2004. In fact, inventory turns dropped 31% this year as compared to 2003
The decline in inventory turns is also reflected in days’ worth of sales outstanding, which reported a 24% increase in finished goods being held by companies
49 © Manrodt, Rutner, Holcomb, 2004.
Conclusions
Firms continue to struggle with having the “right”metrics to measure performance
Increased use of metrics; however, often not chosen to support goals or strategyMost common metrics are operational with much less use of financial and value types of measures
Even with room for improvement, there is much good news in metrics usage
Increases in both the number used and the types of metrics used by most respondentsSome consideration to both the importance and effects of metrics by respondents
26
Demographics
51 © Manrodt, Rutner, Holcomb, 2004.
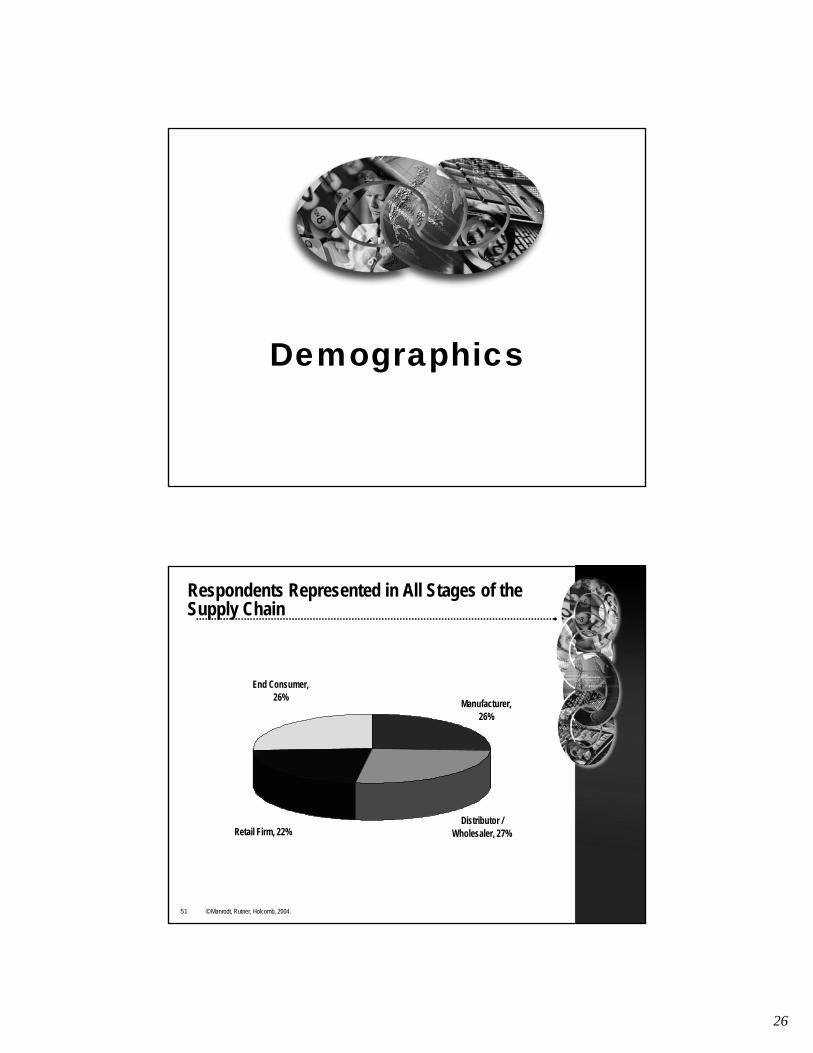
Retail Firm, 22%
End Consumer, 26%
Distributor / Wholesaler, 27%
Manufacturer, 26%
Respondents Represented in All Stages of the Supply Chain
27
52 © Manrodt, Rutner, Holcomb, 2004.
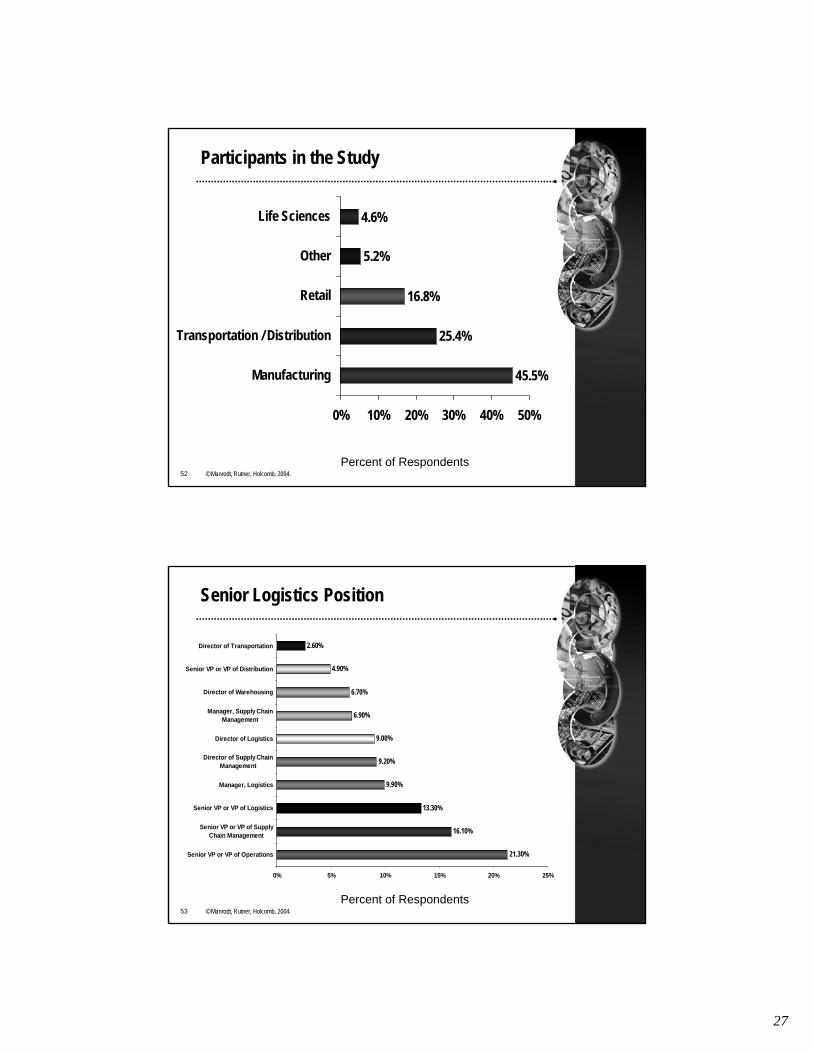
Participants in the Study
45.5%
25.4%
16.8%
5.2%
4.6%
0% 10% 20% 30% 40% 50%
Manufacturing
Transportation / Distribution
Retail
Other
Life Sciences
Percent of Respondents
53 © Manrodt, Rutner, Holcomb, 2004.
Senior Logistics Position
21.30%
16.10%
13.30%
9.90%
9.20%
9.00%
6.90%
6.70%
4.90%
2.60%
0% 5% 10% 15% 20% 25%
Senior VP or VP of Operations
Senior VP or VP of SupplyChain Management
Senior VP or VP of Logistics
Manager, Logistics
Director of Supply ChainManagement
Director of Logistics
Manager, Supply ChainManagement
Director of Warehousing
Senior VP or VP of Distribution
Director of Transportation
Percent of Respondents
28
54 © Manrodt, Rutner, Holcomb, 2004.
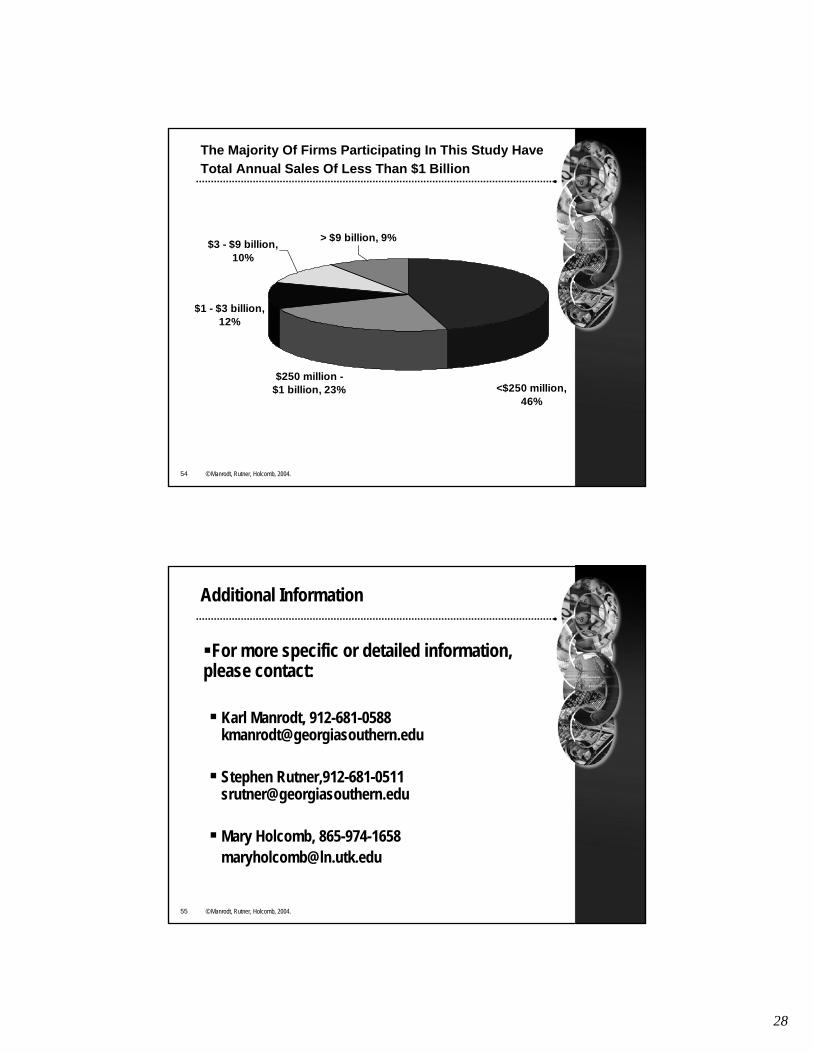
> $9 billion, 9%
$1 - $3 billion, 12%
$3 - $9 billion, 10%
$250 million - $1 billion, 23% <$250 million,
46%
The Majority Of Firms Participating In This Study Have Total Annual Sales Of Less Than $1 Billion
55 © Manrodt, Rutner, Holcomb, 2004.
Additional Information
For more specific or detailed information, please contact:
Karl Manrodt, 912-681-0588 [email protected]
Stephen Rutner,912-681-0511 [email protected]
Mary Holcomb, [email protected]