Embed Size (px)
Citation preview

Measuring of samples with low concentrations: contamination problem
and clean working conditions
Anna Kowalska,Zuzanna Cieśla
Meeting of the Heads of the Laboratories – Pallanza, 7-8 September 2017
Low concentrations
Meeting of the Heads of the Laboratories – Pallanza, 7-8 September 2017
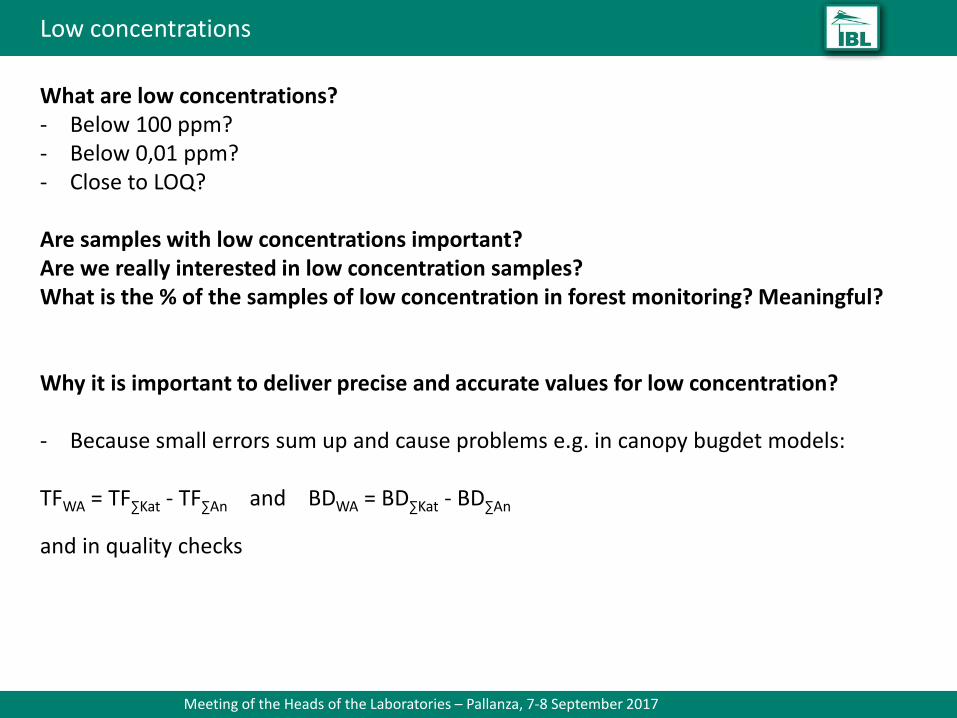
What are low concentrations? - Below 100 ppm?- Below 0,01 ppm?- Close to LOQ?
Are samples with low concentrations important? Are we really interested in low concentration samples? What is the % of the samples of low concentration in forest monitoring? Meaningful?
Why it is important to deliver precise and accurate values for low concentration?
- Because small errors sum up and cause problems e.g. in canopy bugdet models:
TFWA = TF∑Kat - TF∑An and BDWA = BD∑Kat - BD∑An
and in quality checks

Low concentrations in 8th WRT
Meeting of the Heads of the Laboratories – Pallanza, 7-8 September 2017
Sample Cond pH Cl N-NO3 P-PO4 S-SO4N-NH4 Ca Mg Na K Alk. DOC Ntot
Deposition M M M M O M M M M M MM
pH>5M M
Soilsolution
M M M M - M M M M M M M M M
S 1 Stemflow H L H L H H H H L H H L x H
S 2 Throughfall H L L L x L L H L H H L H H
S 3 Bulk Depo L L L L x L H H L L L L L H
S 4 Soil Sol. H H H L x H x H H H L x H H
S 5 Soil Sol. H H H H H H L H H H H x H H
S 6 Syntetic H
H - concentration range highL - concentration range lowx - sample/parameter excluded
0,3-0,8 mg/l
12 µeq/l
0,5 mg/l
pH5,9 0,1
mg/l
0,8-3,9 mg/l
The lower concentration of a parameter in sample the more labs tends to fail in WRT for this sample

Factors that affect the content of trace elements in water
Meeting of the Heads of the Laboratories – Pallanza, 7-8 September 2017
Factors that can affect concentrationlevels of trace components in a liquid sample:1 - contact of sample with laboratory air; 2 - residues of components of dishwashing mixtures; 3 - distilled water; 4 - reagents and solvents employed; 5 - contact with analyst;6 - vaporization of the most volatile components; 7-8 - processes of adsorption-desorption (wall memory effect); 9 - adsorption of analytes on suspension; 10 - precipitation of sediment; 11 - leaching of components from vessel; 12-13 - permeation of solution components through vessel walls; 14 - reaction of analyte with vessel material; 15 - chemical reactions among solution components
Namieśnik J., 2002 Critical Reviews in Analytical Chemistry, 32(4):271–300.

Sources of contamination and error in low concentration analysis
Meeting of the Heads of the Laboratories – Pallanza, 7-8 September 2017
Pipetting –Changing the tips (single use) after each sample → cross-contamination of samplesStorage in vertical position → contamination of the inside of the pipetteTricky two-step button… → wrong volume sampled
Rinsing instruments between samples – with what solute, what volume and how long/howmany times – optimizing analytical method
Operations

Sources of contamination and error in low concentration analysis
Meeting of the Heads of the Laboratories – Pallanza, 7-8 September 2017
Opening, reopening bottles many times → PO4?
Ambient conditions during analysis – dusts in the air, gases, temperature, etc.
As much particulates as 200 µg/m3 have been reported in the air of an analytical laboratory, they contained large amounts of Ca, Si, Fe, Al, Na, Mg, K, Cu, Mn and lesser amounts of several other elements (T. Murphy, National Bureau of Standards Special Publication 422, "Accuracy in Trace Analysis:
Sampling, Sample Handling, and Analysis", Proceedings of the 7th IMR Symposium).
See also Carmen I. presentation from 1st Meeting of the HoL in 2008, Hamburg – runningacid mineralisation of soil or foliar material back to back with analysis of precipitationsamples; vapours of acids as a potential contaminant of water samples
Operations

Sources of contamination and error in low concentration analysis
Meeting of the Heads of the Laboratories – Pallanza, 7-8 September 2017
Storage → Time of storage, temperature, light, preservation
freezing → concentration of phosphate steadily decreased in samples stored for longer than 4 months in -20degC, no effect on nitrate conc. (Clementson L.A.,. Wayte S.E., 1992, Wat. Res. 26:1171-1176).
See also presentation by Nils K. and others from 2013, Meeting of the HoL in Zadar, Effects of storage in field and in laboratory and influence of temperature and light on the chemistry of forest water samples.
Dissolving of metals after acidification of water sample
Operations

Sources of contamination
Meeting of the Heads of the Laboratories – Pallanza, 7-8 September 2017
Filters –Paper filters – NH4+, Ca, Mg releasingFilter material may be adsorbing some metal from the solution phase or may be releasing
metals to the solution (Hedberg et al 2011).
Blank values of 10 elements in 19 different filter types from Gelman, Millipore, Nucleporeand Whatman have been compared by extraction with dilute nitric acid:
Glass fiber filters - high blank values for a number of elements,PTFE filters - the cleanest ones,Most filter - high blank values of one or more elements of environmental interest (Cr, Zn,
B, Cr, Mg, Mo, Na, Zn) (Berg. T, Royset. O. 1993. Atm. Env., 27:12435-2439).
Whatman 1.2 µm pore size glass microfibre –
Materials, consumables
(Matoug, I.O.M., 2013, IOSR-JESTFT, 3(5):59-61.)

Sources of contamination
Meeting of the Heads of the Laboratories – Pallanza, 7-8 September 2017
Labware: bottles, caps, flasks… -Cd from red caps on plastic bottles, Hg, Zn from plastic bottles, Fe, Na from glass bottles.
Al, Pb, Ca are also common contaminants (source: Hill Laboratories, New Zealand)
N from bottle caps – see Daniel Ž. presentation from 1st Meeting of the HoL in 2008 in Hamburg and 2nd in 2009 in Warsaw - N determination by peroxodisulfate digestion in autoclave followed by spectrometer determination of nitrate at 220 nm in SCHOTT DURAN autoclavable bottles 50 mL
Ca, Mg realeasing from walls of the PE bottles that were used for samples containing high concentration, see Carmen I. presentation from 1st Meeting of the HoL in 2008, Hamburg
Ageing of the materials of which the bottles are made
Materials, consumables

Sources of contamination
Meeting of the Heads of the Laboratories – Pallanza, 7-8 September 2017
Clothes –Gloves not containing talc powder → Mg contaminationGloves → contact of samples/instruments (pipette, plastic and glass labware,..) with skin
has to be avoided
Materials, consumables
Human sweat - Na 863 µg/mL; K 222 µg/mL, Ca 16 µg/mL, Mg 1,3 µg/mL, Zn 355-655 µg/mL, Cu 80 ng/mL.Montain SJ, Cheuvront SN, Lukaski HC. Int J Sport Nutr Exerc Metab. 2007;17(6):574-82
Concentrations of major (Na, K, Ca, and Mg) and trace elements (Zn, Cu, Fe, Ni, Mn, and Cr) in sweat tends to be lower in summer than in winter. Hoshi A., Watanabe H., Chiba M.,Inaba Y., Kobayashi M., Kimura N., Ito T., 2002. Environ Health Prev Med, 7:60-63
Sources of contaminations
Meeting of the Heads of the Laboratories – Pallanza, 7-8 September 2017
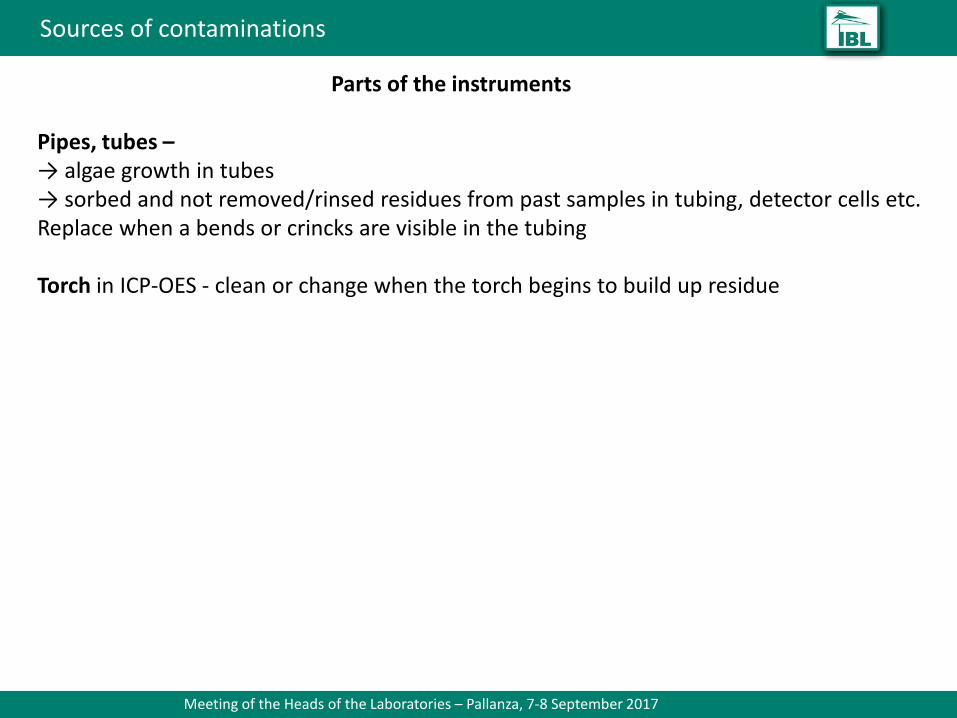
Pipes, tubes –→ algae growth in tubes→ sorbed and not removed/rinsed residues from past samples in tubing, detector cells etc.Replace when a bends or crincks are visible in the tubing
Torch in ICP-OES - clean or change when the torch begins to build up residue
Parts of the instruments

Sources of contamination
Meeting of the Heads of the Laboratories – Pallanza, 7-8 September 2017
Reagent grade/purity
Reagent manufacturer
Reagent LOT
Reagents after the expiration date?
Reagents

Sources of contamination
Meeting of the Heads of the Laboratories – Pallanza, 7-8 September 2017
Water
(source: Dr Paul Whitehead, ELGA LabWater materials)
←splashing
← collecting waterby flowing it along walls, no splashing
When ultra-pure water is dispensed it is important that there is as little air entrainment as possible.
The contamination from the atmosphere was compared by anion analysis by ion chromatography:
Measures to improve analysis of low concentration samples
Meeting of the Heads of the Laboratories – Pallanza, 7-8 September 2017
Washing and cleaning- Use of tested dishwashing agents, develop procedures for cleaning, washing, drying of
labware- Test the vessels before use and test occasionally later
Methods- Proper validation and optimization,- Spectral interferences – background correction,- Internal standards,- …
Calibration –See the presentation of Gabriele T. and Aldo M. from Meeting of the HoL in 2011, Arcachon: Measurements of low values in IC, Examples for SO4=, NH4+ and Na+.

Measures to improve analysis of low concentration samples
Meeting of the Heads of the Laboratories – Pallanza, 7-8 September 2017
Calibration cont. - calibration range low/high; example: NH4+ in WRT samples, Ion chromatography, Dionex
system, MSA eluent,
No. Sample
Calibrationlow range (0,01-1,4
mg/L)
Calibrationhigh range
(1-10 mg/L)
high/lowin %
NH4+ NH4+1 C17-ICR 024 (0,2M) 0,2058 0,0438 21,29%2 C17-ICR 024 (0,2M) 0,2056 0,0434 21,09%3 CW14-2 LRM 0,2552 0,0880 34,49%4 CW16-1 LRM 1,2060 1,2002 99,52%5 Sample 1/ bottl. 97 1,1381 1,1223 98,61%6 Sample 1/ bottl. 104 1,1243 1,1063 98,41%7 Sample 2/ bottl. 195 0,3519 -0,1959 -55,68%8 Sample 2/ bottl. 199 0,3467 0,1772 51,10%9 Sample 3/ bottl. 291 0,6364 0,5434 85,40%
10 Sample 3/ bottl. 293 0,6354 0,5424 85,36%11 Sample 4/ bottl. 389 0,0326 -0,1581 -485,19%12 Sample 4/ bottl. 391 0,0244 -0,1827 -750,11%13 Sample 5/ bottl. 481 0,1871 0,0153 8,15%14 Sample 5/ bottl. 487 0,1949 0,0325 16,67%

Measures to improve analysis of low concentration samples
Meeting of the Heads of the Laboratories – Pallanza, 7-8 September 2017
Calibration cont. - fitting of the calibration curve: example of anion analysis, Dionex system, eluent NaHCO3-
Na2CO3:
No. Ret.Time Peak Name Cal.Type Points Offset Slope Curve Coeff.Det.
ECD_1 ECD_1 ECD_1 ECD_1 ECD_1 ECD_1 ECD_1 ECD_1 ECD_1
min (C0) (C1) (C2) %
1 5,28 Cl Y0LOff 7 -0,0048 0,3924 0,0000 99,7005
No. Ret.Time Peak Name Cal.Type Points Offset Slope Curve Coeff.Det.
ECD_1 ECD_1 ECD_1 ECD_1 ECD_1 ECD_1 ECD_1 ECD_1 ECD_1
min (C0) (C1) (C2) %
1 5,27 Cl Y0QOff 7 0,0016 0,3409 0,0069 99,9926
Bad choice: Linear with 0 point for curve fitting
Better choice: Quadratic with 0 point for curve fitting

Measures to improve analysis of low concentration samples
Meeting of the Heads of the Laboratories – Pallanza, 7-8 September 2017
The lower the required detection limit for the parameterthe more important it is to analyse blanks.
Bad habits:- Not using blanks- Not enough frequently using blanks- Badlly prepared blanks, omitted sources of possible contamination (reagents, matrix,
solvents, bottles, etc.)
Blanks
Control charts for reference material
Bad habits:- Not using control charts- Not enough frequently using control charts- Too high concentration in reference material used for control charts in relation to the
sample content- Not reacting to exceedances of limits

Measures to improve analysis of low concentration samples
Meeting of the Heads of the Laboratories – Pallanza, 7-8 September 2017
Thank you for your attention