Embed Size (px)
Citation preview

Power System Engineering, Inc.
© 2012 Power System Engineering, Inc.
Steve Fenrick
Power System Engineering, Inc.Web Site: www.powersystem.org
May 9, 2012
Power System Engineering, Inc.
Measuring Performance and Setting Appropriate Reliability Targets
(presented at 2012 MEA Electric Operations Conference)

Power System Engineering, Inc.
© 2012 Power System Engineering, Inc.
About PSE
• Founded in 1974
• Headquartered in Madison, WI with offices in MN, OH, IN, IA, and SD
• Serving utilities & regulators
• Engineering, Economics, Rates, Technology Experts in the Utility Industry
2

Power System Engineering, Inc.
© 2012 Power System Engineering, Inc.
Learning Objectives1. Introduction to statistical benchmarking
2. Why sound benchmarking is important
3. Case study of setting reliability targets and evaluating performance for two Midwest utilities
3
Agenda
Power System Engineering, Inc.
© 2012 Power System Engineering, Inc.
How Benchmarking Can Improve Utility Operations
1. Utility can better understand how its reliability levels compare to what is achievable
2. Develop strategic plans to maintain strengths and address identified weaknesses
3. Setting and tracking of near-term and long-term targets, goals, and incentives
4. Better understanding of how regional circumstances impact reliability
5. Understanding how other utilities are doing and investigating why
4
Power System Engineering, Inc.
© 2012 Power System Engineering, Inc.
Regulatory Uses Include:• Rate case filings can show reliability performance
levels
• Regulators sometimes set targets and attach financial penalties and rewards
• Investigations in the wake of significant outages typically caused by storms
– Best to be proactive and have a defensible methodology and strategy already in place
5
A+ or F

Power System Engineering, Inc.
© 2012 Power System Engineering, Inc.
Regulatory Approaches to Reliability
• Leave it to the utility to decide• Leave it to the utility to decide
Hands-off
• Utility reports reliability indexes to regulator• No explicit target or financial implications• Utility reports reliability indexes to regulator• No explicit target or financial implications
Monitor Reliability
• Regulator sets appropriate reliability target• If utility misses the target it must submit a plan to rectify the situation• Regulator sets appropriate reliability target• If utility misses the target it must submit a plan to rectify the situation
Target Setting/Benchmark Goal
• Financial penalties and rewards attached to hitting or missing target• Financial penalties and rewards attached to hitting or missing target
Reward/Penalty System
• Regulator tells utility how to design and build its system• Regulator tells utility how to design and build its system
Design Mandates
6

Power System Engineering, Inc.
© 2012 Power System Engineering, Inc.
What Statistical Benchmarking is Not� Performance benchmarking is not making unadjusted
rate or reliability comparisons to other utilities
� To properly investigate performance, these circumstances cannot be ignored
� Proper targets should reflect the realities of the service territory
� If not, reliability initiatives will likely either be under-funded or over-funded
7

Power System Engineering, Inc.
© 2012 Power System Engineering, Inc.
What Statistical Benchmarking Is� Benchmarking is a means of establishing data value
expectations using industry data and external factors
� Need to make “apples-to-apples” comparisons
Challenging given the large differences in utility circumstances (e.g., customer density, forestation, undergrounding)
8
SAIDI Performance

Power System Engineering, Inc.
© 2012 Power System Engineering, Inc.
Two Approaches Popular in North America
1. Peer Group Approach
2. Econometric Approach
9
Power System Engineering, Inc.
© 2012 Power System Engineering, Inc.
Peer Group ApproachPeer Group Approach
1. Determine group of very similar utilities and compare data
• Balance between desire for a large sample and for utilities that share circumstances
2. Compare utility data to peer group statistics
• Make conclusions and set targets based on the relative performance of the company to this peer group
10
Conclusion:Good method if a group of utilities with very similar circumstances can be identified
Power System Engineering, Inc.
© 2012 Power System Engineering, Inc.
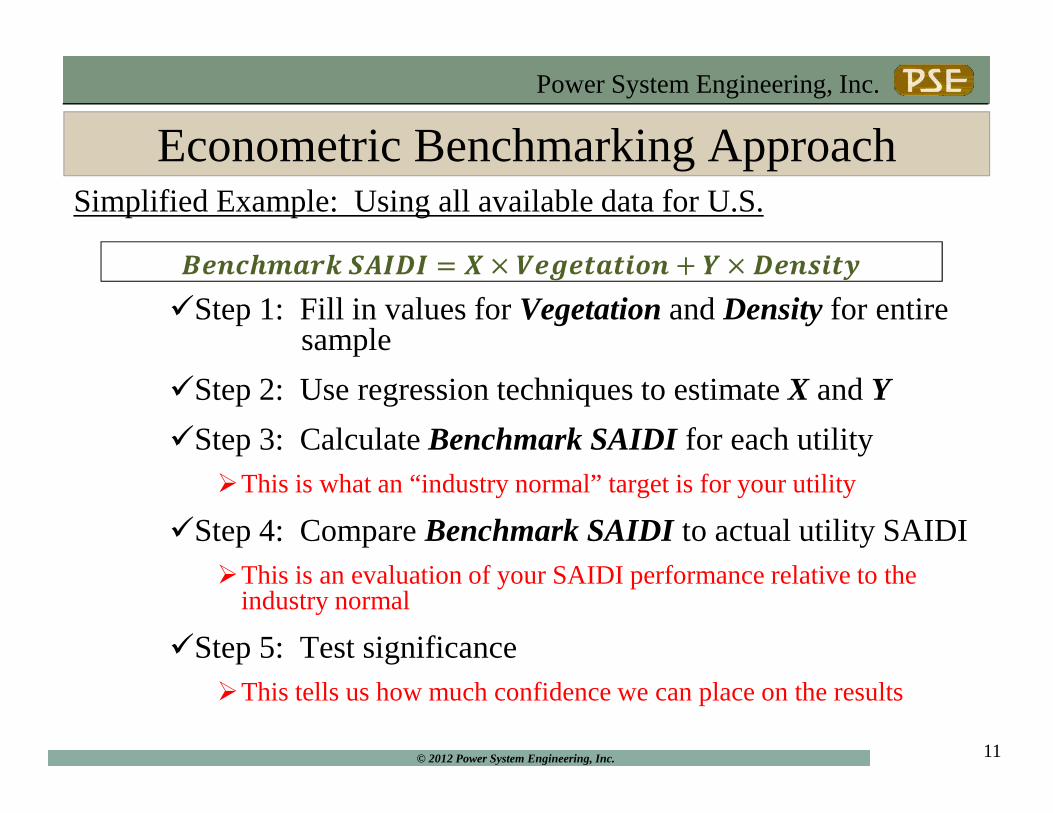
Econometric Benchmarking ApproachSimplified Example: Using all available data for U.S.
�Step 1: Fill in values for Vegetationand Densityfor entire sample
�Step 2: Use regression techniques to estimate X and Y
�Step 3: Calculate Benchmark SAIDI for each utility�This is what an “industry normal” target is for your utility
�Step 4: Compare Benchmark SAIDI to actual utility SAIDI�This is an evaluation of your SAIDI performance relative to the
industry normal
�Step 5: Test significance�This tells us how much confidence we can place on the results
11

Power System Engineering, Inc.
© 2012 Power System Engineering, Inc.
Examples of Variables to Include
12
Reliability Target
Vegetation
Customer Density
# of Customers
Percentage of Undergrounding
MED definition

Power System Engineering, Inc.
© 2012 Power System Engineering, Inc.
NRRI’s Thoughts on the Two Approaches
13
Method Ease of Application Reliability of Results Data Requirements
Peer Group Easy to Apply Not Reliable/Medium Reliability Low Data Requirements
Econometric Medium/High Difficulty Medium/High Reliability High Data Requirements
*** Source: National Regulatory Research Institute
High accuracy of results is necessary to give regulators and managers confidence to act on
benchmarking results!
Power System Engineering, Inc.
© 2012 Power System Engineering, Inc.
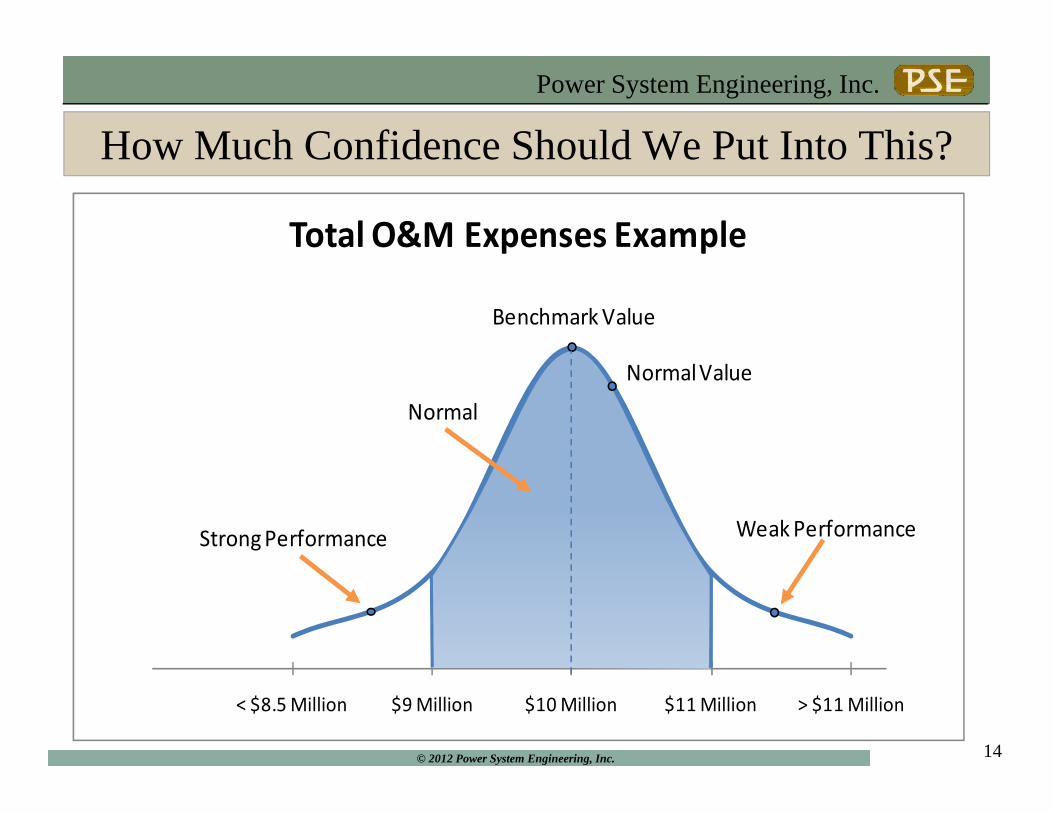
How Much Confidence Should We Put Into This?
14
< $8.5 Million $9 Million $10 Million $11 Million > $11 Million
Total O&M Expenses Example
Strong Performance Weak Performance
Benchmark Value
Normal Value
Normal

Power System Engineering, Inc.
© 2012 Power System Engineering, Inc.
Most Popular Reliability Indexes
15
• SAIDI: Sustained Average Interruption Duration Index
– Sum of all sustained outage minutes experienced by customers divided by total customers
• SAIFI: Sustained Average Interruption Frequency Index
– Sum of the number of sustained outages experienced by customers divided by total customers
• CAIDI: Customer Average Interruption Duration Index
– SAIDI/SAIFI (Average duration during an outage)
Power System Engineering, Inc.
© 2012 Power System Engineering, Inc.
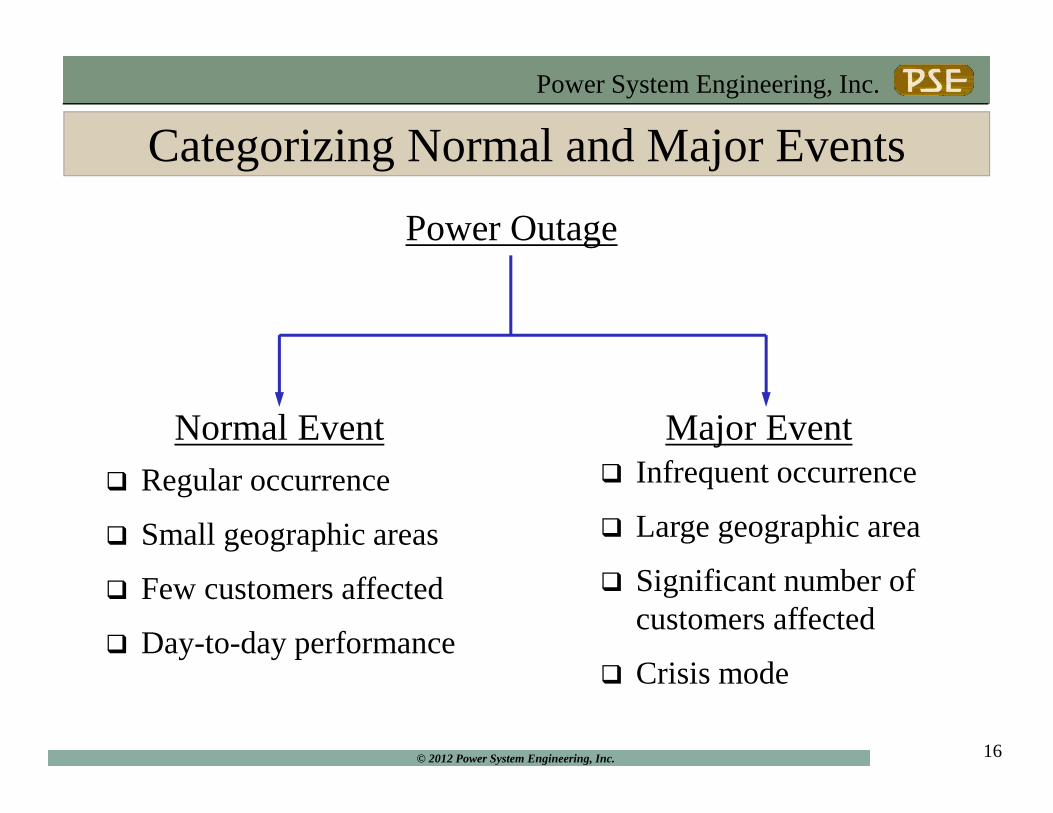
Categorizing Normal and Major Events
16
Power Outage
Normal Event Major Event� Regular occurrence
� Small geographic areas
� Few customers affected
� Day-to-day performance
� Infrequent occurrence
� Large geographic area
� Significant number of customers affected
� Crisis mode

Power System Engineering, Inc.
© 2012 Power System Engineering, Inc.
Typical Causes of Major Events
17
� Extreme Winds
� Ice Storms
� Early Snow Storms
� Forest Fires
� Floods
� Cascading Blackout
Power System Engineering, Inc.
© 2012 Power System Engineering, Inc.
Definition of a Major Event Day• Major Event Day (MED) definitions vary by
jurisdiction and utilities
• IEEE 1366-2003 is becoming more standard
– 2.5 beta methodology
• Other approaches include defining a severe day if 10% or 15% of customers affected
– Some definitions have time durations attached
18
Power System Engineering, Inc.
© 2012 Power System Engineering, Inc.
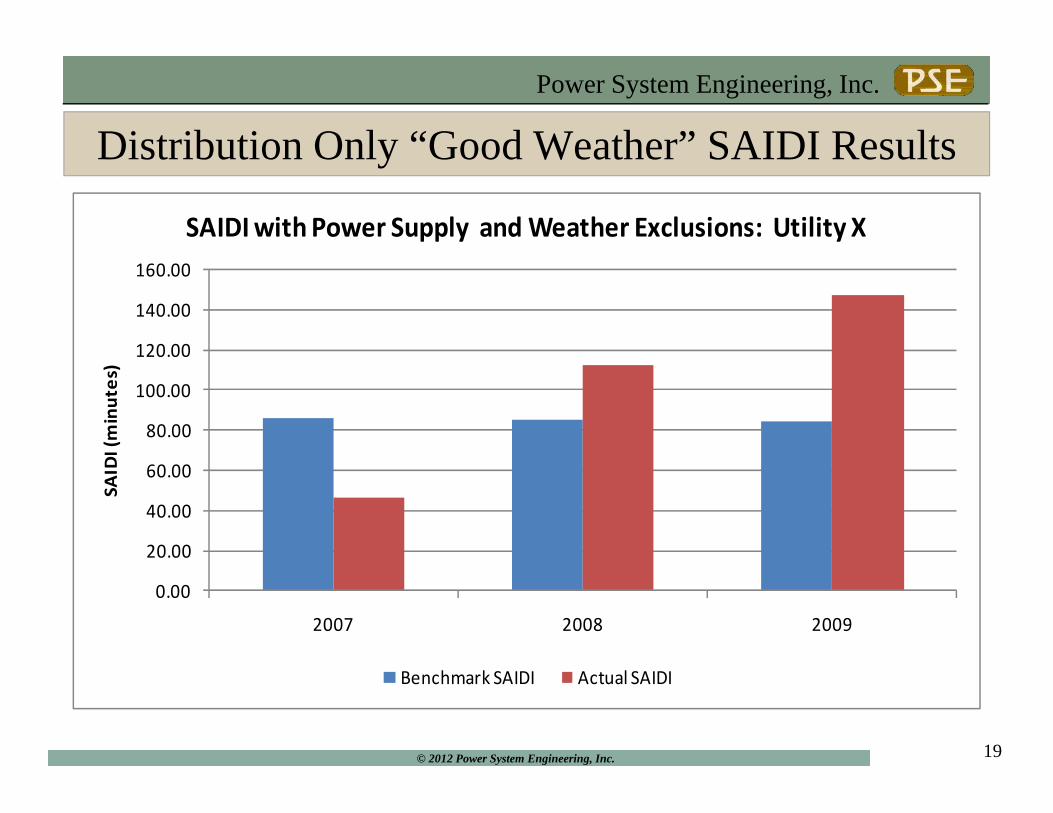
Distribution Only “Good Weather” SAIDI Results
19
0.00
20.00
40.00
60.00
80.00
100.00
120.00
140.00
160.00
2007 2008 2009
SA
IDI
(min
ute
s)
SAIDI with Power Supply and Weather Exclusions: Utility X
Benchmark SAIDI Actual SAIDI
Power System Engineering, Inc.
© 2012 Power System Engineering, Inc.
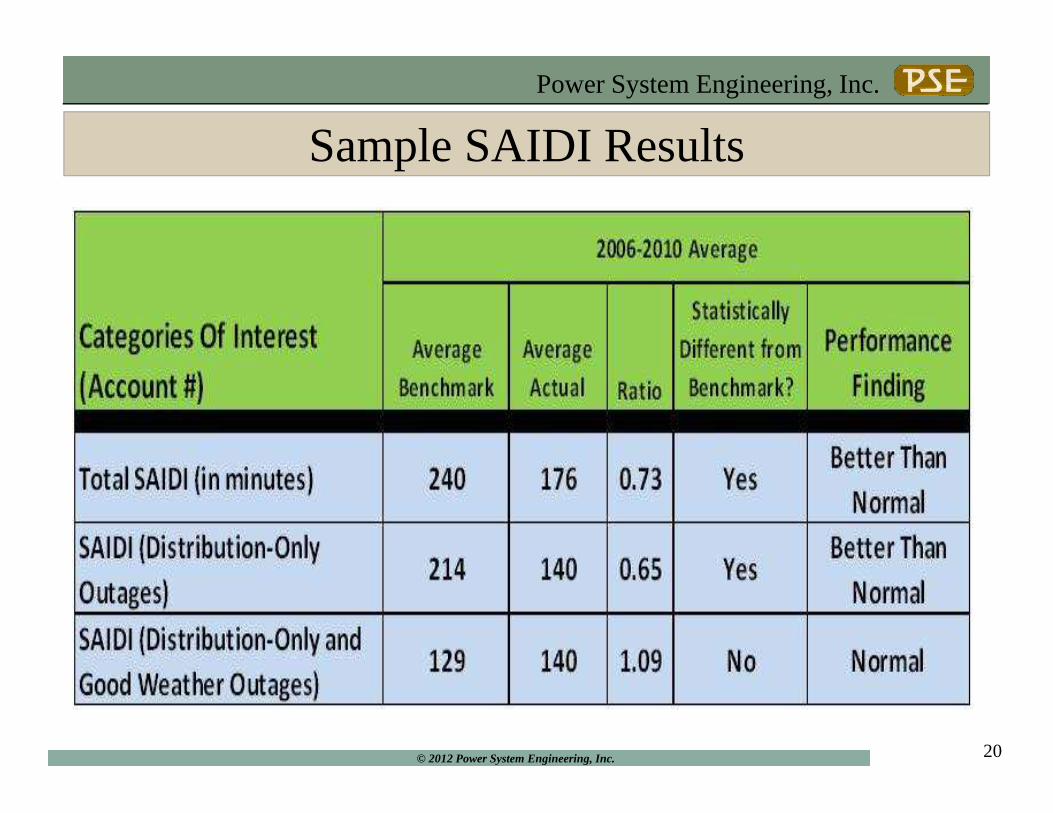
Sample SAIDI Results
20

Power System Engineering, Inc.
© 2012 Power System Engineering, Inc.
Why It’s So Important to Adjustfor Service Territory Characteristics
• Especially true in distribution functions where assets are literally spread all across the service territory
– Unlike most industries with concentrated production facilities (factories, power plants)
• Simple benchmarking comparisons will likely be misleading
• “Apples to apples”
21
Power System Engineering, Inc.
© 2012 Power System Engineering, Inc.
Targets by Region• Geographic regions within a utility could also have
separate targets
– Urban versus rural areas
– Vegetation differences in certain regions
– Undergrounding differences
• Probably not an optimal strategy to have the same reliability across diverse regions
– Some are more challenging than others
– Will cost a lot more to hit the same target in one region versus another region
22

Power System Engineering, Inc.
© 2012 Power System Engineering, Inc.
Reliability Benchmarking Case Study• Sample of 76 U.S. IOUs
• Publically available data
• Major Event Day outages excluded
23
Variable Units Mean Std. Dev. Max Min
SAIDI Index 132.99 67.40 520.50 29.50
SAIFI Index 1.21 0.46 3.87 0.47
Number of Customers Number 970,946 1,109,545 5,278,736 25,878
% plant underground Percent 0.20 0.10 0.48 0.02
Density Ratio 43.94 23.05 150.09 16.74
% service Territory Forested Percent 0.41 0.25 0.94 0.00
Power System Engineering, Inc.
© 2012 Power System Engineering, Inc.
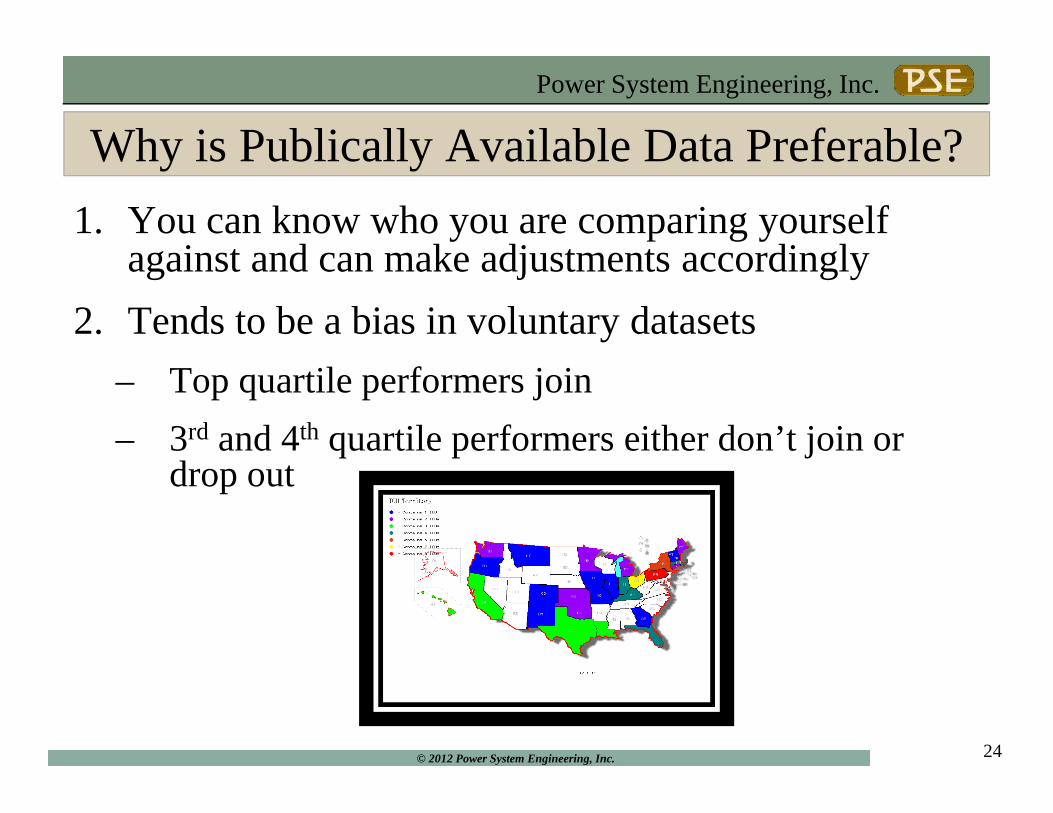
Why is Publically Available Data Preferable?
1. You can know who you are comparing yourself against and can make adjustments accordingly
2. Tends to be a bias in voluntary datasets
– Top quartile performers join
– 3rd and 4th quartile performers either don’t join or drop out
24
Power System Engineering, Inc.
© 2012 Power System Engineering, Inc.
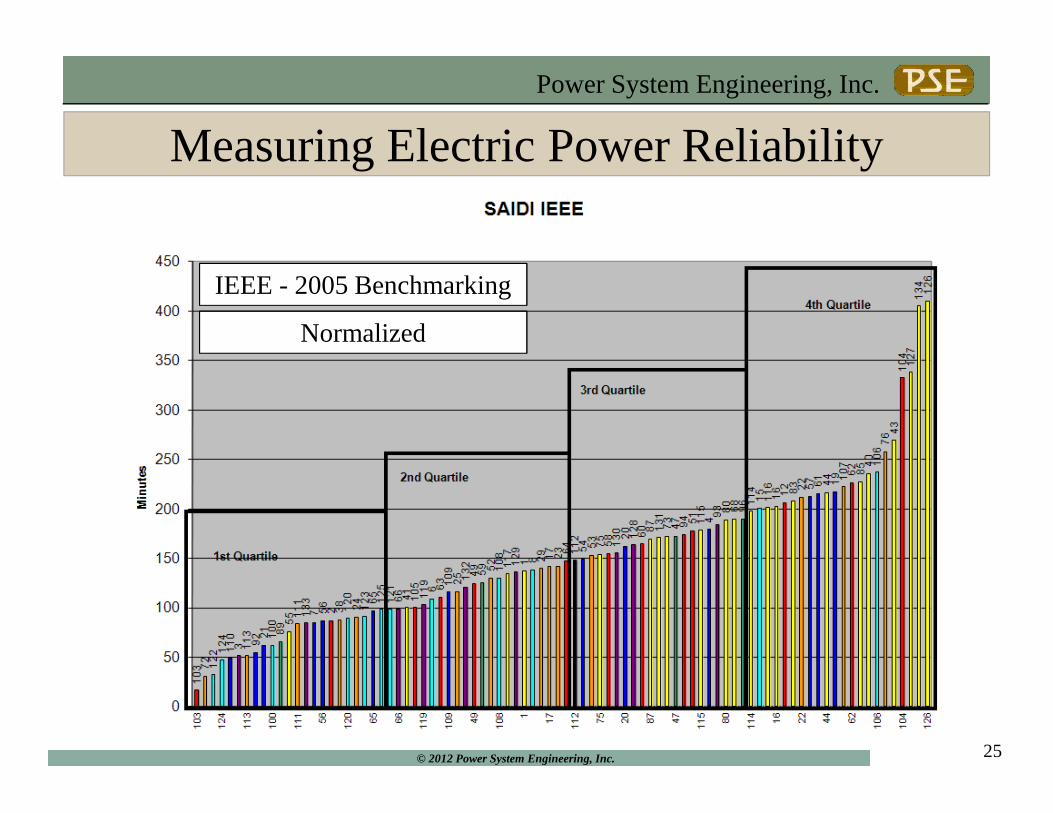
Measuring Electric Power Reliability
25
IEEE - 2005 Benchmarking
Normalized

Power System Engineering, Inc.
© 2012 Power System Engineering, Inc.
Rural IOU vs. Urban IOU• Rural IOU is smaller, less dense, less undergrounding,
but with more vegetation than the Urban IOU
• Who is just naturally going to have the better reliability indexes?
– Targets based on industry indexes will likely be too challenging for the rural utility and not challenging enough for the urban utility.
• Said another way, the rural utility’s target will cause them to spend too much on reliability and the urban utility’s target will cause them to spend too little on reliability (relative to industry norms)
26

Power System Engineering, Inc.
© 2012 Power System Engineering, Inc.
Developed Econometric Models• SAIFI model with no MED outages
27
Translog Model
parameter estimate
Box-Cox Model
parameter estimate
CONST 0.070** 0.070**
N -0.050** -0.032**
D -0.098** -0.110**
U -0.080** -0.114**
F 0.102** 0.108**
D^2 -0.055 -0.071
U^2 -0.021 -0.037
F^2 0.029** 0.031**
D*U 0.172** 0.131*
D*F 0.126** 0.138**
U*F -0.141** -0.143**
IEEE -0.017 -0.007
TREND 0.000 -0.002
Rbar-sqr 0.322 0.321
λ -0.200
**Coefficient estimates significant at least at the 95% confidence level.
*Coefficient est imates significant at least at the 90% confidence level.
Power System Engineering, Inc.
© 2012 Power System Engineering, Inc.
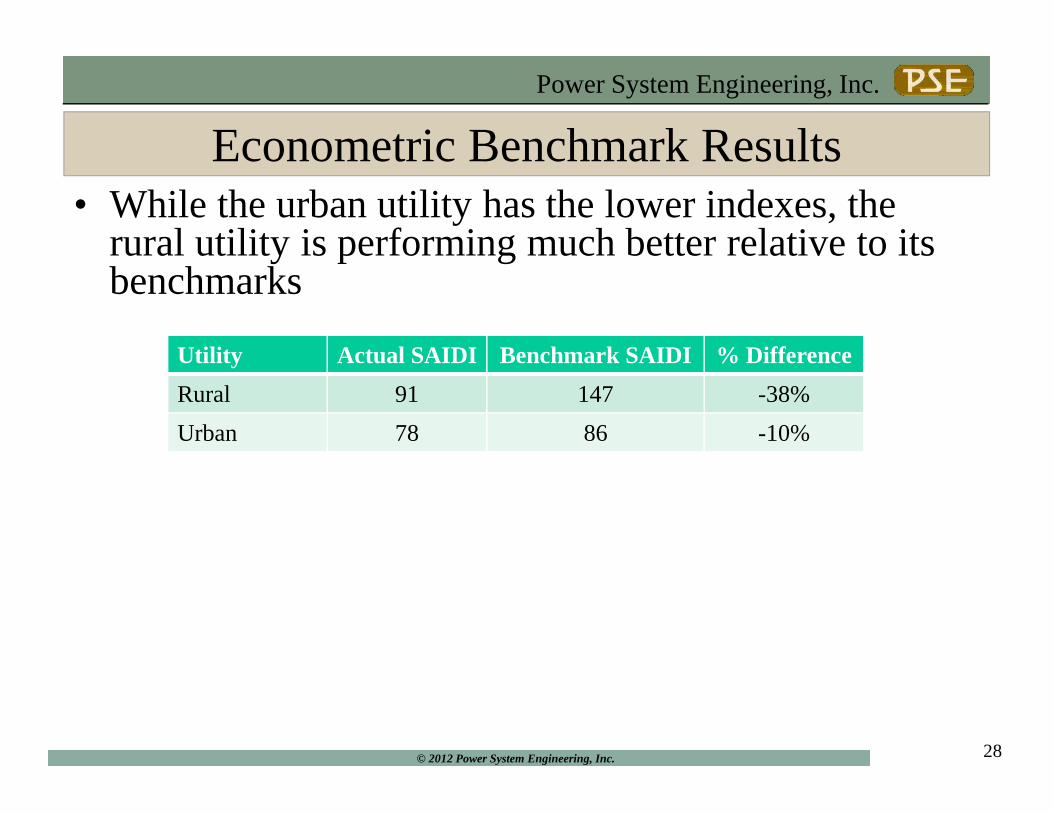
Econometric Benchmark Results• While the urban utility has the lower indexes, the
rural utility is performing much better relative to its benchmarks
28
Utility Actual SAIDI Benchmark SAIDI % Difference
Rural 91 147 -38%
Urban 78 86 -10%
Power System Engineering, Inc.
© 2012 Power System Engineering, Inc.
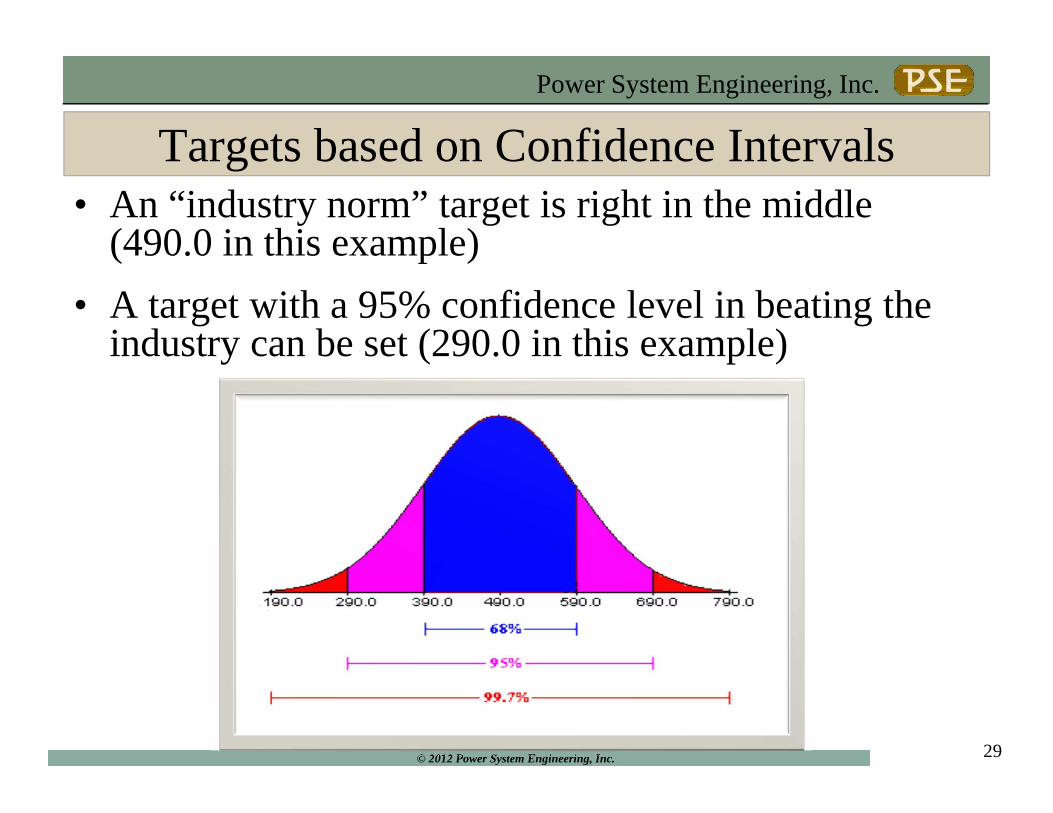
Targets based on Confidence Intervals• An “industry norm” target is right in the middle
(490.0 in this example)
• A target with a 95% confidence level in beating the industry can be set (290.0 in this example)
29
Power System Engineering, Inc.
© 2012 Power System Engineering, Inc.
Summary� Reliability benchmarking can be used to:
1. Evaluate past performance and communicate this to internal management and external stakeholders
2. Set internal goals and targets (utility-wide and by region)
3. Help in determining if reliability-driven capital and O&M spending should increase or decrease (and in what region) to align with corporate goals
� Proper benchmarking requires adjustments to the service territory conditions faced by utilities
1. Peer group
2. Econometric
30
Power System Engineering, Inc.
© 2012 Power System Engineering, Inc. 31
Q u e s t i o n s ?Power System Engineering, Inc.
Steve Fenrick, M.S. Leader, Benchmarking and Economic StudiesDirect: 608-268-3549Email: [email protected]
Website: www.powersystem.org
Power System Engineering, Inc.