Embed Size (px)
Citation preview

Measuring Power in your Data Center:
The Roadmap to your PUE
and Carbon Footprint
2
Air
Movement
12%
Electricity
Transformer/
UPS
10%
Lighting, etc.
3%
Cooling
25%
IT Equipment
50%
Source: EYP Mission Critical Facilities Inc., New York
Energy usage in the data center
Lawrence Berkeley National Laboratory study on data center power allocation:
• 46 percent used by IT equipment such as servers
• 23 percent used by HVAC cooling equipment
• 8 percent by HVAC fans
• 8 percent by uninterruptible power supply (UPS) equipment losses
• 4 percent by lighting
• 11 percent other uses, e.g., misc. electrical losses, support office area, etc.
Source: EPA
3
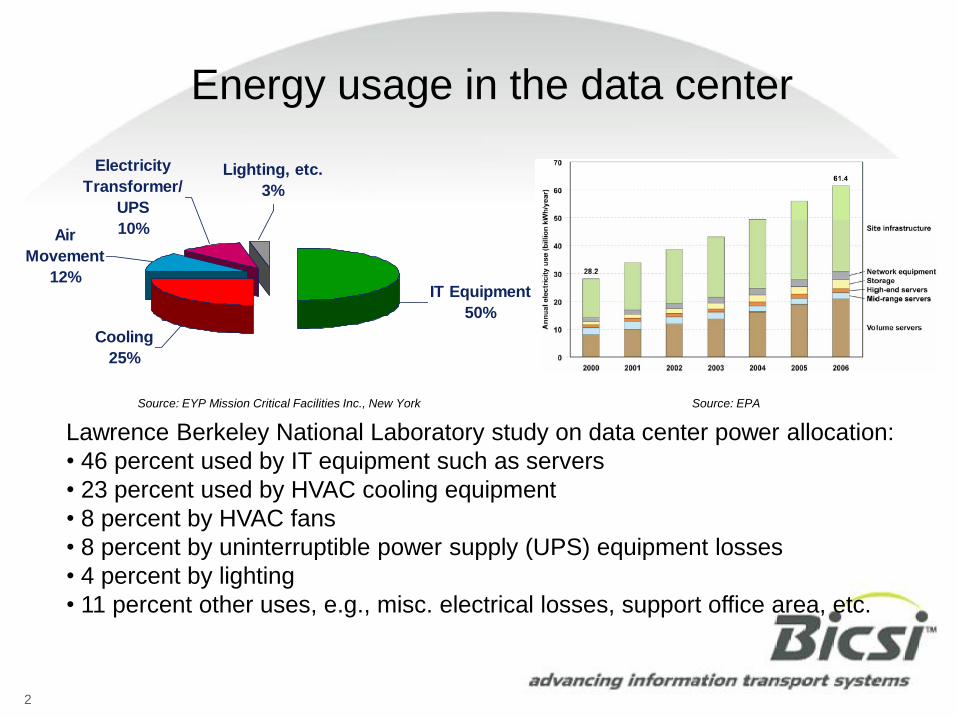
PUE = Total Facility Power
IT Equipment Power
3
Source: EYP Mission Critical Facilities Inc., New York
Metrics: PUE, DCiE, and Carbon Footprint
DCiE = IT Equipment Power
Total Facility Power
Example Carbon Factors:
Gas G = 0.19 kg/kwh
Coal G = 0.35 kg/kwh
CO2 = 8760 hours x 10 Mw x .35 kg/kwh
CO2 = 30,660,000 kg (about 6759* cars)
Assumptions: 10Mw total, 5 Mw IT, £0.08/kwh,
7x24 operation
PUE = 10 Mw/5 Mw = 2.0, DCiE = 50%
8760 hours x £0.08/kwh x 10 Mw =
£6.9M annual cost of power
*based on ~12k miles and ~4536kg
Carbon Emissions (kg) =
Energy (kwh) * Carbon Factor (kg/kwh)
x 100%

4
Why measure?
“Because you can’t manage what
you don’t measure”
– How do you know your Data
Center PUE?
– Will you be able to comply to to
CRC or ASHRAE future
guidelines?
– How do you know how close
you are to tripping a breaker?
– How do you know if you have
the power capacity for more IT
equipment?
– How do you know whether
you’re over cooling or have
hotspots?
– How do you know the impact of
any change?
5
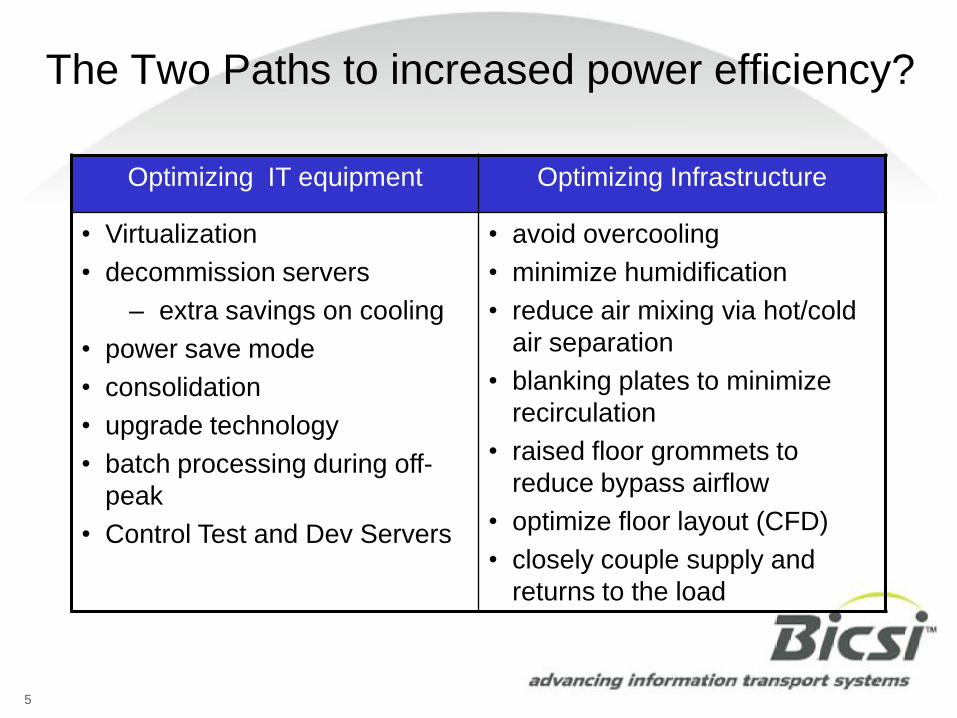
The Two Paths to increased power efficiency?
Optimizing IT equipment Optimizing Infrastructure
• Virtualization
• decommission servers
– extra savings on cooling
• power save mode
• consolidation
• upgrade technology
• batch processing during off-
peak
• Control Test and Dev Servers
• avoid overcooling
• minimize humidification
• reduce air mixing via hot/cold
air separation
• blanking plates to minimize
recirculation
• raised floor grommets to
reduce bypass airflow
• optimize floor layout (CFD)
• closely couple supply and
returns to the load

6
What do you measure?
Measurements for Optimising IT
equipment
Measurements for Optimizing
Infrastructure
• Actual IT Load
– IT Device
– Department
– Application
• IT Utilisation
– CPU cycles/power usage
– Actual Business Benefit
– Department Allocation
• Branch Circuit Monitoring
• Room Temperature
• Rack Temperature
• PuE
• Airflow
• Humidity

77
Where to measure power
Uptime Institute, “4 Metrics That Define Data Center Greenness”
8
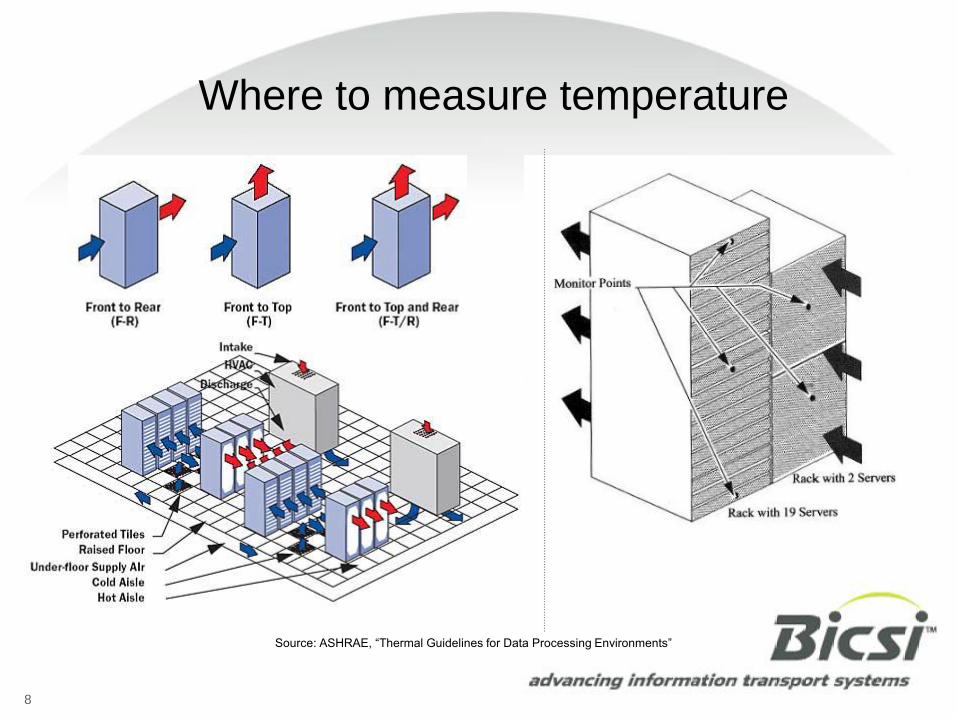
Where to measure temperature
Source: ASHRAE, “Thermal Guidelines for Data Processing Environments”

9
What to look for in a solution
• Accuracy
– Real measured data vs. assumptions-based calculations, e.g., kwh
– Metering optimized for real-world conditions vs. lab
• Depth of data
– Just current vs. watts, power factor, voltage
– Building or UPS level vs. individual outlets and IT devices
• Open, interoperable with other systems
– Data is portable via standard protocols
• Easy to deploy, maintain, use
• Considerations for monitoring both power and temperature
• Software to collect, trend, report data
– Sampling/polling frequency
– Measurement period
– Forward looking considerations, e.g., CO2 footprint, bill back
Sine wave vs. wave with
harmonic distortion

10
What to do with the data gathered?
• Measure PUE and compare DC efficiency against peers
• Find stranded power and optimize existing power capacity vs. nameplate
• Temperature Deltas
• Increase room temperature to reduce electricity costs
• Bill-back by metering kwh to drive behavior
• Monitor carbon footprint, prepare for carbon trading
• Improve manageability of DC, and make smarter decisions
11
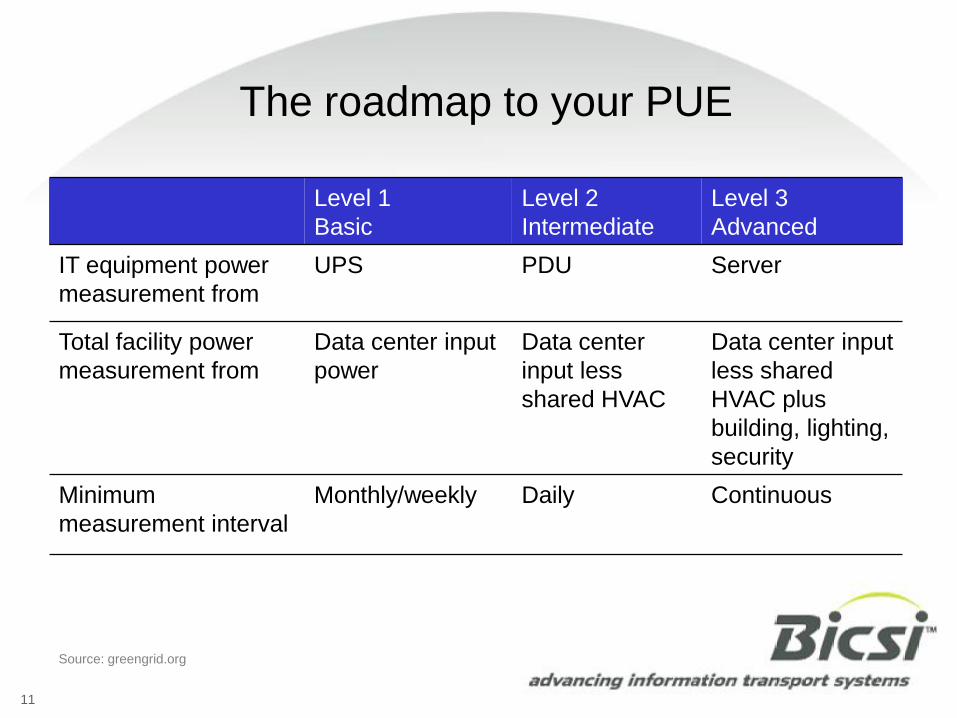
The roadmap to your PUE
Level 1
Basic
Level 2
Intermediate
Level 3
Advanced
IT equipment power
measurement from
UPS PDU Server
Total facility power
measurement from
Data center input
power
Data center
input less
shared HVAC
Data center input
less shared
HVAC plus
building, lighting,
security
Minimum
measurement interval
Monthly/weekly Daily Continuous
Source: greengrid.org

12
Intelligent rack PDUs – new options to
measure at the rack for Infrastructure and IT
Optimization
• What can be done with latest intelligent rack power
strips?
– Outlet-level metering to measure device
– PDU-level metering to measure circuit
– Temp/Humidity sensors to measure rack
environment
– Thresholds, alerting and notifications
– Trending and reporting over time
– Remote switching via IP
– Standards-based protocols offer easy
integration to existing systems
– Secure Integration with IT Management
Systems
13
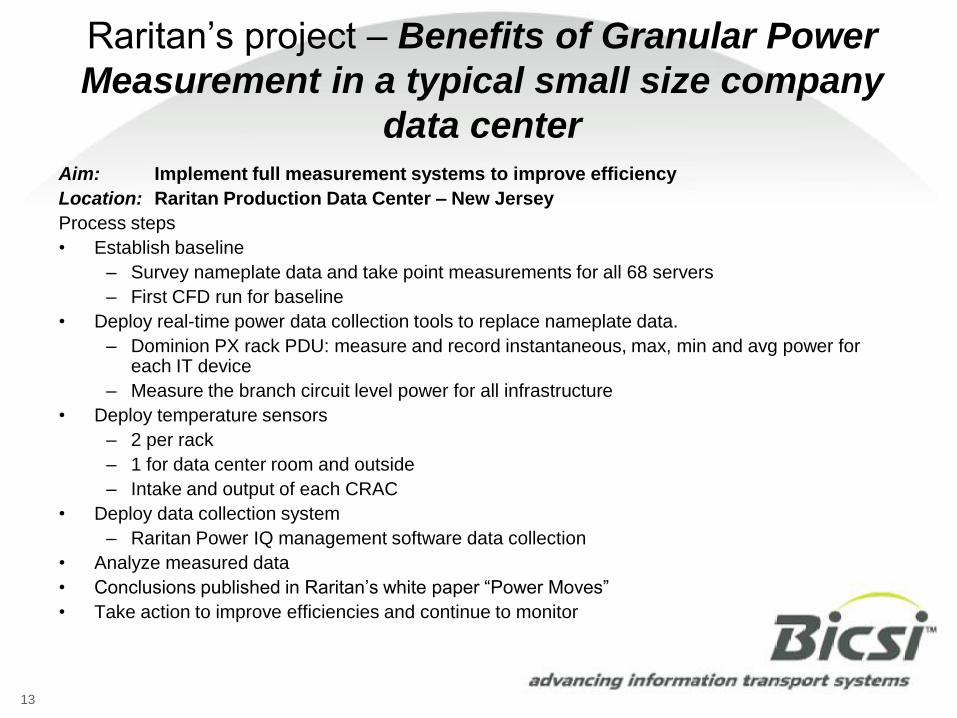
Raritan’s project – Benefits of Granular Power
Measurement in a typical small size company
data centerAim: Implement full measurement systems to improve efficiency
Location: Raritan Production Data Center – New Jersey
Process steps
• Establish baseline
– Survey nameplate data and take point measurements for all 68 servers
– First CFD run for baseline
• Deploy real-time power data collection tools to replace nameplate data.
– Dominion PX rack PDU: measure and record instantaneous, max, min and avg power for each IT device
– Measure the branch circuit level power for all infrastructure
• Deploy temperature sensors
– 2 per rack
– 1 for data center room and outside
– Intake and output of each CRAC
• Deploy data collection system
– Raritan Power IQ management software data collection
• Analyze measured data
• Conclusions published in Raritan’s white paper “Power Moves”
• Take action to improve efficiencies and continue to monitor

14
What we found……Calculating Raritan’s PUE
• 71% of the total average
power consumption was
used for critical IT equipment
– 55 percent for servers
alone
• 29% for support services like
cooling and lighting
• Total Power = Support
Infrastructure (5.625 kw) +
Critical Load (13.68 kw) =
19.3 kw
• Raritan PUE = 1.4
• DCiE= 71%( 1/PUE)
15
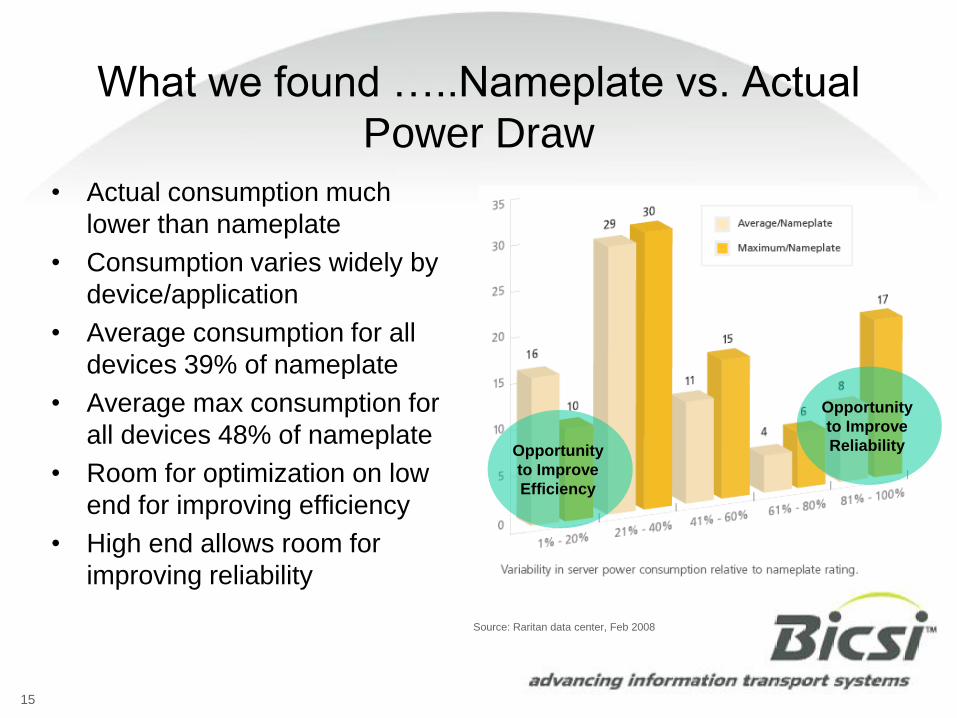
What we found …..Nameplate vs. Actual
Power Draw
• Actual consumption much
lower than nameplate
• Consumption varies widely by
device/application
• Average consumption for all
devices 39% of nameplate
• Average max consumption for
all devices 48% of nameplate
• Room for optimization on low
end for improving efficiency
• High end allows room for
improving reliability
Opportunity
to Improve
Efficiency
Opportunity
to Improve
Reliability
Source: Raritan data center, Feb 2008
16
Analysis and lessons…
• The spread between nameplate and actual emphasizes the need to
measure and not wholly rely on de-rated averages.
• We now understand our power use patterns over time – day/month and
ultimately season
• Our PUE was better than we dared assume = 1.4 = 19.3KW/13.7KW?
– Small business sweating the assets – cooling not over engineered!
– Smaller Rooms engineered to fit – limited expansion planned for
• We don’t need to add more servers!
– Found 45 low utilized or idle devices for possible consolidation/VM
• We can improve utilization of existing power
– Average load of all equipment was 38% vs. nameplate
• We found 8 devices running above 80% of nameplate which we should
investigate to improve reliability and reduce risk
• We had a baseline from which to compare and optimize
17
Actions Taken…
Increased computer room thermostat temperature from 20°C to 23°C.
• Implemented a virtualization project. Removed 7 servers from the IT
environment (7 of 68)
• Participation in the U.S. Environmental Protection Agency (EPA)
ENERGY STAR® study by providing our data on a monthly basis.
• Achieved an 8% saving in total power
The Green Grid is assisting the U.S. Environmental Protection
Agency (EPA) in developing an ENERGY STAR® rating for data center
infrastructure. The EPA is collecting data on energy use and operating
characteristics from a large number of existing data centers, including
both stand-alone facilities and those located in offices and other
building types. The collection of sufficient data from data center
operators is critical to the development of an ENERGY STAR® rating
for data center infrastructure.
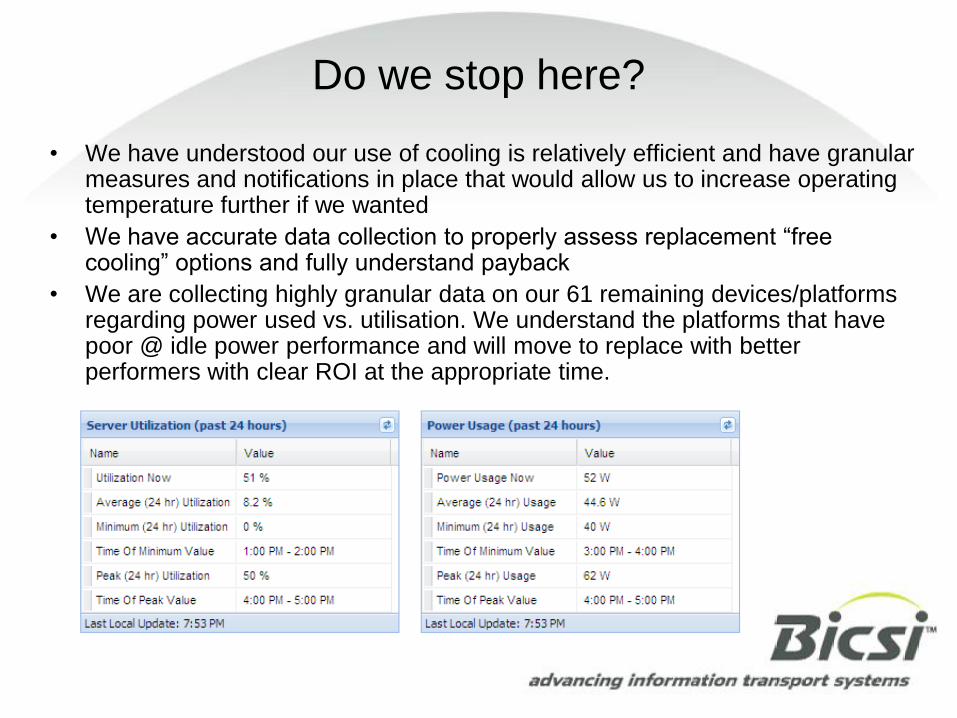
Do we stop here?
• We have understood our use of cooling is relatively efficient and have granular measures and notifications in place that would allow us to increase operating temperature further if we wanted
• We have accurate data collection to properly assess replacement “free cooling” options and fully understand payback
• We are collecting highly granular data on our 61 remaining devices/platforms regarding power used vs. utilisation. We understand the platforms that have poor @ idle power performance and will move to replace with better performers with clear ROI at the appropriate time.

Thank You